Embed Size (px)
Citation preview

Earnings ResultsSecond Quarter 2020
July 30, 2020

Cautionary Language
2
Various statements in this presentation, including those that express a belief, expectation or intention, may be considered forward-looking statements (as defined in Section 21E of the Securities Exchange Act of 1934, as amended, and
Section 27A of the Securities Act) that involve risks and uncertainties that could cause actual results to differ materially from projected results. Without limiting the generality of the foregoing, forward-looking statements contained in this
communication include statements relying on a number of assumptions concerning future events and are subject to a number of uncertainties and factors, many of which are outside the control of CNX and CNX Midstream, which could
cause actual results to differ materially from such statements. Accordingly, investors should not place undue reliance on forward-looking statements as a prediction of actual results. The forward-looking statements may include, but are
not limited to, statements regarding the expected benefits of the proposed transaction to CNX and CNX Midstream and their stockholders and unitholders, respectively; the anticipated completion of the proposed transaction and the
timing thereof; the expectation that CNX votes the CNXM common units that it owns in favor of the proposed transaction; the expected future growth, dividends and distributions of the combined company; and plans and objectives of
management for future operations. When we use the words “believe,” “intend,” “expect,” “may,” “should,” “anticipate,” “could,” “estimate,” “plan,” “predict,” “project,” or their negatives, or other similar expressions, the statements which
include those words are usually forward-looking statements. When we describe strategy that involves risks or uncertainties, we are making forward-looking statements.
While CNX and CNX Midstream believe that the assumptions concerning future events are reasonable, they caution that there are inherent difficulties in predicting certain important factors that could impact the future performance or
results of their businesses. Among the factors that could cause results to differ materially from those indicated by such forward-looking statements are: the failure to realize the anticipated costs savings, synergies and other benefits of the
transaction; the possible diversion of management time on transaction-related issues; the risk that the requisite approvals to complete the transaction are not obtained; local, regional and national economic conditions and the impact they
may have on CNX, CNX Midstream and their customers; changes in tax laws that impact master limited partnerships; conditions in the oil and gas industry, including a sustained decrease in the level of supply or demand for oil or natural
gas or a sustained decrease in the price of oil or natural gas; the financial condition of CNX’s or CNX Midstream’s customers; any non-performance by customers of their contractual obligations; changes in customer, employee or supplier
relationships resulting from the transaction; changes in safety, health, environmental and other regulations; the results of any reviews, investigations or other proceedings by government authorities; and the performance of CNX
Midstream.
The forward-looking statements in this presentation speak only as of the date of this presentation; we disclaim any obligation to update these statements. We have based these forward-looking statements on our current expectations and
assumptions about future events. While our management considers these expectations and assumptions to be reasonable, they are inherently subject to significant business, economic, competitive, regulatory and other risks,
contingencies and uncertainties, most of which are difficult to predict and many of which are beyond our control. These risks, contingencies and uncertainties relate to, among other matters, the risks and uncertainties set forth in the “Risk
Factors” section of CNX’s Annual Report on Form 10-K for the year ended December 31, 2019, and Quarterly Report on Form 10-Q for the three months ended March 31, 2020, each filed with the Securities and Exchange Commission
(SEC), and any subsequent reports filed with the SEC.
Currently, the SEC permits oil and gas companies, in their filings with the SEC, to disclose only proved, probable and possible oil and gas reserves that a company anticipates as of a given date to be economically and legally producible
and deliverable by application of development projects to known accumulations. We may use certain terms in this presentation, such as EUR (estimated ultimate recovery), that the SEC’s rules strictly prohibit us from including in filings
with the SEC. We caution you that the SEC views such estimates as inherently unreliable and these estimates may be misleading to investors unless the investor is an expert in the natural gas industry. These measures are by their
nature more speculative than estimates of reserves prepared in accordance with SEC definitions and guidelines and accordingly are less certain.
No Offer or Solicitation. This presentation is for informational purposes only and shall not constitute an offer to sell or the solicitation of an offer to buy any securities pursuant to the transaction or otherwise, nor shall there be any sale of
securities in any jurisdiction in which the offer, solicitation or sale would be unlawful prior to the registration or qualification under the securities laws of any such jurisdiction. No offer of securities shall be made except by means of a
prospectus meeting the requirements of Section 10 of the Securities Act of 1933, as amended.
Important Additional Information Regarding the Transaction Will Be Filed With the SEC. In connection with the proposed transaction, CNX will file a registration statement on Form S-4, including a consent statement/prospectus of CNX
and CNX Midstream, with the SEC. INVESTORS AND SECURITY HOLDERS OF CNX AND CNX MIDSTREAM ARE ADVISED TO CAREFULLY READ THE REGISTRATION STATEMENT AND CONSENT
STATEMENT/PROSPECTUS (INCLUDING ALL AMENDMENTS AND SUPPLEMENTS THERETO) WHEN THEY BECOME AVAILABLE BECAUSE THEY WILL CONTAIN IMPORTANT INFORMATION ABOUT THE TRANSACTION,
THE PARTIES TO THE TRANSACTION AND THE RISKS ASSOCIATED WITH THE TRANSACTION. A consent statement/prospectus will be sent to security holders of CNX Midstream in connection with the solicitation of consents
from CNX Midstream unitholders. Investors and security holders may obtain a free copy of the consent statement/prospectus (when available) and other relevant documents filed by CNX and CNX Midstream with the SEC from the SEC’s
website at www.sec.gov. Security holders and other interested parties will also be able to obtain, without charge, a copy of the consent statement/prospectus and other relevant documents (when available) from www.cnx.com under the
tab “Investor Relations” and then under the heading “SEC Filings.”
Participants in the Solicitation. CNX, CNX Midstream and their respective directors, executive officers and certain other members of management may be deemed to be participants in the solicitation of consents in respect of the
proposed transaction. Information about these persons is set forth in CNX’s proxy statement relating to its 2020 Annual Meet ing of Stockholders, which was filed with the SEC on March 24, 2020, and CNX Midstream’s Annual Report on
Form 10-K and Form 10-K/A for the year ended December 31, 2019, which were filed with the SEC on February 10, 2020 and April 27, 2020, respectively, and subsequent statements of changes in beneficial ownership on file with the
SEC. Security holders and investors may obtain additional information regarding the interests of such persons, which may be different than those of the respective companies’ security holders generally, by reading the consent
statement/prospectus and other relevant documents regarding the transaction, which will be filed with the SEC.

The CNX Philosophy and Approach to Making Decisions
3
CNX built a plan that consistently delivers substantial FCF year in and year out for the next seven years,
and current allocation of the FCF will focus on debt paydown
Our Approach:
1. We optimize long term intrinsic value per share above all else
2. The best metric for optimizing intrinsic value per share is free cash flow (FCF); maximizing free cash flow strengthens the balance
sheet, allows for opportunistic capital allocation, and protects us from the downside
3. The assumptions for the ‘uncontrollables’ applied when calculating internal rates of return (IRRs) have changed drastically; we live
in reality, and so we adjust the ‘controllables’ accordingly
4. The best way we optimize intrinsic value per share is to be a great capital allocator who follows
risk-adjusted IRRs
5. IRR math dictates where we allocate consolidated FCF; in today’s environment, opportunistic debt paydown across various
tranches of the debt stack is compelling

The Lowest Cost E&P
Company
Low Capital Intensity
Strong Balance Sheet
Substantial Free Cash
Flow(1)
6 Reasons Why CNX is a Non-Replicable Best-In-Class E&P
4
▪ Production cash costs lowest in basin and declining over time
▪ Fully burdened cash costs expected to drop significantly over time
▪ Cost position drives basin leading cash margins
▪ >$3 billion in FCF(1) over 7-year plan
▪ Best-in-class FCF yield each year of 7-year plan
▪ CNXM transaction enhances cumulative FCF
▪ Reduced cost of capital and total flexibility on capital allocation
▪ Substantial equity upside based on equity share of EV and/or cash flow yield
▪ CNX should command an M&A premium
▪ Projections use conservative, low NYMEX forward gas price assumptions
▪ Programmatic hedges de-risk revenues
▪ Deep core inventory extends well beyond 7-year plan period
▪ Less than 1.5x leverage ratio in early 2023
▪ Debt free in 2025 under current plan
▪ Interest cash costs decline materially
Low-Risk Business Model
▪ Current F&D costs half of historical D&C DD&A
▪ Non-D&C capital (Midstream, Land, and Water) significantly reduced
▪ Low base decline rates of maintenance of production plan drives low capital
Growing Intrinsic Value
per Share
2
3
6
1
4
5
(1) Non-GAAP measures. See appendix for definition.

Track Record of Success
CNX has been a first
mover in basin and
gone against
industry norms, e.g.
hedged when others
weren’t; no large
new expensive FT
contracts; first to
streamline
overhead; first LT
contract for electric
frac, etc…
5
▪ Implemented
Programmatic
Hedging Program
▪ No meaningful
contracts on new
expensive FT projects
▪ Authorized Share
buyback program
2017
▪ Constructed critical
water infrastructure
projects to drive water
efficiencies for years
to come
▪ Bought back 19% of
shares outstanding
since inception
▪ Streamlined G&A
2019
▪ First-in-basin for long-
term agreement with
Evolution all-electric
frac fleet
▪ Bought back 14% of
shares outstanding
since inception
2018
▪ Substantially reduced
debt and addressed
near-term maturities
▪ Acquiring all of the
outstanding publicly-
owned units of CNXM
2020

1
2
2017 2018 2019 2020E
Drilli
ng D
ays/1
,0000 f
t
0.5
0.7
0.9
1.1
2017 2018 2019 2020E
Fra
c D
ays
/1,0
000 f
t
Drilling and Completion Improvements Driving Capital Efficiencies
6
SWPA Marcellus Drilling Efficiencies SWPA Marcellus Completions Efficiencies
Most Recent
Well Results:
SWPA Marcellus:
$720/ft
SWPA Utica:
$1,375/ft
SHR/PEN
Marcellus:
$680/ft

Most Recent CPA Dry Utica Well Producing Above Type Curve
7
CPA Dry Utica Results
Increased EUR for Bell Point 6
Utica well to range of 4.5–5.0 Bcfe
per 1,000’,
Most productive Utica well to date
▪ ~20 years of Utica inventory in CPA region
▪ IRRs are competitive with SWPA Marcellus
▪ Strong, consistent, and repeatable performance
(1) Daily Production Normalized to 7,000’.
0
5
10
15
20
25
30
35
40
45
50
0 100 200 300 400 500 600 700
Daily
Pro
duction (
MM
cf)
Days
BP6 AIKENS5J AIKENS5M GAUT4 CPA Dry Utica Type Curve
2019
Land $0.10
Gathering/Water Infrastructure $0.07
Well (D&C, Water, Pad/Facilities) $0.68
Well Closing Liability $0.02
Total DD&A Rate $0.87
8
8
Current F&D At Much Higher Capital Efficiency Than Historical D&C DD&A
Average $/Ft $1,618 $1,386 $1,031 $1,024 $830 $750
Average Lateral 4,000 7,700 8,340 9,360 12,000 12,000
Average EUR/1,000’
(NRI to CNX)1.34 1.84 2.15 2.24 2.4 2.4
TIL Count 143 100 47 41 34
Marcellus Well Cost ($/Mcfe) $1.20 $0.75 $0.48 $0.47 $0.35 $0.30
$0.00
$0.20
$0.40
$0.60
$0.80
$1.00
$1.20
2013 & Prior 2014-2017 2018 2019 2020E 2021E-2026E
Marcellus Well Cost $ per McfeDD&A ($ / Mcfe)
Significant historical
Marcellus F&D
improvement
Marcellus F&D expected
to be $0.30 per Mcfe in
long-term plan
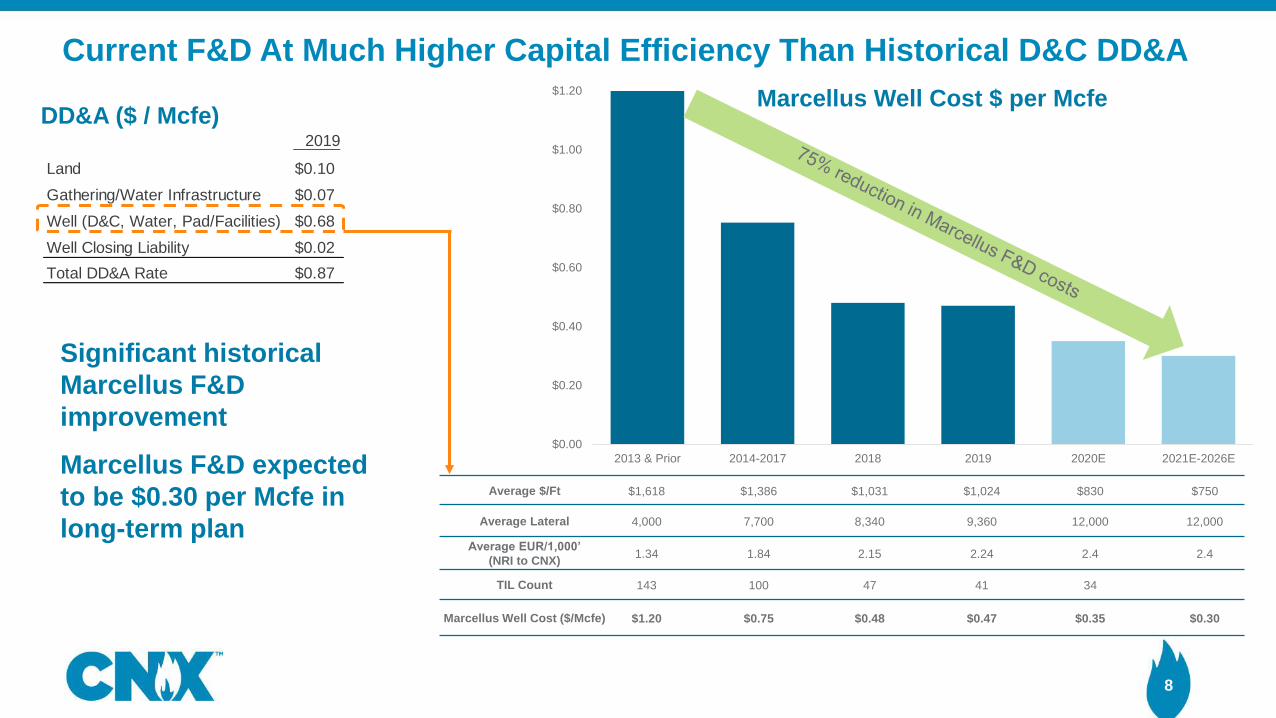
$0.73 $0.77
$1.14
$1.26
$1.36
$1.61
$2.12
$-
$0.75
$1.50
$2.25
CNX Peer 6 Peer 5 Peer 2 Peer 3 Peer 4 Peer 1
Lease Operating Expense ($/Mcfe) Production, Ad Valorem, and Other Fees ($/Mcfe) Transportation, Gathering and Compression - E&P ($/Mcfe)
Best-In-Class Production Cash Costs
9
(1) Trailing twelve months (TTM) includes forecasted Q2 2020 end for CNX and TTM as of Q1 2020 for peers. Peers include AR, COG, EQT, GPOR, RRC, SWN. For
peers that net transportation costs from revenue, $0.35 per Mcfe has been added to Transportation, Gathering and Compression to estimate total production costs.
TTM Production Cash Costs per Mcfe(1)
The CNXM
transaction
lowered
CNX’s
production
cash costs by
~$0.40
per Mcfe

$0.14 $0.14 $0.12 $0.12 $0.13 $0.14 $0.16
$0.57 $0.54$0.52 $0.50
$0.53$0.58 $0.57
$0.17$0.13
$0.13$0.13
$0.12
$0.12 $0.12
$0.34
$0.20
$0.16$0.12 $0.08
$0.01 $0.00
$1.22
$1.01
$0.93
$0.87 $0.86 $0.86 $0.85
$0.00
$0.20
$0.40
$0.60
$0.80
$1.00
$1.20
$1.40
2020E 2021E 2022E 2023E 2024E 2025E 2026E
$/M
cfe
2020E-2026E Fully Burdened Costs
LOE & Taxes Transportation, Gathering and Compression Cash SG&A Other Corporate Costs & Income
Fully Burdened Cash Costs Under $0.90 Per Mcfe
10
2020E-2026E Average Prices
$/MMBtu
NYMEX $2.40
In Basin Price $1.95
CNX Realized Price ($/Mcfe) $2.38
BTU Conversion (MMBtu/Mcf) 1.079
2020E-2026E Average Production Cash Costs
(LOE, Taxes, Transportation, Gathering, and
Compression) of $0.68/Mcfe
Includes Interest, Unused FT and Processing,
Idle Rig Fees, Other Cash Income (Expense),
less 3rd Party Gathering and Other Operating
Revenues.

63%
29%
17%
10%
0% 0% 0%
$2.85
$2.48
$2.37$2.35
$ 2.00
$ 2.10
$ 2.20
$ 2.30
$ 2.40
$ 2.50
$ 2.60
$ 2.70
$ 2.80
$ 2.90
$ 3.00
0 %
20 %
40 %
60 %
CNX Peer 1 Peer 3 Peer 2 Peer 4 Peer 5 Peer 6
% o
f C
on
se
ns
us
Pro
d.
He
dg
ed
2022 % of Production Hedged 2022 Average NYMEX Price Floor
Pri
ce
Flo
or
104%
87%
49%
37%
26%
18%
0%
$2.80
$2.94
$2.48$2.49
$2.46
$2.36
$ 2.00
$ 2.10
$ 2.20
$ 2.30
$ 2.40
$ 2.50
$ 2.60
$ 2.70
$ 2.80
$ 2.90
$ 3.00
0 %
20 %
40 %
60 %
80 %
100 %
Peer 1 CNX Peer 3 Peer 2 Peer 5 Peer 4 Peer 6
% o
f C
on
se
ns
us
Pro
d.
He
dg
ed
2021 % of Production Hedged 2021 Average NYMEX Price Floor
Pri
ce
Flo
or
Best Downside Protection in the E&P Space
Note: Peers include AR, COG, EQT, GPOR, RRC, SWN. As of Q1 2020 for CNX and as of Q4 2019 for peers. NYMEX as of 7/8/2020. CNX hedge price per Mcf and per
MMBtu for peers.
(1) Based on Bloomberg consensus estimates for 2021E and 2022E annual gas production. CNX 2021 % of production hedged based on company estimate of dry gas
production. CNX 2022-2024 % of gas production hedged based on flat production scenario with 2021.11
2021E(1) Hedged Gas Production 2022E(1) Hedged Gas Production
~38% of 2023(1) production
hedged under maintenance
scenario at $2.81 NYMEX
vs.
~1% for peers at $2.40
NYMEXNYMEX Strip $2.64 in 2021
~34% of 2024(1) production
hedged under maintenance
scenario at $2.90 NYMEX
vs.
~0% for peers
NYMEX Strip $2.46 in 2022

0
200
400
600
800
1,000
1,200
1,400
1,600
1,800
Jul-20 Dec-20
MM
cf
/ d
Flexibility to Modify Production Profile to Capture Higher Prices
12
CNX shut in certain wells in May 2020
due to pricing contango
CNX has the flexibility to modify its
production profile allowing company
to save some production to sell
during significantly higher prices this
winter and next year
Not all producers have this flexibility
due to low volumes hedged, high
leverage, and/or high operating costs
Expected Daily Production
Flowing Now December 2020
Note: Forward market price is as of 7/8/2020.
NYMEX ($/MMBtu) $1.50 $2.57
Winter (November/December 2020) prices are $1.07
per MMBtu higher than July 2020 prices
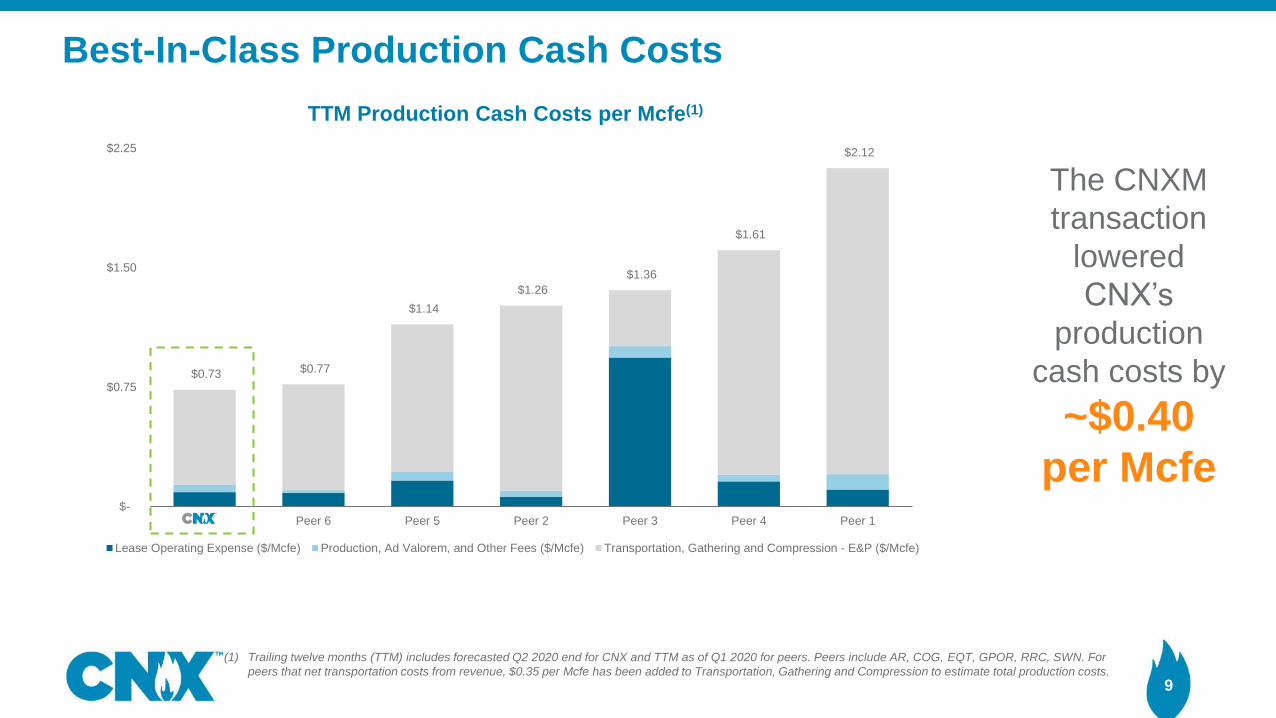
Q2 2020 Activity Summary
13
(1) Measured in lateral feet from perforation to perforation.
Q2 2020
($ in millions) TD FRAC TIL
Average
Lateral
Length(1)
Rigs at
Period
End
SWPA
Central
Marcellus 7 8 6 8,560 1
Utica 1 - - - -
WV
Shirley-Penns
Marcellus - - - - -
Utica - - - - -
CPA South Utica - - - - -
OH Dry Utica - 3 - - -
Total 8 11 6 1
Expect to run 1 rig and 1 frac crew in 2021

14
Note: Long-term debt principal amounts only, excludes premiums, discounts, and debt issuance costs.
(1) Non-GAAP measures. See appendix for definition.
(2) Net of capped call transaction, which cost approximately $35.7 million.
Consolidated
Debt Maturities
PF FCF(1)
Cumulative PF
FCF
$ in millions
A Balance Sheet Strengthening Convertible Notes Offering
$550 $345
$671
$319
$400 $414
$869 $745
$671
2020 2021 2022 2023 2024 2025 2026 2027 and Thereafter
Midstream Debt
E&P Debt
Senior Unsecured / Non-callable for 3.5 years
Total Issuance $345MM
Net Proceeds $299.0MM(2)
Maturity May 1, 2026
Coupon 2.25%
Conversion Premium / Share
Price20% / $12.84
Effective Conversion Premium
/ Share Price70% / $18.19
▪ Opportunistically issued convertible notes on April 28, 2020
▪ Continued to de-risk balance sheet by further eliminating refinancing risk
associated with 2022 Notes maturity
‒ Proceeds utilized to pay down 2022 Notes
‒ Annual interest rate savings of over $12.5MM
▪ Strong investor demand drove favorable interest rate and execution of greenshoe

Note: See appendix for Non-GAAP definition.
(1) Forward market prices are as of 7/8/2020.
(2) Includes ~$50M in expected asset sales in 2020 and 2021. 15
Previous UPDATED
2020E 2020ECapital Expenditures($ millions)
Low High Low High
Drilling & Completions $330 $380 $330 $380
Non-D&C $140 $170 $140 $170
PF Total Capital $470 $550 $470 $550
Production Volumes (Bcfe) 490 530 490 530
Prices on Open Volumes
Natural Gas NYMEX ($/MMBtu)(1) $2.16 $1.94
Natural Gas Basis Differential ($/MMBtu)(1) ($0.25)-($0.35) ($0.20)-($0.30)
NGL Realized Price ($/Bbl)(1) $8.00-$10.00 $12.50-$14.50
Adjusted EBITDAX ($ millions)
Consolidated $830 $900 $830 $900
Free Cash Flow (FCF) ($ millions)
Consolidated FCF(2) ~$300 ~$300
Started deferring volumes on May 1, 2020
Plan to turn wells back online November 1, driving
production volumes towards low end of guidance range
CNX PF 2021 FCF(2) expected to be ~$425 million
Updated 2020 Guidance

PF Free Cash Flow(1) $300 $425 $515 $515 $515 $515 $515
FCF / Share(1) $1.34 $1.89 $2.29 $2.29 $2.29 $2.29 $2.29
CNX Share Price as of 7/17/2020 $8.69 $8.69 $8.69 $8.69 $8.69 $8.69 $8.69
FCF / Share / 7/17/2020 Share Price = FCF Yield(2) 15% 22% 26% 26% 26% 26% 26%
0%
5%
10%
15%
20%
25%
30%
$0
$500
$1,000
$1,500
$2,000
$2,500
$3,000
$3,500
2020E 2021E 2022E 2023E 2024E 2025E 2026E
Fre
e C
ash F
low
Yie
ld
$ in m
illio
ns
Cumulative Free Cash Flow FCF Yield at Current Share Price
16
Cumulative Free Cash Flow(1) 2020E-2026E
>$3 billion of cumulative FCF over 7-year plan
(1)
CNX Pro Forma Market Cap
(2)
CNX Pro Forma Debt
Note: NYMEX as of 7/8/2020.
(1) Non-GAAP measures. See appendix for definition.
(2) Free Cash Flow Yield is a non-GAAP measure and defined as (Operating Cash flow – Capex) / Current Market Capitalization. Based on 224.5 million shares
outstanding pro forma for the transaction. Share price as of 7/17/2020.
Substantial Cumulative Free Cash Flow and Yield

17
Flexibility in how we allocate capital
Average annual go forward FCF of ~$500 million assuming current $2.40 NYMEX
Lowest cost Appalachian E&P
Non-replicable business model: Midstream, NRIs, water assets, hedge book, balance sheet, etc…
Safety in paying down debt to increase equity value
Immense upside in normal or high gas price environment
17
Why Invest in the “New” CNX?
Market disconnect provides tremendous opportunity
Valuation not reflective of M&A attractiveness to peers who need to de-lever and de-risk their businesses

Appendix

CNX Overview
19
Total Net Shale Acres >1.1 million
Total Marcellus Net Acres 519,300Net Undeveloped Marcellus
Locations in SWPA 328
Total Utica Net Acres 608,300Net Undeveloped Utica
Locations in CPA 439
2020E Total Production 490-530 Bcfe
Q2 2020 Liquidity >$1.4 billion
NYSE Ticker CNX
Corporate Office Canonsburg, PA
Note: As of year-end 2019 as identified in 2019 10-K filed February 10, 2020.
Locations calculated by dividing total controlled acreage in type curve region divided by area of a well. Lateral length and inter-lateral spacing assumption in appendix.
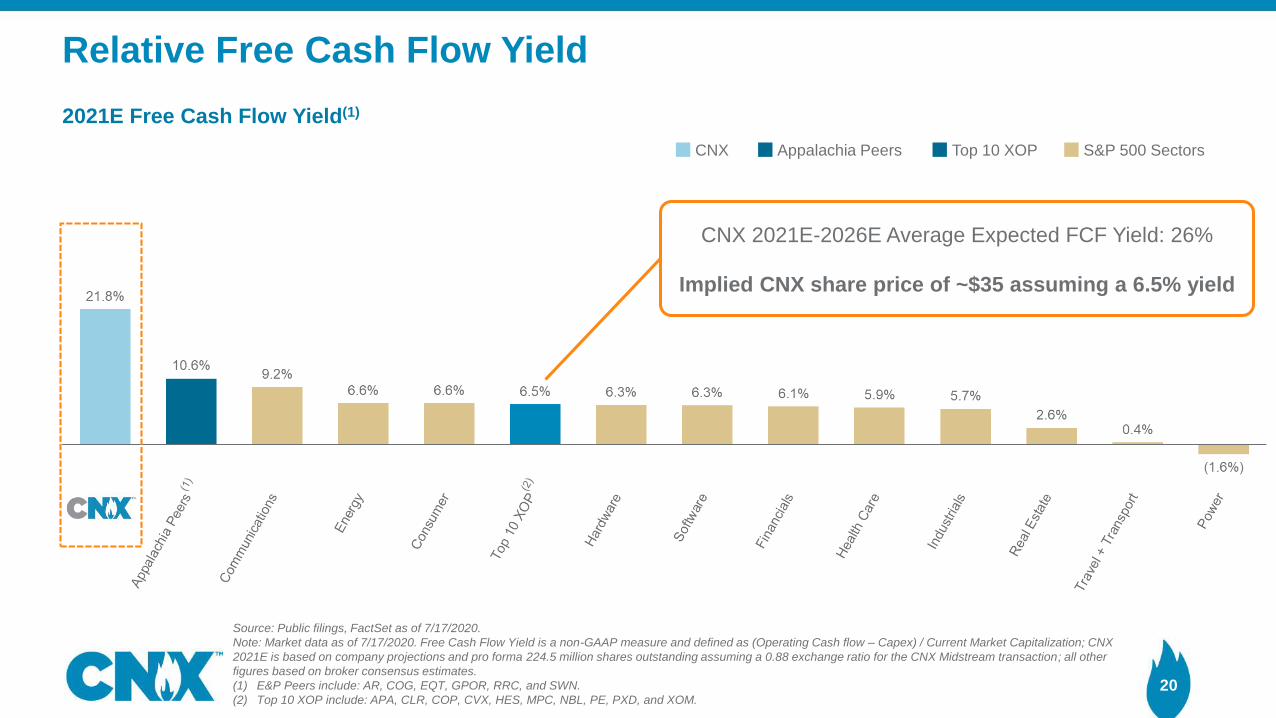
20
Source: Public filings, FactSet as of 7/17/2020.
Note: Market data as of 7/17/2020. Free Cash Flow Yield is a non-GAAP measure and defined as (Operating Cash flow – Capex) / Current Market Capitalization; CNX
2021E is based on company projections and pro forma 224.5 million shares outstanding assuming a 0.88 exchange ratio for the CNX Midstream transaction; all other
figures based on broker consensus estimates.
(1) E&P Peers include: AR, COG, EQT, GPOR, RRC, and SWN.
(2) Top 10 XOP include: APA, CLR, COP, CVX, HES, MPC, NBL, PE, PXD, and XOM.
2021E Free Cash Flow Yield(1)
CNX Appalachia Peers Top 10 XOP S&P 500 Sectors
CNX 2021E-2026E Average Expected FCF Yield: 26%
Implied CNX share price of ~$35 assuming a 6.5% yield
Relative Free Cash Flow Yield

Q2 2020 Financial Results Summary
21
Note: The Non-GAAP financial measures in the tables above are defined and reconciled to GAAP net income in the appendix under "Non-GAAP Reconciliation."
(1) Capital expenditures exclude $14 million and $103 million of total capital investment net to CNXM in the second quarter of 2020 and 2019, respectively, as reported in
CNXM Second Quarter Results.
(2) See the "Price and Cost Data Per Mcfe" in the appendix for a reconciliation to total Production Costs.
(3) Fully burdened cash costs include production cash costs, selling, general and administrative (SG&A) cash costs, other operating cash expense, other cash (income)
expense, and interest expense. Q2 2020 and Q2 2019 total fully burdened cash costs exclude a gain on asset sales of $0.07 per Mcfe and $0.00 per Mcfe, respectively.
Q2 2020 and Q2 2019 also excludes unrealized losses on interest rate swaps of $0.05 per Mcfe and $0.00 per Mcfe, respectively.
Strong operating cash
margins despite weaker gas
prices vs. last year
Quarter
Ended
Quarter
Ended
Quarter
Ended
Quarter
Ended
June 30, June 30, June 30, June 30,
2020 2019 2020 2019
($ in millions, except per share data) Stand-alone% Increase/
(Decrease)Consolidated
% Increase/
(Decrease)
Adjusted Net (Loss) Income ($7) $12 -158.3% $24 $57 -57.9%
Adjusted EBITDAX $166 $175 -5.1% $212 $222 -4.5%
Capital Expenditures(1)
$121 $226 -46.5% $135 $329 -59.0%
Quarter
Ended
Quarter
Ended
June 30, June 30,
(Per Mcfe) 2020 2019
Average Sales Price - Total Company $2.52 $2.63
Total Production Cash Costs(2)
$1.05 $1.18
Operating Cash Margin $1.47 $1.45
Operating Cash Margin (%) 58% 55%
Total Fully Burdened Cash Costs(3)
$1.75 $1.70
Fully Burdened Cash Margin $0.77 $0.93
Fully Burdened Cash Margin (%) 31% 35%
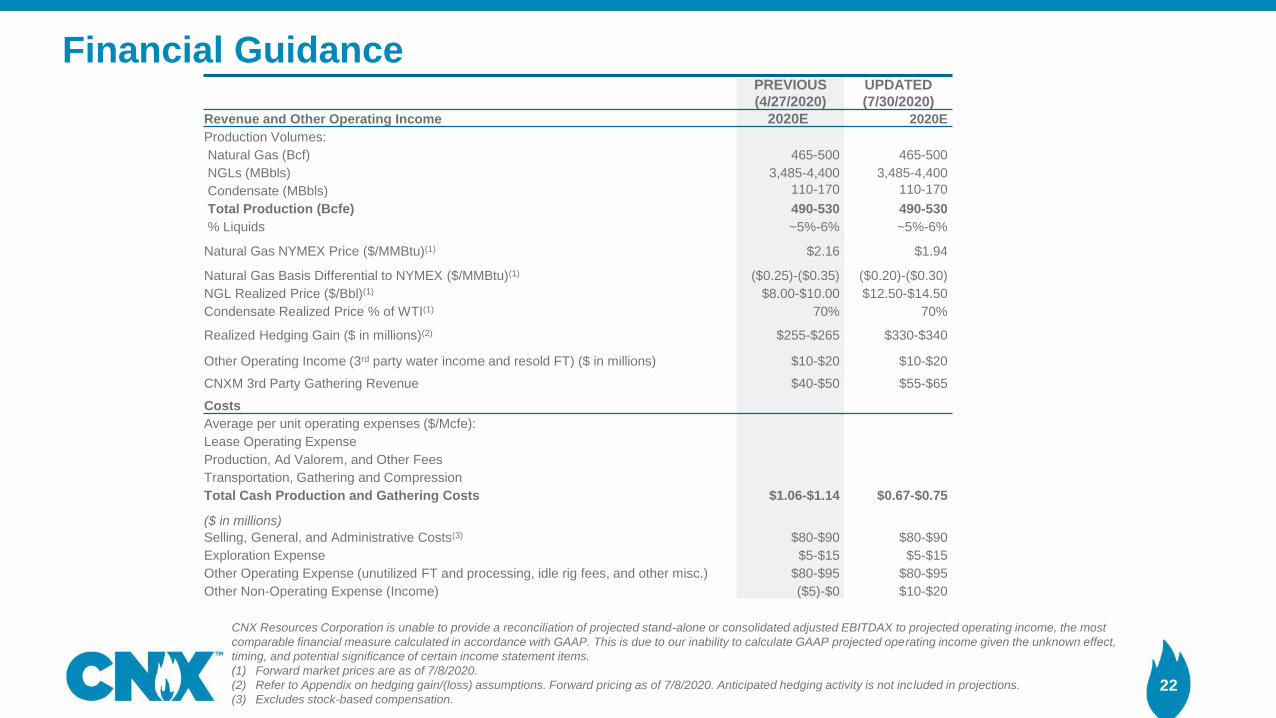
Financial Guidance
22
PREVIOUS
(4/27/2020)
UPDATED
(7/30/2020)
Revenue and Other Operating Income 2020E 2020E
Production Volumes:
Natural Gas (Bcf) 465-500 465-500
NGLs (MBbls) 3,485-4,400 3,485-4,400
Condensate (MBbls) 110-170 110-170
Total Production (Bcfe) 490-530 490-530
% Liquids ~5%-6% ~5%-6%
Natural Gas NYMEX Price ($/MMBtu)(1) $2.16 $1.94
Natural Gas Basis Differential to NYMEX ($/MMBtu)(1) ($0.25)-($0.35) ($0.20)-($0.30)
NGL Realized Price ($/Bbl)(1) $8.00-$10.00 $12.50-$14.50
Condensate Realized Price % of WTI(1) 70% 70%
Realized Hedging Gain ($ in millions)(2) $255-$265 $330-$340
Other Operating Income (3rd party water income and resold FT) ($ in millions) $10-$20 $10-$20
CNXM 3rd Party Gathering Revenue $40-$50 $55-$65
Costs
Average per unit operating expenses ($/Mcfe):
Lease Operating Expense
Production, Ad Valorem, and Other Fees
Transportation, Gathering and Compression
Total Cash Production and Gathering Costs $1.06-$1.14 $0.67-$0.75
($ in millions)
Selling, General, and Administrative Costs(3) $80-$90 $80-$90
Exploration Expense $5-$15 $5-$15
Other Operating Expense (unutilized FT and processing, idle rig fees, and other misc.) $80-$95 $80-$95
Other Non-Operating Expense (Income) ($5)-$0 $10-$20
CNX Resources Corporation is unable to provide a reconciliation of projected stand-alone or consolidated adjusted EBITDAX to projected operating income, the most
comparable financial measure calculated in accordance with GAAP. This is due to our inability to calculate GAAP projected operating income given the unknown effect,
timing, and potential significance of certain income statement items.
(1) Forward market prices are as of 7/8/2020.
(2) Refer to Appendix on hedging gain/(loss) assumptions. Forward pricing as of 7/8/2020. Anticipated hedging activity is not included in projections.
(3) Excludes stock-based compensation.

10%
15%
20%
25%
30%
35%
40%
0
0.2
0.4
0.6
0.8
1
1.2
1.4
1.6
1.8
2019 2020E 2021E 2022E 2023E 2024E 2025E 2026E
PDP Base Rolling PDP Adds Annual TIL Volumes Base Decline
Low Base Decline Rate Drives Low Capital Intensity
23
Capital plan
2022E - 2026E (annual avg.)
TIL Count ~25
Net production (Bcfe) ~560
Capital Expenditures ($ in millions)
Drilling & Completion ~$230
Non-D&C ~$70
PF Total Capital ~$300
PDP Base
Illustrative Example of PDP/TIL Build Overtime
As PDPs build over time, base decline shallows to
average ~20% in 2022E-2026E
Fewer TILs required to keep production flat Y-o-Y

459.7 435.9
285.9
170.3 156.4
0
50
100
150
200
250
300
350
400
450
500
2020 2021 2022 2023 2024
Gas V
olu
mes H
edged (
Bcf)
NYMEX + Basis (2)
Natural Gas Hedging and Basis Protection
24
(2)
Hedge Volumes and Pricing Q3 2020 2020 2021 2022 2023 2024
NYMEX Hedges
Volumes (Bcf) 100.2 447.3 413.6 271.7 142.6 145.4
Average Prices ($/Mcf) $2.90 $2.94 $2.94 $2.85 $2.81 $2.90
Physical Fixed Price Sales and Index Hedges
Volumes (Bcf) 2.8 12.4 22.3 14.2 27.7 11.0
Average Prices ($/Mcf) $2.44 $2.45 $2.51 $2.61 $2.17 $2.28
Total Volumes Hedged (Bcf)(1) 103.0 459.7 435.9 285.9 170.3 156.4
NYMEX + Basis (fully-covered volumes)(2)
Volumes (Bcf) 103.0 459.7 435.9 285.9 170.3 156.4
Average Prices ($/Mcf) $2.47 $2.55 $2.46 $2.32 $2.25 $2.32
NYMEX Hedges Exposed to Basis
Volumes (Bcf) - - - - - -
Average Prices ($/Mcf) - - - - - -
Total Volumes Hedged (Bcf)(1) 103.0 459.7 435.9 285.9 170.3 156.4
NYMEX hedges added (sold) during
Q2: 43.3 Bcf (2020, 2021, 2022,
2023, 2024, and 2025)
Index hedges added (sold) during
Q2: 1.8 Bcf (2020 and 2021)
Basis hedges added during Q2:
100.9 Bcf (2020, 2021, 2022, 2023,
2024, and 2025)
Despite cashing in
$84MM of value YTD
and resetting 2022-
2024 hedges, still
maintain strong
average hedge
prices and cash flow
protection
(1) Hedge positions as of 7/8/2020. Excludes basis hedges in excess of NYMEX hedges of 2.1 Bcf, 9.5 Bcf, 18.2 Bcf, 44.2 Bcf, 26.0 Bcf, and 19.1 Bcf for Q3 2020,
2020, 2021, 2022, 2023, and 2024, respectively. Q3 2020 and 2020 exclude purchased swaps. See slide xx.
(2) Includes the impact of NYMEX and basis-only hedges as well as physical sales agreements.

25
For financial hedging, CNX utilizes over-the-counter swaps to manage its exposure to natural gas price fluctuations. Typically, CNX
“sells” swaps under which it receives a fixed price from counterparties and pays a floating market price. In order to help gain additional
flexibility to move production to higher price periods, during the second quarter of 2020, CNX purchased, rather than sold, financial
swaps for the period May through November of 2020 under which CNX will pay a fixed price to and receive a floating price from its
hedge counterparties. Swaps purchased have the effect of reducing total hedged volumes for the period of the swap.
Purchased Swaps Q3 2020 2020
NYMEX Only Hedges
Volumes (Bcf) 9.5 21.5
Average Fixed Prices ($/Mcf) $2.29 $2.18
Index Hedges
Volumes (Bcf) 6.7 10.3
Average Fixed Prices ($/Mcf) $1.55 $1.52
Basis Hedges
Volumes (Bcf) 8.9 20.7
Average Fixed Prices ($/Mcf) ($0.38) ($0.38)
Natural Gas Hedging and Basis Protection (Cont’d)
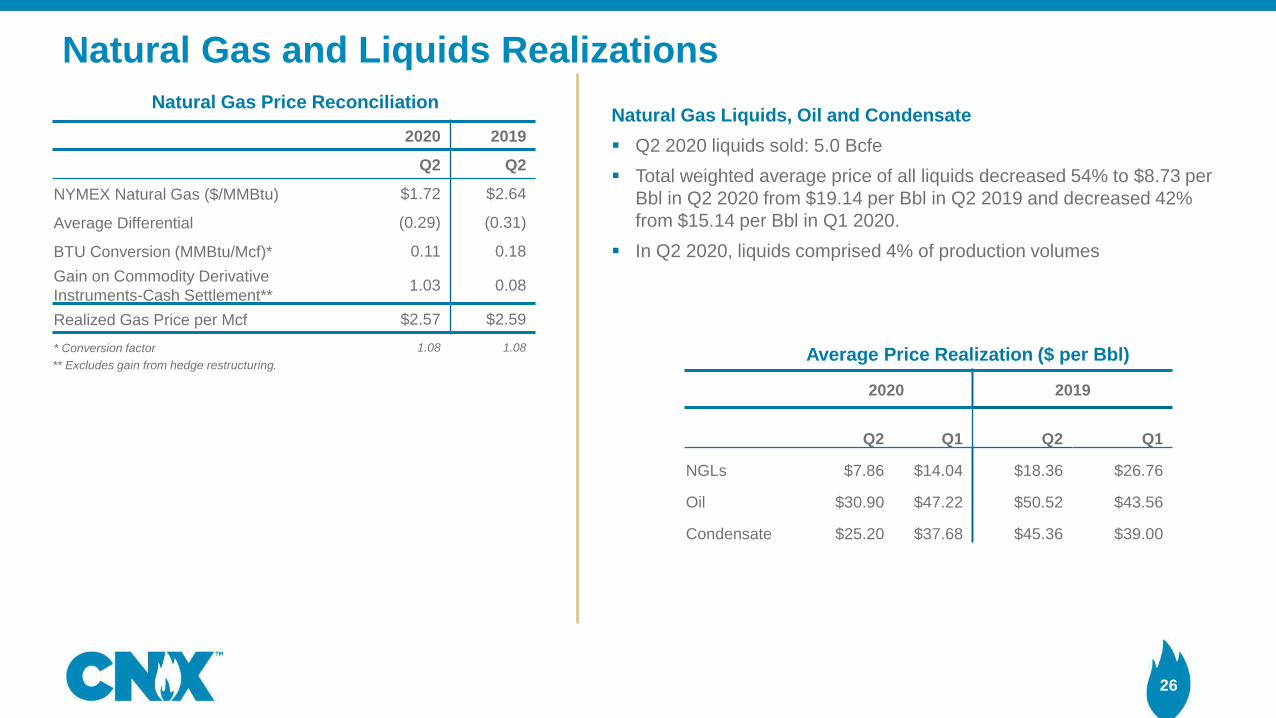
Natural Gas and Liquids Realizations
26
2020 2019
Q2 Q2
NYMEX Natural Gas ($/MMBtu) $1.72 $2.64
Average Differential (0.29) (0.31)
BTU Conversion (MMBtu/Mcf)* 0.11 0.18
Gain on Commodity Derivative
Instruments-Cash Settlement**1.03 0.08
Realized Gas Price per Mcf $2.57 $2.59
* Conversion factor 1.08 1.08
Natural Gas Price Reconciliation
Average Price Realization ($ per Bbl)** Excludes gain from hedge restructuring.
Natural Gas Liquids, Oil and Condensate
▪ Q2 2020 liquids sold: 5.0 Bcfe
▪ Total weighted average price of all liquids decreased 54% to $8.73 per
Bbl in Q2 2020 from $19.14 per Bbl in Q2 2019 and decreased 42%
from $15.14 per Bbl in Q1 2020.
▪ In Q2 2020, liquids comprised 4% of production volumes
2020 2019
Q2 Q1 Q2 Q1
NGLs $7.86 $14.04 $18.36 $26.76
Oil $30.90 $47.22 $50.52 $43.56
Condensate $25.20 $37.68 $45.36 $39.00

Financial Guidance: 2020E Natural Gas Marketing Mix and Basis
27
Northeast Pipeline Projects
Southeast Pipeline Projects
ETNG
2020E Gas: 10%
CY20 Basis: $0.13
TCO Pool
2020E Gas: 21%
CY20 Basis: ($0.30)
TETCO ELA & WLA
2020E Gas: 5%
CY20 Basis: ($0.08)
Dawn Pipeline Projects
Gulf Market Pipelines
Michcon
2020E Gas: 11%
CY20 Basis: ($0.13)
DOM South
2020E Gas: 11%
CY20 Basis: ($0.42)
TETCO M2
2020E Gas: 35%
CY20 Basis: ($0.44)
TETCO M3
2020E Gas: 7%
CY20 Basis: ($0.02)
Percentages include physical sales
Note: Forward market prices are as of 7/8/2020.
2020E CY 2020
Gas Sold (%) Basis
DOM South 8% ($0.42)
ETNG Mainline 4% $0.13
TCO Pool 16% ($0.30)
TETCO ELA & WLA 5% ($0.08)
TETCO M3 7% ($0.02)
TETCO M2 29% ($0.44)
Michcon 11% ($0.13)
Physical basis sales 20% ($0.21)
Weighted Average Basis 100% ($0.27)
NYMEX $1.94
Weighted Average Basis (Not considering hedging) ($0.27)
2020E Realized Price (per MMBtu) $1.67
Conversion Factor (MMBtu/Mcf) 1.081
2020E Realized Price (per Mcf) $1.81
Market

Q3 2020, 2020, and 2021 Gas Hedging Gain/Loss Projections
28
▪ In addition to NYMEX, Index, and basis financial hedges, CNX has physical fixed basis sales and physical fixed price sales with
customers
▪ 2020E physical fixed basis sales and physical fixed price sales: 94.6 Bcf
▪ 2021E physical fixed basis sales and physical fixed price sales: 92.4 Bcf
▪ Physical sales provide additional basis hedge
- Flows through gas sales in financials
Note: Forward market prices, hedged volumes, and hedge prices are as of 7/8/2020. Anticipated hedging activity is not included in projections.
(1) Net of purchased swaps.
(2) July prices are settled.
(3) Forecasted Gain/(Loss) amounts are based on sum of current monthly hedge positions vs. strip. CY 2020 excludes $84 million of hedge monetization gains.
Q3 2020 CY2020 CY2021
Wtd. Avg. Avg. Forecasted Wtd. Avg. Avg. Forecasted Wtd. Avg. Avg. Forecasted
Hedged Volumes(1)
Hedged Forward Gain/(Loss)(3)
Hedged Volumes(1)
Hedged Forward Gain/(Loss)(3)
Hedged Volumes Hedged Forward Gain/(Loss)(3)
(000 MMBtu) Price Market(2)
($ in 000s) (000 MMBtu) Price Market(2)
($ in 000s) (000 MMBtu) Price Market ($ in 000s)
($/MMBtu)
NYMEX 98,035 $2.74 $1.73 $98,573 459,865 $2.76 $1.94 $366,526 449,370 $2.70 $2.64 $28,092
Index (7,275) $1.54 $1.30 ($1,746) (10,025) $1.76 $1.50 ($2,607) 900 $2.40 $2.20 $180
Basis:
DOM South (DOM) 8,880 ($0.54) ($0.41) ($1,102) 53,280 ($0.59) ($0.42) ($8,736) 88,545 ($0.61) ($0.45) ($14,586)
TCO Pool (TCO) 11,500 ($0.40) ($0.27) ($1,554) 53,940 ($0.40) ($0.30) ($5,140) 58,400 ($0.49) ($0.34) ($9,292)
Michcon (NMC) 8,970 ($0.18) ($0.10) ($724) 34,013 ($0.17) ($0.13) ($1,589) 46,230 ($0.17) ($0.18) $832
TETCO ELA (TEB) - $0.00 ($0.07) $0 4,260 ($0.09) ($0.09) $40 7,300 ($0.09) ($0.11) $170
TETCO WLA (TWB) 920 ($0.29) ($0.04) ($223) 10,050 ($0.11) ($0.06) ($403) 7,300 ($0.08) ($0.07) ($102)
TETCO M3 (TMT) 4,600 ($0.35) ($0.24) ($542) 19,060 $0.31 ($0.02) $6,083 6,868 $0.96 $0.21 ($337)
TETCO M2 (BM2) 41,380 ($0.53) ($0.43) ($3,647) 193,910 ($0.54) ($0.44) ($19,446) 170,575 ($0.60) ($0.44) ($28,777)
Transco Zone 5 South (DKR) 4,600 ($0.01) $0.01 ($88) 12,530 $0.16 $0.19 $1,459 6,825 $0.55 $0.33 $311
Total Financial Basis Hedges 80,850 ($7,881) 381,043 ($27,732) 392,043 ($51,781)
Total Projected Realized Gain $88,946 $336,188 ($23,509)

YE2019 Type Curve Area and Acreage Update
Note: As of year-end 2019 as identified in 2019 10-K filed February 10, 2020.
29

YE2019 Acreage and Undeveloped Location Update
Note: As of year-end 2019 as identified in 2019 10-K filed February 10, 2020.
Acres by type curve area do not equal total acres because some CNX-controlled acres fall outside of identified type curve areas. Average lateral lengths and inter-lateral
spacing assumptions unchanged from 2018 Analyst Day.
Totals may not foot due to rounding.
Locations calculated by dividing total controlled acreage in type curve region divided by area of a well.
Grossing up locations to include prospective units requiring additional capital, as is common in the industry, would yield significantly more locations.30
MARCELLUS UTICATYPE CURVE AREAS
SWPA Central Greater TOTAL SWPA
Total Net Acres 88,300 30,600 118,900
Net Developed Acres 34,600 2,400 37,000
Net Undeveloped Locations 328 172
Average Lateral Length (ft) 9,500 9,500
Inter-Lateral Spacing (ft) 750 750
WV SHR/PENS East TOTAL WV
Total Net Acres 15,600 11,000 87,700
Net Developed Acres 7,600 100 7,700
Net Undeveloped Locations 58 79
Average Lateral Length (ft) 8,000 8,000
Inter-Lateral Spacing (ft) 750 750
CPA South North TOTAL CPA
Total Net Acres 103,000 94,800 300,200
Net Developed Acres 5,100 900 6,000
Net Undeveloped Locations 632 606
Average Lateral Length (ft) 9,000 9,000
Inter-Lateral Spacing (ft) 750 750
OH TOTAL OH
Total Net Acres 12,500
Net Developed Acres 200
Net Undeveloped Locations
Average Lateral Length (ft)
Inter-Lateral Spacing (ft)
COMPANY Total Net Acres 519,300
TYPE CURVE AREAS
SWPA Central Greater TOTAL SWPA
Total Net Acres 114,800 57,100 171,900
Net Developed Acres 3,400 - 3,400
Net Undeveloped Locations 439 225
Average Lateral Length (ft) 8,500 8,500
Inter-Lateral Spacing (ft) 1,300 1,300
WV SHR/PENS East TOTAL WV
Total Net Acres 12,900 84,000 133,600
Net Developed Acres - - -
Net Undeveloped Locations 62 402
Average Lateral Length (ft) 7,000 7,000
Inter-Lateral Spacing (ft) 1,300 1,300
CPA South North TOTAL CPA
Total Net Acres 106,900 95,000 240,600
Net Developed Acres 700 200 900
Net Undeveloped Locations 508 454
Average Lateral Length (ft) 7,000 7,000
Inter-Lateral Spacing (ft) 1,300 1,300
OH Dry TOTAL OH
Total Net Acres 15,600 62,200
Net Developed Acres 11,600 11,600
Net Undeveloped Locations 14
Average Lateral Length (ft) 9,500
Inter-Lateral Spacing (ft) 1,350
COMPANY Total Net Acres 608,300
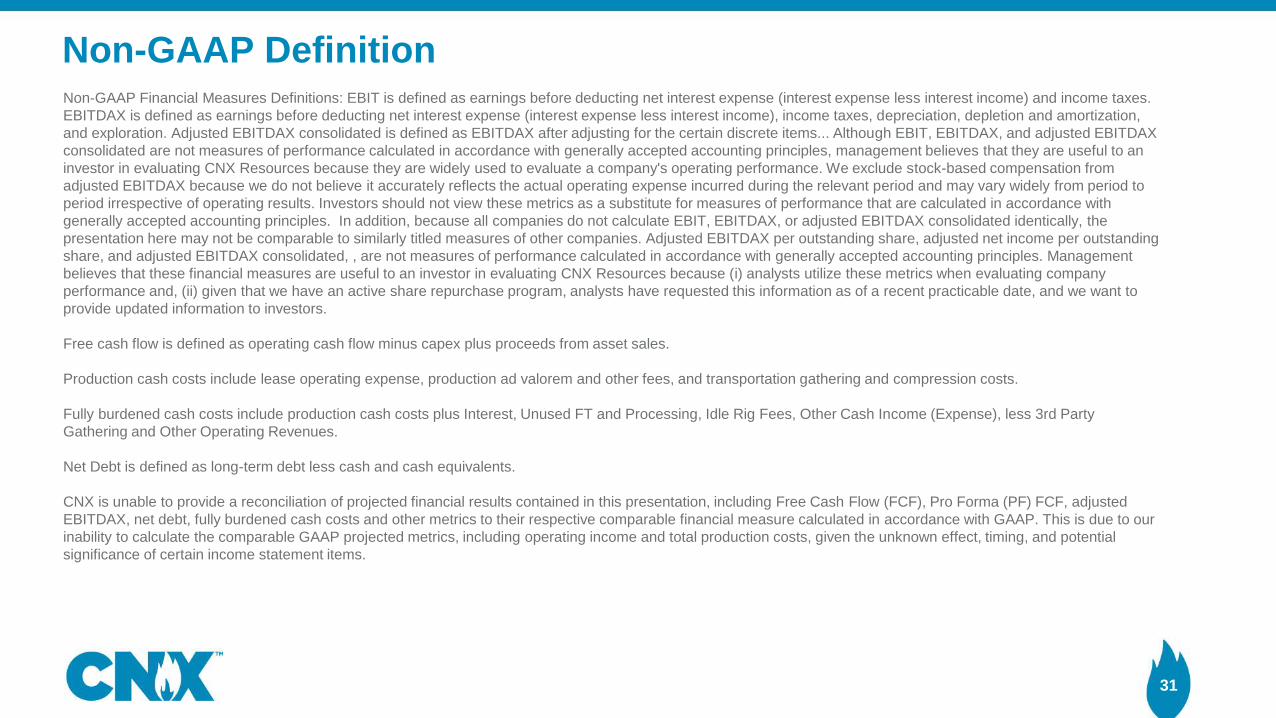
Non-GAAP Definition
31
Non-GAAP Financial Measures Definitions: EBIT is defined as earnings before deducting net interest expense (interest expense less interest income) and income taxes.
EBITDAX is defined as earnings before deducting net interest expense (interest expense less interest income), income taxes, depreciation, depletion and amortization,
and exploration. Adjusted EBITDAX consolidated is defined as EBITDAX after adjusting for the certain discrete items... Although EBIT, EBITDAX, and adjusted EBITDAX
consolidated are not measures of performance calculated in accordance with generally accepted accounting principles, management believes that they are useful to an
investor in evaluating CNX Resources because they are widely used to evaluate a company's operating performance. We exclude stock-based compensation from
adjusted EBITDAX because we do not believe it accurately reflects the actual operating expense incurred during the relevant period and may vary widely from period to
period irrespective of operating results. Investors should not view these metrics as a substitute for measures of performance that are calculated in accordance with
generally accepted accounting principles. In addition, because all companies do not calculate EBIT, EBITDAX, or adjusted EBITDAX consolidated identically, the
presentation here may not be comparable to similarly titled measures of other companies. Adjusted EBITDAX per outstanding share, adjusted net income per outstanding
share, and adjusted EBITDAX consolidated, , are not measures of performance calculated in accordance with generally accepted accounting principles. Management
believes that these financial measures are useful to an investor in evaluating CNX Resources because (i) analysts utilize these metrics when evaluating company
performance and, (ii) given that we have an active share repurchase program, analysts have requested this information as of a recent practicable date, and we want to
provide updated information to investors.
Free cash flow is defined as operating cash flow minus capex plus proceeds from asset sales.
Production cash costs include lease operating expense, production ad valorem and other fees, and transportation gathering and compression costs.
Fully burdened cash costs include production cash costs plus Interest, Unused FT and Processing, Idle Rig Fees, Other Cash Income (Expense), less 3rd Party
Gathering and Other Operating Revenues.
Net Debt is defined as long-term debt less cash and cash equivalents.
CNX is unable to provide a reconciliation of projected financial results contained in this presentation, including Free Cash Flow (FCF), Pro Forma (PF) FCF, adjusted
EBITDAX, net debt, fully burdened cash costs and other metrics to their respective comparable financial measure calculated in accordance with GAAP. This is due to our
inability to calculate the comparable GAAP projected metrics, including operating income and total production costs, given the unknown effect, timing, and potential
significance of certain income statement items.

Non-GAAP Reconciliation
32
Price and Cost Data per Mcfe
($/Mcfe) Q1 2019 Q2 2019 Q3 2019 Q4 2019 Q1 2020 Q2 2020
Average Sales Price - Total Company 2.97$ 2.63$ 2.51$ 2.54$ 2.59$ 2.52$
Lease Operating Expense 0.14$ 0.15$ 0.11$ 0.09$ 0.07$ 0.09$
Transportation, Gathering and Compression 0.92$ 0.98$ 0.97$ 0.97$ 0.99$ 0.91$
Production, Ad Valorem, and Other Fees 0.05$ 0.05$ 0.05$ 0.05$ 0.05$ 0.05$
Depreciation, Depletion and Amortization 0.88$ 0.89$ 0.86$ 0.86$ 0.87$ 0.87$
Total Production Costs 1.99$ 2.07$ 1.99$ 1.97$ 1.98$ 1.92$
Less: Depreciation, Depletion and Amortization 0.88$ 0.89$ 0.86$ 0.86$ 0.87$ 0.87$
Total Cash Production Costs 1.11$ 1.18$ 1.13$ 1.11$ 1.11$ 1.05$
Operating Cash Margin 1.86$ 1.45$ 1.38$ 1.43$ 1.48$ 1.47$
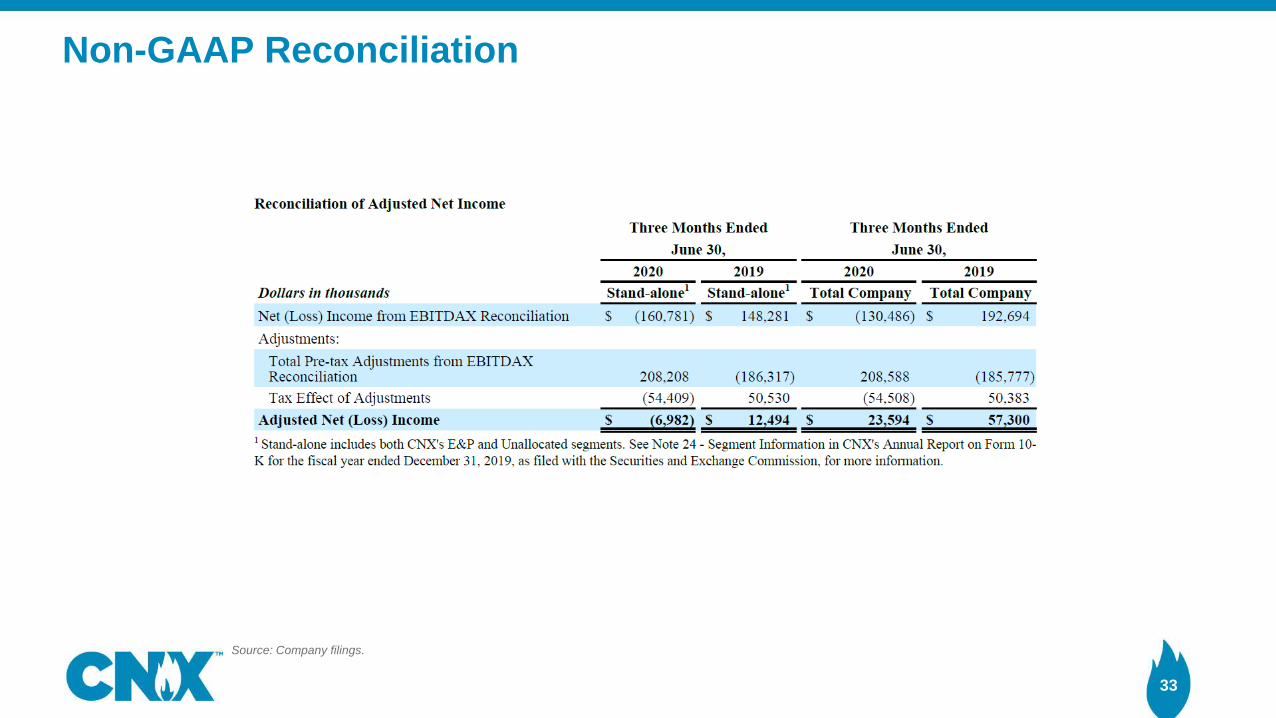
Non-GAAP Reconciliation
33
Source: Company filings.

Non-GAAP Reconciliation
34
Source: Company filings.

Non-GAAP Reconciliation
35
Source: Company filings.