Embed Size (px)
Citation preview
Earth and Planetary Science Letters 406 (2014) 93–101
Contents lists available at ScienceDirect
Earth and Planetary Science Letters
www.elsevier.com/locate/epsl
Fault strength evolution during high velocity friction experiments with
slip-pulse and constant-velocity loading
Zonghu Liao a,b, Jefferson C. Chang b, Ze’ev Reches b,∗a State Key Laboratory of Petroleum Resources and Prospecting, College of Geosciences, China University of Petroleum, Beijing 102249, Chinab School of Geology and Geophysics, University of Oklahoma, Norman, OK 73072, United States
a r t i c l e i n f o a b s t r a c t
Article history:Received 31 March 2014Received in revised form 4 September 2014Accepted 7 September 2014Available online 28 September 2014Editor: P. Shearer
Keywords:friction strengthfault weakeningslip-pulseearthquake rupture
Seismic analyses show that slip during large earthquakes evolves in a slip-pulse mode that is characterized by abrupt, intense acceleration followed by moderate deceleration. We experimentally analyze the friction evolution under slip-pulse proxy of a large earthquake, and compare it with the evolution at loading modes of constant-velocity and changing-velocity. The experiments were conducted on room-dry, solid granite samples at slip-velocities of 0.0006–1 m/s, and normal stress of 1–11.5 MPa. The analysis demonstrates that (1) the strength evolution and constitutive parameters of the granite fault strongly depend on the loading mode, and (2) the slip-pulse mode is energy efficient relatively to the constant-velocity mode as manifested by faster, more intense weakening and 50–90% lower energy dissipation. The results suggest that the frictional strength determined in slip-pulse experiments, is more relevant to simulations of earthquake rupture than frictional strength determined in constant-velocity experiments. Further, for a finite amount of crustal elastic energy, the efficiency of slip-pulse would amplify earthquake instability.
© 2014 Elsevier B.V. All rights reserved.
1. Introduction
Fault rupture during an earthquake occurs by a propagating front that activates numerous patches along the fault zone. The ac-tivation of a patch is manifested by its acceleration from a locked state to slipping state during the finite period of the rise time (Fig. 1, left). It is envisioned that the rupture during large earth-quakes occur in a slip-pulse style that is characterized by two main features: (1) At any given time during the earthquake, slip occurs along a partial segment of the fault, and slip is not simultaneously active along the entire fault; and (2) Abrupt acceleration followed by moderate deceleration (Heaton, 1990; Zheng and Rice, 1998;Anooshehpoor and Brune, 1999; Tinti et al., 2005; Ampuero and Ben-Zion, 2008; Xu et al., 2012; Noda and Lapusta, 2013; Chang et al., 2012). Earthquake slip-pulse is considered as a variant of the Yoffe function of dynamic brittle fracturing in which the slip velocity theoretically rises by infinite acceleration (in practice, the acceleration is finite as shown by the blue curve in Fig. 1, right a) (Kostrov, 1964; Tinti et al., 2005; Lapusta, 2009; Fukuyama and Mizoguchi, 2010). It is assumed that during a slip-pulse, the fault patch undergoes initial weakening that is followed by healing (red,
* Corresponding author. Tel.: +1 405 321 3157.E-mail address: [email protected] (Z. Reches).
http://dx.doi.org/10.1016/j.epsl.2014.09.0100012-821X/© 2014 Elsevier B.V. All rights reserved.
dashed curve, Fig. 1, right a), and this strength evolution is nat-urally controlled by both the friction–velocity relations and the rupture loading mode. In spite of its significance, the strength evo-lution during high-velocity slip-pulse was experimentally analyzed only in two high-velocity studies (Fukuyama and Mizoguchi, 2010;Chang et al., 2012), and without systematic comparison to other slip modes.
To explore this behavior, we conducted a series of high-velocity experiments in which we loaded experimental granite faults by pulse-like source-time function (red curve Fig. 1, right b); for sim-plicity, we refer to this function as ‘slip-pulse’. We then compared these results with those of classical constant-velocity (black curve Fig. 1, right b) and changing-velocity (green curve Fig. 1, right b) experiments. The analysis indicates that (i) the frictional strength evolution of slip-pulse mode is fundamentally different from the equivalent relations of the other slip modes, and (ii) slip-pulse mode dissipates less energy than the constant-velocity mode.
2. Experimental set-up
The experiments were conducted with a high-velocity rotary shear apparatus in the University of Oklahoma (Fig. 2a–c). The set-up was described in the ‘Online Methods’ sections of Reches and Lockner (2010) and Chang et al. (2012). Each sample is com-posed of two cylindrical rock blocks, each 101.6 mm in diameter,
94 Z. Liao et al. / Earth and Planetary Science Letters 406 (2014) 93–101
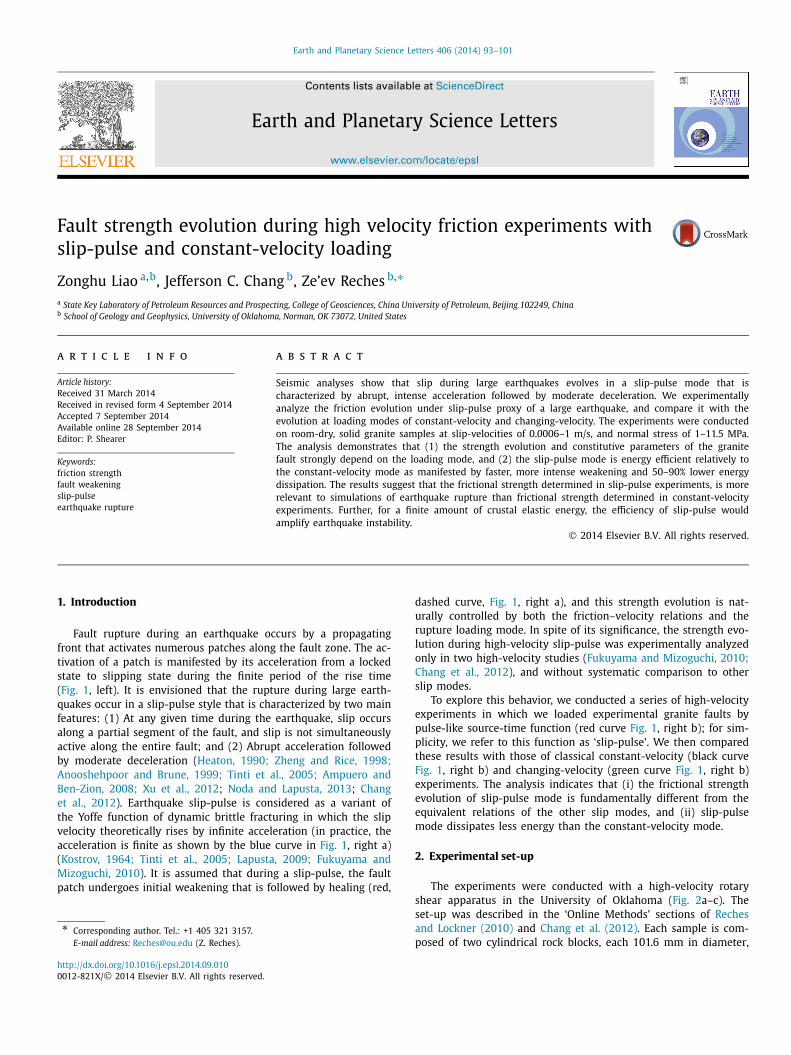
Fig. 1. Conceptual time-history of slip-velocity along a fault patch during a large earthquake. Left. Schematic presentation of a few idealized histories of slip-velocity and slip distance (Tinti et al., 2005). Right a. Schematic presentation of fault patch behavior during slip-pulse loading; arbitrary scales of time slip velocity, shear stress, and slip distance; modified after Heaton (1990). Right b. Schematic presentation of the slip-velocity history used in the present experiments and the idealized Yoffe function (text).
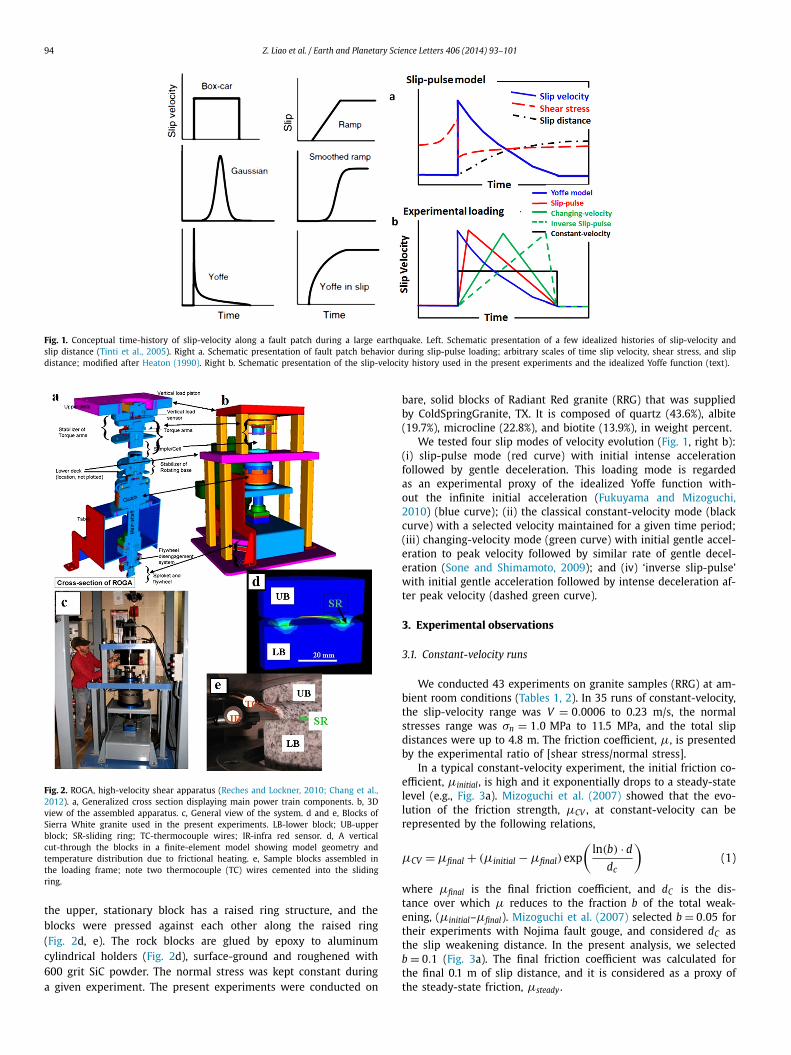
Fig. 2. ROGA, high-velocity shear apparatus (Reches and Lockner, 2010; Chang et al., 2012). a, Generalized cross section displaying main power train components. b, 3D view of the assembled apparatus. c, General view of the system. d and e, Blocks of Sierra White granite used in the present experiments. LB-lower block; UB-upper block; SR-sliding ring; TC-thermocouple wires; IR-infra red sensor. d, A vertical cut-through the blocks in a finite-element model showing model geometry and temperature distribution due to frictional heating. e, Sample blocks assembled in the loading frame; note two thermocouple (TC) wires cemented into the sliding ring.
the upper, stationary block has a raised ring structure, and the blocks were pressed against each other along the raised ring (Fig. 2d, e). The rock blocks are glued by epoxy to aluminum cylindrical holders (Fig. 2d), surface-ground and roughened with 600 grit SiC powder. The normal stress was kept constant during a given experiment. The present experiments were conducted on
bare, solid blocks of Radiant Red granite (RRG) that was supplied by ColdSpringGranite, TX. It is composed of quartz (43.6%), albite (19.7%), microcline (22.8%), and biotite (13.9%), in weight percent.
We tested four slip modes of velocity evolution (Fig. 1, right b): (i) slip-pulse mode (red curve) with initial intense acceleration followed by gentle deceleration. This loading mode is regarded as an experimental proxy of the idealized Yoffe function with-out the infinite initial acceleration (Fukuyama and Mizoguchi, 2010) (blue curve); (ii) the classical constant-velocity mode (black curve) with a selected velocity maintained for a given time period; (iii) changing-velocity mode (green curve) with initial gentle accel-eration to peak velocity followed by similar rate of gentle decel-eration (Sone and Shimamoto, 2009); and (iv) ‘inverse slip-pulse’ with initial gentle acceleration followed by intense deceleration af-ter peak velocity (dashed green curve).
3. Experimental observations
3.1. Constant-velocity runs
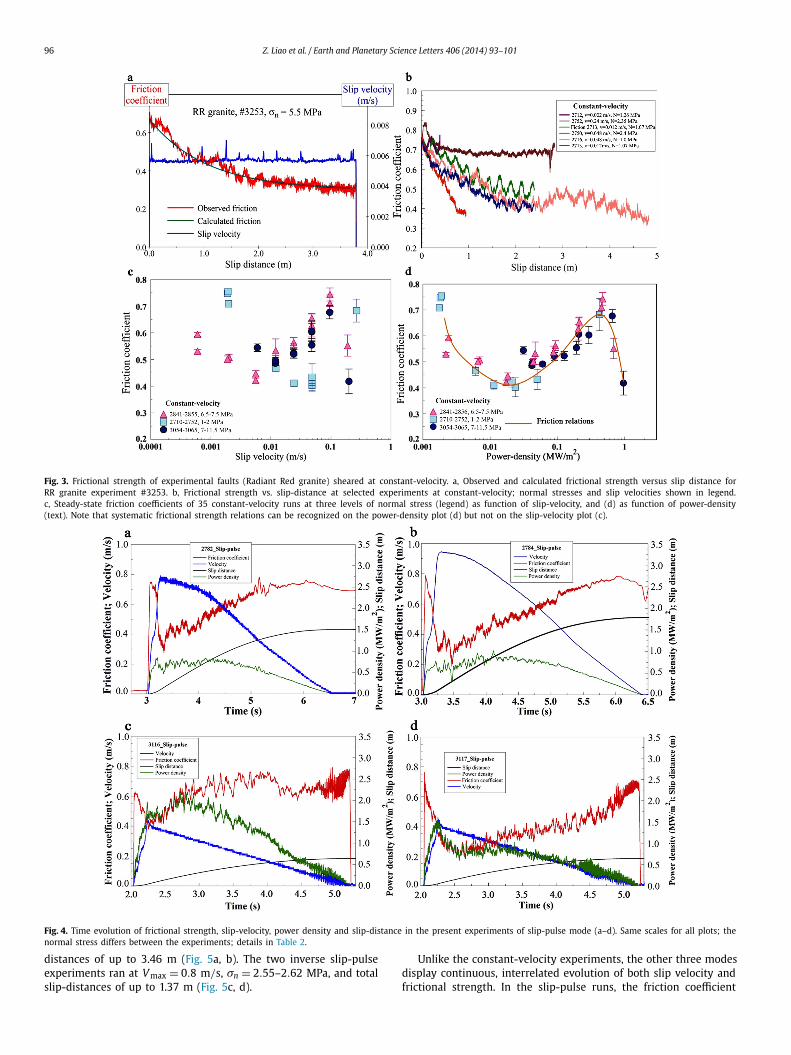
We conducted 43 experiments on granite samples (RRG) at am-bient room conditions (Tables 1, 2). In 35 runs of constant-velocity, the slip-velocity range was V = 0.0006 to 0.23 m/s, the normal stresses range was σn = 1.0 MPa to 11.5 MPa, and the total slip distances were up to 4.8 m. The friction coefficient, μ, is presented by the experimental ratio of [shear stress/normal stress].
In a typical constant-velocity experiment, the initial friction co-efficient, μinitial , is high and it exponentially drops to a steady-state level (e.g., Fig. 3a). Mizoguchi et al. (2007) showed that the evo-lution of the friction strength, μCV , at constant-velocity can be represented by the following relations,
μCV = μfinal + (μinitial − μfinal)exp
(ln(b) · d
dc
)(1)
where μfinal is the final friction coefficient, and dC is the dis-tance over which μ reduces to the fraction b of the total weak-ening, (μinitial–μfinal). Mizoguchi et al. (2007) selected b = 0.05 for their experiments with Nojima fault gouge, and considered dC as the slip weakening distance. In the present analysis, we selected b = 0.1 (Fig. 3a). The final friction coefficient was calculated for the final 0.1 m of slip distance, and it is considered as a proxy of the steady-state friction, μsteady .
Z. Liao et al. / Earth and Planetary Science Letters 406 (2014) 93–101 95
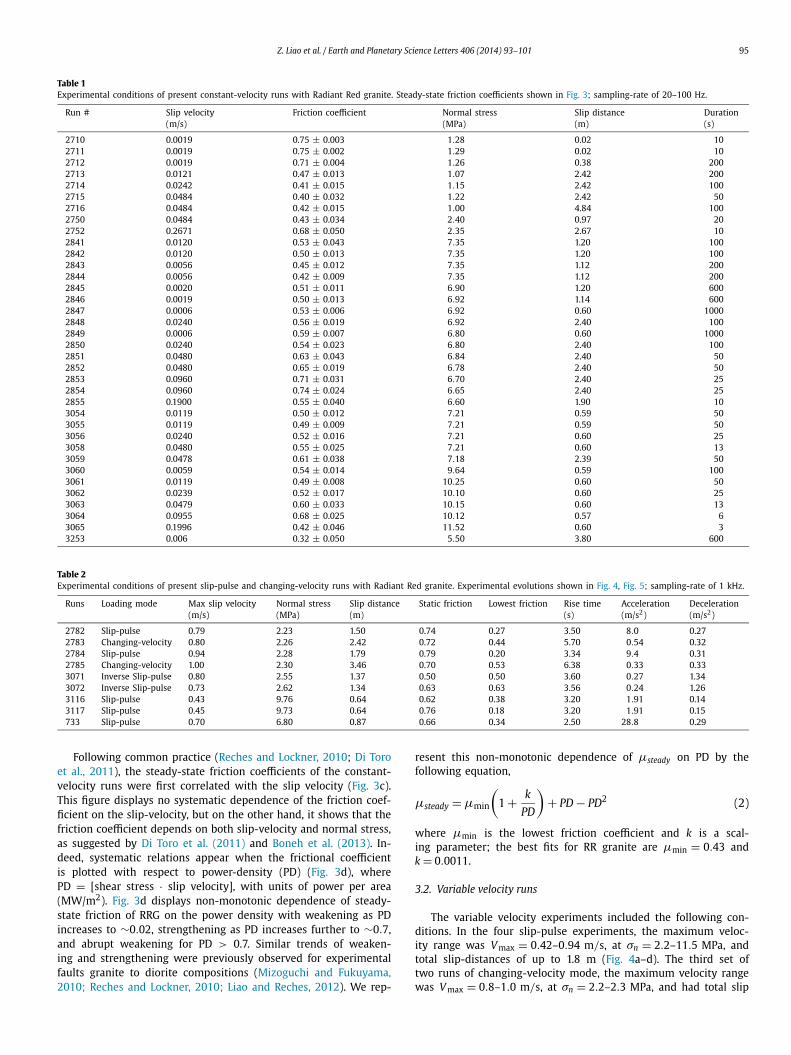
Table 1Experimental conditions of present constant-velocity runs with Radiant Red granite. Steady-state friction coefficients shown in Fig. 3; sampling-rate of 20–100 Hz.
Run # Slip velocity (m/s)
Friction coefficient Normal stress (MPa)
Slip distance (m)
Duration (s)
2710 0.0019 0.75 ± 0.003 1.28 0.02 102711 0.0019 0.75 ± 0.002 1.29 0.02 102712 0.0019 0.71 ± 0.004 1.26 0.38 2002713 0.0121 0.47 ± 0.013 1.07 2.42 2002714 0.0242 0.41 ± 0.015 1.15 2.42 1002715 0.0484 0.40 ± 0.032 1.22 2.42 502716 0.0484 0.42 ± 0.015 1.00 4.84 1002750 0.0484 0.43 ± 0.034 2.40 0.97 202752 0.2671 0.68 ± 0.050 2.35 2.67 102841 0.0120 0.53 ± 0.043 7.35 1.20 1002842 0.0120 0.50 ± 0.013 7.35 1.20 1002843 0.0056 0.45 ± 0.012 7.35 1.12 2002844 0.0056 0.42 ± 0.009 7.35 1.12 2002845 0.0020 0.51 ± 0.011 6.90 1.20 6002846 0.0019 0.50 ± 0.013 6.92 1.14 6002847 0.0006 0.53 ± 0.006 6.92 0.60 10002848 0.0240 0.56 ± 0.019 6.92 2.40 1002849 0.0006 0.59 ± 0.007 6.80 0.60 10002850 0.0240 0.54 ± 0.023 6.80 2.40 1002851 0.0480 0.63 ± 0.043 6.84 2.40 502852 0.0480 0.65 ± 0.019 6.78 2.40 502853 0.0960 0.71 ± 0.031 6.70 2.40 252854 0.0960 0.74 ± 0.024 6.65 2.40 252855 0.1900 0.55 ± 0.040 6.60 1.90 103054 0.0119 0.50 ± 0.012 7.21 0.59 503055 0.0119 0.49 ± 0.009 7.21 0.59 503056 0.0240 0.52 ± 0.016 7.21 0.60 253058 0.0480 0.55 ± 0.025 7.21 0.60 133059 0.0478 0.61 ± 0.038 7.18 2.39 503060 0.0059 0.54 ± 0.014 9.64 0.59 1003061 0.0119 0.49 ± 0.008 10.25 0.60 503062 0.0239 0.52 ± 0.017 10.10 0.60 253063 0.0479 0.60 ± 0.033 10.15 0.60 133064 0.0955 0.68 ± 0.025 10.12 0.57 63065 0.1996 0.42 ± 0.046 11.52 0.60 33253 0.006 0.32 ± 0.050 5.50 3.80 600
Table 2Experimental conditions of present slip-pulse and changing-velocity runs with Radiant Red granite. Experimental evolutions shown in Fig. 4, Fig. 5; sampling-rate of 1 kHz.
Runs Loading mode Max slip velocity (m/s)
Normal stress (MPa)
Slip distance (m)
Static friction Lowest friction Rise time (s)
Acceleration (m/s2)
Deceleration (m/s2)
2782 Slip-pulse 0.79 2.23 1.50 0.74 0.27 3.50 8.0 0.272783 Changing-velocity 0.80 2.26 2.42 0.72 0.44 5.70 0.54 0.322784 Slip-pulse 0.94 2.28 1.79 0.79 0.20 3.34 9.4 0.312785 Changing-velocity 1.00 2.30 3.46 0.70 0.53 6.38 0.33 0.333071 Inverse Slip-pulse 0.80 2.55 1.37 0.50 0.50 3.60 0.27 1.343072 Inverse Slip-pulse 0.73 2.62 1.34 0.63 0.63 3.56 0.24 1.263116 Slip-pulse 0.43 9.76 0.64 0.62 0.38 3.20 1.91 0.143117 Slip-pulse 0.45 9.73 0.64 0.76 0.18 3.20 1.91 0.15733 Slip-pulse 0.70 6.80 0.87 0.66 0.34 2.50 28.8 0.29
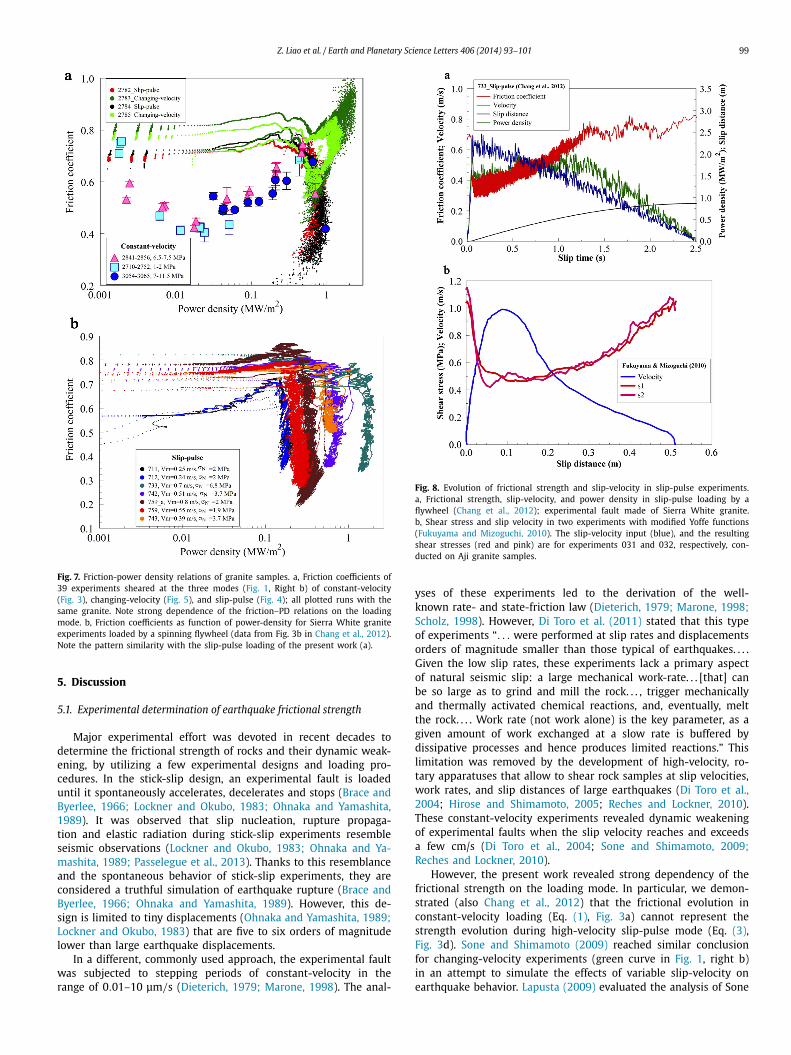
Following common practice (Reches and Lockner, 2010; Di Toro et al., 2011), the steady-state friction coefficients of the constant-velocity runs were first correlated with the slip velocity (Fig. 3c). This figure displays no systematic dependence of the friction coef-ficient on the slip-velocity, but on the other hand, it shows that the friction coefficient depends on both slip-velocity and normal stress, as suggested by Di Toro et al. (2011) and Boneh et al. (2013). In-deed, systematic relations appear when the frictional coefficient is plotted with respect to power-density (PD) (Fig. 3d), where PD = [shear stress · slip velocity], with units of power per area (MW/m2). Fig. 3d displays non-monotonic dependence of steady-state friction of RRG on the power density with weakening as PD increases to ∼0.02, strengthening as PD increases further to ∼0.7, and abrupt weakening for PD > 0.7. Similar trends of weaken-ing and strengthening were previously observed for experimental faults granite to diorite compositions (Mizoguchi and Fukuyama, 2010; Reches and Lockner, 2010; Liao and Reches, 2012). We rep-
resent this non-monotonic dependence of μsteady on PD by the following equation,
μsteady = μmin
(1 + k
PD
)+ PD − PD2 (2)
where μmin is the lowest friction coefficient and k is a scal-ing parameter; the best fits for RR granite are μmin = 0.43 and k = 0.0011.
3.2. Variable velocity runs
The variable velocity experiments included the following con-ditions. In the four slip-pulse experiments, the maximum veloc-ity range was V max = 0.42–0.94 m/s, at σn = 2.2–11.5 MPa, and total slip-distances of up to 1.8 m (Fig. 4a–d). The third set of two runs of changing-velocity mode, the maximum velocity range was V max = 0.8–1.0 m/s, at σn = 2.2–2.3 MPa, and had total slip
96 Z. Liao et al. / Earth and Planetary Science Letters 406 (2014) 93–101
Fig. 3. Frictional strength of experimental faults (Radiant Red granite) sheared at constant-velocity. a, Observed and calculated frictional strength versus slip distance for RR granite experiment #3253. b, Frictional strength vs. slip-distance at selected experiments at constant-velocity; normal stresses and slip velocities shown in legend. c, Steady-state friction coefficients of 35 constant-velocity runs at three levels of normal stress (legend) as function of slip-velocity, and (d) as function of power-density (text). Note that systematic frictional strength relations can be recognized on the power-density plot (d) but not on the slip-velocity plot (c).
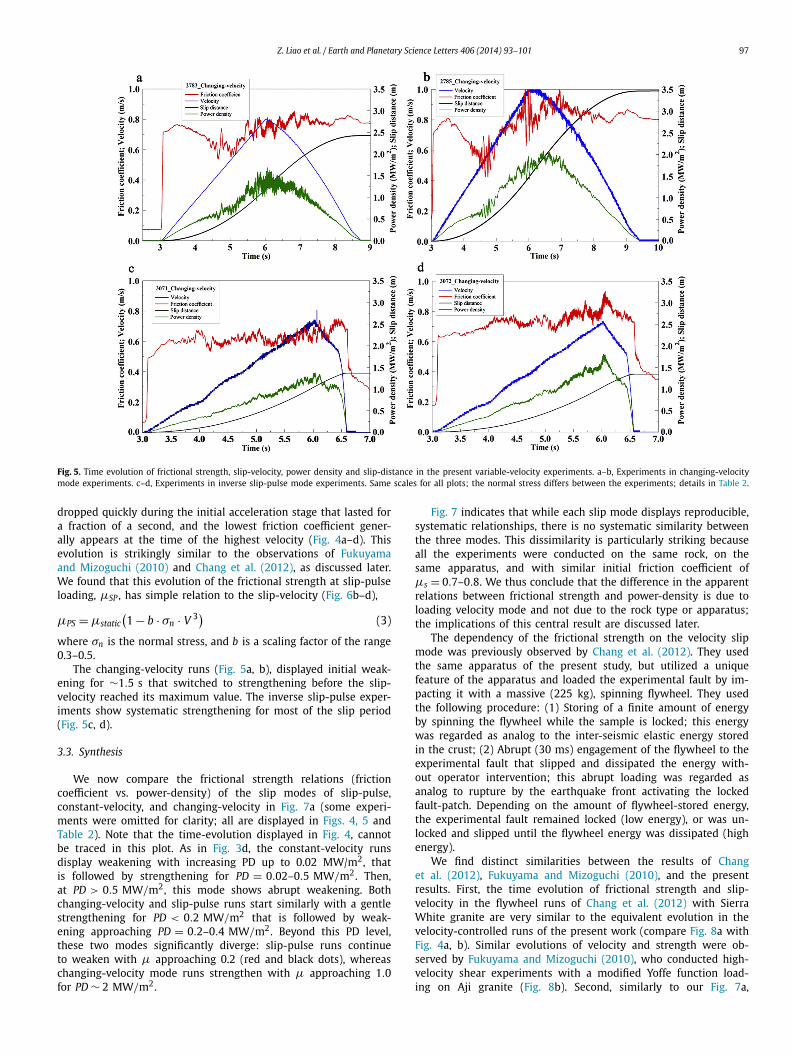
Fig. 4. Time evolution of frictional strength, slip-velocity, power density and slip-distance in the present experiments of slip-pulse mode (a–d). Same scales for all plots; the
normal stress differs between the experiments; details in Table 2.distances of up to 3.46 m (Fig. 5a, b). The two inverse slip-pulse experiments ran at V max = 0.8 m/s, σn = 2.55–2.62 MPa, and total slip-distances of up to 1.37 m (Fig. 5c, d).
Unlike the constant-velocity experiments, the other three modes display continuous, interrelated evolution of both slip velocity and frictional strength. In the slip-pulse runs, the friction coefficient
Z. Liao et al. / Earth and Planetary Science Letters 406 (2014) 93–101 97
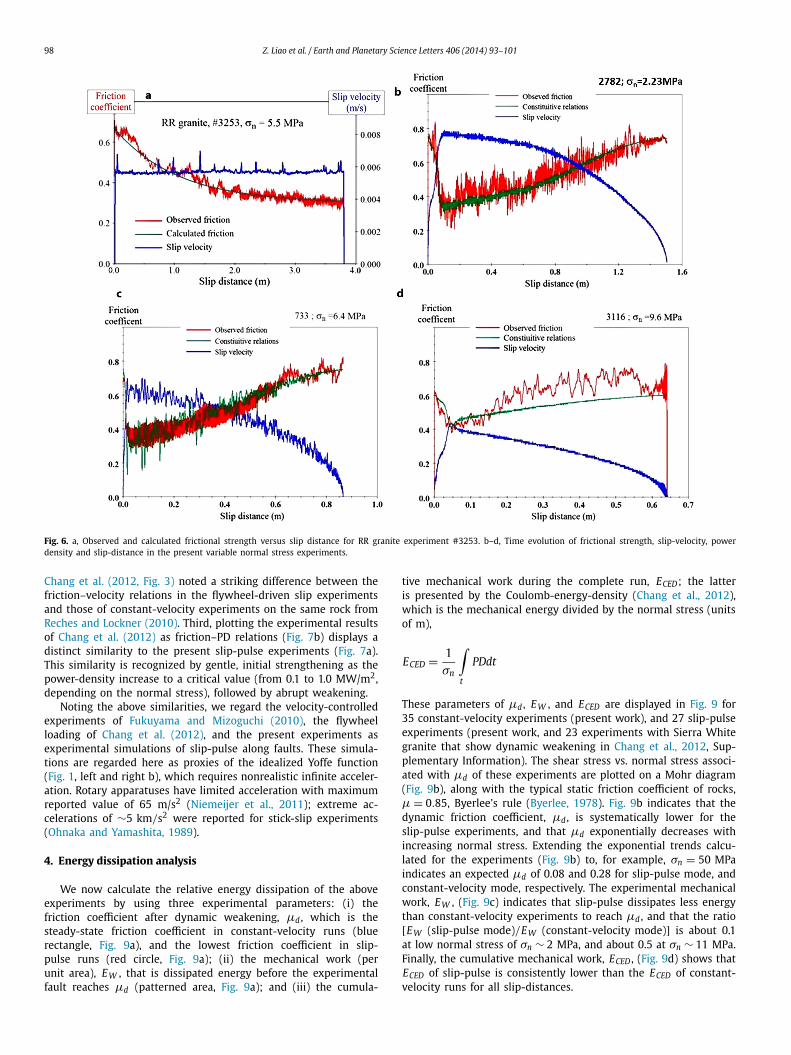
Fig. 5. Time evolution of frictional strength, slip-velocity, power density and slip-distance in the present variable-velocity experiments. a–b, Experiments in changing-velocity mode experiments. c–d, Experiments in inverse slip-pulse mode experiments. Same scales for all plots; the normal stress differs between the experiments; details in Table 2.
dropped quickly during the initial acceleration stage that lasted for a fraction of a second, and the lowest friction coefficient gener-ally appears at the time of the highest velocity (Fig. 4a–d). This evolution is strikingly similar to the observations of Fukuyama and Mizoguchi (2010) and Chang et al. (2012), as discussed later. We found that this evolution of the frictional strength at slip-pulse loading, μSP , has simple relation to the slip-velocity (Fig. 6b–d),
μPS = μstatic(1 − b · σn · V 3) (3)
where σn is the normal stress, and b is a scaling factor of the range 0.3–0.5.
The changing-velocity runs (Fig. 5a, b), displayed initial weak-ening for ∼1.5 s that switched to strengthening before the slip-velocity reached its maximum value. The inverse slip-pulse exper-iments show systematic strengthening for most of the slip period (Fig. 5c, d).
3.3. Synthesis
We now compare the frictional strength relations (friction coefficient vs. power-density) of the slip modes of slip-pulse, constant-velocity, and changing-velocity in Fig. 7a (some experi-ments were omitted for clarity; all are displayed in Figs. 4, 5 and Table 2). Note that the time-evolution displayed in Fig. 4, cannot be traced in this plot. As in Fig. 3d, the constant-velocity runs display weakening with increasing PD up to 0.02 MW/m2, that is followed by strengthening for PD = 0.02–0.5 MW/m2. Then, at PD > 0.5 MW/m2, this mode shows abrupt weakening. Both changing-velocity and slip-pulse runs start similarly with a gentle strengthening for PD < 0.2 MW/m2 that is followed by weak-ening approaching PD = 0.2–0.4 MW/m2. Beyond this PD level, these two modes significantly diverge: slip-pulse runs continue to weaken with μ approaching 0.2 (red and black dots), whereas changing-velocity mode runs strengthen with μ approaching 1.0for PD ∼ 2 MW/m2.
Fig. 7 indicates that while each slip mode displays reproducible, systematic relationships, there is no systematic similarity between the three modes. This dissimilarity is particularly striking because all the experiments were conducted on the same rock, on the same apparatus, and with similar initial friction coefficient of μs = 0.7–0.8. We thus conclude that the difference in the apparent relations between frictional strength and power-density is due to loading velocity mode and not due to the rock type or apparatus; the implications of this central result are discussed later.
The dependency of the frictional strength on the velocity slip mode was previously observed by Chang et al. (2012). They used the same apparatus of the present study, but utilized a unique feature of the apparatus and loaded the experimental fault by im-pacting it with a massive (225 kg), spinning flywheel. They used the following procedure: (1) Storing of a finite amount of energy by spinning the flywheel while the sample is locked; this energy was regarded as analog to the inter-seismic elastic energy stored in the crust; (2) Abrupt (30 ms) engagement of the flywheel to the experimental fault that slipped and dissipated the energy with-out operator intervention; this abrupt loading was regarded as analog to rupture by the earthquake front activating the locked fault-patch. Depending on the amount of flywheel-stored energy, the experimental fault remained locked (low energy), or was un-locked and slipped until the flywheel energy was dissipated (high energy).
We find distinct similarities between the results of Chang et al. (2012), Fukuyama and Mizoguchi (2010), and the present results. First, the time evolution of frictional strength and slip-velocity in the flywheel runs of Chang et al. (2012) with Sierra White granite are very similar to the equivalent evolution in the velocity-controlled runs of the present work (compare Fig. 8a with Fig. 4a, b). Similar evolutions of velocity and strength were ob-served by Fukuyama and Mizoguchi (2010), who conducted high-velocity shear experiments with a modified Yoffe function load-ing on Aji granite (Fig. 8b). Second, similarly to our Fig. 7a,
98 Z. Liao et al. / Earth and Planetary Science Letters 406 (2014) 93–101
Fig. 6. a, Observed and calculated frictional strength versus slip distance for RR granite experiment #3253. b–d, Time evolution of frictional strength, slip-velocity, power density and slip-distance in the present variable normal stress experiments.
Chang et al. (2012, Fig. 3) noted a striking difference between the friction–velocity relations in the flywheel-driven slip experiments and those of constant-velocity experiments on the same rock from Reches and Lockner (2010). Third, plotting the experimental results of Chang et al. (2012) as friction–PD relations (Fig. 7b) displays a distinct similarity to the present slip-pulse experiments (Fig. 7a). This similarity is recognized by gentle, initial strengthening as the power-density increase to a critical value (from 0.1 to 1.0 MW/m2, depending on the normal stress), followed by abrupt weakening.
Noting the above similarities, we regard the velocity-controlled experiments of Fukuyama and Mizoguchi (2010), the flywheel loading of Chang et al. (2012), and the present experiments as experimental simulations of slip-pulse along faults. These simula-tions are regarded here as proxies of the idealized Yoffe function (Fig. 1, left and right b), which requires nonrealistic infinite acceler-ation. Rotary apparatuses have limited acceleration with maximum reported value of 65 m/s2 (Niemeijer et al., 2011); extreme ac-celerations of ∼5 km/s2 were reported for stick-slip experiments (Ohnaka and Yamashita, 1989).
4. Energy dissipation analysis
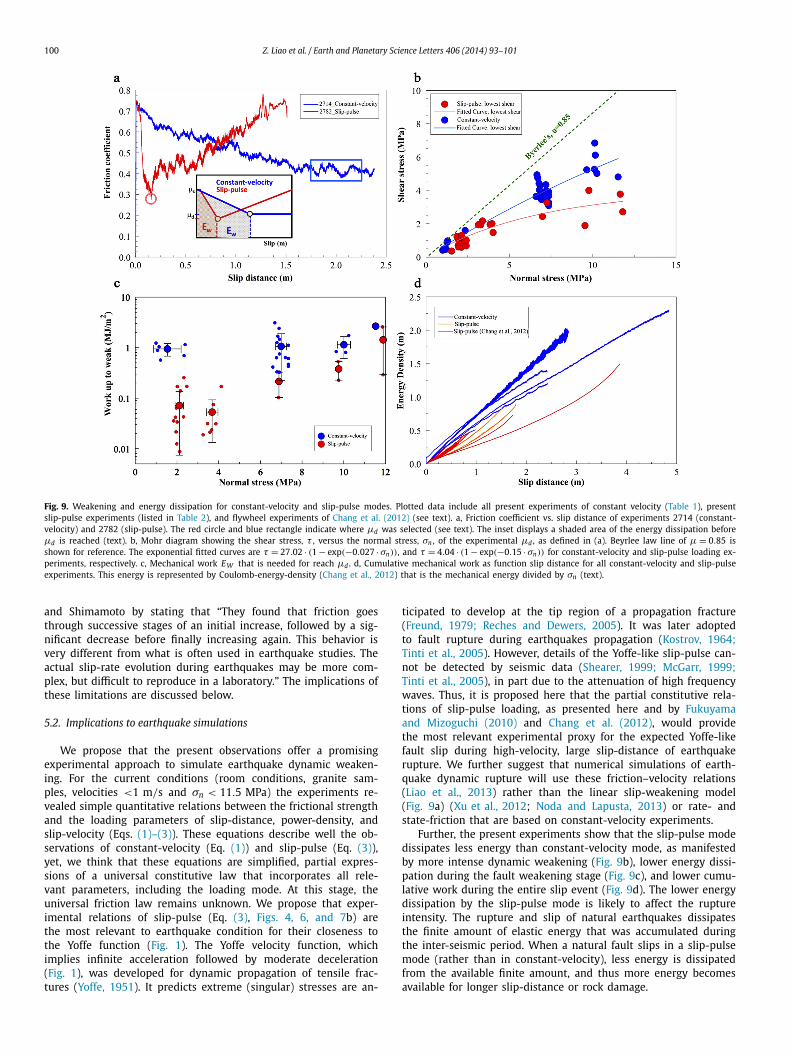
We now calculate the relative energy dissipation of the above experiments by using three experimental parameters: (i) the friction coefficient after dynamic weakening, μd , which is the steady-state friction coefficient in constant-velocity runs (blue rectangle, Fig. 9a), and the lowest friction coefficient in slip-pulse runs (red circle, Fig. 9a); (ii) the mechanical work (per unit area), EW , that is dissipated energy before the experimental fault reaches μd (patterned area, Fig. 9a); and (iii) the cumula-
tive mechanical work during the complete run, ECED; the latter is presented by the Coulomb-energy-density (Chang et al., 2012), which is the mechanical energy divided by the normal stress (units of m),
ECED = 1
σn
∫t
PDdt
These parameters of μd , EW , and ECED are displayed in Fig. 9 for 35 constant-velocity experiments (present work), and 27 slip-pulse experiments (present work, and 23 experiments with Sierra White granite that show dynamic weakening in Chang et al., 2012, Sup-plementary Information). The shear stress vs. normal stress associ-ated with μd of these experiments are plotted on a Mohr diagram (Fig. 9b), along with the typical static friction coefficient of rocks, μ = 0.85, Byerlee’s rule (Byerlee, 1978). Fig. 9b indicates that the dynamic friction coefficient, μd , is systematically lower for the slip-pulse experiments, and that μd exponentially decreases with increasing normal stress. Extending the exponential trends calcu-lated for the experiments (Fig. 9b) to, for example, σn = 50 MPaindicates an expected μd of 0.08 and 0.28 for slip-pulse mode, and constant-velocity mode, respectively. The experimental mechanical work, EW , (Fig. 9c) indicates that slip-pulse dissipates less energy than constant-velocity experiments to reach μd , and that the ratio [EW (slip-pulse mode)/EW (constant-velocity mode)] is about 0.1 at low normal stress of σn ∼ 2 MPa, and about 0.5 at σn ∼ 11 MPa. Finally, the cumulative mechanical work, ECED , (Fig. 9d) shows that ECED of slip-pulse is consistently lower than the ECED of constant-velocity runs for all slip-distances.
Z. Liao et al. / Earth and Planetary Science Letters 406 (2014) 93–101 99
Fig. 7. Friction-power density relations of granite samples. a, Friction coefficients of 39 experiments sheared at the three modes (Fig. 1, Right b) of constant-velocity (Fig. 3), changing-velocity (Fig. 5), and slip-pulse (Fig. 4); all plotted runs with the same granite. Note strong dependence of the friction–PD relations on the loading mode. b, Friction coefficients as function of power-density for Sierra White granite experiments loaded by a spinning flywheel (data from Fig. 3b in Chang et al., 2012). Note the pattern similarity with the slip-pulse loading of the present work (a).
5. Discussion
5.1. Experimental determination of earthquake frictional strength
Major experimental effort was devoted in recent decades to determine the frictional strength of rocks and their dynamic weak-ening, by utilizing a few experimental designs and loading pro-cedures. In the stick-slip design, an experimental fault is loaded until it spontaneously accelerates, decelerates and stops (Brace and Byerlee, 1966; Lockner and Okubo, 1983; Ohnaka and Yamashita, 1989). It was observed that slip nucleation, rupture propaga-tion and elastic radiation during stick-slip experiments resemble seismic observations (Lockner and Okubo, 1983; Ohnaka and Ya-mashita, 1989; Passelegue et al., 2013). Thanks to this resemblance and the spontaneous behavior of stick-slip experiments, they are considered a truthful simulation of earthquake rupture (Brace and Byerlee, 1966; Ohnaka and Yamashita, 1989). However, this de-sign is limited to tiny displacements (Ohnaka and Yamashita, 1989;Lockner and Okubo, 1983) that are five to six orders of magnitude lower than large earthquake displacements.
In a different, commonly used approach, the experimental fault was subjected to stepping periods of constant-velocity in the range of 0.01–10 μm/s (Dieterich, 1979; Marone, 1998). The anal-
Fig. 8. Evolution of frictional strength and slip-velocity in slip-pulse experiments. a, Frictional strength, slip-velocity, and power density in slip-pulse loading by a flywheel (Chang et al., 2012); experimental fault made of Sierra White granite. b, Shear stress and slip velocity in two experiments with modified Yoffe functions (Fukuyama and Mizoguchi, 2010). The slip-velocity input (blue), and the resulting shear stresses (red and pink) are for experiments 031 and 032, respectively, con-ducted on Aji granite samples.
yses of these experiments led to the derivation of the well-known rate- and state-friction law (Dieterich, 1979; Marone, 1998;Scholz, 1998). However, Di Toro et al. (2011) stated that this type of experiments “. . . were performed at slip rates and displacements orders of magnitude smaller than those typical of earthquakes. . . . Given the low slip rates, these experiments lack a primary aspect of natural seismic slip: a large mechanical work-rate. . . [that] can be so large as to grind and mill the rock. . . , trigger mechanically and thermally activated chemical reactions, and, eventually, melt the rock. . . . Work rate (not work alone) is the key parameter, as a given amount of work exchanged at a slow rate is buffered by dissipative processes and hence produces limited reactions.” This limitation was removed by the development of high-velocity, ro-tary apparatuses that allow to shear rock samples at slip velocities, work rates, and slip distances of large earthquakes (Di Toro et al., 2004; Hirose and Shimamoto, 2005; Reches and Lockner, 2010). These constant-velocity experiments revealed dynamic weakening of experimental faults when the slip velocity reaches and exceeds a few cm/s (Di Toro et al., 2004; Sone and Shimamoto, 2009;Reches and Lockner, 2010).
However, the present work revealed strong dependency of the frictional strength on the loading mode. In particular, we demon-strated (also Chang et al., 2012) that the frictional evolution in constant-velocity loading (Eq. (1), Fig. 3a) cannot represent the strength evolution during high-velocity slip-pulse mode (Eq. (3), Fig. 3d). Sone and Shimamoto (2009) reached similar conclusion for changing-velocity experiments (green curve in Fig. 1, right b) in an attempt to simulate the effects of variable slip-velocity on earthquake behavior. Lapusta (2009) evaluated the analysis of Sone
100 Z. Liao et al. / Earth and Planetary Science Letters 406 (2014) 93–101
Fig. 9. Weakening and energy dissipation for constant-velocity and slip-pulse modes. Plotted data include all present experiments of constant velocity (Table 1), present slip-pulse experiments (listed in Table 2), and flywheel experiments of Chang et al. (2012) (see text). a, Friction coefficient vs. slip distance of experiments 2714 (constant-velocity) and 2782 (slip-pulse). The red circle and blue rectangle indicate where μd was selected (see text). The inset displays a shaded area of the energy dissipation before μd is reached (text). b, Mohr diagram showing the shear stress, τ , versus the normal stress, σn , of the experimental μd , as defined in (a). Beyrlee law line of μ = 0.85 is shown for reference. The exponential fitted curves are τ = 27.02 · (1 − exp(−0.027 · σn)), and τ = 4.04 · (1 − exp(−0.15 · σn)) for constant-velocity and slip-pulse loading ex-periments, respectively. c, Mechanical work EW that is needed for reach μd . d, Cumulative mechanical work as function slip distance for all constant-velocity and slip-pulse experiments. This energy is represented by Coulomb-energy-density (Chang et al., 2012) that is the mechanical energy divided by σn (text).
and Shimamoto by stating that “They found that friction goes through successive stages of an initial increase, followed by a sig-nificant decrease before finally increasing again. This behavior is very different from what is often used in earthquake studies. The actual slip-rate evolution during earthquakes may be more com-plex, but difficult to reproduce in a laboratory.” The implications of these limitations are discussed below.
5.2. Implications to earthquake simulations
We propose that the present observations offer a promising experimental approach to simulate earthquake dynamic weaken-ing. For the current conditions (room conditions, granite sam-ples, velocities <1 m/s and σn < 11.5 MPa) the experiments re-vealed simple quantitative relations between the frictional strength and the loading parameters of slip-distance, power-density, and slip-velocity (Eqs. (1)–(3)). These equations describe well the ob-servations of constant-velocity (Eq. (1)) and slip-pulse (Eq. (3)), yet, we think that these equations are simplified, partial expres-sions of a universal constitutive law that incorporates all rele-vant parameters, including the loading mode. At this stage, the universal friction law remains unknown. We propose that exper-imental relations of slip-pulse (Eq. (3), Figs. 4, 6, and 7b) are the most relevant to earthquake condition for their closeness to the Yoffe function (Fig. 1). The Yoffe velocity function, which implies infinite acceleration followed by moderate deceleration (Fig. 1), was developed for dynamic propagation of tensile frac-tures (Yoffe, 1951). It predicts extreme (singular) stresses are an-
ticipated to develop at the tip region of a propagation fracture (Freund, 1979; Reches and Dewers, 2005). It was later adopted to fault rupture during earthquakes propagation (Kostrov, 1964;Tinti et al., 2005). However, details of the Yoffe-like slip-pulse can-not be detected by seismic data (Shearer, 1999; McGarr, 1999;Tinti et al., 2005), in part due to the attenuation of high frequency waves. Thus, it is proposed here that the partial constitutive rela-tions of slip-pulse loading, as presented here and by Fukuyama and Mizoguchi (2010) and Chang et al. (2012), would provide the most relevant experimental proxy for the expected Yoffe-like fault slip during high-velocity, large slip-distance of earthquake rupture. We further suggest that numerical simulations of earth-quake dynamic rupture will use these friction–velocity relations (Liao et al., 2013) rather than the linear slip-weakening model (Fig. 9a) (Xu et al., 2012; Noda and Lapusta, 2013) or rate- and state-friction that are based on constant-velocity experiments.
Further, the present experiments show that the slip-pulse mode dissipates less energy than constant-velocity mode, as manifested by more intense dynamic weakening (Fig. 9b), lower energy dissi-pation during the fault weakening stage (Fig. 9c), and lower cumu-lative work during the entire slip event (Fig. 9d). The lower energy dissipation by the slip-pulse mode is likely to affect the rupture intensity. The rupture and slip of natural earthquakes dissipates the finite amount of elastic energy that was accumulated during the inter-seismic period. When a natural fault slips in a slip-pulse mode (rather than in constant-velocity), less energy is dissipated from the available finite amount, and thus more energy becomes available for longer slip-distance or rock damage.
Z. Liao et al. / Earth and Planetary Science Letters 406 (2014) 93–101 101
5.3. How does the loading mode control the frictional strength of the experimental fault?
The core result of our analysis is that the loading mode (Fig. 1) strongly affects the dynamic strength evolution (Fig. 7a) of the granite experimental faults. Thus, the effect of the loading mode should be considered in addition to the well documented effects of slip-velocity and normal stress (Di Toro et al., 2011). A possible mechanism for the loading mode effect was proposed by Chang et al. (2012) following their impact experiments (above) that are almost identical to the present slip-pulse experiments (Fig. 7b). Chang et al. (2012) showed that the experimental high acceleration occurs contemporaneously with intense wear-rate, abrupt weaken-ing, and short weakening distance (their Fig. 5). They suggested that the intense slip-acceleration (up to 25 m/s2 in their runs, up to 65 m/s2 in Niemeijer et al., 2011) increases the brittleness the fault block, and thus accelerates the formation of fine-grain gouge powder. They further proposed that this fast gouge forma-tion leads to fast dynamic weakening by powder lubrication (Han et al., 2010; Reches and Lockner, 2010; Sammis et al., 2011). Ac-cording to Chang et al. (2012), slip-acceleration (in addition to the classical slip-velocity and slip-distance) leads to strong fault weak-ening by gouge formation. This slip-acceleration effect can explain the present results. Variable-velocity loadings intrinsically include acceleration and deceleration periods of various intensities (Fig. 1). The slip-pulse, as modified Yoffe function, includes very intense acceleration, and the constant-velocity loading has negligible ac-celeration. Thus, the strength evolution is expected to be affected by timing and intensity of the slip-acceleration as experimentally observed.
Acknowledgements
Many thanks to Gulio Di Toro, David Lockner, Yehuda BenZion, and Einat Aharonov for fruitful discussion. The manuscript was sig-nificantly improved by the insightful reviews of Hiroyuki Noda, André Niemeijer and an anonymous reviewer. Support funds were provided by NSF “Geosciences, Equipment and Facilities” award 0732715, NSF Geosciences Geophysics award 1045414, DOI-USGS-NEHRP2011 award G11AP20008, and Science Foundation of China University of Petroleum, Beijing (No. 2462014YJRC013).
References
Ampuero, J.-P., Ben-Zion, Y., 2008. Cracks, pulses and macroscopic asymmetry of dynamical rupture on a biomaterial interface with velocity weakening friction. Geophys. J. Int. 173 (2), 674.
Anooshehpoor, A., Brune, J.N., 1999. Wrinkle-like Weertman pulse at the interface between two blocks of foam rubber with different velocities. Geophys. Res. Lett. 26, 2025–2028.
Boneh, Y., Sagy, A., Reches, Z., 2013. Frictional strength and wear-rate of carbon-ate faults during high-velocity, steady-state sliding. Earth Planet. Sci. Lett. 381, 127–137.
Brace, W.F., Byerlee, J.D., 1966. Stick–slip as a mechanism for earthquakes. Sci-ence 153, 990–992.
Byerlee, J.D., 1978. Friction of rocks. Pure Appl. Geophys. 116, 615–626.Chang, J.C., Lockner, D.A., Reches, Z., 2012. Rapid acceleration leads to rapid weak-
ening in earthquake-like laboratory experiments. Science 338, 101–105.Di Toro, G., Goldsby, D.L., Tullis, T.E., 2004. Friction falls towards zero in quartz rock
as slip velocity approaches seismic rates. Nature 427, 436–439.
Di Toro, G., et al., 2011. Fault lubrication during earthquakes. Nature 471, 494–498.Dieterich, J.H., 1979. Modeling of rock friction: 1. Experimental results and constitu-
tive equations. J. Geophys. Res. 84, 2161–2168.Freund, L.B., 1979. The mechanics of dynamic shear crack propagation. J. Geophys.
Res. 84, 2199–2209.Fukuyama, E., Mizoguchi, K., 2010. Constitutive parameters for earthquake rup-
ture dynamics based on high-velocity friction tests with variable slip rate. Int. J. Fract. 163, 15–26.
Han, R., Hirose, T., Shimamoto, T., 2010. Strong velocity weakening and power lubri-cation of simulated carbonate faults at seismic slip rates. J. Geophys. Res. 115 (B3). http://dx.doi.org/10.1029/2008JB006136.
Heaton, T.H., 1990. Evidence for and implications of self-healing pulses of slip in earthquake rupture. Phys. Earth Planet. Inter. 64, 1–20.
Hirose, Y., Shimamoto, T., 2005. Growth of molten zone as a mechanism of slip weakening of simulated faults in gabbro during frictional melting. J. Geophys. Res. 110, B05202. http://dx.doi.org/10.1029/2004JB003207.
Kostrov, B.V., 1964. Self-similar problems of propagation of shear cracks. J. Appl. Math. Mech. 28, 1077–1087.
Lapusta, N., 2009. The roller coaster of fault friction. Nat. Geosci. 2, 676–677.Liao, Z., Reches, Z., 2012. Modeling dynamic-weakening and dynamic-strengthening
of granite fault in high-velocity slip experiments. In: D’Amico, S. (Ed.), Earth-quake Research and Analysis. InTech, Rijeka, Croatia, pp. 107–125.
Liao, Z., Chang, J.C., Reches, Z., 2013. American Geophysical Union, Fall Annual Meet-ing, San Francisco, T41D-07, Dec. 9–13.
Lockner, D.A., Okubo, P.G., 1983. Measurements of frictional heating in granite. J. Geophys. Res. 88 (B5), 4313–4320.
Marone, C., 1998. The effect of loading rate on static friction and the rate of fault healing during the earthquake cycle. Nature 391, 69–71.
McGarr, A., 1999. On relating apparent stress to the stress causing earthquake fault slip. J. Geophys. Res., Solid Earth 104 (B2), 3003–3011.
Mizoguchi, K., Fukuyama, E., 2010. Laboratory measurements of rock friction at sub-seismic slip velocities. Int. J. Rock Mech. Min. Sci. 47, 1363–1371.
Mizoguchi, K., Hirose, T., Shimamoto, T., Fukuyama, E., 2007. Reconstruction of seis-mic faulting by high-velocity friction experiments: an example of the 1995 Kobe earthquake. Geophys. Res. Lett. 34, L01308. http://dx.doi.org/10.1029/2006GL027931.
Niemeijer, A., Di Toro, G., Nielsen, S., Felice, F.D., 2011. Frictional melting of gabbro under extreme experimental conditions of normal stress, acceleration, and slid-ing velocity. J. Geophys. Res. 116 (B7). http://dx.doi.org/10.1029/2010JB008181.
Noda, H., Lapusta, N., 2013. Stable creeping fault segments can become destructive as a result of dynamic weakening. Nature 493, 518–521.
Ohnaka, M., Yamashita, T., 1989. A cohesive zone model for dynamic shear faulting based on experimentally inferred constitutive relation and strong motion source parameters. J. Geophys. Res. 94, 4089–4104.
Passelegue, F.X., Schubnel, A., Nielsen, S., Bhat, Madariaga, R., 2013. From sub-Rayleigh to supershear ruptures during stick–slip experiments on crustal rocks. Science 340, 1208–1211.
Reches, Z., Dewers, T.A., 2005. Gouge formation by dynamic pulverization during earthquake rupture. Earth Planet. Sci. Lett. 235, 361–374.
Reches, Z., Lockner, D.A., 2010. Fault weakening and earthquake instability by pow-der lubrication. Nature 467, 452–455.
Sammis, C.G., Lockner, D.A., Reches, Z., 2011. The role of adsorbed water on the friction of a layer of submicron particles. Pure Appl. Geophys. http://dx.doi.org/10.1007/s00024-01-0324-0.
Scholz, C.H., 1998. Earthquakes and friction laws. Nature 391, 37–42.Shearer, P.M., 1999. Introduction to Seismology. Cambridge University Press, Cam-
bridge.Sone, H., Shimamoto, T., 2009. Frictional resistance of faults during accelerating and
decelerating earthquake slip. Nat. Geosci. 2, 705–708.Tinti, E., Fukuyama, E., Piatanesi, A., Cocco, M., 2005. A kinematic source-time
function compatible with earthquake dynamics. Bull. Seismol. Soc. Am. 95, 1211–1223.
Xu, S., Ben-Zion, Y., Ampuero, J.-P., 2012. Properties of inelastic yielding zones gen-erated by in-plane dynamic ruptures: I. Model description and basic results. Geophys. J. Int. 191, 1325–1342.
Yoffe, E., 1951. The moving Griffith crack. Philos. Mag. 42, 739–750.Zheng, G., Rice, J.R., 1998. Conditions under which velocity-weakening friction al-
lows a self-healing versus a crack-like mode of rupture. Bull. Seismol. Soc. Am. 88, 1466–1483.