Embed Size (px)
Citation preview
Page 1 of 6
Copyright 2012 by Z. Miller & P. O’Gorman COMPANION WEBSITES: http://www.google.com/earth/index.html http://www.discoverearthscience.com/regentses/units/mapping/labs/genystopotour/getopotour.kmz INTRODUCTION: When visualizing the earth’s surface it’s often difficult to envision three-dimensional features on a two-dimensional surface (i.e., a piece of paper). To help resolve this problem, scientists and anyone interested in the shape of the earth, rely on topographic maps – a tool that shows changes in elevation and surface features (roads, buildings, rivers, etc.) on earth. To help understand how topographic maps illustrate the earth’s shape, you will in this activity tour various areas of the earth using Google Earth® software. Specifically, to support your understanding of topographic maps, you will examine topographic maps as overlays – maps placed over the earth’s surface – in this Google Earth® activity. TERMS TO BE AWARE OF BEFORE STARTING THIS ACTIVITY: (Use the textbook/review book to define these terms.) Topography _________________________________________________________________________________________
__________________________________________________________________________________________________
Landscape _________________________________________________________________________________________
__________________________________________________________________________________________________
Field ______________________________________________________________________________________________
__________________________________________________________________________________________________
Isoline _____________________________________________________________________________________________
__________________________________________________________________________________________________
Contour Line ________________________________________________________________________________________
__________________________________________________________________________________________________
Gradient ___________________________________________________________________________________________
__________________________________________________________________________________________________
Benchmark _________________________________________________________________________________________
__________________________________________________________________________________________________
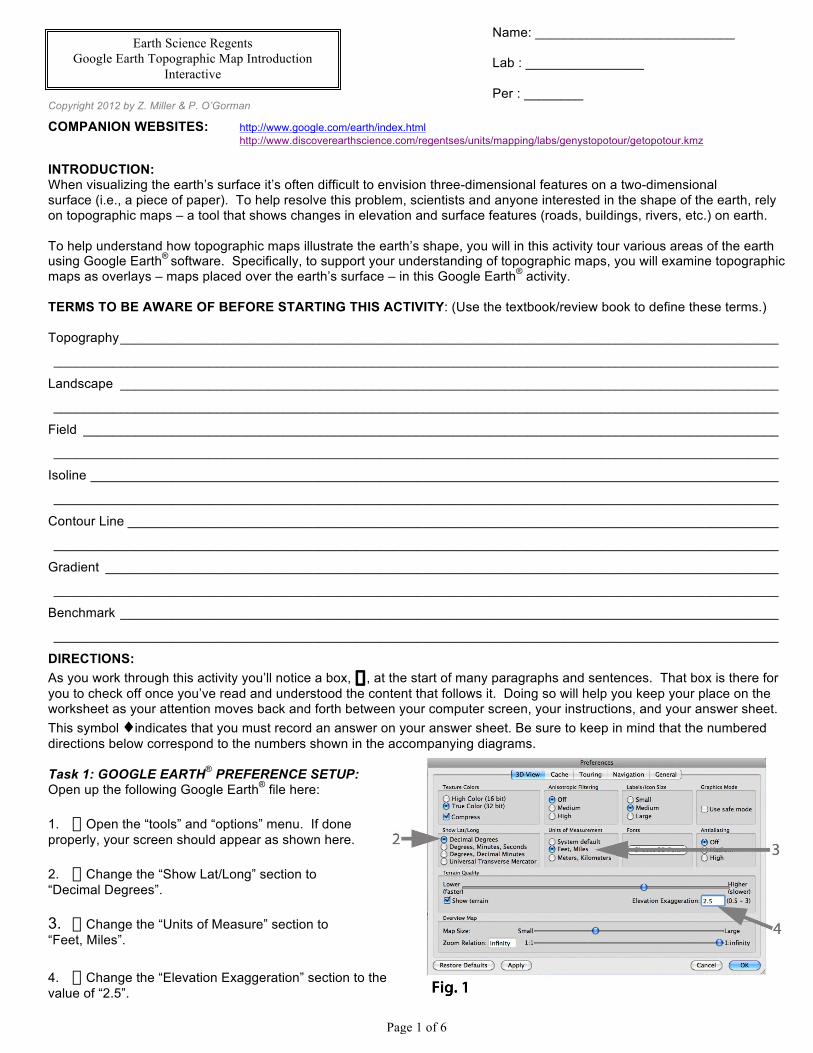
DIRECTIONS: As you work through this activity you’ll notice a box, � , at the start of many paragraphs and sentences. That box is there for you to check off once you’ve read and understood the content that follows it. Doing so will help you keep your place on the worksheet as your attention moves back and forth between your computer screen, your instructions, and your answer sheet. This symbol ♦indicates that you must record an answer on your answer sheet. Be sure to keep in mind that the numbered directions below correspond to the numbers shown in the accompanying diagrams. Task 1: GOOGLE EARTH® PREFERENCE SETUP: Open up the following Google Earth® file here: 1. � Open the “tools” and “options” menu. If done properly, your screen should appear as shown here. 2. � Change the “Show Lat/Long” section to “Decimal Degrees”. 3. � Change the “Units of Measure” section to “Feet, Miles”. 4. � Change the “Elevation Exaggeration” section to the value of “2.5”.
Earth Science Regents Google Earth Topographic Map Introduction
Interactive
Name: ___________________________ Lab : ________________ Per : ________
Page 2 of 6
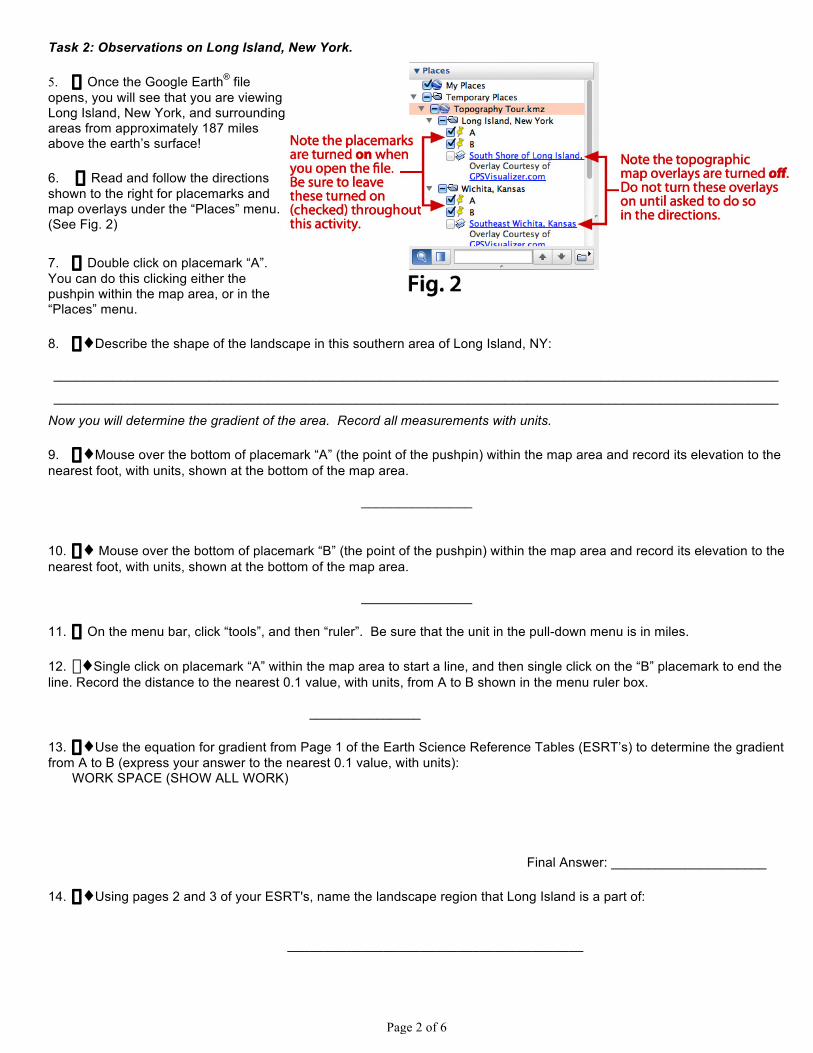
Task 2: Observations on Long Island, New York. 5. � Once the Google Earth® file opens, you will see that you are viewing Long Island, New York, and surrounding areas from approximately 187 miles above the earth’s surface! 6. � Read and follow the directions shown to the right for placemarks and map overlays under the “Places” menu. (See Fig. 2) 7. � Double click on placemark “A”. You can do this clicking either the pushpin within the map area, or in the “Places” menu. 8. �♦Describe the shape of the landscape in this southern area of Long Island, NY: __________________________________________________________________________________________________
__________________________________________________________________________________________________
Now you will determine the gradient of the area. Record all measurements with units.
9. �♦Mouse over the bottom of placemark “A” (the point of the pushpin) within the map area and record its elevation to the nearest foot, with units, shown at the bottom of the map area.
_______________ 10. �♦ Mouse over the bottom of placemark “B” (the point of the pushpin) within the map area and record its elevation to the nearest foot, with units, shown at the bottom of the map area.
_______________
11. � On the menu bar, click “tools”, and then “ruler”. Be sure that the unit in the pull-down menu is in miles.
12. �♦Single click on placemark “A” within the map area to start a line, and then single click on the “B” placemark to end the line. Record the distance to the nearest 0.1 value, with units, from A to B shown in the menu ruler box.
_______________
13. �♦Use the equation for gradient from Page 1 of the Earth Science Reference Tables (ESRT’s) to determine the gradient from A to B (express your answer to the nearest 0.1 value, with units):
WORK SPACE (SHOW ALL WORK)
Final Answer: _____________________
14. �♦Using pages 2 and 3 of your ESRT's, name the landscape region that Long Island is a part of:
________________________________________
Page 3 of 6
Task 2: Observations on Long Island, New York (Cont’d) 15. �♦Using your observations, calculation and responses from the above questions, write a complete description that defines the gradient and landscape of Long Island. Be sure to use numerical data (values with units) to support your observations. (Note: You must use the following words in your answer “plain”, “flat”, and “gradient”.) __________________________________________________________________________________________________
__________________________________________________________________________________________________
__________________________________________________________________________________________________
__________________________________________________________________________________________________
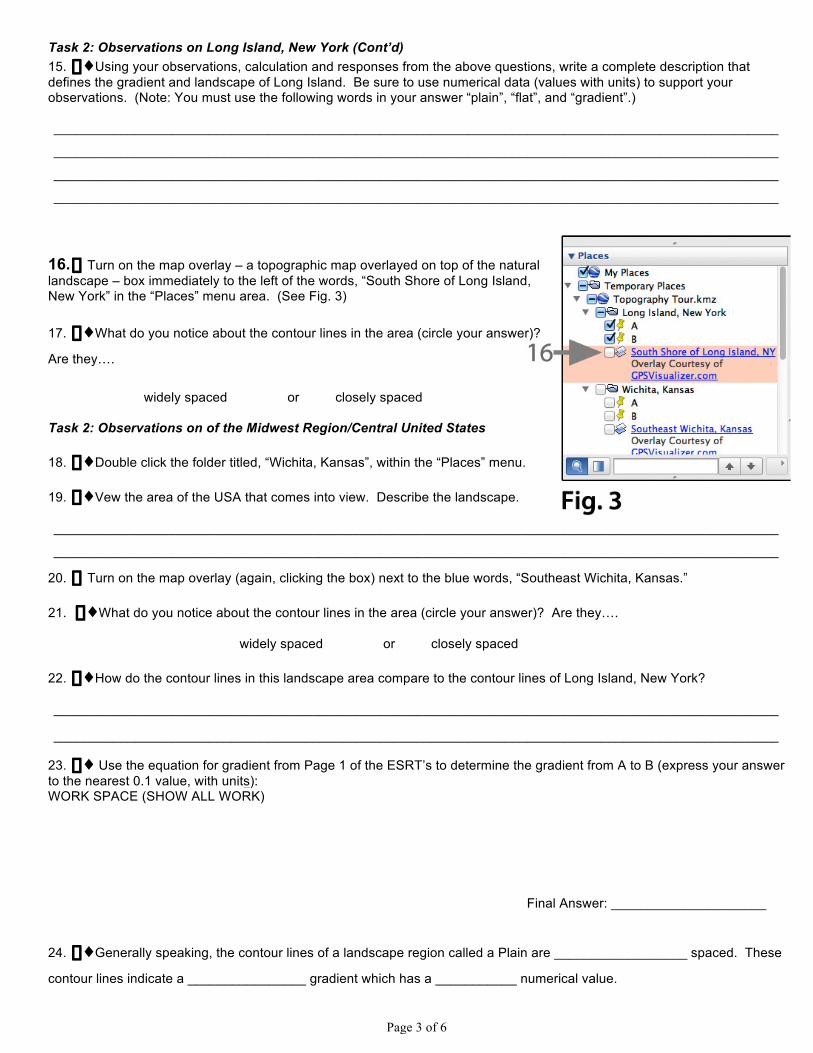
16. � Turn on the map overlay – a topographic map overlayed on top of the natural landscape – box immediately to the left of the words, “South Shore of Long Island, New York” in the “Places” menu area. (See Fig. 3) 17. �♦What do you notice about the contour lines in the area (circle your answer)?
Are they….
widely spaced or closely spaced Task 2: Observations on of the Midwest Region/Central United States 18. �♦Double click the folder titled, “Wichita, Kansas”, within the “Places” menu. 19. �♦Vew the area of the USA that comes into view. Describe the landscape. __________________________________________________________________________________________________
__________________________________________________________________________________________________
20. � Turn on the map overlay (again, clicking the box) next to the blue words, “Southeast Wichita, Kansas.”
21. �♦What do you notice about the contour lines in the area (circle your answer)? Are they…. widely spaced or closely spaced 22. �♦How do the contour lines in this landscape area compare to the contour lines of Long Island, New York? __________________________________________________________________________________________________
__________________________________________________________________________________________________
23. �♦ Use the equation for gradient from Page 1 of the ESRT’s to determine the gradient from A to B (express your answer to the nearest 0.1 value, with units): WORK SPACE (SHOW ALL WORK)
Final Answer: _____________________
24. �♦Generally speaking, the contour lines of a landscape region called a Plain are __________________ spaced. These
contour lines indicate a ________________ gradient which has a ___________ numerical value.
Page 4 of 6
TASK 3: Northern New York Mountains 25. � Double click the folder titled, “Northern New York Mountains” within the “Places” menu. 26. �♦ Use your ESRTs p. 3 to determine the name of this mountain. (Hint: This mountain is located in the “Adirondack Mountains” (see “Landscapes” map on ESRT's p. 2, and it is the only mountain labeled on ESRT's p. 3 in northern New York.)
__________________
27. � Important: Refer to #3 on p. 1 of this activity. In the same manner as you did in #3, change the settings of Google Earth® to metric values – “meters, and kilometers”.
28. �♦Using your mouse scroll over the top of this mountain and determine an approximate elevation (with units) shown at the bottom of the map area.
__________________
29. �♦What is the elevation value you wrote in #32 based upon? (Hint: It is how many meters above what?)
_________________________ 30. � Click on placemark “B” to fly into a valley on the west side of Mt. Marcy. NOTE: Do not turn off the check box for placemark “B” as you click on this placemark. 31. � Turn on the map overlay for the “Mountain Area” in the “Places” menu area.
32. �♦Using the overlay map contour lines, and not the elevation shown within the bottom of the map area within Google Earth®, determine the elevation of placemark “B” (note that the point of the pushpin is exactly on a contour line).
_______________ 33. �♦Using the overlay map contour lines, and not the elevation shown within the bottom of the map area within Google Earth®, determine the elevation of placemark “C” (note that the point of the pushpin is exactly on a contour line).
_______________
34. �♦Determine the difference in elevation (not the horizontal distance) between placemarks “B” and placemark “C” to the nearest whole meter. (Don’t forget those important units…)
WORK SPACE:
Answer: _______________ 35. � Considering your answer to #34, and the number of contour lines between placemarks B” and “C”, what is the contour interval on this map:
_______________

Page 5 of 6
TASK 3: Northern New York Mountains (Cont’d) 36. � Double click placemark “E”. This will fly you to a top-view (map or satellite view) of the stream valley. 37. � Describe the elevation of points and placemarks “D” and “E” compared to the stream between them.
__________________________________________________________________________________________________
__________________________________________________________________________________________________
38. �♦Describe the shape of the index contour line (1200 meters) which placemarks “D” and “E” are located on.
__________________________________________________________________________________________________
39. � Take a look at Figures 4a and 4b. These diagrams were created by tracing the contour map overlay you see within Google Earth®. The points shown on Fig. 4a are similar in terms of location (although not exactly the same) at placemarks “D” and “E” noted above. Fig. 4b. is a blank graph that will be used to construct a topographic profile from one side of the valley (point X), across the low point of the stream, and up the other side of the valley (point Y).
40. �♦ Using a scrap sheet of paper, mark the intersection of profile X-Y and the edge of your sheet of scrap paper.
41. �♦ Using the data from #47 (your scrap sheet), complete the y-axis scale on both sides of Fig. 4b.
42. �♦ Construct a profile using your scrap sheet of paper on Fig. 4b.
43. �♦ What is the horizontal distance between points X and Z on Fig. 4a (units included)
_______________ 44. �♦ What is the change in elevation between points X and Z on Fig. 4a (units included)
_______________ 45. �♦ Determine the gradient between points X and Z on based on Fig 4a (again, units included) WORK SPACE:
∆ Elevation = ______________
Distance = _____________
Answer: _______________
46. �♦ Repeat # 40, #41, and #42 to determine the gradient between points Y and Z on based on Fig 4a (again, units included)
WORK SPACE:
Answer: _______________
Page 6 of 6
(Northern New York Mountains (Cont’d)
47. �♦ Based on the profile you completed in #42, and the gradient calculations you performed in #45 and #46, write a clear summary as to how your math compares to your profile graph. Specifically, you should focus on how the north side of valley compares to the south side of valley near your X-Z-Y profile. __________________________________________________________________________________________________
__________________________________________________________________________________________________
__________________________________________________________________________________________________
__________________________________________________________________________________________________
48. �♦Using your observations, calculation and responses from the above questions, write a clear and concise reflection as to how gradient and topography relate to another after completing this lab activity: __________________________________________________________________________________________________
__________________________________________________________________________________________________
__________________________________________________________________________________________________
__________________________________________________________________________________________________