Embed Size (px)
Citation preview

75311237.1 0063442‐00015
Eastside 230 kV Project
Constraint and Opportunity Study
for Linear Site Selection
Prepared for
Puget Sound Energy
Prepared by
Tetra Tech, Inc.
19801 North Creek Parkway Bothell, WA 98011
December 2013

Eastside 230 kV Project Constraint and Opportunity Study for Linear Site Selection December 2013
Draft Routing Description 123013 iii
75311237.1 0063442‐00015
Contents 1. Executive Summary ................................................................................................................................ 1
2. Overview .................................................................................................................................................. 5
3. Process ....................................................................................................................................................... 8
3.1 Identify 230 kV Source and Substation Locations ..................................................................... 8
3.2 Define Project Study Area ............................................................................................................ 8
3.3 Available GIS Data Bases Used for Constraints and Opportunity Analysis ....................... 10
3.4 Primary GIS Categories Considered for Constraints and Opportunities ............................ 13
3.4.1 Utilities ............................................................................................................................ 13
3.4.2 Transportation ................................................................................................................ 15
3.4.3 Slope and Slope Stability .............................................................................................. 18
3.4.4 Habitat ............................................................................................................................. 23
3.4.5 Land Ownership ............................................................................................................ 26
3.4.6 Zoning/Land Use ........................................................................................................... 28
3.4.7 Structures ........................................................................................................................ 30
3.4.8 Parks and Recreation ..................................................................................................... 33
3.4.9 Historic Sites ................................................................................................................... 35
3.4.10 Visual Resources ............................................................................................................ 37
3.4.11 Waterbodies and Wetlands .......................................................................................... 37
3.4.12 Plants and Vegetation ................................................................................................... 39
3.5 LRT Analysis of GIS Mapped Constraints and Opportunities ............................................. 39
3.6 Selection of Alternatives to Carry Forward ............................................................................. 43
4. Conclusion and Next Step: Viable Segments and Recommended Routes ................................ 47
5. Report Limitations ................................................................................................................................ 48

Eastside 230 kV Project Constraint and Opportunity Study for Linear Site Selection December 2013
Draft Routing Description 123013 iv
75311237.1 0063442‐00015
FIGURES Figure 1‐1. General Corridor for Eastside 230 kV Project .................................................................. 4
Figure 2‐1. General Corridor for Eastside 230 kV Project .................................................................. 7
Figure 3‐1. Route Development Process ............................................................................................... 8
Figure 3‐2. Study Area ............................................................................................................................ 9
Figure 3‐3. Utilities ................................................................................................................................ 14
Figure 3‐4. Transportation .................................................................................................................... 17
Figure 3‐5. Unspanable Slope............................................................................................................... 19
Figure 3‐6. How Unspanable Slope Is Derived ................................................................................. 20
Figure 3‐7. Slope Stability ..................................................................................................................... 22
Figure 3‐8. Salmonid Streams .............................................................................................................. 25
Figure 3‐9. Land Ownership ................................................................................................................ 27
Figure 3‐10. Zoning ................................................................................................................................. 29
Figure 3‐11. Structure Buffer Process .................................................................................................... 31
Figure 3‐12. Buffered Address Locations ............................................................................................. 32
Figure 3‐13. Special Land Use Designations ........................................................................................ 34
Figure 3‐14. Historic Parcels and Points ............................................................................................... 36
Figure 3‐15. Water and Wetlands .......................................................................................................... 38
Figure 3‐16. LRT Constraints and Opportunities, Corridor Grid and Route Alternatives ........... 42
Figure 3‐17. Route Alternatives with Unique Identifiers ................................................................... 45
TABLES Table 1‐1. Route Segment Composition .............................................................................................. 3
Table 3‐1. Analysis Attributes and Data Sources ............................................................................ 11
Table 3‐2. Route Segment Composition ............................................................................................ 44

Eastside 230 kV Project Constraint and Opportunity Study for Linear Site Selection December 2013
Draft Routing Description 123013 1
75311237.1 0063442‐00015
1. Executive Summary
PSE’s System Planning evaluated a variety of options for addressing the Eastside’s growing
energy needs including conservation, local generation, and infrastructure improvements
(e.g., transmission lines and substations). They found that even with aggressive
conservation efforts, demand will outstrip supply in a few years. Additionally, local
generation would be difficult to execute in a timely manner and ultimately would not meet
long‐term needs.
Based on PSE’s technical evaluation of potential solutions, the most effective way to ensure
the Eastside’s power system will meet growing demand is to add a new 230 kV transmission
line to connect PSE’s Sammamish (Redmond) and Talbot Hill substations (Renton). With
these endpoints in mind, PSE contracted with Tetra Tech, Inc. to employ a geographic
information system (GIS)‐based Linear Routing Tool (LRT) to conduct a broad evaluation of
possible transmission line routes.
The LRT is a tool developed by Tetra Tech based on commercially available geospatial
technology and Tetra Tech’s linear routing experience (see Appendix A). It is a collaborative
process that combines powerful analytical software with project experience, system
planning, engineering, land use and local knowledge considerations. The LRT is an
innovative geospatial tool that identifies the most suitable route alternatives based on
modeled environmental and infrastructure factors. PSE and Tetra Tech began this process
by identifying a study area of approximately 255 square miles that encompasses the
Sammamish Substation in the north and the Talbot Hill Substation in the south. The study
area is bounded on the west by the eastern shore of Lake Washington and extends eastward
to include the BPA corridor near Soaring Eagle Regional Park (located northeast of the City
of Sammamish). Any new transmission line route must connect to a new 230 kV to 115 kV
transformation site within this area in order to solve the problem. Potential transformation
sites within the study area include Lakeside, Westminster, and Vernell substations, which
are all located in the City of Bellevue.
Tetra Tech staff collected existing available data and GIS files for land ownership, land use,
public and private rights‐of‐way (ROW), wildlife, vegetation, threatened and endangered
(T&E) species, environmentally critical areas, topography, historical resources, and other
factors that would influence the location of the proposed transmission line, such as structure
locations. The data collection process was designed to provide geospatial information on
Eastside 230 kV Project Constraint and Opportunity Study for Linear Site Selection December 2013
Draft Routing Description 123013 2
75311237.1 0063442‐00015
criteria that could represent credible baseline opportunities and/or constraints for the
location of an above‐ground transmission line.
A team of LRT experts, system planners, engineers, land use planners and environmental
professionals (Project Team) individually weighted various data layers of the model to
reflect the varying degree of constraints or opportunities for each data set. The team
assigned values to the data layers using a progressive scale of values ranging from the
greatest constraint, such as endangered species, residences and safety hazards, to the
greatest opportunity, such as existing PSE transmission lines.
The LRT combined these data layers and created an output file called the suitability grid,
which represents a summation of all the constraints and opportunities for every point (grid
cell) across the entire study area. The LRT modeled preferred corridors across the suitability
grid that pass through the transformation site options within the study area. These
preferred corridors were used to develop alternative routes. To provide for more flexibility
in the route analysis, each route was partitioned at the crossing points of routes to create
unique segments. Each unique LRT segment was validated using professional engineering
judgment and available ancillary resources such as aerial photographs, to help assess
whether they were feasible options. Once the segments were generated and validated, a
composite score was calculated for each segment from the underlying suitability grid. A
deterministic model was then used that considered more than 500 combinations of segments
and transformation sites. If parallel segments (i.e., typically less than a block apart) were
identified during the model evaluation, LRT scores were compared to determine which
segment would be used to develop routes.
The LRT scores were used to eliminate from further consideration routes that were not
considered viable options. Approximately the top five percent of the positive routes were
then mapped to facilitate further discussion and evaluation.
The mapping exercise revealed that there are four general subareas, which when combined,
formed a “ladder” of route alternatives. The “leg” components of the ladder comprised the
north‐south running routes connecting Sammamish, Talbot Hill, and one of the new
transformation substations. Moving east to west between the “legs” could be accomplished
by using one of the three cross‐over segments or “rungs.” The only exception to this being
an additional north‐south segment situated in the central part of the study area, south of I‐
90. To simplify future discussion, each of the fourteen legs and rungs were given a unique
identifier (Figure 1‐1). All of the mapped segment combinations can be used to develop a
route that meets the goal of connecting the Sammamish with the Talbot Hill substation,

Eastside 230 kV Project Constraint and Opportunity Study for Linear Site Selection December 2013
Draft Routing Description 123013 3
75311237.1 0063442‐00015
while connecting to any one of the three intermediary substations. Further route refinement
will continue during the on‐the‐ground data collection phase and public process,
culminating in the selection of a preferred route.
Table 1-1. Route Segment Composition
Vernell 248 Vernell 249 Westminster
217 Lakeside 155 Lakeside 160 Lakeside 166 A A A A A A
B B C C C C
F F D E E E
H H F G2 G2 J
K1 L H G1 I M
K2 N L H K1 N
M N L L
N N N

Eastside 230 kV Project Constraint and Opportunity Study for Linear Site Selection December 2013
Draft Routing Description 123013 4
75311237.1 0063442‐00015
Figure 1-1. General Corridor for Eastside 230 kV Project

Eastside 230 kV Project Constraint and Opportunity Study for Linear Site Selection December 2013
Draft Routing Description 123013 5
75311237.1 0063442‐00015
2. Overview
PSE System Planning conducted a needs assessment reviewing population trends, electric
load growth, economic development patterns, conservation programs, energy efficiency
improvements, and other key trends pertaining to power demand. Studies reveal that
different parts of the transmission system will overload, or be close to overloading, within
the 10‐year study period (2012‐2022) and more specifically, by 2017.
PSE’s System Planning evaluated a variety of options for addressing the Eastside’s growing
energy needs including conservation, local generation, and infrastructure improvements
(e.g., transmission lines and substations). They found that even with aggressive
conservation efforts, demand will outstrip supply in a few years. Additionally, local
generation would be difficult to execute in a timely manner and ultimately would not meet
long‐term needs.
System Planning’s review determined that system infrastructure improvements must be
made to resolve the deficiency issue. These system infrastructure improvements will
address the following issues:
Overload of PSE electrical facilities in the Eastside Area;
Small margin of error to manage risks from inherent load forecast uncertainties;
Increasing use and expansion of Corrective Action Plans;
Emerging regional impacts identified by the ColumbiaGrid.
To meet the objectives above, PSE had to first identify 230 kV sources and then identify
potential transformation sites (to convert 230 kV to 115 kV for distribution) between those
sources. The new transformation site will be a 230 kV to 115 kV substation. The next step
was to determine a study area between the source endpoints and evaluate the possible
routes to make this connection using a 230 kV transmission line (Figure 2‐1).
Seeking an objective fact‐based evaluation, PSE contracted with Tetra Tech, Inc. to employ a
geographic information system (GIS)‐based Linear Routing Tool (LRT) to conduct a broad
evaluation of possible transmission line routes. The LRT is a collaborative process that
combines powerful analytical software with project experience, system planning,
engineering, land use and local knowledge considerations. The LRT is an innovative
geospatial tool that identifies the most suitable route alternatives based on modeled

Eastside 230 kV Project Constraint and Opportunity Study for Linear Site Selection December 2013
Draft Routing Description 123013 6
75311237.1 0063442‐00015
environmental and infrastructure factors that are available in GIS format. The purpose of
this study was to do a high‐level review of significant and well known factors that affect
route siting using available data in GIS format, to develop possible routes for further study.
The first steps of the LRT process were to define elements that were positive or negative for
siting the proposed 230 kV transmission line and to collect the related data. These elements
were defined as constraints and opportunities. GIS available data was collected for land
ownership, land use, public and private rights‐of‐way (ROW), wildlife, vegetation,
threatened and endangered (T&E) species, environmentally critical areas, topography,
historical resources, and other factors that would influence the location of the proposed
transmission line, such as structure locations.
With the GIS data compiled, a team of LRT experts, system planners, engineers, land use
planners and environmental professionals (Project Team) individually weighted various
data layers of the model to reflect the varying degree of constraints or opportunities for each
data set. The LRT combined these data layers to create a suitability grid, summarizing all
the constraints and opportunities for every point (grid cell) across the entire study area. This
grid was used to develop suitable corridors and routes, and in turn those routes were broken
down into segments. These segments were individually weighted so that more than 500
routes could be put together and mathematically considered.
The result of all this evaluation and modeling was that the top recommended segments
could be combined to form five possible route options for further evaluation through public
input, stakeholder review, further land use/zoning and environmental requirements review,
and real estate review.

Eastside 230 kV Project Constraint and Opportunity Study for Linear Site Selection December 2013
Draft Routing Description 123013 7
75311237.1 0063442‐00015
Figure 2-1. General Corridor for Eastside 230 kV Project

Eastside 230 kV Project Constraint and Opportunity Study for Linear Site Selection December 2013
Draft Routing Description 123013 8
75311237.1 0063442‐00015
3. Process
The development of possible transmission line routes followed a six‐step process that
culminated in a set of alternatives that could be further evaluated. The steps included:
Figure 3-1. Route Development Process
3.1 IDENTIFY 230 KV SOURCE AND SUBSTATION LOCATIONS
At the beginning of the routing effort, the Sammamish and Talbot Hill Substations were
defined as the 230 kV source for the project. Potential intermediate transformation (new 230
kV to 115 kV substation) sites between the Sammamish and Talbot Hill Substations were
identified by PSE and used to help define the study area. The potential new transformation
sites included PSE‐owned property at the future Vernell and Westminster substations, and
the existing Lakeside Substation. In addition, a new site referred to as Woodridge was
considered based on its location. Ultimately the Lakeside, Westminster, and Vernell sites
were selected as they meet the necessary minimum dimensions and are owned by PSE.
3.2 DEFINE PROJECT STUDY AREA
The next step was to establish a study area that was defined as a boundary that generally
encompassed the 230 kV source substations locations and the potential routes to connect
them. Therefore, the study area encompasses the Sammamish Substation in the north, the
Talbot Hill Substation in the south, the eastern shore of Lake Washington in the west, and
eastward to near Soaring Eagle Regional Park in King County, east of the City of
Sammamish. Figure 3‐2 shows the extent of the study area used during the constraint and
opportunity analysis.
Identify Source and
Substation Locations
Define Project Study
Area
Define Constraints and
Opportunities
Recommend
Alternatives to Carry
Forward
Identify Alternative
Transmission Routes
Collect Constraint and
Opportunity Data

Eastside 230 kV Project Constraint and Opportunity Study for Linear Site Selection December 2013
Draft Routing Description 123013 9
75311237.1 0063442‐00015
Figure 3-2. Study Area

Eastside 230 kV Project Constraint and Opportunity Study for Linear Site Selection December 2013
Draft Routing Description 123013 10
75311237.1 0063442‐00015
Once the boundaries of the study area were established, the Project Team identified and
delineated constraints and opportunities to siting the transmission line. Constraints are
defined as resources or conditions that potentially limit project siting because of regulations
or engineering requirements associated with facility construction and operation.
Opportunities are defined as resources or conditions that can accommodate facility
permitting, construction, or operation. The following sections describe the GIS data sets that
were collected to analyze these constraints and opportunities, describe the key categories of
constraint and opportunity factors in the study area based on GIS data sets, and summarize
how the GIS data were processed in preparation for route development.
3.3 AVAILABLE GIS DATA BASES USED FOR CONSTRAINTS AND OPPORTUNITY ANALYSIS
Based on the defined study area, Tetra Tech collected readily available GIS data sets to use in
the LRT model. Data collection was based on the constraint and opportunity factors used in
the analysis. The data used in routing were subjected to a defined process of preparation
and analysis before being used in the LRT as described below. Preparation of data began
with the compilation of multiple layers into a geodatabase. Data layers were then quality
checked and evaluated for project usefulness, including reliability and accuracy based on
available maps. If the data passed the quality check, the data then went through several
additional geoprocessing steps in order to be ready to input into the LRT. Where
appropriate, buffer areas were added to the data based on how the feature would impact the
transmission line route. These buffers were necessary to ensure line routes would not go
over the top of structures, down the center of vehicular travel lanes, as well as allowing for
adequate area to physically accommodate a 230 kV line. Buffers added to specific data
layers are described in Section 3.6 Existing Conditions and in Table 3‐1, below.
Data for the constraint and opportunity analysis were obtained from a variety of county,
state, and federal GIS database sources (see Table 3‐1). These GIS databases included the
Washington Department of Natural Resources (WDNR), Department of Fish and Wildlife
(WDFW), Department of Transportation (WSDOT), and State Parks and Recreation
Commission (WSPRC); the US Fish and Wildlife Service (USFWS); the King County
Assessor’s Office, Department of Development and Environmental Services (DDES), and
Department of Natural Resources (DNR); and Tetra Tech. This information was
supplemented by the review of aerial photography and local knowledge. The following
discussion outlines specific data sets collected for this project and their sources.

Eastside 230 kV Project Constraint and Opportunity Study for Linear Site Selection December 2013
Draft Routing Description 123013 11
75311237.1 0063442‐00015
Table 3-1. Analysis Attributes and Data Sources
Attribute Data Source
Existing and Proposed Linear Corridors
PSE transmission corridors PSE
PSE 55 kV corridor PSE
BPA transmission corridors PSE
Natural gas pipeline Photo interp. and King County
Highways and roads King County
Arterial road corridors Interp. of King County roads
Railroads ESRI Streetmap, King County, Sound Transit
Abandoned rail corridor Photo interp. and King County parcels
Land Ownership, Land Use and Special Designated Uses
Land Ownership
Rights-of-way King County
Parcels King County Assessor
Transfer of development rights King County Assessor
BNSF Railroad parcel boundaries (active) King County
Land Use/Future Land Use
Structures King County
Coal mine King County
Renton municipal airport Photo interp. and King County parcels
Airports clear zone Photo interp. and analysis
Residential King County
Special Land Use Designation
Parks King County
Recreational trails King County
Scenic byways WSDOT
Soils, Topography, and Geology
Unspanable slope 20 to < 40% King County LiDAR and analysis
Unspanable slope >= 40% King County LiDAR and analysis
Slopes 20%+ King County LiDAR and analysis
Slopes 40%+ King County LiDAR and analysis
Landslide potential WDNR
Elevation – LiDAR King County
Water Resources
Lakes King County
Floodways and floodplains King County
Wetland Resources
Wetlands – large USFWS, National Wetlands Inventory

Eastside 230 kV Project Constraint and Opportunity Study for Linear Site Selection December 2013
Draft Routing Description 123013 12
75311237.1 0063442‐00015
Attribute Data Source
Wetlands – SAO King County
Wildlife
Chinook salmon streams USFWS
Waterfowl areas WDFW
Great blue heron rookeries WDFW
Bald eagle management areas WDFW
Natural Heritage locations WADNR
Historic Resources
Historic register and districts WADAHP
Historic property inventory - named WADAHP
Heritage barns WADAHP
Various King County agencies maintain extensive GIS databases on natural and built
environment conditions within the county. Tetra Tech purchased several King County GIS
data sets on DVD for use in the analysis. Many of these GIS data sets were used directly in
the analysis, or processed to derive new data to represent constraints and opportunities,
including the following:
Airpark
Airport clear zone
Arterial road corridors
Water pipeline corridors
BPA substation
Railroads and railroad corridors
Public right‐of‐way
Parcels
Structures (based on address points)
Residential areas
Coal mine
Parks
Recreational trails
Streams and rivers
Lakes
Floodways and floodplains

Eastside 230 kV Project Constraint and Opportunity Study for Linear Site Selection December 2013
Draft Routing Description 123013 13
75311237.1 0063442‐00015
Wetlands – SAO
Historic points
Contours
Unspanable slope 20 to < 40%
Unspanable slope >= 40%
Slopes 20%+
For the purpose of this process, only data sets that were readily available and in GIS form were
used. Constraints of opportunities that were not easily identified in an available GIS data set (such
as cultural resources, real estate issues, electric distribution lines, or non‐high pressure natural gas
pipelines) were not considered for the purposes of this study, but will be evaluated in future steps.
3.4 PRIMARY GIS CATEGORIES CONSIDERED FOR CONSTRAINTS AND OPPORTUNITIES
Study area conditions applicable to the key categories of constraints and opportunities are
described below, along with a description of how the data were preprocessed for analysis.
3.4.1 Utilities
3.4.1.1 Transmission
The existing PSE 115 kV corridor runs between the Sammamish substation, the Lakeside
substation, and the Talbot Hill substation (Figure 3‐3). Transmission line corridors owned
by BPA run along the north, east and south boundaries of the study area.

Eastside 230 kV Project Constraint and Opportunity Study for Linear Site Selection December 2013
Draft Routing Description 123013 14
75311237.1 0063442‐00015
Figure 3-3. Utilities

Eastside 230 kV Project Constraint and Opportunity Study for Linear Site Selection December 2013
Draft Routing Description 123013 15
75311237.1 0063442‐00015
PSE provided the locations of existing transmission corridors between the Sammamish and
Talbot Hill Substations. PSE 115 kV and 55 kV transmission corridor systems were
considered opportunities in the analysis. PSE’s transmission system is primarily operated at
115 kV; however, a remnant 55 kV corridor still exists in the southern portion of the study
area. This corridor can be upgraded to a higher voltage without a change in land use, so it
was considered an opportunity. In order to accommodate the space requirements for the
proposed 230 kV line, a buffer was applied to the 55 kV line corridor before including it in
the analysis.
Based on past experience, BPA does not allow additional third party transmission lines
within their corridors; therefore, existing BPA transmission corridors were considered a
constraint. However, an 80 ft corridor (minimal area required for a transmission line) was
created adjacent to BPA corridors and used in the analysis as an opportunity, since
paralleling existing corridors is typically considered favorable during the permitting process.
3.4.1.2 High Pressure Natural Gas Pipeline (Northwest Pipeline)
High‐pressure natural gas pipelines run along some arterial roads in the study area. The
north‐south trending sections potentially provide the most benefit, such as along 148th Ave.
NE between NE 70th St. and Bel‐Red Rd.; however, these sections are only small
opportunities and do not contribute significantly to the siting analysis.
3.4.1.3 Fuel Pipeline (Olympic)
The Olympic Pipeline (fuel products) corridor is co‐located with PSE’s existing 115 kV
corridor (between Sammamish and Talbot Hill) for most of its length in the study area. As a
result, it was not included in the analysis so that the existing 115 kV corridor would not be
double counted as an opportunity.
3.4.2 Transportation
3.4.2.1 Roads
The major vehicular routes through the study area are Interstate Highway 405 (I‐405), I‐90
and Washington State Route (SR) 520. Nineteen miles of I‐405 runs north‐south through the
west side of the study area; I‐90 runs east‐west through roughly the center of the study area;
and SR 520 meanders roughly east‐west through the northern third of the study area (Figure
3‐4). I‐405 runs through the study area from Kirkland, through Bellevue, along the east side
of Lake Washington, and finally through Renton in the south. I‐90 runs across the north end
of Mercer Island in the west, through Eastgate (Bellevue), past the southern tip of Lake
Sammamish and finally through Issaquah and High Point in the east. SR 520 starts in Hunts

Eastside 230 kV Project Constraint and Opportunity Study for Linear Site Selection December 2013
Draft Routing Description 123013 16
75311237.1 0063442‐00015
Point alongside Lake Washington, passes through Clyde Hill and Bellevue, and then
terminates in Redmond along the northern edge of Marymoor Park. Based on past
experience, the Interstate travel routes are considered impedances, as installation of
transmission lines within those corridors has not been allowed. Additionally, in some
locations spanning of such travel routes is restricted by WSDOT. Throughout the study
area, there are several smaller state highways with similar restrictions. However, the study
area is dominated with arterial roads, which are typically considered opportunities for
transmission line routing. Arterial roads are often paralleled by existing transmission lines
or distribution lines that can be overbuilt with transmission line, thereby affording a viable
passage route through areas that have existing development.
To prepare arterial road corridors for analysis, King County’s Transportation Network layer
was buffered by 45 ft on either side of the road centerline. This provided the area necessary
to place a 230 kV line along the roadways. A second buffer of 20 ft on both sides of the road
centerline was then removed from the 45 ft buffer to create the polygons that roughly
represent the buildable opportunity while excluding the paved surface. This approach was
used to create an opportunity for routing along paved roadways.

Eastside 230 kV Project Constraint and Opportunity Study for Linear Site Selection December 2013
Draft Routing Description 123013 17
75311237.1 0063442‐00015
Figure 3-4. Transportation

Eastside 230 kV Project Constraint and Opportunity Study for Linear Site Selection December 2013
Draft Routing Description 123013 18
75311237.1 0063442‐00015
3.4.2.2 Railroads
The Eastside Rail Corridor, which was formerly the BNSF railroad line, runs parallel to I‐405
and Lake Washington in the western part of the study area. Although portions of this
corridor have been mapped as “parks” lands, PSE has purchased easement rights along the
majority of the corridor. This corridor offers routing opportunities for the proposed line
because it is considered abandoned throughout the study area, and it runs in a north‐south
direction. There are some segments, such as along the southeastern edge of Lake
Washington, that are also considered “rail banked,” however, since this was considered only
a minor impedance, the combined values of abandoned plus rail banked still leave this
corridor as a relatively strong opportunity. Rail banks constitute rail corridors that can be
converted to trails and other uses, while still preserving the ability to revert back to rail use
under certain conditions.
Where active rail corridors existed, a 50‐foot buffer was applied to provide an adjacent area
of opportunity that would parallel them. For abandoned rail corridors, no buffer was
applied because the corridor itself provided the opportunity.
3.4.3 Slope and Slope Stability
3.4.3.1 Slope
The topography of the study area is composed of mostly flat terrain and rolling hills
separated by small valleys. The most significant topographic features running east‐west are
the incised drainages created by the rivers draining into Lake Washington. These include
the Cedar River, May Creek, Coal Creek, and Richards Creek.
PSE design standards and experience indicate that transmission line construction on slopes
greater than 20 percent is difficult, requiring special engineering measures, while slopes
greater than 40 percent should be avoided. Areas with slopes greater than or equal to 20
percent were calculated from the elevation model. All slope areas greater than or equal to 20
percent were not included in the steep slope layer if at least 200 ft per slope was not present
to site the transmission line. The remaining high‐slope areas are wider than the standard
structure span for the project, and were therefore considered “unspanable.” The same
process was done for slopes greater than or equal to 40 percent (Figure 3‐5). If an area with a
steep slope can be spanned within standard design limitations, then the slope is not
considered an impediment to a specific route. Figure 3‐6 explains graphically how the final
result was attained.

Eastside 230 kV Project Constraint and Opportunity Study for Linear Site Selection December 2013
Draft Routing Description 123013 19
75311237.1 0063442‐00015
Figure 3-5. Unspanable Slope

Eastside 230 kV Project Constraint and Opportunity Study for Linear Site Selection December 2013
Draft Routing Description 123013 20
75311237.1 0063442‐00015
Figure 3-6. How Unspanable Slope Is Derived

Eastside 230 kV Project Constraint and Opportunity Study for Linear Site Selection December 2013
Draft Routing Description 123013 21
75311237.1 0063442‐00015
3.4.3.2 Slope Stability
Figure 3‐7 shows the various levels of slope stability. As shown, the large majority of land
has stable slopes, including the existing PSE corridor. Areas of high instability occur mostly
along valley walls. To reduce potential impacts, GIS mapped unstable slopes were avoided
to the extent possible. This factor is important, especially during construction.

Eastside 230 kV Project Constraint and Opportunity Study for Linear Site Selection December 2013
Draft Routing Description 123013 22
75311237.1 0063442‐00015
Figure 3-7. Slope Stability

Eastside 230 kV Project Constraint and Opportunity Study for Linear Site Selection December 2013
Draft Routing Description 123013 23
75311237.1 0063442‐00015
3.4.4 Habitat
3.4.4.1 Waterfowl, Heron Rookeries and Bald Eagle Management Zones
Locations of priority habitat features were acquired from the WDFW GIS database. The
identified priority habitat features in the study area are waterfowl areas, great blue heron
rookeries, and bald eagle management zones. WDFW has identified priority waterfowl
areas at the north and south ends of Lake Sammamish, Phantom Lake, Juanita Bay (part of
Lake Washington), and several smaller lakes in the region that are classified as “Lakes With
Waterfowl Use.” The transmission line alternatives under consideration do not cross any of
these GIS features.
Great blue heron rookeries are scarce within the study area. The nearest GIS mapped
rookery to any alternative is 0.3 miles away in the Mercer Slough Nature Park.
Bald eagle management zones are designated by WDFW according to current conservation
guidelines, and their locations were used unaltered in the analysis. Development of any
transmission line within a bald eagle management zone will be subject to review and
regulation by WDFW.

Eastside 230 kV Project Constraint and Opportunity Study for Linear Site Selection December 2013
Draft Routing Description 123013 24
75311237.1 0063442‐00015
3.4.4.2 Fish and Wildlife Species
Streams in the Puget Sound region that provide Chinook salmon habitat are protected under
the federal Endangered Species Act (ESA) and are considered a constraint to be avoided or
spanned (Figure 3‐8). Data for streams with known Chinook salmon use were acquired from
the U.S. Fish and Wildlife Service (USFWS) GIS database. These mapped streams can be
typically be avoided or spanned.

Eastside 230 kV Project Constraint and Opportunity Study for Linear Site Selection December 2013
Draft Routing Description 123013 25
75311237.1 0063442‐00015
Figure 3-8. Salmonid Streams

Eastside 230 kV Project Constraint and Opportunity Study for Linear Site Selection December 2013
Draft Routing Description 123013 26
75311237.1 0063442‐00015
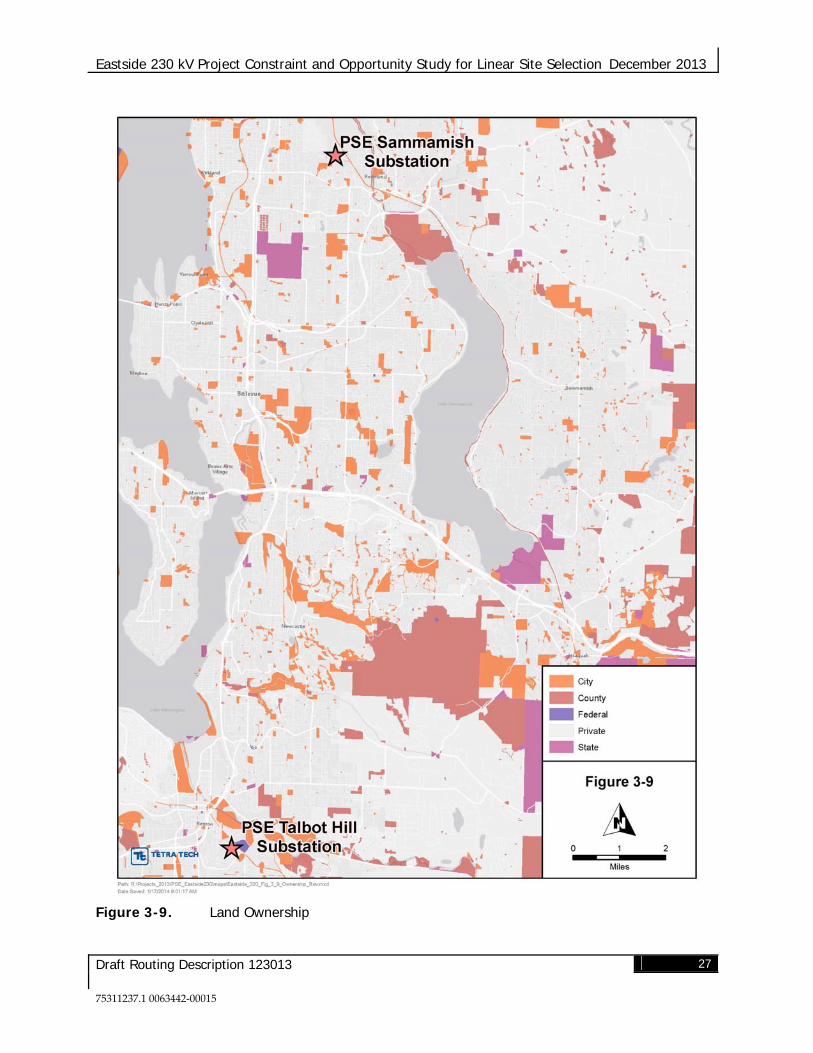
3.4.5 Land Ownership
The optimum location of the transmission line is across land that allows for sufficient access,
such as an easement owned by PSE, as this facilitates performance of maintenance and
vegetation management in accordance with applicable clearance and safety requirements.
As shown on Figure 3‐9, private ownership is the predominant land owner type in the study
area and would be a constraint if the transmission line had to traverse it. However, it is
expected that most of the line can be constructed along existing road/utility corridors or
overbuilt at existing overhead electrical line structure locations on PSE easement where the
setting already includes both vertical and horizontal linear transmission facilities.
Eastside 230 kV Project Constraint and Opportunity Study for Linear Site Selection December 2013
Draft Routing Description 123013 27
75311237.1 0063442‐00015
Figure 3-9. Land Ownership

Eastside 230 kV Project Constraint and Opportunity Study for Linear Site Selection December 2013
Draft Routing Description 123013 28
75311237.1 0063442‐00015
3.4.6 Zoning/Land Use
Zoning and land use patterns were considered for purposes of this study based on two
available GIS databases, a GIS database on current zoning (setting forth envisioned land use
patterns such as agricultural, residential, commercial, etc.), and the tax assessors database
based on current type of land use (commercial, residential, etc.). According to the zoning
database, most of the land in the study area is zoned residential (Figure 3‐10). More specific
zoning and land use patterns and land use policy considerations will be evaluated in the
next step of the process.

Eastside 230 kV Project Constraint and Opportunity Study for Linear Site Selection December 2013
Draft Routing Description 123013 29
75311237.1 0063442‐00015
Figure 3-10. Zoning

Eastside 230 kV Project Constraint and Opportunity Study for Linear Site Selection December 2013
Draft Routing Description 123013 30
75311237.1 0063442‐00015
3.4.7 Structures
Address point locations obtained from the tax assessor’s GIS database were used as a proxy
for occupied structure locations. In order to provide adequate avoidance, residential points
were buffered by 100 feet, commercial locations were buffered by 160 feet, and trailers were
buffered by 60 feet (Figure 3‐11). Structure buffer density is high in the study area; therefore,
buffers that overlapped onto roadways and existing corridors were removed as the
structures would not be located in those areas (Figure 3‐12). Additionally, without this
modification, the address point layer density was too great to facilitate creation of viable
routes.

Eastside 230 kV Project Constraint and Opportunity Study for Linear Site Selection December 2013
Draft Routing Description 123013 31
75311237.1 0063442‐00015
Figure 3-11. Structure Buffer Process

Eastside 230 kV Project Constraint and Opportunity Study for Linear Site Selection December 2013
Draft Routing Description 123013 32
75311237.1 0063442‐00015
Figure 3-12. Buffered Address Locations

Eastside 230 kV Project Constraint and Opportunity Study for Linear Site Selection December 2013
Draft Routing Description 123013 33
75311237.1 0063442‐00015
3.4.8 Parks and Recreation
The study area includes public lands designated as parks and recreational trails (Figure 3‐13)
using a GIS database from King County. While these lands can sometimes represent
constraints for transmission line routing (with exception to the Eastside Rail Corridor, as
described in section 3.5.2.2 above), they are relatively scarce and widely distributed, and
therefore easily avoided.

Eastside 230 kV Project Constraint and Opportunity Study for Linear Site Selection December 2013
Draft Routing Description 123013 34
75311237.1 0063442‐00015
Figure 3-13. Special Land Use Designations

Eastside 230 kV Project Constraint and Opportunity Study for Linear Site Selection December 2013
Draft Routing Description 123013 35
75311237.1 0063442‐00015
3.4.9 Historic Sites
Historic sites represent constraints, but also tend to be spaced well apart and can be easily
avoided (Figure 3‐14). For purposes of this analysis, data for Historic Parcels and Points
were acquired from the King County GIS database. Cultural site data are classified as
sensitive by the Department of Archaeology and Historic Preservation and therefore, were
not included in the analysis. A review of cultural and historic sites will be undertaken
during further route development, which is the next step of the process.

Eastside 230 kV Project Constraint and Opportunity Study for Linear Site Selection December 2013
Draft Routing Description 123013 36
75311237.1 0063442‐00015
Figure 3-14. Historic Parcels and Points

Eastside 230 kV Project Constraint and Opportunity Study for Linear Site Selection December 2013
Draft Routing Description 123013 37
75311237.1 0063442‐00015
3.4.10 Visual Resources
There is no GIS data available to effectively represent visual resource considerations in the
routing analysis. Nonetheless, using existing corridors or ROW already occupied by existing
lines can help minimize new visual impacts.
3.4.11 Waterbodies and Wetlands
There are a number of existing wetlands in the study area that could present constraints to
routing a transmission line (Figure 3‐15). Large wetlands can be routed around and
therefore do not pose a serious problem. The wetlands in the project area occur mostly in
river/stream floodways and floodplains, and around shallow lakes. Wetland locations were
collected from the National Wetlands Inventory and King County.
Locations of water bodies, such as rivers, streams and lakes were collected from King
County, as were the floodways and floodplains. These features can be spanned, except for
Lake Sammamish, Lake Washington, Phantom Lake, Larson Lake, and Lake Boren, which
can be routed around.

Eastside 230 kV Project Constraint and Opportunity Study for Linear Site Selection December 2013
Draft Routing Description 123013 38
75311237.1 0063442‐00015
Figure 3-15. Water and Wetlands

Eastside 230 kV Project Constraint and Opportunity Study for Linear Site Selection December 2013
Draft Routing Description 123013 39
75311237.1 0063442‐00015
3.4.12 Plants and Vegetation
The selected route must be compatible with PSE’s vegetation management obligations, as
well as applicable local, state, and federal species designated for enhanced protection.
However, for the purposes of this study, only GIS mapped special habitat areas were
considered. Washington Natural Heritage Program (WNHP) GIS data indicate that several
rare, endangered or sensitive plant species occur in the study area. There is Boschniakia
hookeri (S3) in Bridle Trails State Park, a Pseudotsuga menziesii ‐ Arbutus menziesii / Gaultheria
Shalloon Forest (S2) between Squak Mountain and Tiger Mountain, and a Forested
Sphagnum Bog PTN (S1). S1 is the most sensitive of these categories, and the bog is over 4
miles east southeast of the Talbot Hill substation, and therefore does not influence the
analysis. The S2 forest is over 8 miles east of the Talbot Hill substation, and not pertinent to
the analysis. The S3 Boschniakia hookeri is 0.6 mile from a route segment; however, it is a
small patch and easily avoided. In addition, King County and the local municipalities all
have regulations regarding wildlife habitat conservation areas, as well as plant, significant
tree, and vegetation disturbance in their jurisdictions that will be evaluated in the next step.
3.5 LRT ANALYSIS OF GIS MAPPED CONSTRAINTS AND OPPORTUNITIES
Following definition of the project study area, collection and processing of GIS data, and
assessment constraints and opportunities, the LRT was used to identify transmission
corridor options for further evaluation. Refinements to the corridors identified by the LRT
were made after considering electric system feasibility and reviewing aerial photography,
street maps, U.S. Geological Survey (USGS) topographic maps, and readily available
knowledge of local conditions. Other criteria, such as engineering and construction
feasibility, were also considered to a certain extent. Route distance minimization is built into
the LRT as a standard parameter for route development. The respective steps in the
transmission line route selection process are discussed below.
To select the best route options from the large number of possible routes, relevant attributes
were evaluated simultaneously. Each of the environmental and engineering data sets
identified in Table 3‐1 were used to determine preliminary routes. Other criteria, such as
total distance, engineering, and construction feasibility were also incorporated.
To enable this process, all of the datasets had to be normalized according to anticipated or
potential constraints or opportunities associated with construction or operation of the
proposed substation and transmission line(s). For that reason, the Project Team assigned
values to each resource according to its relative contribution as an opportunity or constraint.

Eastside 230 kV Project Constraint and Opportunity Study for Linear Site Selection December 2013
Draft Routing Description 123013 40
75311237.1 0063442‐00015
Tetra Tech staff collected existing available GIS files for land ownership, existing and future
land use, public and private ROW, wildlife, vegetation, threatened and endangered (T&E)
species, wetlands, topography, historical resources, and other factors that would influence
the location of the proposed transmission line. The data collection process was designed to
provide geospatial information on criteria that could represent either opportunities or
constraints for the location of a transmission line.
Using the team’s professional, multi‐discipline expertise, the various data layers were
individually weighted to reflect the varying degree of constraint or opportunity for each
data set. The team’s resource and LRT experts assigned values to the data layers (resources)
using a progressive scale of values ranging from the most negative or adverse constraint,
such as endangered species and residences, to the most positive or greatest opportunity,
such as existing PSE ROW. Certain features were considered exclusion areas that could not
be crossed under any circumstances because of regulatory, environmental, or engineering
limitations. A matrix populated with these resources and their associated values was used
as input to the LRT to identify potential transmission line routes. The GIS constraints and
opportunities are listed in Appendix B.
The LRT combined these resource layer values and created an output file called the
suitability grid, which represents a summation of all the constraints and opportunities for
every point (grid cell) across the entire study area. Each grid cell was 10 feet by 10 feet in
size, allowing for the model to look at the study area in relative detail. For each grid cell, the
scores for each of the attribute layers were summed. The suitability grid can be likened to a
landscape of opportunities and constraints that the corridor must traverse. The areas of
greatest opportunity are the easiest to cross (valleys), while the areas of highest constraint
(hills) are more difficult. The LRT generated multiple corridors across the suitability grid
from PSE’s Sammamish substation to PSE’s Talbot Hill substation connecting via the
potential transformation sites. An example of this output is shown in Figure 3‐16. This
figure depicts the optimal feasible route from the Sammamish to the Vernell substation, and
from the Vernell to the Talbot Hill substation. Because all feasible routes include a
transformation site between the Sammamish and Talbot Hill substations, all routes were
modeled from the Sammamish substation to a potential intermediate transformation site,
and then from that site to the Talbot Hill substation.

Eastside 230 kV Project Constraint and Opportunity Study for Linear Site Selection December 2013
Draft Routing Description 123013 41
75311237.1 0063442‐00015
Multiple corridors, with varying degrees of opportunities and constraints were generated
and used to develop alternative routes. To simplify analysis, each route was partitioned at
the crossing points of routes to create unique segments. Each LRT segment was validated
using professional judgment and ancillary resources such as aerial photographs, to help
ensure they were realistic options. Once the segments were generated and validated, a
composite score was calculated for each segment from the underlying suitability grid. The
composite score for each segment was put into a deterministic model that considered over
five hundred combinations of segments and substation sites. If parallel segments (i.e.,
typically less than a block apart) were identified during the model evaluation, LRT scores
were compared to determine which segment would be used to develop routes.

Eastside 230 kV Project Constraint and Opportunity Study for Linear Site Selection December 2013
Draft Routing Description 123013 42
75311237.1 0063442‐00015
Figure 3-16. LRT Constraints and Opportunities, Corridor Grid and Route Alternatives

Eastside 230 kV Project Constraint and Opportunity Study for Linear Site Selection December 2013
Draft Routing Description 123013 43
75311237.1 0063442‐00015
3.6 SELECTION OF ALTERNATIVES TO CARRY FORWARD
Because the Corridor Grid shows variations in the degree of opportunity and constraint, it is
used to define route alternatives. Multiple corridors, with varying degrees of opportunities
and constraints, were generated and used to develop alternative routes. To simplify
analysis, each route was partitioned at the crossing points of routes to create unique
segments. Each segment was then analyzed by the Project Team. This process has been
used to help identify route options on many linear projects, further refining the professional
judgment of the analysts over time. The analysis process also includes review of ancillary
resources, such as aerial photographs, that add new and objectively verifiable information to
the data sets that generated the corridor grid and route segments. By applying professional
judgment to the data sets and ancillary resources, each LRT segment was validated to help
ensure that they were feasible options. Once the segments had been identified, the
constraint value score was calculated for each one. A constraint value model was developed
that considered over 500 segment/route/substation site combinations. If parallel segments
(i.e., typically less than a block apart) were identified during the model evaluation, LRT
constraint values were used to compare and determine which segment would be used to
develop routes.
A deterministic model was used to evaluate the LRT scores for each of the
segment/route/site combinations. Negatively scored routes were eliminated from further
consideration as they were not considered viable options. The top five percent of the
positive routes were then mapped to assist further discussion and evaluation, with the
segment combinations for these routes provided in Table 3‐2, below. The mapping exercise
revealed that there were four general subareas, which when combined, formed a “ladder” of
route alternatives. The “leg” components of the ladder comprised the north‐south running
routes connecting the Sammamish, Talbot Hill, and one of the new transformation
substations. Moving east to west between the “legs” could be accomplished by using one of
the three cross‐over segments or “rungs.” The only exception to this being an additional
north‐south segment situated in the central part of the study area, south of I‐90. To simplify
future discussion, each of the fourteen legs and rungs were given a unique identifier (Figure
3‐17).

Eastside 230 kV Project Constraint and Opportunity Study for Linear Site Selection December 2013
Draft Routing Description 123013 44
75311237.1 0063442‐00015
Table 3-2. Route Segment Composition
Vernell 248 Vernell 249 Westminster
217 Lakeside 155 Lakeside 160 Lakeside 166 A A A A A A
B B C C C C
F F D E E E
H H F G2 G2 J
K1 L H G1 I M
K2 N L H K1 N
M N L L
N N N

Eastside 230 kV Project Constraint and Opportunity Study for Linear Site Selection December 2013
Draft Routing Description 123013 45
75311237.1 0063442‐00015
Figure 3-17. Route Alternatives with Unique Identifiers

Eastside 230 kV Project Constraint and Opportunity Study for Linear Site Selection December 2013
Draft Routing Description 123013 46
75311237.1 0063442‐00015

Eastside 230 kV Project Constraint and Opportunity Study for Linear Site Selection December 2013
Draft Routing Description 123013 47
75311237.1 0063442‐00015
4. Conclusion and Next Step: Viable Segments and Recommended Routes
Collection and synthesis of the GIS data sets identified throughout this report, analyzed by
linear route selection professionals using the processes discussed above, supports the
determination that all of the mapped segment combinations shown in Figure 3‐17 can be
used to develop a route capable of connecting the Sammamish Substation with the Talbot
Hill Substation, while connecting to any one of the three new 230 kV intermediary
substations.
Additional data collection and evaluation will be conducted in order to further refine the
assessment of route segments, which will support a determination that the most viable route
is one that is technically feasible and practicable for permitting, construction, and
maintenance over time. Following a public review and input process, PSE will select the
preferred route, which will then be subjected to project‐specific land use and environmental
review in support of permits to construct the new transmission facility.

Eastside 230 kV Project Constraint and Opportunity Study for Linear Site Selection December 2013
Draft Routing Description 123013 48
75311237.1 0063442‐00015
5. Report Limitations
This assessment was developed in conjunction with Puget Sound Energy in an effort to assist
in the selection of a feasible 230 kV transmission line route from the Sammamish Substation
to the Talbot Hill Substation. The report was developed to describe the evaluation and
selection processes. The need for future analysis may also be warranted if specific issues are
identified that were outside the intended scope of this assessment.
As with any project that involves an evaluation of environmental and permitting factors,
there is a certain degree of dependence upon available information that may not be readily
verifiable without the implementation of thorough field programs. Data collected and used
within this report were derived primarily from examination of records in the public domain
and input from the project team’s knowledge about the project area. The passage of time,
manifestation of latent conditions, or occurrence of future events may require further study,
as well as reevaluation of the findings, observations, and conclusions in the report.

Eastside 230 kV Project Constraint and Opportunity Study for Linear Site Selection December 2013
Draft Routing Description 123013 49
75311237.1 0063442‐00015
APPENDIX A‐ Tetra Tech Routing Experience
Tetra Tech, founded in 1966, has provided siting and permitting services for AC and DC
electric transmission lines for approximately 40 years in locations from California to Maine,
including our current work on the longest contiguous electric transmission project in the
nation, the Gateway West Transmission Project.
Listed below is a table of transmission siting projects in the West that Tetra Tech is currently
supporting or has supported recently.
Client Project Location
Puget Sound Energy Berrydale to Lake Holm (Krain Corner) King County
Puget Sound Energy Eastside 230 kV Project King County
Idaho Power/ PacifiCorp Gateway West 230 kV and 500 kV Lines Wyoming and Idaho
Idaho Power Boardman to Hemingway 500 kV Line Oregon and Idaho
NV Energy Falcon‐Gender 345 kV Line Nevada

Eastside 230 kV Project Constraint and Opportunity Study for Linear Site Selection December 2013
Draft Routing Description 123013 50
75311237.1 0063442‐00015
APPENDIX B‐ GIS Constraints and Opportunities
Constrain/Opportunity Value Value Definition
Address point buffers (buildings); BPA substation;
Large lakes barrier
Exclusion areas that cannot be
crossed under any circumstances
due to regulatory, environmental
or engineering requirements.
Highway polygons created using lane widths;
WSDOT Utility Restrictions – restricted; WA
Natural Heritage Project Critically Imperiled
Species of Special Concern (S1); Water bodies,
Airport; Transfer of development rights – receiving;
Convenience Store with Gas; Service Station;
Marina; Resort/Lodge/Retreat; 4‐Plex; Air Terminal
and Hangers; Apartment; Apartment (Co‐op);
Apartment(Mixed Use); Apartment (Subsidized);
Campground; Condominium (Residential);
Condominium (Mobile Home Park); Duplex;
Fraternity/Sorority House; Retirement Facility;
Townhouse Plat; Triplex; Gas Station; Mobile Home
Park; Daycare Center; Golf Course; Historic Prop
(Misc); Historic Prop (Office); Mobile Home;
Reserve/Wilderness Area; Residence Hall/Dorm;
Rooming House; School (Private); School (Public);
Single Family (C/I Use); Single Family (C/I Zone);
Single Family (Res Use/Zone)
‐5
Very high impact (duration,
regulation). Very difficult or
impossible to mitigate (due to
technology, sensitivity of resource
or cost of mitigation).
Arterial Roads buffered by 20 feet; Landslide
potential (class 3); Wetlands, large; Parks; Art
Gallery/Museum/Social Service;
Auditorium/Assembly Building;
Church/Welfare/Religious Service; Club;
Condominium Office); Park‐Private (Amuse
Center); Park‐ Public (Zoo/Arbor); Condominium
(Mixed Use); Group Home; Health Club; Hospital;
Hotel/Motel; Medical/Dental Office; Mini Lube;
Movie Theater; Nursing Home; Office Building;
‐4
High impact. Mitigation would be
successful, but would be difficult
to implement, very costly, and/or
require a long time to complete.

Eastside 230 kV Project Constraint and Opportunity Study for Linear Site Selection December 2013
Draft Routing Description 123013 51
75311237.1 0063442‐00015
Post Office/Post Service; Rehabilitation Center;
Restaurant (Fast Food); Restaurant/Lounge; Skating
Rink (Ice/Roller); Tavern/Lounge; Vet/Animal
Control Service
WSDOT Utility Restrictions – with exceptions; WA
Historical Register; WA Historical Register Districts;
Historic Property Inventory – named; WA Natural
Heritage Project Imperiled Species of Special
Concern (S2); Slope 20% or greater, unspanable;
Slope 40% or greater, unspanable (combined with
slope >20% results in a total of ‐6); Shorelines (200’
Buffer); Waterfowl habitat; Heron rookeries; Bald
eagle nest buffers; Native growth protection
easement; River/Creek/Stream; Water Body‐ Fresh
‐3
Moderate impact. Would not
likely result in significant adverse
impact. Mitigation, if necessary,
would be fairly easy to
implement.
WA Natural Heritage Project Rare or Uncommon
Species of Special Concern (S3); Floodway;
Floodplain; Coal mine hazards; Airport approach
notification zone; Landslide potential (class 2);
Utility, Private (Radio/T.V.); Retail Store; Shopping
Center (Community); Shopping Center (Major
Retail); Shopping Center (Neighborhood); Shopping
Center (Regional); Shopping Center (Specialty);
Retail(Discount); Retail(Line/Strip); Open Space
Timber Land/Greenbelt; Open Space (Agriculture‐
RCW 84.34); Open Space (Current Use‐RCW 84.34)
‐2
Low impact. Mitigation, if
necessary, would be easy to
implement.
Scenic Byways buffered by 50 feet; Railroads (rail
bank) buffered by 50 feet; BPA transmission
corridor; Heritage Barns buffered by 100 feet;
Landslide potential (class1); Salmonid streams
buffered by 60 feet; Park easements, King County;
Tideland, 1st Class; Auto Showroom and Lot, Bank;
Bowling Alley; Car Wash; Convenience Store
without Gas; Grocery Store; Service Building; Sport
Facility
‐1 Very low impact. No mitigation
required.
Transfer of development rights – sending;
Governmental Service; 0
No impact or impact not a
concern.

Eastside 230 kV Project Constraint and Opportunity Study for Linear Site Selection December 2013
Draft Routing Description 123013 52
75311237.1 0063442‐00015
Greenhouse/Nursery/Horticulture Service; High
Tech/High Flex; Mining/Quarry/Ore Processing;
Office Park; Retail(Big Box); Terminal
(Auto/Bus/Other)
High Pressure Gas Lines buffered by 75 feet; Farm;
Mortuary/Cemetery/Crematory 1
Reduces impacts and mitigation
requirements, and would facilitate
permitting to a very minor extent.
Recreational Trails buffered by 10 feet; BPA
transmission corridor buffered by 80 feet; Vacant
(Commercial); Vacant (Multi‐family); Vacant
(Single‐family)
2
Reduces impacts and mitigation
requirements, and would facilitate
permitting to a fairly minor
extent.
Industrial Park; Industrial (Gen Purpose); Industrial
(Heavy); Industrial (Light); Mini Warehouse;
Terminal (Rail); Vacant (Industrial); Warehouse
3
Reduces impacts and mitigation
requirements, and would facilitate
permitting to a moderate extent.
Arterial Roads buffered by 45 feet; Railroads
(abandoned) buffered by 50 feet; PSE 55kV corridor;
Easement; Parking (Assoc); Parking (Commercial
Lot); Parking (Garage); Right‐of‐Way/Utility‐Road;
Utility‐Public
4
Reduces impacts and mitigation
requirements, and would facilitate
permitting to a large extent.
PSE transmission ROW buffered by 50 feet 5
Reduces impacts and mitigation
requirements, and would facilitate
permitting to a very large extent.