Embed Size (px)
Citation preview
ECASA modelling workshop, Dunstaffnage Laboratory, Oban
26-27 January 2006
14 – University of Venice
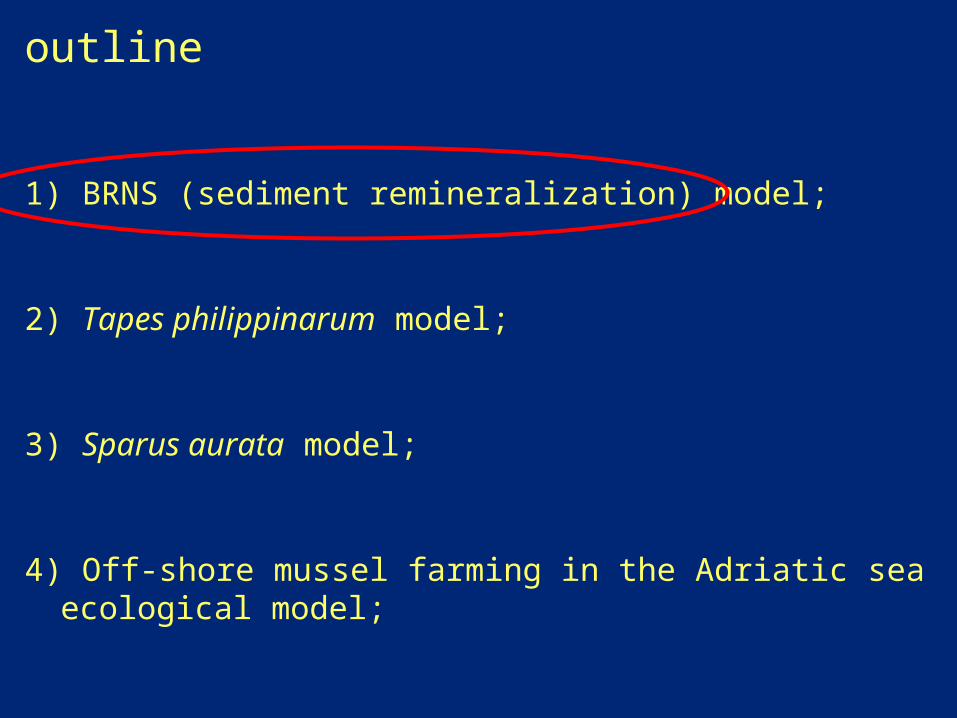
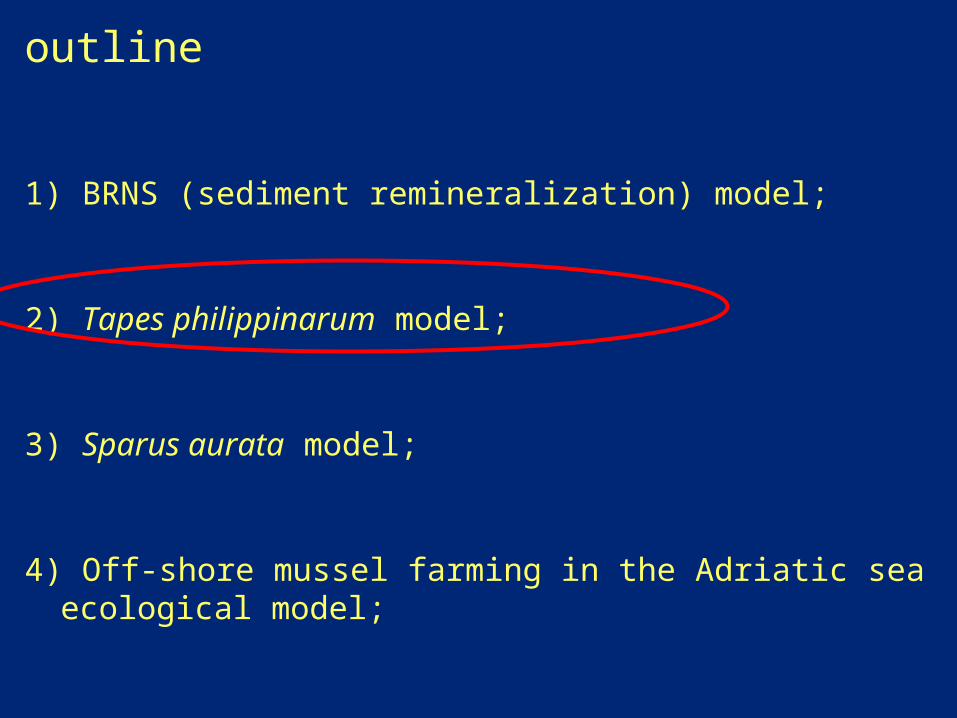
outline
1) BRNS (sediment remineralization) model;
2) Tapes philippinarum model;
3) Sparus aurata model;
4) Off-shore mussel farming in the Adriatic sea ecological model;
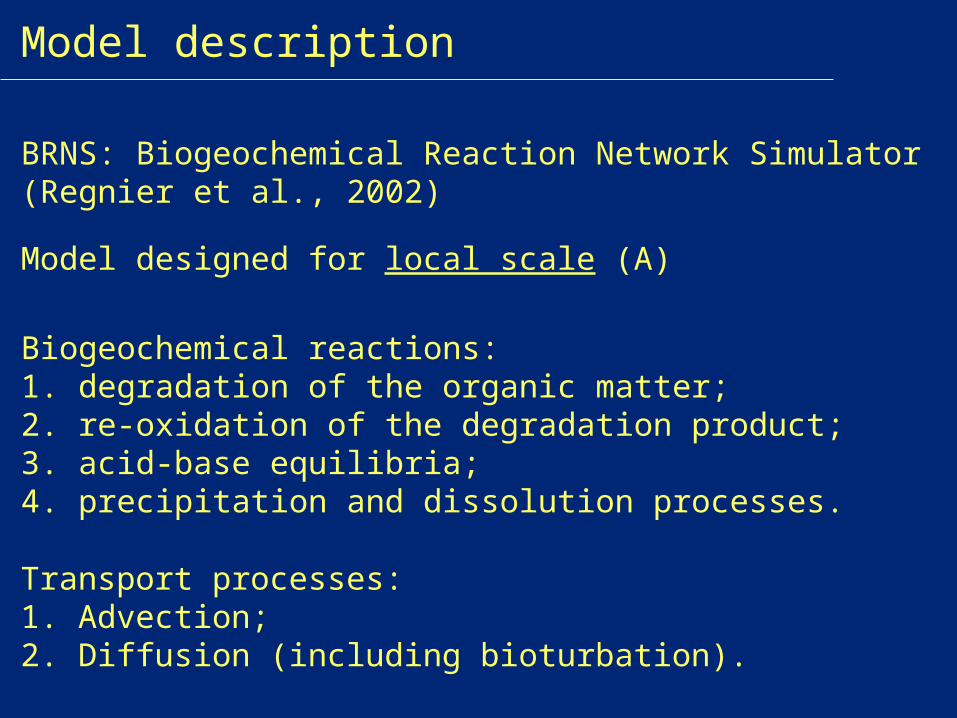
BRNS: Biogeochemical Reaction Network Simulator (Regnier et al., 2002)
Biogeochemical reactions:1. degradation of the organic matter;2. re-oxidation of the degradation product;3. acid-base equilibria;4. precipitation and dissolution processes.
Model description
Transport processes:1. Advection;2. Diffusion (including bioturbation).
Model designed for local scale (A)
t)β,,f(z
Dz
vt 2
2
cccc
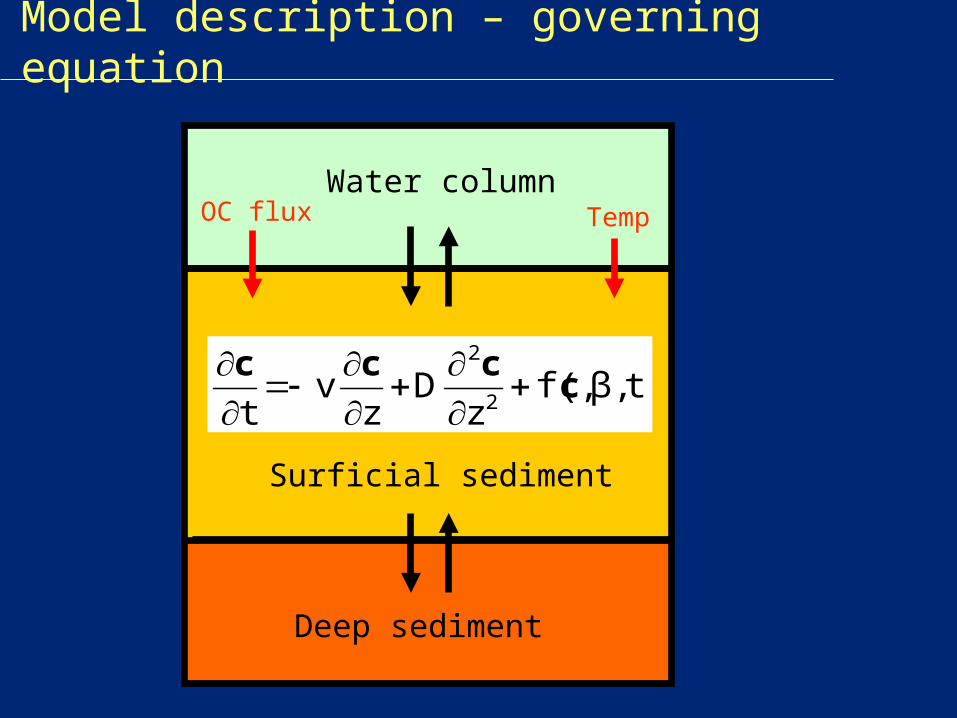
Deep sediment
Surficial sediment
Water columnTempOC flux
Model description – governing equation
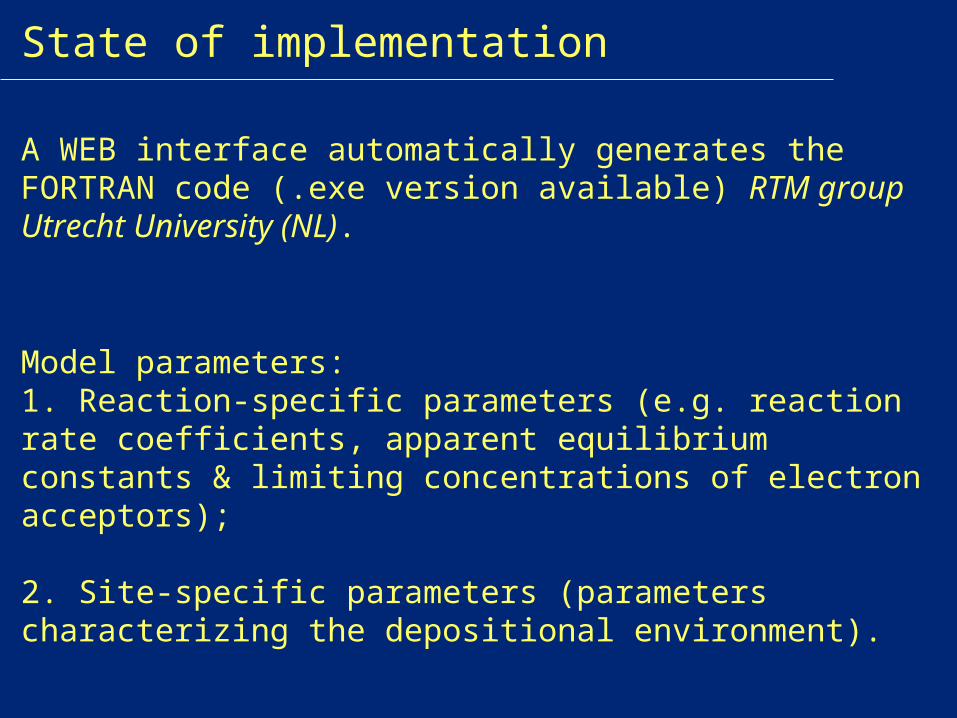
State of implementation
A WEB interface automatically generates the FORTRAN code (.exe version available) RTM group Utrecht University (NL).
Model parameters:1. Reaction-specific parameters (e.g. reaction rate coefficients, apparent equilibrium constants & limiting concentrations of electron acceptors);
2. Site-specific parameters (parameters characterizing the depositional environment).
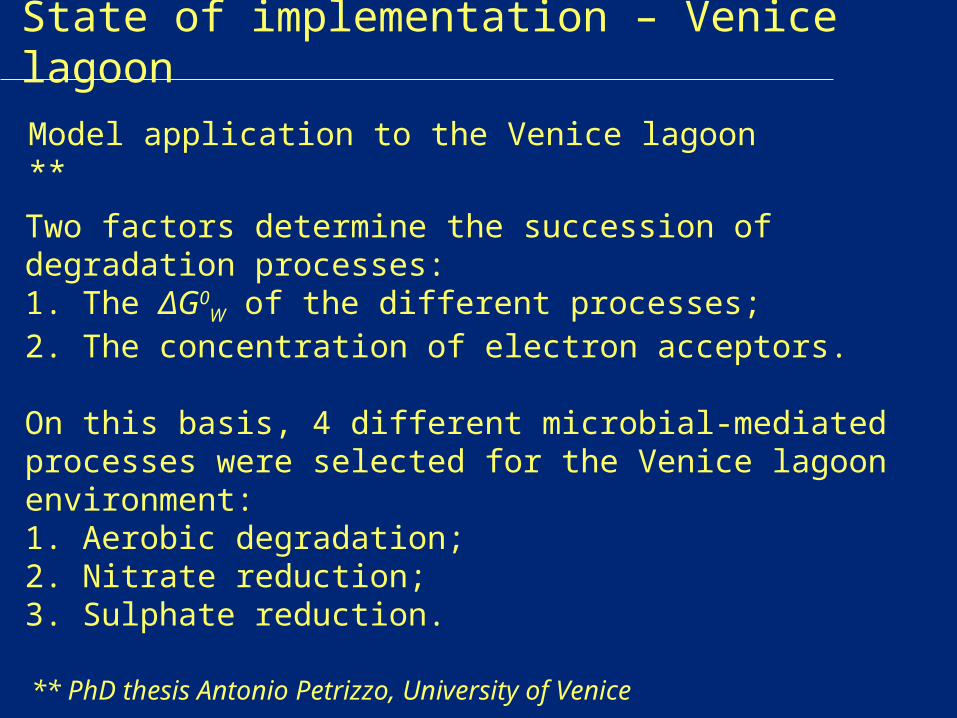
Two factors determine the succession of degradation processes:1. The ΔG0
W of the different processes;2. The concentration of electron acceptors.
On this basis, 4 different microbial-mediated processes were selected for the Venice lagoon environment:1. Aerobic degradation;2. Nitrate reduction;3. Sulphate reduction.
Model application to the Venice lagoon **
State of implementation – Venice lagoon
** PhD thesis Antonio Petrizzo, University of Venice
State of implementation – Venice lagoon
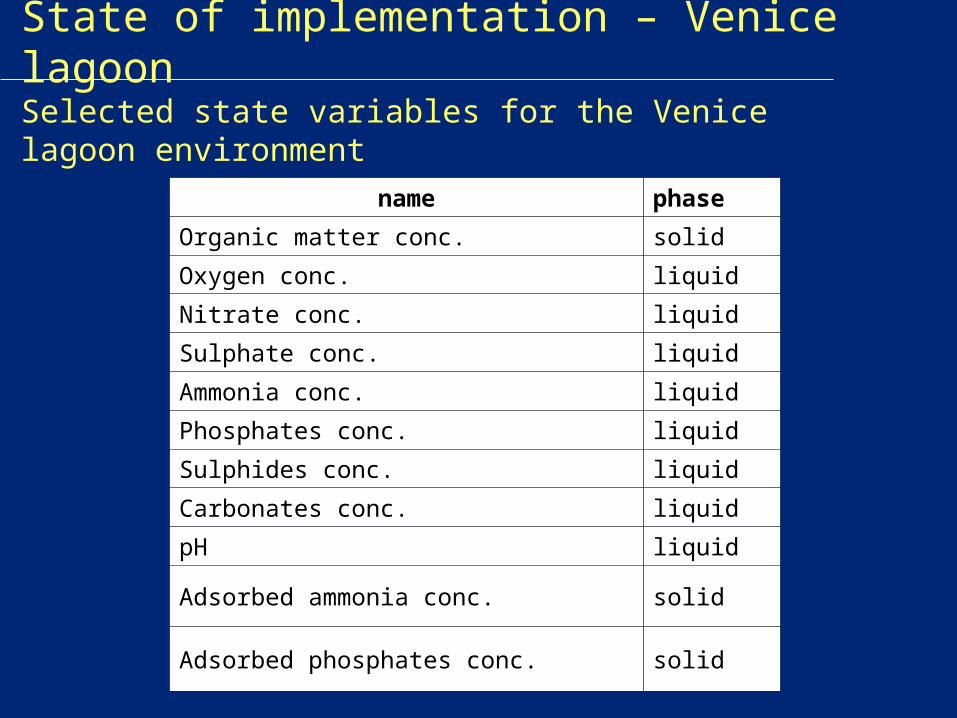
name phase
Organic matter conc. solid
Oxygen conc. liquid
Nitrate conc. liquid
Sulphate conc. liquid
Ammonia conc. liquid
Phosphates conc. liquid
Sulphides conc. liquid
Carbonates conc. liquid
pH liquid
Adsorbed ammonia conc. solid
Adsorbed phosphates conc. solid
Selected state variables for the Venice lagoon environment
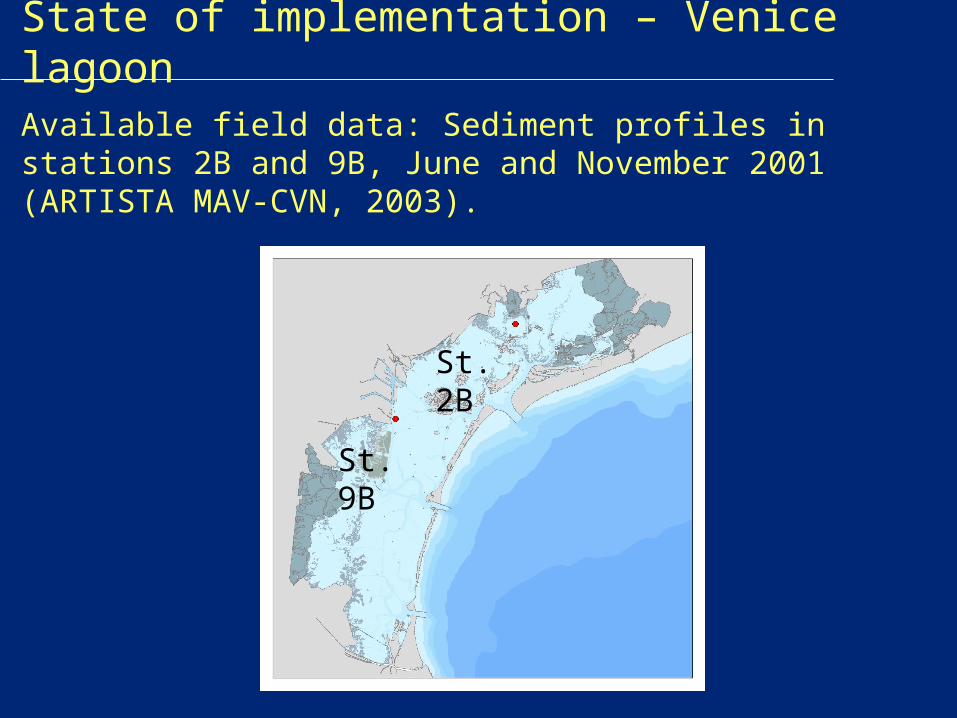
St. 2B
St. 9B
State of implementation – Venice lagoon
Available field data: Sediment profiles in stations 2B and 9B, June and November 2001 (ARTISTA MAV-CVN, 2003).
Initial conditions: measured profiles in June 2001Concentrations of adsorbed ammonia and phosphate were recalculated from experimental data, using the respective partition equilibrium constants.
Boundary conditions: 1. Upper boundary: water quality data at the sediment-water interface were collected nearby st. 2B and 9B from MAV-CVN, within the MELa1 monitoring program.Organic matter flux to the sediment was estimated from the TOC data.2. Lower boundary:A null gradient condition was imposed
State of implementation – Venice lagoon
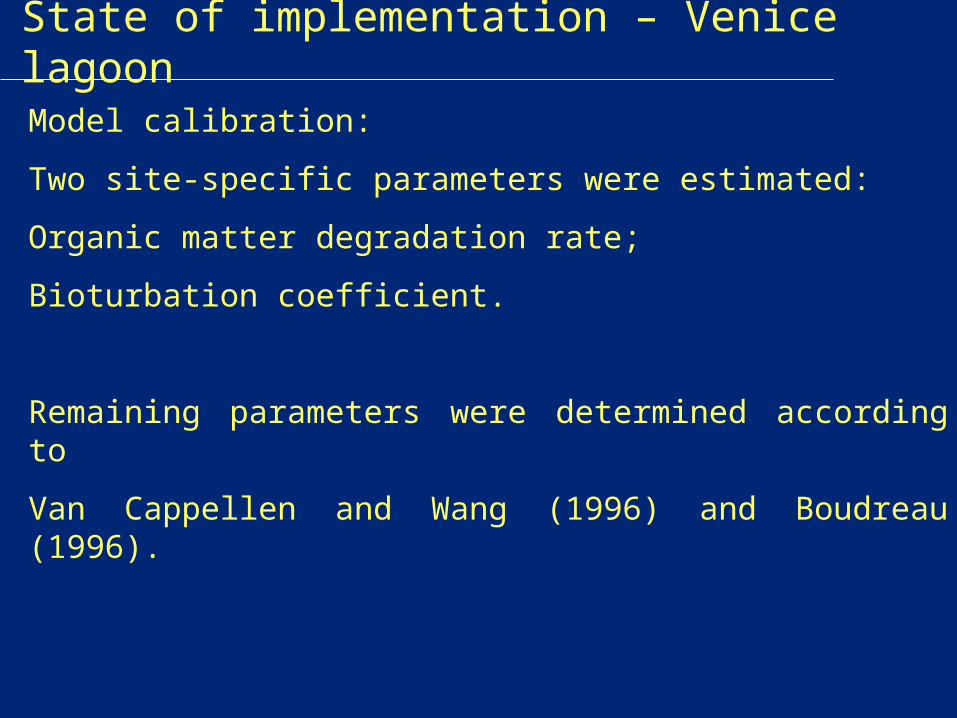
Model calibration:
Two site-specific parameters were estimated:
Organic matter degradation rate;
Bioturbation coefficient.
Remaining parameters were determined according to
Van Cappellen and Wang (1996) and Boudreau (1996).
State of implementation – Venice lagoon
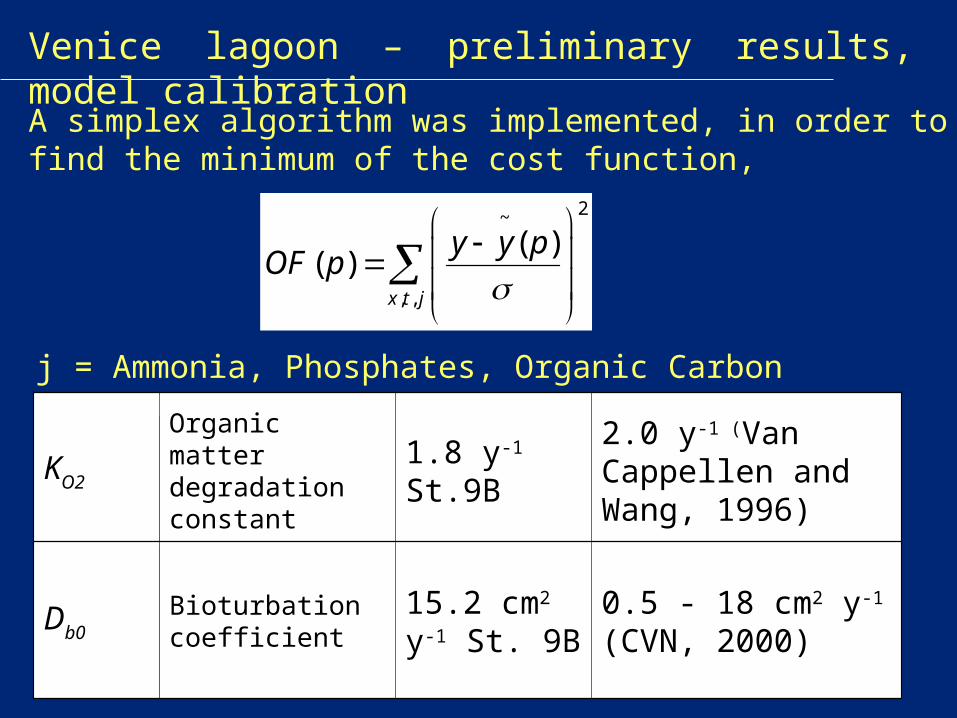
A simplex algorithm was implemented, in order to find the minimum of the cost function,
2~
, ,
( )( )
x t j
y y pOF p
j = Ammonia, Phosphates, Organic Carbon concentrations
Venice lagoon – preliminary results, model calibration
KO2
Organic matter degradation constant
1.8 y-1 St.9B
2.0 y-1 (Van Cappellen and Wang, 1996)
Db0Bioturbation coefficient
15.2 cm2 y-1 St. 9B
0.5 - 18 cm2 y-1 (CVN, 2000)
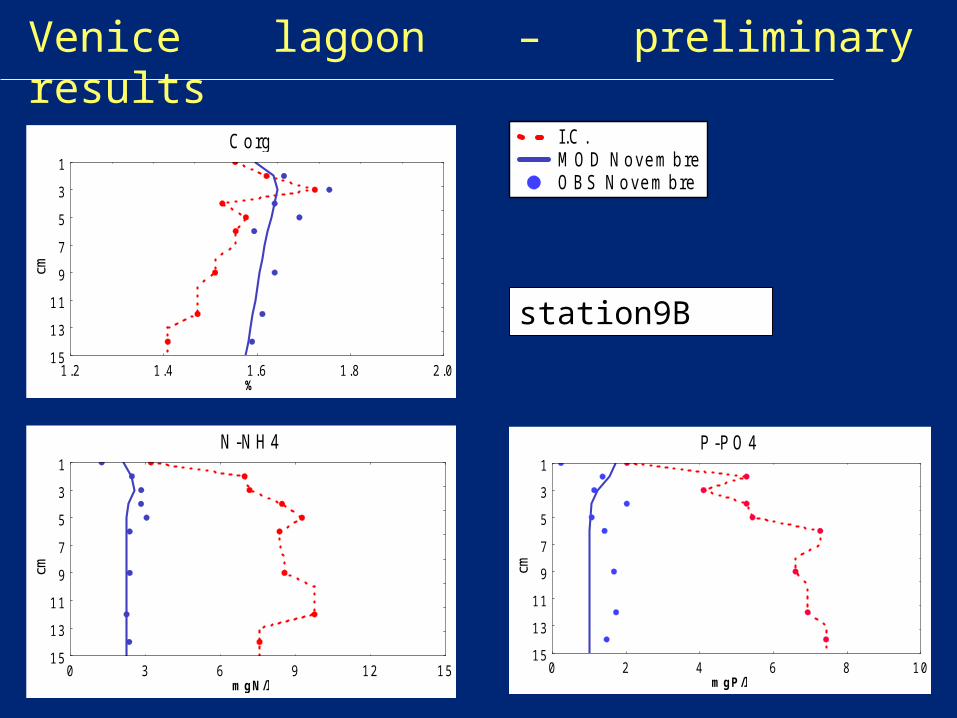
Venice lagoon – preliminary results
Corg
%
cm
1 .2 1.4 1.6 1.8 2.0
1
3
5
7
9
11
13
15
N-NH4
mgN/l
cm
0 3 6 9 12 15
1
3
5
7
9
11
13
15
P-PO 4
mgP/l
cm
0 2 4 6 8 10
1
3
5
7
9
11
13
15
I.C . M O D Novem bre O BS N ovem bre
station9B
0
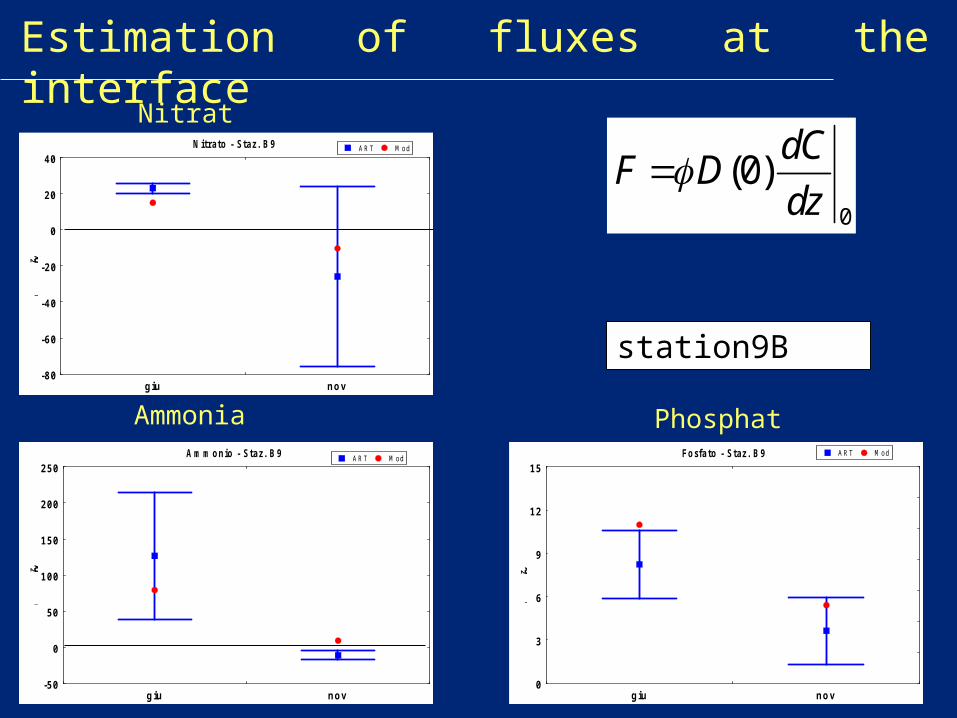
(0)dC
F Ddz
Estimation of fluxes at the interface
Nitrate
Ammonia Phosphate
N itra to - S taz . B 9
mg-N
/m2 /d
giu nov-80
-60
-40
-20
0
20
40 A RT M od
A m m o n io - S ta z . B 9
mg-N
/m2 /d
giu nov-50
0
50
100
150
200
250 A RT M od Fo sfa to - S taz . B 9
mg-P
/m2 /d
giu nov0
3
6
9
12
15 A RT M od
station9B
outline
1) BRNS (sediment remineralization) model;
2) Tapes philippinarum model;
3) Sparus aurata model;
4) Off-shore mussel farming in the Adriatic sea ecological model;
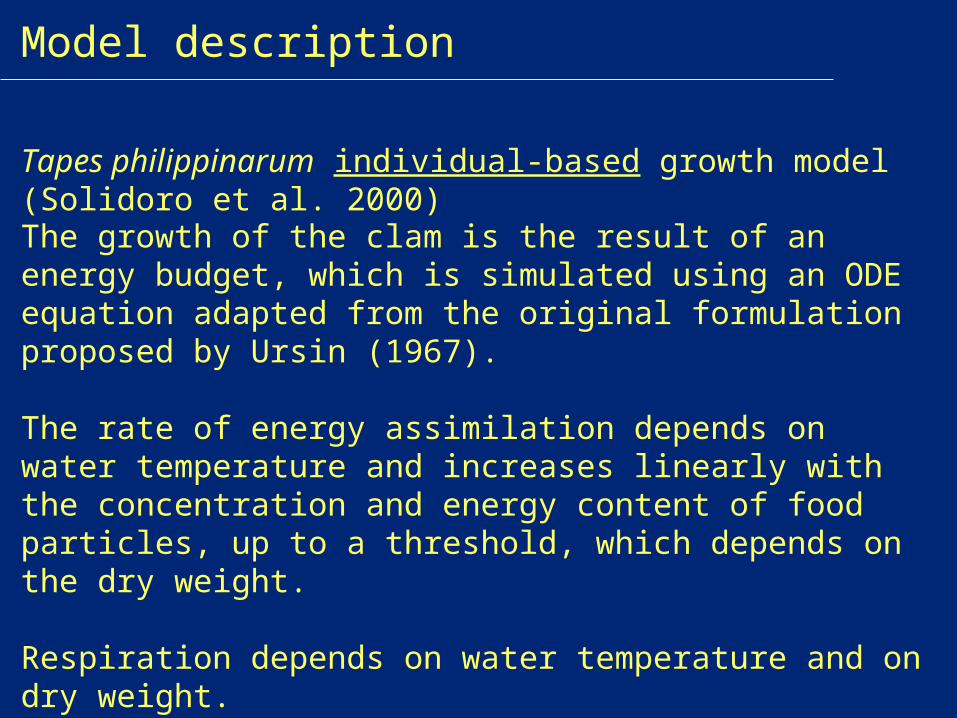
Tapes philippinarum individual-based growth model (Solidoro et al. 2000)
The growth of the clam is the result of an energy budget, which is simulated using an ODE equation adapted from the original formulation proposed by Ursin (1967).
The rate of energy assimilation depends on water temperature and increases linearly with the concentration and energy content of food particles, up to a threshold, which depends on the dry weight.
Respiration depends on water temperature and on dry weight.
Model description
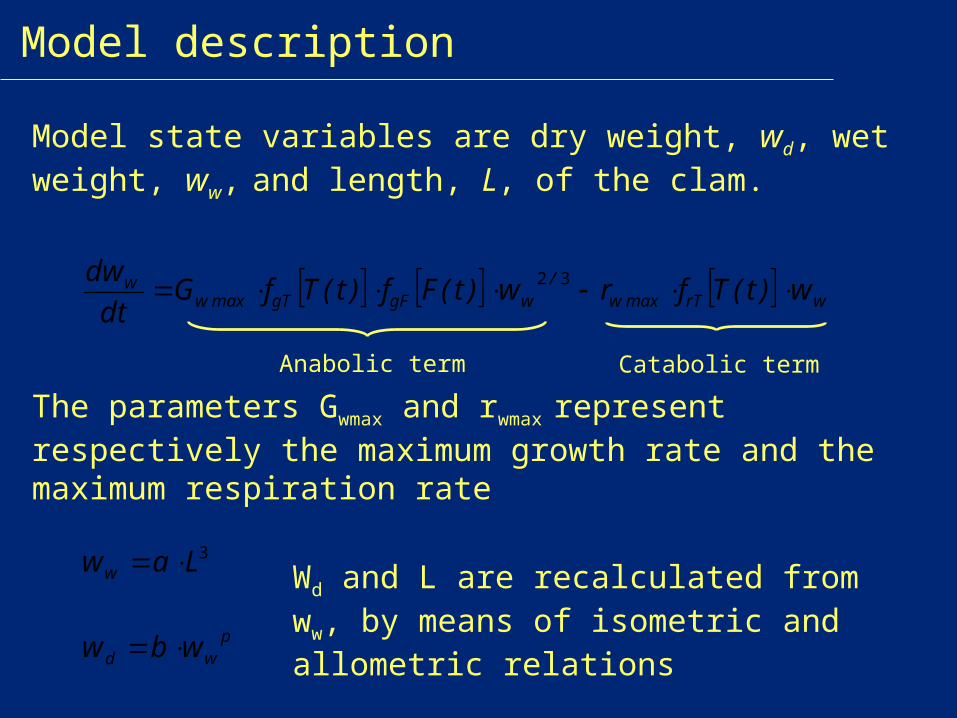
Model state variables are dry weight, wd, wet weight, ww, and length, L, of the clam.
Model description
wrTmaxw/
wgFgTmaxww w)t(Tfrw)t(Ff)t(TfG
dt
dw 32
3Laww
pwd wbw
Anabolic term Catabolic term
The parameters Gwmax and rwmax represent respectively the maximum growth rate and the maximum respiration rate
Wd and L are recalculated from ww, by means of isometric and allometric relations
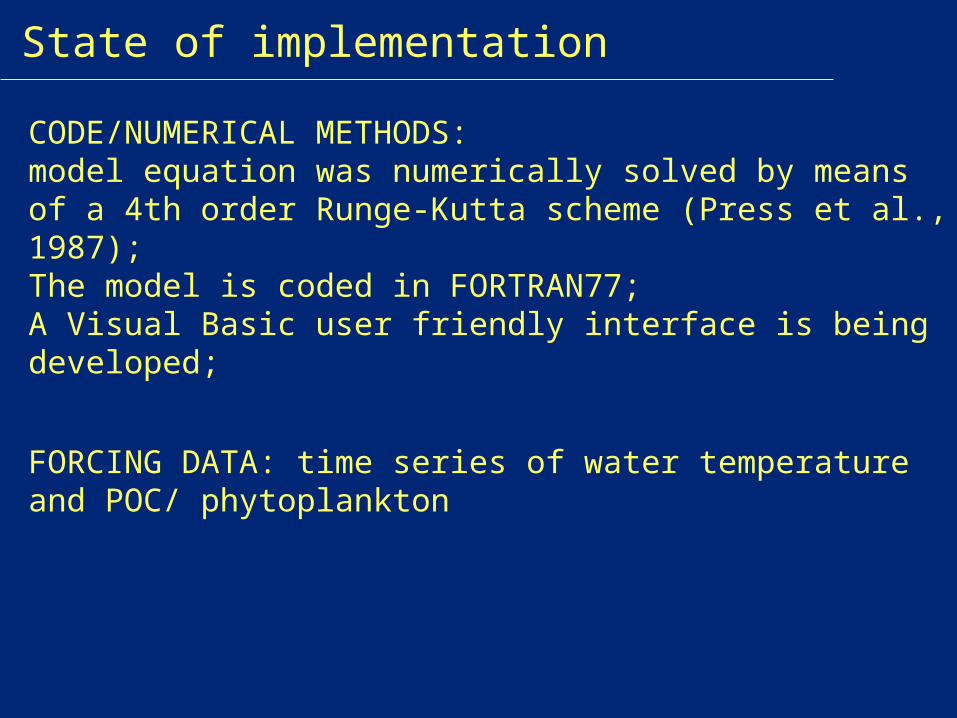
State of implementation
CODE/NUMERICAL METHODS: model equation was numerically solved by meansof a 4th order Runge-Kutta scheme (Press et al., 1987);The model is coded in FORTRAN77;A Visual Basic user friendly interface is being developed;
FORCING DATA: time series of water temperature and POC/ phytoplankton
State of implementation
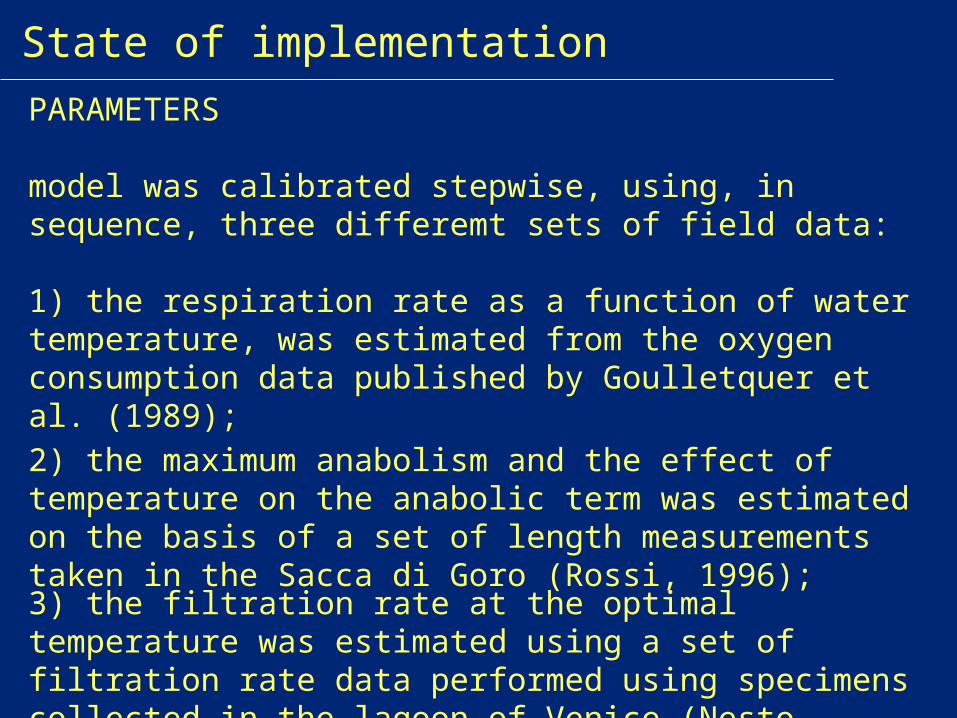
PARAMETERS
model was calibrated stepwise, using, in sequence, three differemt sets of field data:
1) the respiration rate as a function of water temperature, was estimated from the oxygen consumption data published by Goulletquer et al. (1989);
2) the maximum anabolism and the effect of temperature on the anabolic term was estimated on the basis of a set of length measurements taken in the Sacca di Goro (Rossi, 1996);
3) the filtration rate at the optimal temperature was estimated using a set of filtration rate data performed using specimens collected in the lagoon of Venice (Nesto, 1997).
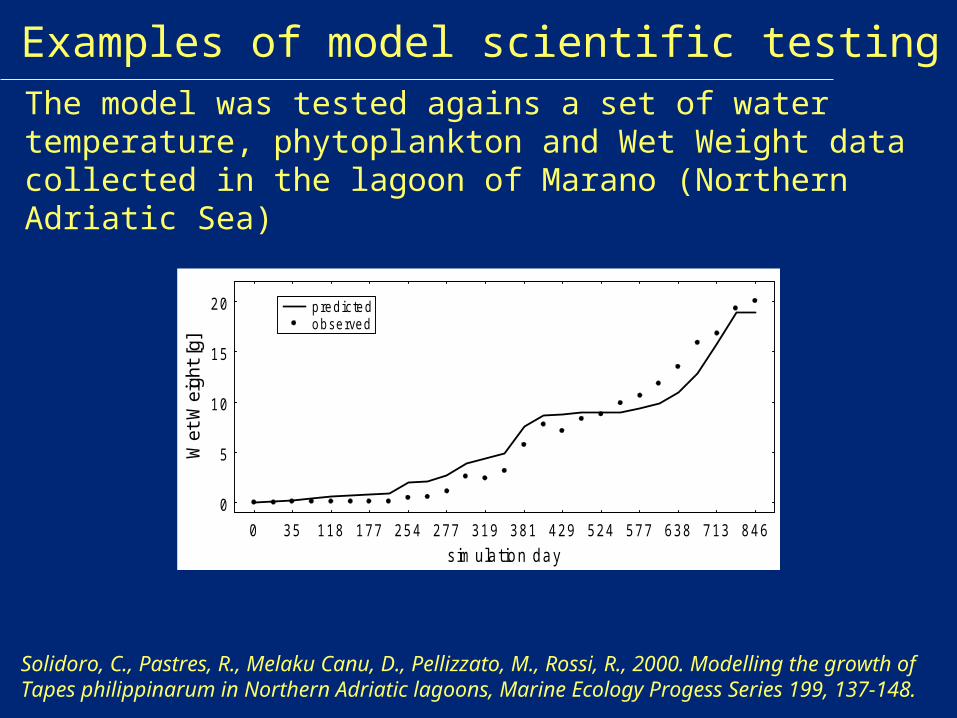
0 35 118 177 254 277 319 381 429 524 577 638 713 846
simulation day
0
5
10
15
20
Wet
Wei
ght
[g]
p red icted observed
Examples of model scientific testing
The model was tested agains a set of water temperature, phytoplankton and Wet Weight data collected in the lagoon of Marano (Northern Adriatic Sea)
Solidoro, C., Pastres, R., Melaku Canu, D., Pellizzato, M., Rossi, R., 2000. Modelling the growth of Tapes philippinarum in Northern Adriatic lagoons, Marine Ecology Progess Series 199, 137-148.
In the framework of the ECASA project, Tapes philippinarum growth model could be tested on field data collected in Ria Formosa by participant 10 IMAR.
Plans for use in ECASA

Thank you
22 2 4 4 2
23 2 4 4 2 2
2 24 2 4 4 2
22 4 4 4
2 3
2
4 2 4 72
5 5 5 52
22 2 2
22 2
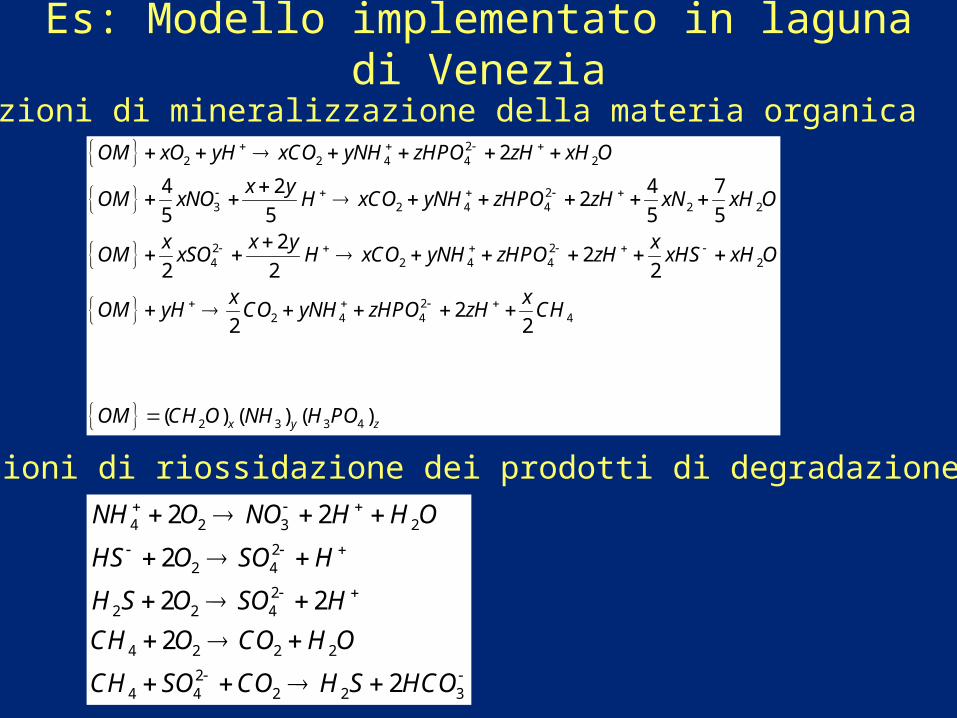
( ) (x
OM xO yH xCO yNH zHPO zH xH O
x yOM xNO H xCO yNH zHPO zH xN xH O
x x y xOM xSO H xCO yNH zHPO zH xHS xH O
x xOM yH CO yNH zHPO zH CH
OM CH O NH
3 4) ( )y zH PO
4 2 3 2
22 4
22 2 4
4 2 2 2
24 4 2 2 3
2 2
2
2 2
2
2
NH O NO H H O
HS O SO H
H S O SO H
CH O CO H O
CH SO CO H S HCO
Es: Modello implementato in laguna di Venezia
Reazioni di mineralizzazione della materia organica
Reazioni di riossidazione dei prodotti di degradazione
4
3 2 2
23 3
2
3 24 4
24 2 4
3
H HCO CO H O
CO H HCO
H HS H S
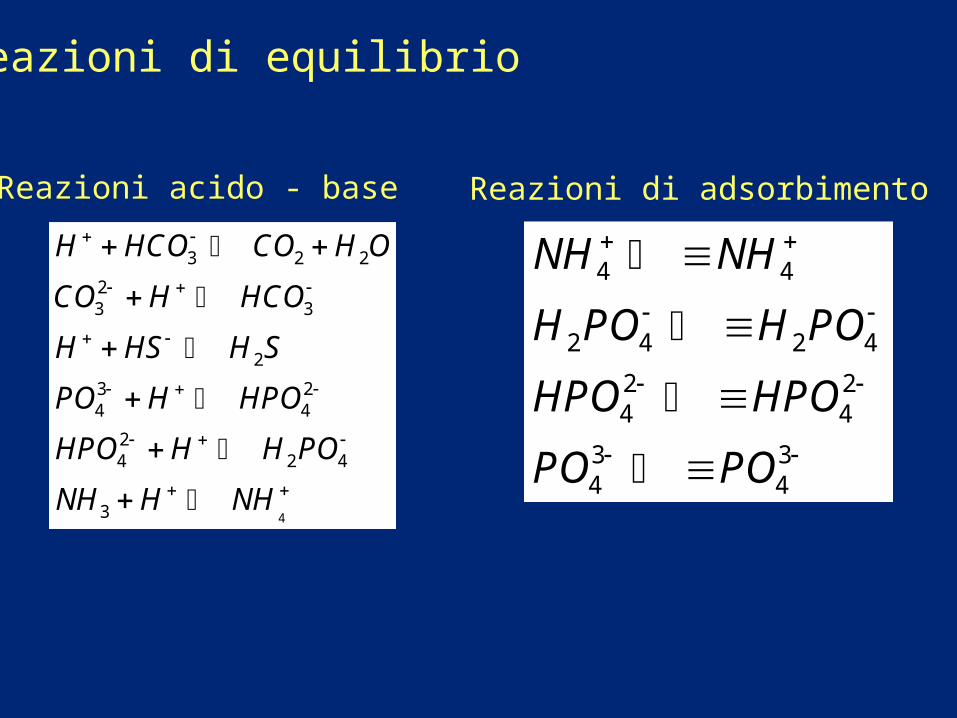
PO H HPO
HPO H H PO
NH H NH
4 4
2 4 2 4
2 24 4
3 34 4
NH NH
H PO H PO
HPO HPO
PO PO
Reazioni acido - base Reazioni di adsorbimento
Reazioni di equilibrio