Embed Size (px)
Citation preview
REVIEW ARTICLE
ECG Parameters for Malignant Ventricular Arrhythmias:A Comprehensive Review
Satria Mandala1 • Tham Cai Di2
Received: 26 April 2016 / Accepted: 31 August 2016 / Published online: 28 June 2017
� The Author(s) 2017. This article is an open access publication
Abstract Many studies showed electrocardiogram (ECG)
parameters are useful for predicting fatal ventricular
arrhythmias (VAs). However, the studies have several
shortcomings. Firstly, all studies lack of effective way to
present behavior of various ECG parameters prior to the
occurrence of the VAs. Secondly, they also lack of dis-
cussion on how to consider the parameters as abnormal.
Thirdly, the reports do not include approaches to increase
the detection accuracy for the abnormal patterns. The
purpose of this study is to address the aforementioned
issues. It identifies ten ECG parameters from various
sources and then presents a review based on the identified
parameters. From the review, it has been found that the
increased risk of VAs can be represented by presence and
certain abnormal range of the parameters. The variation of
parameters range could be influenced by either gender or
age. This study also has discovered the facts that averaging,
outliers elimination and morphology detection algorithms
can contribute to the detection accuracy.
Keywords Ventricular arrhythmia � Prediction � ECGparameter � Behavior pattern
1 Introduction
Malignant spontaneous ventricular arrhythmias (VAs),
namely ventricular tachycardia (VT) and ventricular fib-
rillation (VF) can cause sudden cardiac arrest. Patients
who are susceptible to VT/VF always have a risk of sud-
den cardiac death [1]. Therefore, prediction of VT/VF
prior to their initiation is vital to avoid delay of rescue
actions [2].
Researchers has discovered that ECG signals comprise
non-invasive parameters that could reflect underlying VT/
VF [3–5]. The ECG parameters, such as fragmented QRS
(fQRS), heart rate variability (HRV), T peak-T end (TpTe),
heart rate turbulence (HRT) and T wave alternans (TWA)
have predictive value for the arrhythmic events [6–8]. In
this case, cardiac monitoring by analyzing the ECG
parameters is an effective way to determine future occur-
rence of the fatal VT/VF.
In order to track development of the ECG parameters as
promising predictors, a comprehensive review is necessary.
A few reports, such in [3, 4] seem can be considered falls
into this area. However, they lack of effective way to
present pattern of various ECG parameters prior to the
occurrence of the VAs. It is hard to distinguish the patterns
that represent increased risk of the arrhythmias from these
detailed reviews [3, 4]. This is because of authors of the
reviews tend to introduce the identified parameters without
grouping their similarity in patterns prior to the
arrhythmias.
Second, the reports are also not clearly in defining how
to consider the patterns as abnormal. For example,
researchers in [3] only present a hazard ratio for sudden
death due to abnormal QT prolongation, but not range of
the parameters that are considered as abnormal. In this
case, the researchers have to find out certain values that can
& Satria Mandala
1 Fakultas Informatika, Universitas Telkom, Jl.
Telekomunikasi Terusan Buah Batu, Bandung 40257,
Indonesia
2 IJN-UTM Cardiovascular Engineering Centre, Universiti
Teknologi Malaysia, Johor, Malaysia
123
J. Med. Biol. Eng. (2017) 37:441–453
DOI 10.1007/s40846-017-0281-x
represent the abnormality via either experiments or other
literatures. This process is scientifically proven time-
consuming.
Third, these reports have not included approaches to
increase detection accuracy of the parameters. The detec-
tion accuracy is important because the abnormal patterns
may undetected if the parameters fail to be accurately
identified. A report that is presented in [4] stated conflict-
ing results of prolonged QT interval (QTi) as predictors
when there are difficulties in measuring the QTi correctly.
The discussed problems so far leave three important
questions unanswered:
i. How to effectively present the patterns of the ECG
parameters prior to occurrence of the VAs?
ii. How to identify abnormal patterns for the
parameters?
iii. How to improve detection accuracy of the ECG
parameters?
These problems are selected to be solved since the
solutions are beneficial in two aspects. Firstly, they could
speed up the process of reviewing the parameters. It is
because the brief information of the parameters will be
firstly presented in a table before further discussion. The
solutions simplify relevant information for the ECG
parameters and thus researchers can have a clear idea of the
parameters. Secondly, they provide a way to improve
quality of researches. The researches that have unsatisfied
prediction result can apply the solutions in the review to
produce better outcome.
To address above the problems, this article covers
results of works as follows:
i. This paper groups the patterns for the increased risk
of the arrhythmias based on behavior changes of
these ECG parameters before the arrhythmias. Some
parameters are absent in normal condition of cardiac
patients, and only present before the VAs onset.
There are also parameters that indicate the future
VAs if prolong or decrease until certain ranges. The
behavior changes could be increase, decrease or
presence. The groups of the parameters will be
further discussed in details in Sect. 3.
ii. This paper describes abnormal behaviors of the
parameters according to their normal ranges. As
aforementioned, the parameters, which have value
either higher or lower than certain range, have been
considered as increased risk for the arrhythmic
events. For instance, patients with TpTe greater than
100 ms have increased risk of the VT/VF [7–9].
Gender could be a factor that affects the abnormal
range for the parameters, such as HRV and QTi
[10, 11].
iii. The parameters are mostly derived from two ECG
components, namely QRS duration and T-wave. This
paper has identified several suggested methods from
literatures to increase correct detection rate of the
parameters used in the VAs prediction.
This paper consists of six sections. It begins with an
Introduction section, followed by four sections that
describe ECG parameters that can predict the life-threat-
ening VT/VF, and ends with a Conclusion section. The first
section explains selection of the potential ECG parameters.
The next two sections are inline with the identified three
problems. And, the fourth section provides a discussion on
the selected ten ECG parameters that have predictive value
for occurrence of VAs.
2 Identification and Selection of ECG Parametersthat have Predictive Value for VA Onset
There are many ECG parameters that have been reviewed
before, such as early repolarization, QTi/QT dispersion,
signal-averaged ECG, and HRV [3, 4]. However, these
reviews still have disadvantages as stated in Sect. 1.
Moreover, there might have other new potential parameters
in the recent years. In this case, this paper will select the
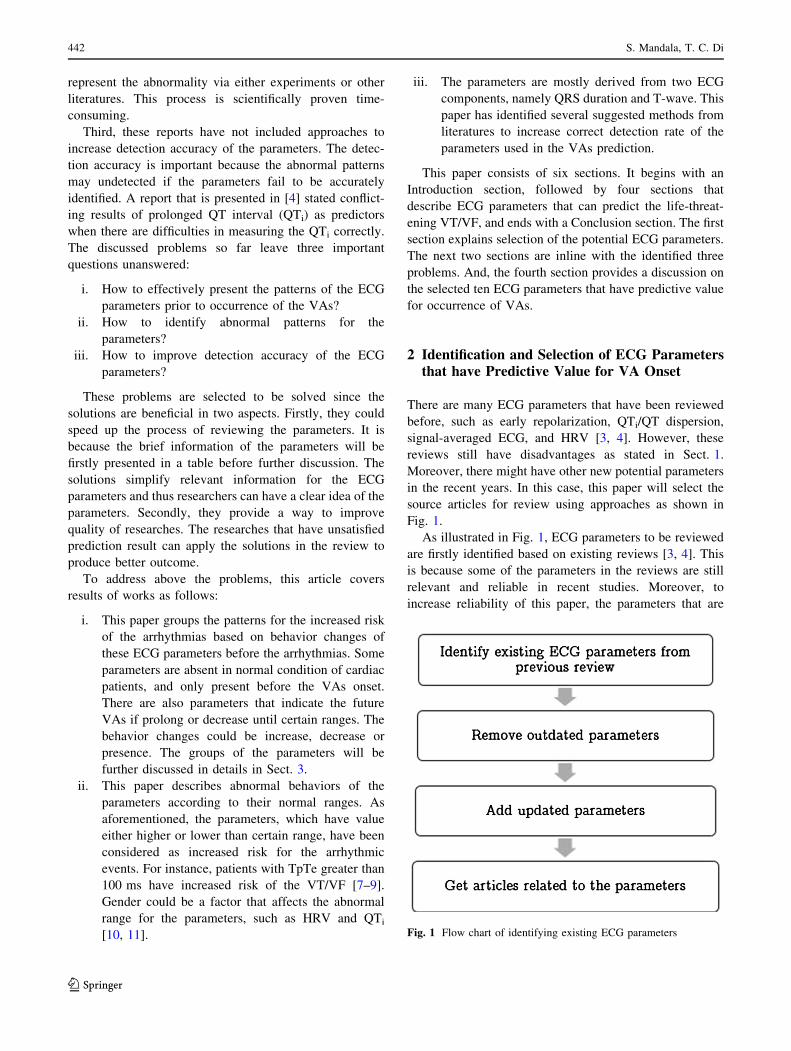
source articles for review using approaches as shown in
Fig. 1.
As illustrated in Fig. 1, ECG parameters to be reviewed
are firstly identified based on existing reviews [3, 4]. This
is because some of the parameters in the reviews are still
relevant and reliable in recent studies. Moreover, to
increase reliability of this paper, the parameters that are
Fig. 1 Flow chart of identifying existing ECG parameters
442 S. Mandala, T. C. Di
123
lack of related researches in last 10 years are removed. In
addition, the potential parameters that are newly discov-
ered in recent 5 years will be included in the review. Based
on the aforementioned selection, ten parameters from 25
articles will be included for review, as shown in Table 1.
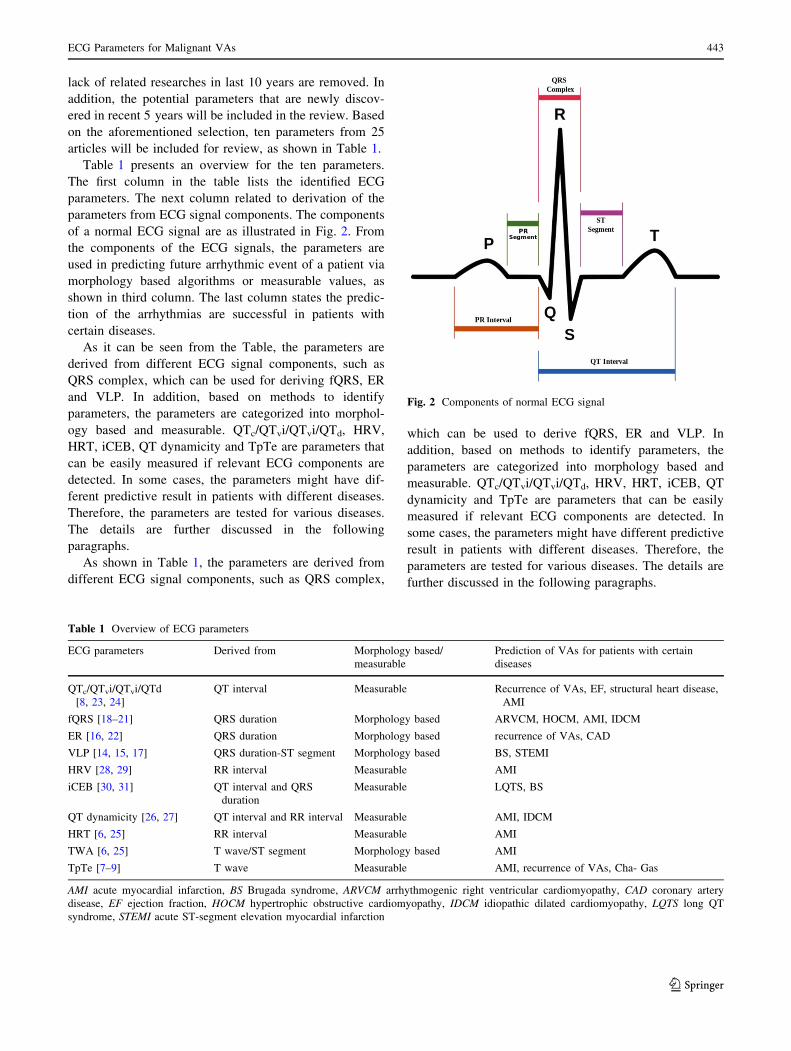
Table 1 presents an overview for the ten parameters.
The first column in the table lists the identified ECG
parameters. The next column related to derivation of the
parameters from ECG signal components. The components
of a normal ECG signal are as illustrated in Fig. 2. From
the components of the ECG signals, the parameters are
used in predicting future arrhythmic event of a patient via
morphology based algorithms or measurable values, as
shown in third column. The last column states the predic-
tion of the arrhythmias are successful in patients with
certain diseases.
As it can be seen from the Table, the parameters are
derived from different ECG signal components, such as
QRS complex, which can be used for deriving fQRS, ER
and VLP. In addition, based on methods to identify
parameters, the parameters are categorized into morphol-
ogy based and measurable. QTc/QTvi/QTvi/QTd, HRV,
HRT, iCEB, QT dynamicity and TpTe are parameters that
can be easily measured if relevant ECG components are
detected. In some cases, the parameters might have dif-
ferent predictive result in patients with different diseases.
Therefore, the parameters are tested for various diseases.
The details are further discussed in the following
paragraphs.
As shown in Table 1, the parameters are derived from
different ECG signal components, such as QRS complex,
which can be used to derive fQRS, ER and VLP. In
addition, based on methods to identify parameters, the
parameters are categorized into morphology based and
measurable. QTc/QTvi/QTvi/QTd, HRV, HRT, iCEB, QT
dynamicity and TpTe are parameters that can be easily
measured if relevant ECG components are detected. In
some cases, the parameters might have different predictive
result in patients with different diseases. Therefore, the
parameters are tested for various diseases. The details are
further discussed in the following paragraphs.
Table 1 Overview of ECG parameters
ECG parameters Derived from Morphology based/
measurable
Prediction of VAs for patients with certain
diseases
QTc/QTvi/QTvi/QTd
[8, 23, 24]
QT interval Measurable Recurrence of VAs, EF, structural heart disease,
AMI
fQRS [18–21] QRS duration Morphology based ARVCM, HOCM, AMI, IDCM
ER [16, 22] QRS duration Morphology based recurrence of VAs, CAD
VLP [14, 15, 17] QRS duration-ST segment Morphology based BS, STEMI
HRV [28, 29] RR interval Measurable AMI
iCEB [30, 31] QT interval and QRS
duration
Measurable LQTS, BS
QT dynamicity [26, 27] QT interval and RR interval Measurable AMI, IDCM
HRT [6, 25] RR interval Measurable AMI
TWA [6, 25] T wave/ST segment Morphology based AMI
TpTe [7–9] T wave Measurable AMI, recurrence of VAs, Cha- Gas
AMI acute myocardial infarction, BS Brugada syndrome, ARVCM arrhythmogenic right ventricular cardiomyopathy, CAD coronary artery
disease, EF ejection fraction, HOCM hypertrophic obstructive cardiomyopathy, IDCM idiopathic dilated cardiomyopathy, LQTS long QT
syndrome, STEMI acute ST-segment elevation myocardial infarction
Fig. 2 Components of normal ECG signal
ECG Parameters for Malignant VAs 443
123
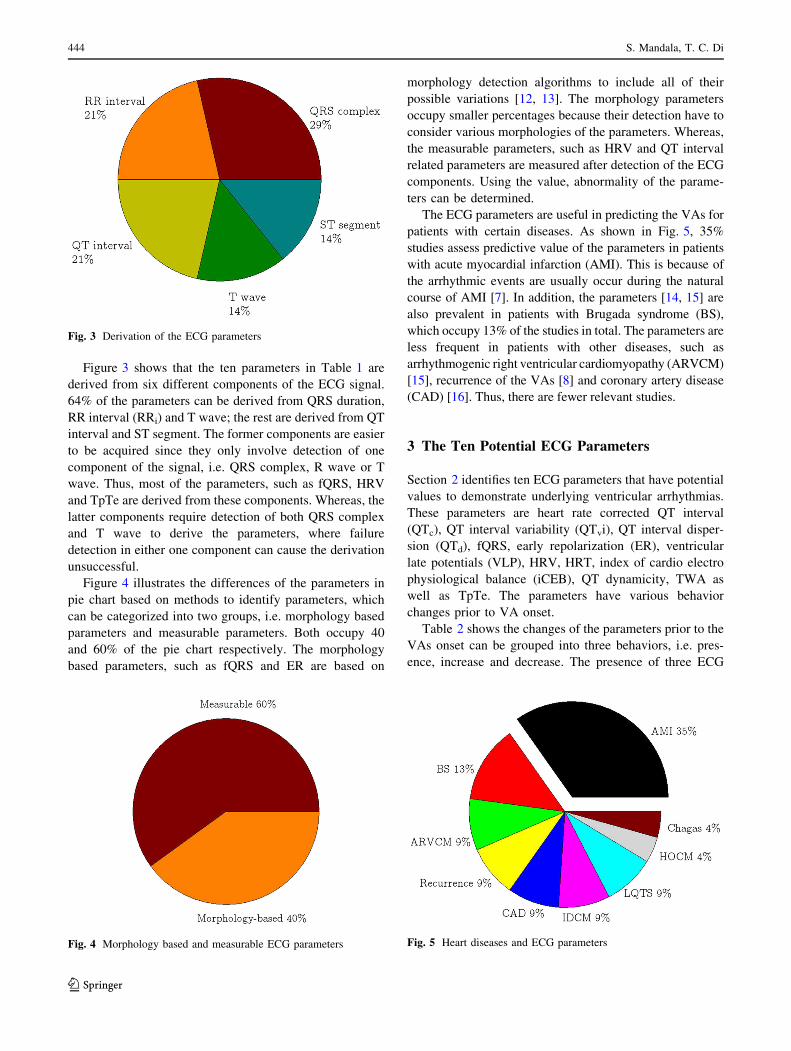
Figure 3 shows that the ten parameters in Table 1 are
derived from six different components of the ECG signal.
64% of the parameters can be derived from QRS duration,
RR interval (RRi) and T wave; the rest are derived from QT
interval and ST segment. The former components are easier
to be acquired since they only involve detection of one
component of the signal, i.e. QRS complex, R wave or T
wave. Thus, most of the parameters, such as fQRS, HRV
and TpTe are derived from these components. Whereas, the
latter components require detection of both QRS complex
and T wave to derive the parameters, where failure
detection in either one component can cause the derivation
unsuccessful.
Figure 4 illustrates the differences of the parameters in
pie chart based on methods to identify parameters, which
can be categorized into two groups, i.e. morphology based
parameters and measurable parameters. Both occupy 40
and 60% of the pie chart respectively. The morphology
based parameters, such as fQRS and ER are based on
morphology detection algorithms to include all of their
possible variations [12, 13]. The morphology parameters
occupy smaller percentages because their detection have to
consider various morphologies of the parameters. Whereas,
the measurable parameters, such as HRV and QT interval
related parameters are measured after detection of the ECG
components. Using the value, abnormality of the parame-
ters can be determined.
The ECG parameters are useful in predicting the VAs for
patients with certain diseases. As shown in Fig. 5, 35%
studies assess predictive value of the parameters in patients
with acute myocardial infarction (AMI). This is because of
the arrhythmic events are usually occur during the natural
course of AMI [7]. In addition, the parameters [14, 15] are
also prevalent in patients with Brugada syndrome (BS),
which occupy 13% of the studies in total. The parameters are
less frequent in patients with other diseases, such as
arrhythmogenic right ventricular cardiomyopathy (ARVCM)
[15], recurrence of the VAs [8] and coronary artery disease
(CAD) [16]. Thus, there are fewer relevant studies.
3 The Ten Potential ECG Parameters
Section 2 identifies ten ECG parameters that have potential
values to demonstrate underlying ventricular arrhythmias.
These parameters are heart rate corrected QT interval
(QTc), QT interval variability (QTvi), QT interval disper-
sion (QTd), fQRS, early repolarization (ER), ventricular
late potentials (VLP), HRV, HRT, index of cardio electro
physiological balance (iCEB), QT dynamicity, TWA as
well as TpTe. The parameters have various behavior
changes prior to VA onset.
Table 2 shows the changes of the parameters prior to the
VAs onset can be grouped into three behaviors, i.e. pres-
ence, increase and decrease. The presence of three ECG
Fig. 3 Derivation of the ECG parameters
Fig. 5 Heart diseases and ECG parametersFig. 4 Morphology based and measurable ECG parameters
444 S. Mandala, T. C. Di
123
parameters, namely VLP [14, 15, 17], fQRS [18–21] and
ER [16, 22] could be associated with an increased inci-
dence of ventricular arrhythmic events. These three
parameters appear precede the arrhythmic event. As listed
in Table 2, it is also found that the increased risk of the VT/
VF occurrence can be represented by either prolongation or
reduction of the parameters, based on certain abnormal
range. The increase or prolongation value of the parame-
ters, including TpTe [7–9], heart rate corrected QT interval
(QTc) [8] /QTvi [23] /QTd [8, 24], turbulence onset (TO) of
HRT [25], QT dynamicity [26, 27], as well as TWA [6, 25]
might indicate higher risk for the arrhythmias. Table 2 also
reveals that the increased risk of the arrhythmias can also
be represented by decrease or reduction in ECG parame-
ters, such as HRV [28, 29] and turbulence slope (TS) of
HRT [6, 25]. The iCEB [30, 31] is the most potential
predictor for predicting an increased susceptibility to tor-
sades de pointes (TdP) or non-TdP VT/VF based on its
increase or decrease value.
The increase or decrease of the parameters can be
identified according to certain ranges. In reviewed litera-
tures, researchers utilized two methods to define abnormal
ranges. Firstly, the researchers match the parameters with
predefined threshold values that indicate the abnormal
ranges. The parameters that have abnormal prolongation
prior to the arrhythmias are iCEB, QT dynamicity, QTc/
QTvi/QTd, TO of HRT, TWA and TpTe. Whereas, the
parameters that have lower values than normal heart con-
dition are HRV and TS of HRT. The parameters, such as
fQRS, VLP and ER, in which their presence indicate the
increased risk of VAs can also be identified using prede-
fined thresholds. The details of the parameters are dis-
cussed further in the following subsections. Secondly, the
researchers compare the parameters in two groups, namely
healthy people and patients prone to the arrhythmias [28].
Using extracted values from these two groups, the
researchers should identify threshold that represents higher
risk of VAs occurrence. This method may be more suit-
able for group of study subjects that have no gender and
age control. This is because of gender and age could be two
factors that affect the abnormal ranges.
In order to know whether the parameters are beneficial
in clinical practice to guide decision making, a cutoff for
predicted probability is needed. An optimal cutoff is
defined by decision context. Once the cutoff is selected,
clinical usefulness measures can be defined [32]. The
measures used in reviewed articles that listed in Table 1 are
P value (P), accuracy (Ac), sensitivity (Se), specificity (Sp),
positive predictive value (?P) and area under receiver
operating characteristic curve (ROC-AUC). According to
the reviewed literatures, P value is the most commonly
used measure. The P value is a probability of obtaining an
observed result, plus more extreme result, assuming the
truth of the null hypothesis. Statistically significant P value
(e.g. P\ 0.05) is not informative about data that are ana-
lyzing, i.e. the data are unlikely with a true null hypothesis
[33]. This provides substantial evidence that the null
hypothesis can be rejected. Whereas, ROC-AUC ranged
from 0 to 1. An area of 1 represents a perfect test; an area
of 0.5 represents a worthless test [6].
In addition, Ac is a ratio of total correct assessments to
all assessments, where Ac = (TN ? TP)/
(TN ? TP ? FN ? FP). Next, Se is related to an ability to
correctly identify patients with VT/VF risk, where
Se = TP/(TP ? FN). Sp is related to an ability to correctly
identify either normal people or patients with VT/VF risk,
where Sp = TN/(TN ? FP). And, ?P is a probability
where a patient with positive test is actually at risk of VT/
VF, where ?P = TP/(TP ? FP). These four measures
represent a perfect test if 100% is obtained. Using the
aforementioned clinical usefulness measures, the ten
potential ECG parameters are discussed together with their
behavior changes preceding VAs onset in the following
subsections.
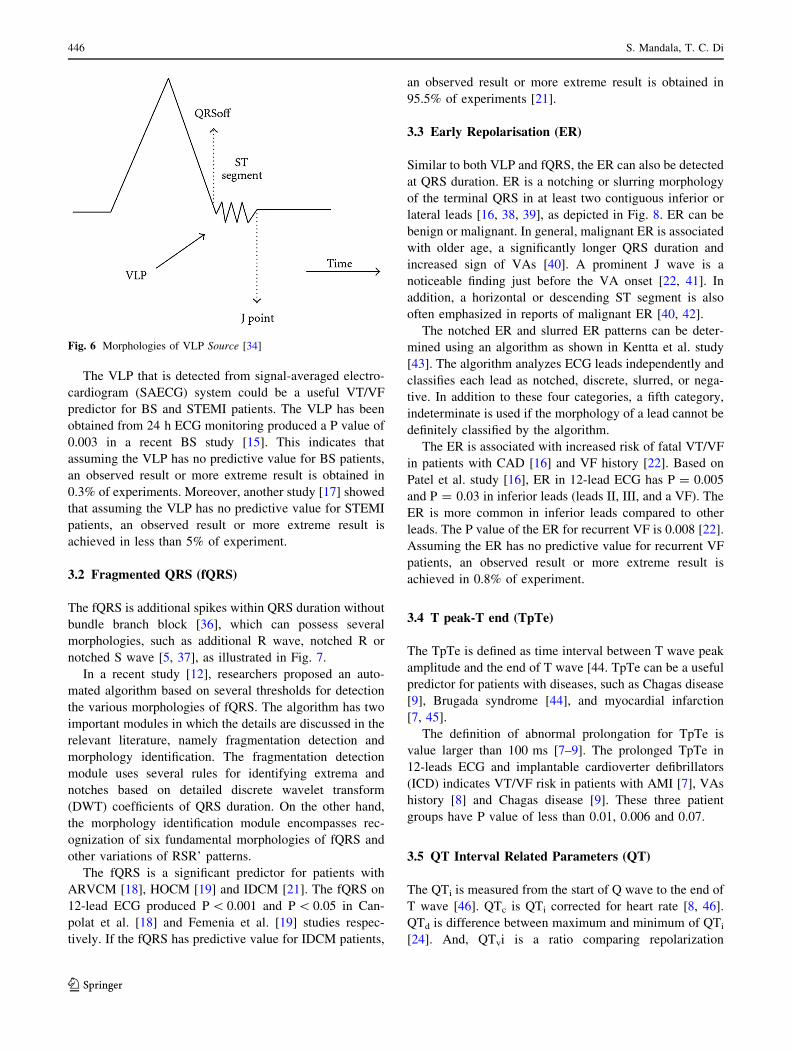
3.1 Ventricular Late Potentials (VLP)
The VLP is a high-frequency and very-low-intensity signal
that is localized at the end of QRS duration, and on the
beginning part of ST segment [34], as shown in Fig. 6.
The presence of the VLPs can be identified using pre-
defined thresholds. According to studies [17, 35], the VLPs
exist if three conditions of a filtered QRS duration are met.
The first condition is the filtered QRS duration is at least
114 ms. And, the filtered QRS duration that has low
amplitude signal (\40 lV) in the terminal portion of the
filtered QRS duration of at least 38 ms. The last condition
is a root mean square of at most 20 lV in the terminal
portion of the filtered QRS duration of 40 ms.
Table 2 ECG parameters and their behaviours prior to ventricular
arrhythmias
ECG parameter Behavior
Presence Increase/prolongation Decrease
QTc/QTvi/QTd fQRS 4
ER 4
VLP 4
HRV 4 4
iCEB 4 4
QT dynamicity 4
HRT 4 (TO) 4 (TS)
TWA 4
TpTe 4
ECG Parameters for Malignant VAs 445
123
The VLP that is detected from signal-averaged electro-
cardiogram (SAECG) system could be a useful VT/VF
predictor for BS and STEMI patients. The VLP has been
obtained from 24 h ECG monitoring produced a P value of
0.003 in a recent BS study [15]. This indicates that
assuming the VLP has no predictive value for BS patients,
an observed result or more extreme result is obtained in
0.3% of experiments. Moreover, another study [17] showed
that assuming the VLP has no predictive value for STEMI
patients, an observed result or more extreme result is
achieved in less than 5% of experiment.
3.2 Fragmented QRS (fQRS)
The fQRS is additional spikes within QRS duration without
bundle branch block [36], which can possess several
morphologies, such as additional R wave, notched R or
notched S wave [5, 37], as illustrated in Fig. 7.
In a recent study [12], researchers proposed an auto-
mated algorithm based on several thresholds for detection
the various morphologies of fQRS. The algorithm has two
important modules in which the details are discussed in the
relevant literature, namely fragmentation detection and
morphology identification. The fragmentation detection
module uses several rules for identifying extrema and
notches based on detailed discrete wavelet transform
(DWT) coefficients of QRS duration. On the other hand,
the morphology identification module encompasses rec-
ognization of six fundamental morphologies of fQRS and
other variations of RSR’ patterns.
The fQRS is a significant predictor for patients with
ARVCM [18], HOCM [19] and IDCM [21]. The fQRS on
12-lead ECG produced P\ 0.001 and P\ 0.05 in Can-
polat et al. [18] and Femenia et al. [19] studies respec-
tively. If the fQRS has predictive value for IDCM patients,
an observed result or more extreme result is obtained in
95.5% of experiments [21].
3.3 Early Repolarisation (ER)
Similar to both VLP and fQRS, the ER can also be detected
at QRS duration. ER is a notching or slurring morphology
of the terminal QRS in at least two contiguous inferior or
lateral leads [16, 38, 39], as depicted in Fig. 8. ER can be
benign or malignant. In general, malignant ER is associated
with older age, a significantly longer QRS duration and
increased sign of VAs [40]. A prominent J wave is a
noticeable finding just before the VA onset [22, 41]. In
addition, a horizontal or descending ST segment is also
often emphasized in reports of malignant ER [40, 42].
The notched ER and slurred ER patterns can be deter-
mined using an algorithm as shown in Kentta et al. study
[43]. The algorithm analyzes ECG leads independently and
classifies each lead as notched, discrete, slurred, or nega-
tive. In addition to these four categories, a fifth category,
indeterminate is used if the morphology of a lead cannot be
definitely classified by the algorithm.
The ER is associated with increased risk of fatal VT/VF
in patients with CAD [16] and VF history [22]. Based on
Patel et al. study [16], ER in 12-lead ECG has P = 0.005
and P = 0.03 in inferior leads (leads II, III, and a VF). The
ER is more common in inferior leads compared to other
leads. The P value of the ER for recurrent VF is 0.008 [22].
Assuming the ER has no predictive value for recurrent VF
patients, an observed result or more extreme result is
achieved in 0.8% of experiment.
3.4 T peak-T end (TpTe)
The TpTe is defined as time interval between T wave peak
amplitude and the end of T wave [44. TpTe can be a useful
predictor for patients with diseases, such as Chagas disease
[9], Brugada syndrome [44], and myocardial infarction
[7, 45].
The definition of abnormal prolongation for TpTe is
value larger than 100 ms [7–9]. The prolonged TpTe in
12-leads ECG and implantable cardioverter defibrillators
(ICD) indicates VT/VF risk in patients with AMI [7], VAs
history [8] and Chagas disease [9]. These three patient
groups have P value of less than 0.01, 0.006 and 0.07.
3.5 QT Interval Related Parameters (QT)
The QTi is measured from the start of Q wave to the end of
T wave [46]. QTc is QTi corrected for heart rate [8, 46].
QTd is difference between maximum and minimum of QTi
[24]. And, QTvi is a ratio comparing repolarization
Fig. 6 Morphologies of VLP Source [34]
446 S. Mandala, T. C. Di
123

variability to HRV [47]. Equations for the QTi related
parameters are as shown in Eqs. 1, 2, and 3.
QTcðBazettformulaÞ ¼ QTixp
1=RRð Þ ð1Þ
where RRi is measured from one R wave to the next R
wave before the QTi
QTd ¼ QTmax � QTmin ð2Þ
QTvi ¼ logð varianceQTi=meanQT2
� �= varianceRR=meanRR2� �
Þð3Þ
Fig. 7 Morphologies of fragmented QRS Source [36]
Fig. 8 Morphologies of early repolarization
ECG Parameters for Malignant VAs 447
123
The abnormal ranges for QTc, QTd and QTvi are values
greater than 460 ms, 65 ms and -0.47 respectively [8, 48].
According to Cox [10], the normal QTi usually ranged
from 0.36 to 0.44 s. From these ranges, adult males have
shorter range than adult females, and people from age 1 to
15 are in between them, as shown in Table 3. According to
the table, QTi with value greater than 0.47 s is considered
as dangerous for any gender or age.
Measuring of the QT related parameters can detect
patients who are at increased risk of developing VT/VF and
with diseases such as structural heart disease [23], AMI
[24] and VAs history [8]. If the QTvi on ICD has predictive
value for patients with structural heart disease, an observed
result or more extreme is obtained in more than 96% of
experiments [21]. Assuming the QTi has no predictive
value for patients with no recurrence of VAs and AMI, an
observed result or more extreme result is achieved in less
than 1.1 and 0.1% of experiments respectively [8, 24].
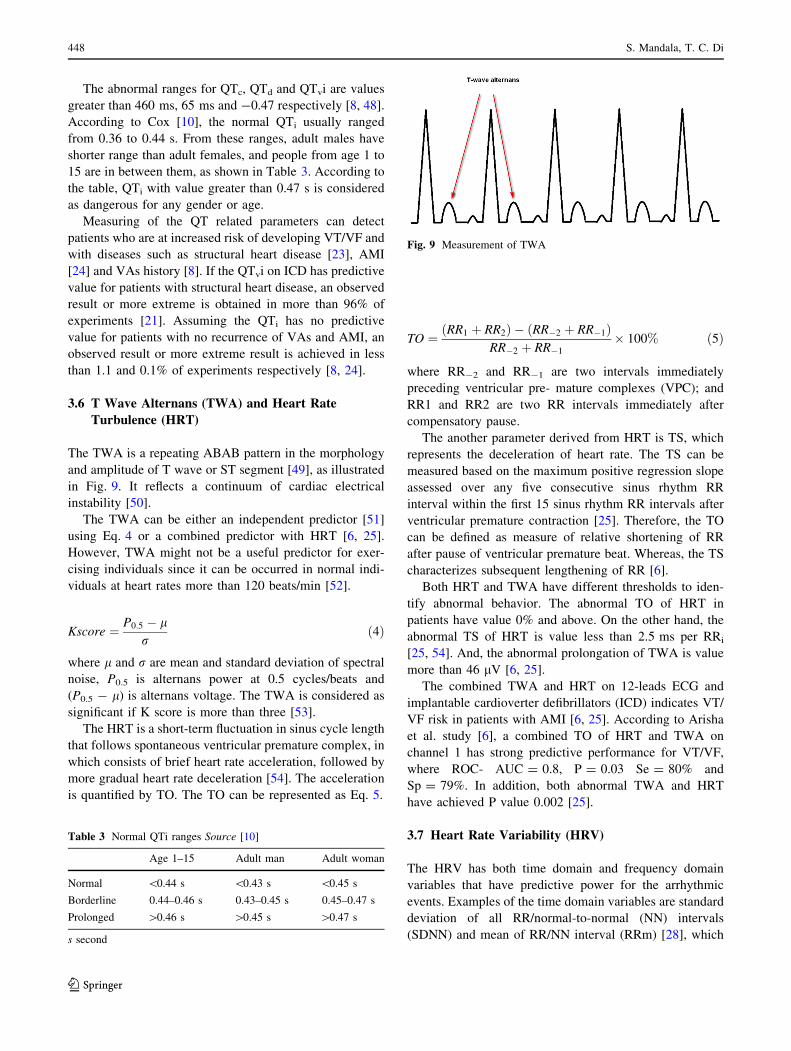
3.6 T Wave Alternans (TWA) and Heart Rate
Turbulence (HRT)
The TWA is a repeating ABAB pattern in the morphology
and amplitude of T wave or ST segment [49], as illustrated
in Fig. 9. It reflects a continuum of cardiac electrical
instability [50].
The TWA can be either an independent predictor [51]
using Eq. 4 or a combined predictor with HRT [6, 25].
However, TWA might not be a useful predictor for exer-
cising individuals since it can be occurred in normal indi-
viduals at heart rates more than 120 beats/min [52].
Kscore ¼ P0:5 � lr
ð4Þ
where l and r are mean and standard deviation of spectral
noise, P0.5 is alternans power at 0.5 cycles/beats and
(P0.5 - l) is alternans voltage. The TWA is considered as
significant if K score is more than three [53].
The HRT is a short-term fluctuation in sinus cycle length
that follows spontaneous ventricular premature complex, in
which consists of brief heart rate acceleration, followed by
more gradual heart rate deceleration [54]. The acceleration
is quantified by TO. The TO can be represented as Eq. 5.
TO ¼ RR1 þ RR2ð Þ � RR�2 þ RR�1ð ÞRR�2 þ RR�1
� 100% ð5Þ
where RR-2 and RR-1 are two intervals immediately
preceding ventricular pre- mature complexes (VPC); and
RR1 and RR2 are two RR intervals immediately after
compensatory pause.
The another parameter derived from HRT is TS, which
represents the deceleration of heart rate. The TS can be
measured based on the maximum positive regression slope
assessed over any five consecutive sinus rhythm RR
interval within the first 15 sinus rhythm RR intervals after
ventricular premature contraction [25]. Therefore, the TO
can be defined as measure of relative shortening of RR
after pause of ventricular premature beat. Whereas, the TS
characterizes subsequent lengthening of RR [6].
Both HRT and TWA have different thresholds to iden-
tify abnormal behavior. The abnormal TO of HRT in
patients have value 0% and above. On the other hand, the
abnormal TS of HRT is value less than 2.5 ms per RRi
[25, 54]. And, the abnormal prolongation of TWA is value
more than 46 lV [6, 25].
The combined TWA and HRT on 12-leads ECG and
implantable cardioverter defibrillators (ICD) indicates VT/
VF risk in patients with AMI [6, 25]. According to Arisha
et al. study [6], a combined TO of HRT and TWA on
channel 1 has strong predictive performance for VT/VF,
where ROC- AUC = 0.8, P = 0.03 Se = 80% and
Sp = 79%. In addition, both abnormal TWA and HRT
have achieved P value 0.002 [25].
3.7 Heart Rate Variability (HRV)
The HRV has both time domain and frequency domain
variables that have predictive power for the arrhythmic
events. Examples of the time domain variables are standard
deviation of all RR/normal-to-normal (NN) intervals
(SDNN) and mean of RR/NN interval (RRm) [28], which
Table 3 Normal QTi ranges Source [10]
Age 1–15 Adult man Adult woman
Normal \0.44 s \0.43 s \0.45 s
Borderline 0.44–0.46 s 0.43–0.45 s 0.45–0.47 s
Prolonged [0.46 s [0.45 s [0.47 s
s second
Fig. 9 Measurement of TWA
448 S. Mandala, T. C. Di
123
can be expressed as Eqs. 6 and 7; examples of the fre-
quency domain features are low frequency (LF) and high
frequency (HF) components [28, 55].
RRmean ¼ 1=nX
RRi ð6Þ
SDNN ¼ffiffiffiffiffiffiffiffiffiffiffiffiffiffiffiffiffiffiffiffiffiffiffiffiffiffiffiffiffiffiffiffiffiffiffiffiffiffiffiffiffiffiffiffiffiffiffi1=n
XðRRi � RRmeanÞ2
qð7Þ
The abnormal HRV can be recognized by comparing
both normal range of HRV in healthy people and abnormal
range in patients prone to the arrhythmias. In average,
normal range of HRV for females is low than males [56].
Statistics for the normal ranges of HRV parameters are as
illustrated in Table 4. Comparison of both time domain and
frequency domain parameters amongst males and females
showed attenuated HRV in females. Among the HRV
parameters, SDNNi and LF are found significantly
decreased in females, i.e. P\ 0.05.
In this review, the HRV is the only one predictor that is
used in short term VT/VF prediction. Ebrahimzadeh et al.
[28] shows time–frequency and non-linear features of HRV
on 24 h ECG can predict the VT/VF that cause sudden
cardiac death. The prediction time is four minutes prior to
its occurrence, with accuracy more than 83%. Rozen et al.
study [29] also reveals that HRV is predictor for imminent
VT with 50% Se, 91.6% Sp and 84.5% ?P.
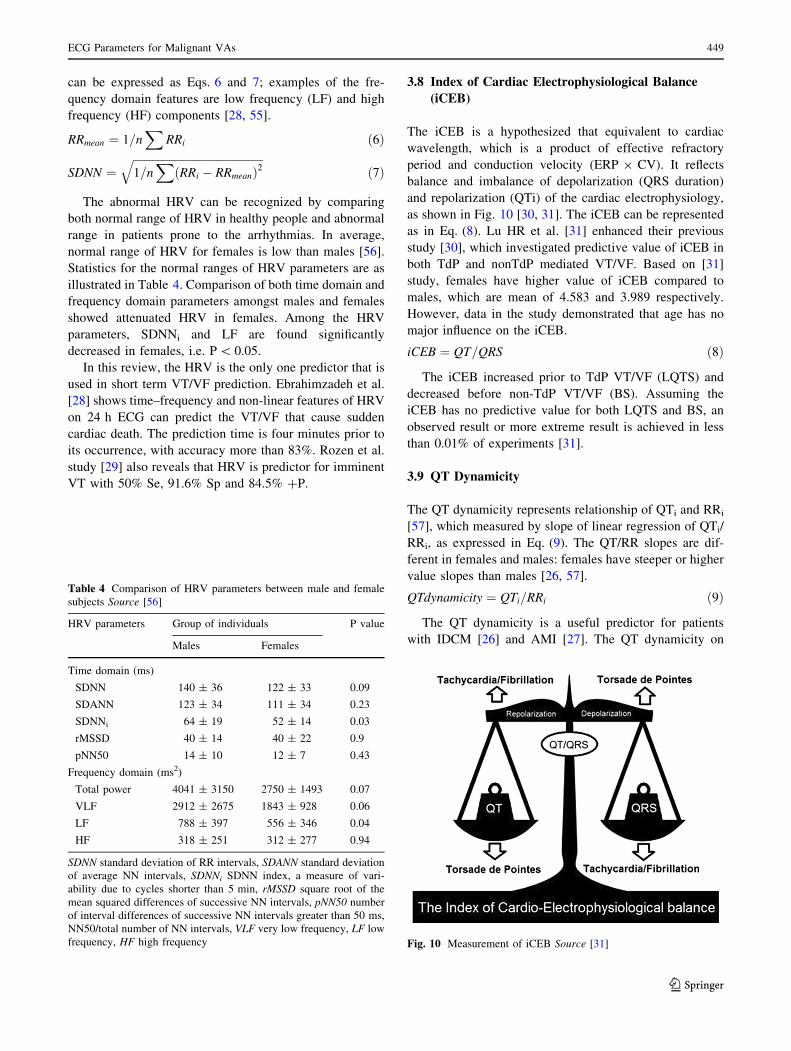
3.8 Index of Cardiac Electrophysiological Balance
(iCEB)
The iCEB is a hypothesized that equivalent to cardiac
wavelength, which is a product of effective refractory
period and conduction velocity (ERP 9 CV). It reflects
balance and imbalance of depolarization (QRS duration)
and repolarization (QTi) of the cardiac electrophysiology,
as shown in Fig. 10 [30, 31]. The iCEB can be represented
as in Eq. (8). Lu HR et al. [31] enhanced their previous
study [30], which investigated predictive value of iCEB in
both TdP and nonTdP mediated VT/VF. Based on [31]
study, females have higher value of iCEB compared to
males, which are mean of 4.583 and 3.989 respectively.
However, data in the study demonstrated that age has no
major influence on the iCEB.
iCEB ¼ QT=QRS ð8Þ
The iCEB increased prior to TdP VT/VF (LQTS) and
decreased before non-TdP VT/VF (BS). Assuming the
iCEB has no predictive value for both LQTS and BS, an
observed result or more extreme result is achieved in less
than 0.01% of experiments [31].
3.9 QT Dynamicity
The QT dynamicity represents relationship of QTi and RRi
[57], which measured by slope of linear regression of QTi/
RRi, as expressed in Eq. (9). The QT/RR slopes are dif-
ferent in females and males: females have steeper or higher
value slopes than males [26, 57].
QTdynamicity ¼ QTi=RRi ð9Þ
The QT dynamicity is a useful predictor for patients
with IDCM [26] and AMI [27]. The QT dynamicity on
Table 4 Comparison of HRV parameters between male and female
subjects Source [56]
HRV parameters Group of individuals P value
Males Females
Time domain (ms)
SDNN 140 ± 36 122 ± 33 0.09
SDANN 123 ± 34 111 ± 34 0.23
SDNNi 64 ± 19 52 ± 14 0.03
rMSSD 40 ± 14 40 ± 22 0.9
pNN50 14 ± 10 12 ± 7 0.43
Frequency domain (ms2)
Total power 4041 ± 3150 2750 ± 1493 0.07
VLF 2912 ± 2675 1843 ± 928 0.06
LF 788 ± 397 556 ± 346 0.04
HF 318 ± 251 312 ± 277 0.94
SDNN standard deviation of RR intervals, SDANN standard deviation
of average NN intervals, SDNNi SDNN index, a measure of vari-
ability due to cycles shorter than 5 min, rMSSD square root of the
mean squared differences of successive NN intervals, pNN50 number
of interval differences of successive NN intervals greater than 50 ms,
NN50/total number of NN intervals, VLF very low frequency, LF low
frequency, HF high frequency Fig. 10 Measurement of iCEB Source [31]
ECG Parameters for Malignant VAs 449
123

12-lead ECG is significantly associated with the VT/VF
event (P\ 0.001). Assuming the QT dynamicity has no
predictive value for IDCM patients, an observed result or
more extreme result is obtained in less than 0.1% of
experiments [26].
4 Methods to Improve Detectionof the Parameters
Parameters detection is done after preprocessing, i.e.
denoise and restructure of ECG signals. However, false
detection of the parameters always happens. This may due
to misclassification of wide QRS duration as prolonged
QTi, irregular heart rhythms, as well as slow transition of
the signal around T wave end [10, 13]. In order to increase
correct detection rate of the parameters identified in
Sect. 3, three methods are suggested in this paper.
The first method is averaging, i.e. mean for datasets of
parameters. This method is useful to resist fluctuation
between the data of each parameter. In this case, Cox [10]
recommended to measure the QTi by averaging five or six
QTi. Similar for TS of HRT, calculation of TS is based on
maximum positive regression slope assessed over any five
consecutive sinus rhythm RR interval within the first 15
sinus rhythm RR intervals after ventricular premature
contraction [25].
The second method is handling of outliers. Presence of
outliers, even a very little amount can produce a significant
change in the parameters. After identified the outliers, either
tossing (removing the outliers) or interpolation (replacing
the outliers) can be performed [58]. The definition of outliers
may vary among the parameters. For example, there are
some recommendation for HRT detection during filtering of
RRi sequences. The filtering should include either substan-
tial beat to beat RR intervals difference that are more than
200 ms or substantial difference from an average of five
preceding sinus RR intervals that are more than 20%. And,
the filtering is recommended to exclude RR intervals that are
not in range of 300–2000 ms (outliers) [54].
The third method is application of morphology based
algorithms, in which as discussed in Sect. 3. This method is
faster than traditional visual assessment (determination of
the parameters by experienced ECG signal readers). And, it
is especially useful for detection of multiple variations of
ECG components such as fQRS and ER. The detailed
algorithms are as discussed in [12, 13, 43]. The morphol-
ogy detection algorithm for fQRS is based on number of
identified extrema and notches, point of occurrence of
discontinuities, as well as morphology of fragmentation
[12]. Whereas, the notched ER and slurred ER patterns are
determined using algorithm as in Kentta et al. study [43].
There are also some additional recommended settings in
the reviewed literatures for the parameters. For instance,
suggested frequency band for LF and HF in HRV are
0.04–0.15 and 0.15–0.4 Hz respectively [28, 55]. Whereas,
a higher cutoff frequency of low-pass filter (150 Hz) is
needed in order to detect fQRS, else additional spikes
within a QRS complex will be masked [36].
5 Discussion
As showed in Sect. 2, there are ten ECG parameters have
been reviewed, namely QTc/QTvi/QTvi/QTd, fQRS, ER,
VLP, HRV, HRT, TWA as well as TpTe. These parameters
are popular in recent studies and thus investigation
regarding to the parameters is necessary.
The aforementioned parameters have achieved signifi-
cant prediction results in most of the studies; however,
some literatures reported that predictive value of the
parameters in patients with certain heart diseases are
insignificant. From Table 1, it is showed that fQRS have
received more attention than other six parameters. The
fQRS is a possible new index to identify high-risk patients
in arrhythmic events [18], its prognostic role is less known
and therefore many studies are done to confirm its pre-
dictive value. In the study [59], fQRS in patients with
Chagas’s cardiomyopathy are failed to predict the
arrhythmic events, although there are many successful
evidences in patients with AMI [20], HOCM [19], as well
as ARVCM [18]. Similar to fQRS, the VLP is a poor
predictor in patients with NSTEMI and ARVCM [15, 17].
Furthermore, most of the reviewed literatures may only
reflect the occurrence of VT/VF after a few months or
years (long-term) [6–9], but not minutes or hours (short-
term). Only HRV has shown short-term predictive value
for the arrhythmic event [28, 29]. However, there is another
study found no significant association between short-term
prediction and parameters such as HRV and QTvi [60]. The
conflicting result of HRV as short-term predictor in both
studies [28, 60] may due to small sample size and HRV
parameters choose in the VAs prediction.
Section 3 has shown there are three main patterns of the
parameters that are associated with future VAs, i.e. pres-
ence, prolong and decrease. Among these patterns, the
presence of the fQRS, ER and VLP can be used for indi-
cating the arrhythmic events. However, the prolongation
and decrease of the parameters need a certain range to
determine whether the arrhythmia is coming. The ranges
that represent the abnormality of the parameters were also
discussed in Sect. 3.
The ranges can only be fit after the parameters have
been detected and measured. The detection can be missed
and the measurement can be inaccurate if lack of
450 S. Mandala, T. C. Di
123

appropriate detection or measurement methods. The
methods are collected from literatures as in Sect. 4. Both
averaging and handling of outliers are suitable for all the
parameters. Short signal data is suggested to remove out-
liers [58]. Whereas long-term signal data might use aver-
aging method to produce better measurement result within
a shorter time. For parameters that cannot be measured
directly, such as ER and fQRS, morphology based algo-
rithms are helpful to include all of their possible variations.
This method is faster than visual interpretation by experi-
enced readers [43].
6 Conclusion and Future Works
In conclusion, this study reviewed ten ECG parameters for
prediction of VT/VF from 25 articles, as shown in Table 1.
Overall, this paper is significant as it achieved three main
objectives. Firstly, it provides a way to recognize the pat-
terns of parameters effectively. Using a table as shown in
Sect. 3, readers can quickly distinguish the patterns
between different parameters prior to occurrence of VAs,
i.e. presence, prolongation and reduction. Secondly, it
provides a discussion on methods to identify the abnormal
ranges of the parameters. The gender and age are factors to
influence abnormal ranges of some parameters. Thirdly,
this paper describes approaches to improve detection rate
of the parameters, as presented in Sect. 4. The approaches
are included averaging, outliers handling and application of
morphology detection algorithms. In future, ECG param-
eters for short-term prediction should be pursued. The
prediction could be more practical if applied in
portable smart devices, such as smartphone.
Open Access This article is distributed under the terms of the
Creative Commons Attribution 4.0 International License (http://crea
tivecommons.org/licenses/by/4.0/), which permits unrestricted use,
distribution, and reproduction in any medium, provided you give
appropriate credit to the original author(s) and the source, provide a
link to the Creative Commons license, and indicate if changes were
made.
References
1. John, R. M., Tedrow, U. B., Koplan, B. A., Albert, C. M.,
Epstein, L. M., Sweeney, M. O., et al. (2012). Ventricular
arrhythmias and sudden cardiac death. Lancet (London, England),
380(9852), 1520–1529. doi:10.1016/S0140-6736(12)61413-5.
2. Scapigliati, A., Ristagno, G., & Cavaliere, F. (2013). The best
timing for defibrillation in shockable cardiac arrest. Minerva
Anestesiologica, 79(1), 92–101.
3. Fam, J. M., & Ching, C. K. (2011). Review on non-invasive risk
stratification of sudden cardiac death. Proceedings of Singapore
Healthcare, 20(4), 263–278.
4. Liew, R. (2011). Electrocardiogram based predictors of sudden
cardiac death in patients with coronary artery disease. Clinical
Cardiology, 34(8), 466–473.
5. Pietrasik, G., & Zarba, W. (2012). QRS fragmentation: Diag-
nostic and prognostic significance. Cardiology Journal, 19(2),
114–121.
6. Arisha, M. M., Girerd, N., Chauveau, S., Bresson, D., Scridon,
A., Bonnefoy, E., et al. (2013). In-hospital heart rate turbulence
and microvolt T-wave alternans abnormalities for prediction of
early life-threatening ventricular arrhythmia after acute myocar-
dial infarction. Annals of Non- Invasive Electrocardiology, 18(6),
530–537. doi:10.1111/anec.12072.
7. Abdelrahman, T. M. (2014). Prognostic value of T peak-to-end
interval for risk stratification after acute myocardial infarction.
The Egyptian Journal of Critical Care Medicine, 2(1), 19–27.
doi:10.1016/j.ejccm.2014.09.001.
8. Aleman-Fernandez, A.A., Dorantes-Sanchez, M., Castro, J.,
Gonzalez, L.G., Hernandez, Y.C., Marcos, A., & Garcıa, R.
(2014). Malignant ventricular arrhythmias in patients with
implantable cardioverter-defibrillators: electrical signals which
are predictors of recurrence. CorSalud, 6(1).
9. Puzzi, M. A., Munhoz, F. P., Carvalho, M. J., Gallo, L. N., Jaid,
Franca, & Lopes, R. D. (2013). The usefulness of T-wave peak to
T-wave end interval in identifying malignant arrhythmias in
patients with chagas disease. Hellenic Journal of Cardiology, 54,
429–434.
10. Cox, N. K. (2011). The QT interval: How long is too long?
Nursing Made Incredibly Easy, 9(2), 17–21.
11. Saleem, S., Hussain, M. M., Majeed, S. M. I., & Khan, M. A.
(2012). Gender differences of heart rate variability in healthy
volunteers. JPMA-Journal of the Pakistan Medical Association,
62(5), 422.
12. Maheshwari, S., Acharyya, A., Puddu, P. E., Mazomenos, E. B.,
Leekha, G., Maharatna, K., et al. (2013). An automated algorithm
for online detection of fragmented QRS and identification of its
various morphologies. Journal of the Royal Society, Interface,
10(89), 20130761. doi:10.1098/rsif.2013.0761.
13. Madeiro, J. P. V., Nicolson, W. B., Cortez, P. C., Marques, J.
A. L., Vazquez- Seisdedos, C. R., Elangovan, N., et al. (2013).
New approach for T-wave peak detection and T-wave end loca-
tion in 12-lead paced ECG signals based on a mathematical
model. Medical Engineering & Physics, 35(8), 1105–1115.
14. Huang, Z., Patel, C., Li, W., Xie, Q., Wu, R., Zhang, L., et al.
(2009). Role of signal-averaged electrocardiograms in arrhythmic
risk stratification of patients with Brugada syn- drome: a
prospective study. Heart Rhythm: The Official Journal of the
Heart Rhythm Society, 6(8), 1156–1162. doi:10.1016/j.hrthm.
2009.05.007.
15. Abe, A., Kobayashi, K., Yuzawa, H., Sato, H., Fukunaga, S.,
Fujino, T., et al. (2012). Comparison of late potentials for
24 hours between Brugada syndrome and arrhythmogenic right
ventricular cardiomyopathy using a novel signal-averaging sys-
tem based on Holter ECG. Circulation: Arrhythmia and Elec-
trophysiology, 5(4), 789–795.
16. Patel, R. B., Ng, J., Reddy, V., Chokshi, M., Parikh, K., Subacius,
H., et al. (2010). Early repolarization associated with ventricular
arrhythmias in patients with chronic coronary artery disease.
Circulation: Arrhythmia and Electrophysiology, 3(5), 489–495.
17. Wang, J., Sui, X. T., Sun, Y. X., Li, Y., Yang, G., Xu, F., et al.
(2013). Differences of ventricular late potential between acute
STEMI and NSTEMI patients. West Indian Medical Journal, 62,
721–723.
18. Canpolat, U., Kabakci, G., Aytemir, K., Dural, M., Sahiner, L.,
Yorgun, H., et al. (2013). Fragmented QRS complex predicts the
arrhythmic events in patients with arrhythmogenic right
ECG Parameters for Malignant VAs 451
123
ventricular cardiomyopathy/dysplasia. Journal of Cardiovascular
Electrophysiology, 24(11), 1260–1266. doi:10.1111/jce.12202.
19. Femenia, F., Arce, M., Van Grieken, J., Trucco, E., Mont, L.,
Abello, M., et al. (2013). Fragmented QRS as a predictor of
arrhyth- mic events in patients with hypertrophic obstructive
cardiomyopathy. Journal of Interventional Cardiac Electro-
physiology, 38(3), 159–165. doi:10.1007/s10840-013-9829-z.
20. Ma, S. Y., Lv, J. L., Liu, Z. B., Li, Z. P., & Wang, L. X. (2013).
Relationship between fragmented QRS complex and ventricular
arrhythmias in patients with a previous myocardial infarction.
Experimental & Clinical Cardiology. doi:10.1002/clc.22158.
21. Sha, J., Zhang, S., Tang, M., Chen, K. P., Zhao, X. R., & Wang,
F. Z. (2011). Fragmented QRS is associated with All-cause
mortality and ventricular arrhythmias in patient with idiopathic
dilated cardiomyopathy. Annals of Noninvasive Electrocardiol-
ogy, 16(3), 270–275. doi:10.1111/j.1542-474X.2011.00442.x.
22. Haıssaguerre, M., Derval, N., Sacher, F., Jesel, L., Deisenhofer,
I., de Roy, L., et al. (2008). Sudden cardiac arrest associated with
early repolarization. New England Journal of Medicine, 358(19),
2016–2023.
23. Tereshchenko, L. G., Fetics, B. J., Domitrovich, P. P., Lindsay, B.
D., & Berger, R. D. (2009). Prediction of ventricular tach-
yarrhythmias by intracardiac repolarization variability analysis.
Circulation-Arrhythmia and Electro- physiology, 2(3), 276–284.
doi:10.1161/circep.108.829440.
24. Wahab, A., Alvi, S., Panwar, B. R., & Budania, S. (2012). A
study of QT dispersion as a prognostic indicator in acute
myocardial infarction. Int Cardiovascular Res Journal, 6(1),
8–12.
25. Li-na, R., Xin-hui, F., Li-dong, R., Jian, G., Yong-quan, W., &
Guo-xian, Q. (2012). Ambulatory ECG-based T-wave alternans
and heart rate turbulence can predict cardiac mortality in patients
with myocardial infarction with or without diabetes mellitus.
Cardiovascular diabetology, 11(1), 104.
26. Iacoviello, M., Forleo, C., Guida, P., Romito, R., Sorgente, A.,
Sorrentino, S., et al. (2007). Ventricular repolarization dynam-
icity provides independent prognostic information toward major
arrhythmic events in patients with idiopathic dilated cardiomy-
opathy. Journal of the American College of Cardiology, 50(3),
225–231. doi:10.1016/j.jacc.2007.02.071.
27. Chen, X., Hu, Y., Fetics, B. J., Berger, R. D., & Trayanova, N. A.
(2011). Unstable QT interval dynamics precedes ventricular
tachycardia onset in patients with acute myocardial infarction: A
novel approach to detect instability in QT interval dynamics from
clinical ECG. Circulation: Arrhythmia and Electrophysiology,
4(6), 858–866. doi:10.1161/CIRCEP.110.961763,NIHMS150003.
28. Ebrahimzadeh, E., Pooyan, M., & Bijar, A. (2014). A novel
approach to Predict sudden cardiac death (SCD) using nonlinear and
time-frequency analyses fromHRV signals.PLoSONE, 9(2), 1–14.
29. Rozen, G., Kobo, R., Beinart, R., Feldman, S., Sapunar, M., Luria,
D., et al. (2013). Multipole analysis of heart rate variability as a
predictor of imminent ventricular arrhythmias in ICD patients.
Pacing and Clinical Electrophysiology, 36(11), 1342–1347.
30. Lu, H. R., Yan, G. X., & Gallacher, D. J. (2013). A new bio-
marker index of cardiac electrophysiological balance (iCEB)—
plays an important role in drug-induced cardiac arrhythmias:
Beyond QT-prolongation and Torsades de Pointes (TdPs). Jour-
nal of Pharmacological and Toxico- logical Methods, 68(2),
250–259. doi:10.1016/j.vascn.2013.01.003.
31. Robyns, T., Lu, H. R., Gallacher, D. J., Garweg, C., Ector, J.,
Willems, R., et al. (2016). Evaluation of index of cardio- elec-
trophysiological balance (iCEB) as a new biomarker for the
identification of patients at increased arrhythmic risk. Annals of
Nonin-vasive Electrocardiology, 21(3), 294–304. doi:10.1111/
anec.12309.
32. Steyerberg, E. (2009). Clinical Usefulness. Clinical prediction
models (pp. 281–297). New York: Springer. doi:10.1016/B978-0-
12-387667-6.00013-0.
33. Alturki, A. (2015). SM Gr up the value of P value in the medical
SM. Journal of Public Health and Epidemiology, 1(4), 4–5.
34. Gadaleta, M., & Giorgio, A. (2012). A method for ventricular late
potentials detection using time-frequency representation and
wavelet denoising. ISRN Cardiology. doi:10.5402/2012/258769.
35. Tsutsumi, T., Takano, N., Matsuyama, N., Higashi, Y., Iwasawa,
K., & Nakajima, T. (2011). High-frequency powers hidden within
QRS complex as an additional predictor of lethal ventricular
arrhythmias to ventricular late potential in post myocardial
infarction patients. Heart Rhythm, 8(10), 1509–1515.
36. Take, Y., & Morita, H. (2012). Fragmented QRS: What is the
meaning? Indian Pacing and Electrophysiology Journal, 12(5),
213.
37. Das, M. K., & Zipes, D. P. (2010). Role of the fragmented QRS
complexes on a routine 12-lead ECG in predicting mortality and
sudden cardiac death. Rev Argent Cardiology, 78, 5–10.
38. Derval, N., Shah, A., & Jaıs, P. (2011). Definition of early
repolarization a tug of war. Circulation, 124(20), 2185–2186.
39. Smith, S.W., Khalil, A., Henry, T.D., Rosas, M., Chang, R.J.,
Heller, K., Scharrer, E., Ghorashi, M., & Pearce, L.A. (2012).
Electrocardiographic differentiation of early repolarization from
subtle anterior ST-segment elevation myocardial infarction. An-
nals of Emergency Medicine, 60(1), 45–56. e2.
40. Bastiaenen, R., & Behr, E. R. (2012). Benign or malignant, early
or delayed: The changing face of early repolarization. Europace,
14(1), 5–7.
41. Aizawa, Y., Sato, A., Watanabe, H., Chinushi, M., Furushima, H.,
Horie, M., et al. (2012). Dynamicity of the J-wave in idiopathic
ventricular fibrillation with a special reference to pause- depen-
dent augmentation of the J-wave. Journal of the American Col-
lege of Cardiology, 59(22), 1948–1953. doi:10.1016/j.jacc.2012.
02.028.
42. Adler, A., Rosso, R., Viskin, D., Halkin, A., & Viskin, S. (2013).
What do we know about the ‘‘malignant form’’ of early repo-
larization? Journal of the American College of Cardiology,
62(10), 863–868. doi:10.1016/j.jacc.2013.05.054.
43. Kentta, T., Porthan, K., Tikkanen, J. T., Vaananen, H., Oikarinen,
L., Viitasalo, M., et al. (2014). Sensitivity and specificity of
automated detection of early repolarization in standard 12 lead
electrocardiography. Annals of Noninvasive Electrocardiology.
doi:10.1111/anec.12226.
44. Letsas, K.P., Weber, R., Astheimer, K., Kalusche, D., & Arentz,
T. (2009). Tpeak-Tend interval and TpeakTend/QT ratio as
markers of ventricular tachycardia inducibility in subjects with
Brugada ECG phenotype. Europace, 6, eup357.
45. Hetland, M., Haugaa, K. H., Sarvari, S. I., Erikssen, G., Kongs-
gaard, E., & Edvardsen, T. (2014). A novel ECG-index for pre-
diction of ventricular arrhythmias in patients after myocardial
infarction. Annals of Noninvasive Electrocardiology, 19(4),
330–337. doi:10.1111/anec.12152.
46. Sun, X., Cai, J., Fan, X., Han, P., Xie, Y., Chen, J., et al. (2013).
Decreases in electrocardiographic R-wave amplitude and QT
interval predict myocardial ischemic infarction in rhesus mon-
keys with left anterior descending artery ligation. PLoS ONE,
8(8), e71876.
47. Dobson, C. P., Kim, A., & Haigney, M. (2013). QT variability
index. Progress in Cardiovascular Diseases, 56(2), 186–194.
doi:10.1016/j.pcad.2013.07.004.
48. Piccirillo, G., Magri, D., Matera, S., Magnanti, M., Torrini, A.,
Pasquazzi, E., et al. (2007). QT variabil- ity strongly predicts
sudden cardiac death in asymptomatic subjects with mild or
moderate left ventricular systolic dysfunction: A prospective
452 S. Mandala, T. C. Di
123
study. European Heart Journal, 28(11), 1344–1350. doi:10.1093/
eurheartj/ehl367.
49. Quan, X. Q., Zhou, H. L., Ruan, L., Lv, J. G., Yao, J. H., Yao, F.,
et al. (2014). Ability of ambulatory ECG-based T-wave alternans
to modify risk assessment of cardiac events: A systematic review.
Bmc Cardiovascular Disorders, 14(1), 198.
50. Nieminen, T., & Verrier, R. L. (2010). Usefulness of T-wave
alternans in sudden death risk stratification and guiding medical
therapy. Annals of Noninvasive Electrocardiology, 15(3),
276–288. doi:10.1111/j.1542-474X.2010.00376.x.
51. Monasterio, V., Laguna, P., Cygankiewicz, I., & Martinez, J. P.
(2011). Average T- wave alternans activity in ambulatory ECGs.
Computing in Cardiology, 2011, 621–624.
52. Verrier, R. L., Klingenheben, T., Malik, M., El-Sherif, N., Exner,
D. V., Hohnloser, S. H., et al. (2011). Microvolt T-wave alternans
physiological basis, methods of measurement, and clinical utility
consensus guideline by International Society for Holter and
Noninvasive Electrocardiology. Journal of the American College
of Cardiology, 58(13), 1309–1324. doi:10.1016/j.jacc.2011.06.
029.
53. Chen, D. H., & Yang, S. (2009). The impact of frequency aliasing
on spectral method of measuring T wave alternans. Journal of
Biomedical Science and Engineering. doi:10.4236/jbise.2009.
22019.
54. Bauer, A., Malik, M., Schmidt, G., Barthel, P., Bonnemeier, H.,
Cygankiewicz, I., et al. (2008). Heart rate turbulence: Standards
of measurement, physiological interpretation, and clinical Use:
International Society for Holter and Noninvasive Electrophysi-
ology Consensus. Journal of the American College of Cardiol-
ogy, 52(17), 1353–1365. doi:10.1016/j.jacc.2008.07.041.
55. Shaik, N.A., & Ramdas, D. (2014). Empirical mode decompo-
sition for frequency analysis of heart rate variability. In Elec-
tronics and Communication Systems (ICECS), 2014 International
Conference on (pp 1–6). doi:10.1109/ECS.2014.6892628.
56. Saleem, S., Hussain, M. M., Majeed, S. M. I., & Khan, M. A.
(2012). Gender differences of heart rate variability in healthy
volunteers. JPMA-Journal of the Pakistan Medical Association,
62(5), 422.
57. SisAkova, M., Toman, O., Florianova, A., Vit, P., Gaillyova, R.,
Kadlecova, J., et al. (2005). Analysis of Qt dynamicity behaviour
in relationship to the risk of sudden cardiac death. A pilot study.
Scripta Med- Ica (BRNO), 78(3), 171–176.
58. Pradhan, L., & Islam, M. (2010). Replacing outliers with existing
data in inter beat interval signal for heart rate variability analysis.
IBIs, 1, 10.
59. Baranchuk, A., Femenia, F., LopezDiez, J. C., Muratore, C.,
Valentino, M., Retyk, E., et al. (2014). Fragmented surface ECG
was a poor predictor of appropriate therapies in patients with
Chagas cardiomyopathy and ICD implantation (Fragmented ECG
in Chagas Cardiomyopathy Study). Annals of Noninvasive Elec-
trocardiology, 19(1), 43–49.
60. Sachdev, M., Fetics, B. J., Lai, S., Dalal, D., Insel, J., & Berger,
R. D. (2010). Failure in short-term prediction of ventricular
tachycardia and ventricular fibrillation from continuous electro-
cardiogram in intensive care unit patients. Journal of Electro-
cardiology, 43(5), 400–407. doi:10.1016/j.jelectrocard.2010.02.
005.
ECG Parameters for Malignant VAs 453
123


![Considerations for optimization of microRNA PCR assays for ......circulating microRNAs for both malignant and non-malignant diseases [2][3][4][5][6][7][8][9]. A range of parameters](https://img.pdfslide.net/doc/110x75/5f44dc6cbd42931f9055e4a1/considerations-for-optimization-of-microrna-pcr-assays-for-circulating-micrornas.jpg)