Embed Size (px)
Citation preview

REVIEW
Echocardiographic assessment of
pulmonary hypertension: standard
operating procedureLuke S. Howard*, Julia Grapsa#, David Dawson#, Michael Bellamy#,John B. Chambers", Navroz D. Masani+, Petros Nihoyannopoulos#
and J. Simon R. Gibbs*
ABSTRACT: Patients with suspected pulmonary hypertension (PH) should be evaluated using
a multimodality approach to ensure that they receive a correct diagnosis. The series of
investigations required includes clinical evaluation, noninvasive imaging techniques and right
heart catheterisation (considered to be the ‘‘gold standard’’ for the diagnosis of PH). Current
guidelines recommend that a detailed echocardiographic assessment is performed in all patients
with suspected PH.
In this review we summarise a protocol adopted by the National Pulmonary Hypertension
Centres of UK and Ireland and approved by the British Society of Echocardiography for the
evaluation of these patients. The views and measurements described are recommended for
diagnosis, assisting in prognosis and providing a noninvasive means of following disease
progression or response to therapy.
KEYWORDS: Diagnosis, echocardiography, prognosis, pulmonary hypertension, right ventricle
Pulmonary hypertension (PH) is defined asa haemodynamic and pathophysiologicalcondition characterised by an increase
in mean pulmonary arterial pressure (Ppa) too25 mmHg at rest as measured by right heartcatheterisation (RHC) [1]. PH may be associatedwith a number of conditions displaying a range ofdifferent pathological and clinical features, despitethe comparable elevations in Ppa. The clinical classi-fication of PH aims to group together differentmanifestations of the disease that share similarclinical presentations and underlying pathophy-siology [2], although the natural history may varywidely. In the most recent clinical classification, PHis classified into five groups. Group 1 is pulmonaryarterial hypertension (PAH), which can be heredi-tary, idiopathic or associated with a number ofunderlying conditions. Group 2 includes PH dueto left heart disease. Group 3 includes PH resultingfrom lung disease and/or hypoxaemia (e.g. inter-stitial lung disease and chronic obstructive pul-monary disease (COPD)). Group 4 is chronicthromboembolic PH and group 5 is made up of
PH with unclear and/or multifactorial mechan-isms [2]. Accurate diagnosis and classification ofPH is essential as the prognostic and therapeuticimplications are different between the clinicalgroups [1].
Patients with suspected PH must be evaluatedusing a multimodality approach to ensure a cor-rect diagnosis, with a series of investigationsranging from thorough clinical evaluation throughnoninvasive imaging techniques to RHC, which isconsidered to be the ‘‘gold standard’’ for thediagnosis of PH [1]. Guidelines recommend that adetailed echocardiographic assessment is per-formed in all patients with suspected PH [1].Transthoracic echocardiography provides a num-ber of measures that can be used to estimate rightheart haemodynamics. For example, systolic Ppa
calculated from the tricuspid regurgitant velocity(TRV) is used to alert suspicion of PH, althoughPpa may be underestimated by echocardiographydue to an insufficient Doppler envelope or eccen-tric tricuspid regurgitation jet. In fact, no single
AFFILIATIONS
*National Pulmonary Hypertension
Service, Hammersmith Hospital,
Imperial College Healthcare NHS
Trust,#Dept of Echocardiography, Imperial
College Healthcare NHS Trust,"Guy’s and St Thomas’s Hospital,
London, and+Dept of Cardiology, University
Hospital of Wales, Cardiff, UK.
CORRESPONDENCE
L.S. Howard
National Pulmonary Hypertension
Service, Dept of Cardiac Sciences
Hammersmith Hospital
Du Cane Road
London
W12 0HS
UK
E-mail: [email protected]
Received:
June 08 2012
Accepted after revision:
July 03 2012
PROVENANCE
Publication of this peer-reviewed
article was supported by Actelion
Pharmaceuticals Ltd, Switzerland
(article sponsor, European
Respiratory Review issue 125).
European Respiratory Review
Print ISSN 0905-9180
Online ISSN 1600-0617This article has supplementary data available from http:///err.ersjournals.com
EUROPEAN RESPIRATORY REVIEW VOLUME 21 NUMBER 125 239
Eur Respir Rev 2012; 21: 125, 239–248
DOI: 10.1183/09059180.00003912
Copyright�ERS 2012
c

echocardiographic measure is able to diagnose PH specificallyand isolated abnormalities on echocardiography require cau-tious interpretation. Therefore, it is important that other sur-rogate echocardiographic measurements of PH are examined byechocardiography if PH is suspected. Further assessment ofright ventricular function should be considered when one ormore of these abnormalities are identified.
We have developed a protocol to describe how various echo-cardiographic views and measurements may be used during theinitial examination and follow-up of PH. These techniques canbe used to assess the severity of right ventricle (RV) dysfunctionby providing prognostic information and a noninvasive meansof following disease progression or response to therapy. Theprotocol includes only those parameters in regular clinical use,and excludes more specialised parameters such as speckletracking and three-dimensional imaging, of which there is lessexperience. The procedure described in the protocol has beenused successfully in the UK for the past 3 yrs, is supported bythe British Society of Echocardiography and has been approvedby the National Pulmonary Hypertension Centres of UK andIreland. The aim of the protocol is to provide guidance to thoseundertaking echocardiographic examinations of patients, and alsothose interpreting the results in a clinical context, includingphysicians from cardiological and non-cardiological backgrounds.
RV ANATOMY AND PATHOPHYSIOLOGYA detailed explanation of the anatomy and pathophysiologyof the RV is beyond the scope of this article and has beenextensively described elsewhere [3–5]. A number of anatomicaland physiological features of the RV and its response to PH areimportant when assessing it using echocardiography. Certainanatomical features in particular make it difficult to examinethe RV in detail, especially when using two-dimensional (2D)echocardiography. In particular, identifying the borders ofthe RV can be difficult because of the heavily trabeculated myo-cardium, while the available image windows can be limitedbecause of the retrosternal position [3].
In contrast to the left ventricle (LV) and the systemic cir-culation, the pulmonary vascular bed is a low-resistance systemin healthy individuals [3]. The RV is more compliant than the LVand adapts better to volume loading than to pressure loading.The LV and RV do not function independently of one another asthe mechanics of one ventricle will impact on the other (ven-tricular interdependence) and this process is mediated by theinterventricular septum (IVS) [6]. Ventricular septal geometryand motion are largely determined by the difference in pressureacross the ventricular septum. Under normal circumstances, thehigher pressures in the LV cavity mean the IVS bows into thelower pressure RV cavity. In patients with PH, pressure in theRV increases causing the septum to flatten in systole as thepressures in both ventricles begin to converge. Eventually, whenthe RV becomes severely pressure loaded, the septum may evenbulge into the LV cavity (fig. 1) [4]. These changes also impacton both LV systolic and diastolic function.
Another change seen in the RV in PH is ventricular remodelling,which is a result of chronic progressive pressure loading. This isinitially in the form of hypertrophy and later as dilation [5]. Theremodelling results in progressive contractile impairment, lowcardiac output and, eventually, RV failure. Right ventricular
dilation also leads to tricuspid annular dilation and results insignificant tricuspid regurgitation [4]. When this is coupledwith decreased RV systolic dysfunction and increased afterloadit will further reduce stroke volume into the pulmonarycirculation and resultant reduced cardiac output. The addi-tional volume loading as a consequence of tricuspid regurgita-tion will further impair RV diastolic function, increasing RVend-diastolic pressure and displacing the IVS. The progressivedeterioration of RV function is a determinant of exercisecapacity, symptoms and prognosis and, therefore, the assess-ment of RV function is a key component of the assessment of apatient with PH.
RIGHT HEART IMAGING PROTOCOLThe protocol includes the measurement of a range of parametersassessed from three windows (parasternal, apical and subcostalview), which is first described using Doppler examination andsecondly using M-mode examination. The aim of the measuresselected is to determine the pressure within, and the capacityand function of, the RV. The technical aspects of the echo-cardiographic assessment have been described previously [7]and are briefly summarised here. However, the aim of this
a) b)
c) d)
e) f)
FIGURE 1. a) Normal parasternal long-axis view. Note that the right ventricle is
less than one third of the size of the left ventricle. b) Parasternal long-axis view in
pulmonary hypertension (PH). Severely dilated right ventricle with hypertrophy of the
moderator band and the right ventricular free wall. The left ventricular cavity is small
due to chronic right ventricular pressure overload. c) Normal parasternal long-axis
view of the right ventricular outflow tract (RVOT) showing the main pulmonary trunk,
branches of the pulmonary artery and the pulmonary valve. d) Parasternal long-axis
view of the RVOT in PH showing the dilated pulmonary artery and branches.
e) Normal apical four-chamber view. f) Apical four-chamber view in PH showing
marked right ventricular dilation and hypertrophy.
REVIEW: ECHO IN PH L.S. HOWARD ET AL.
240 VOLUME 21 NUMBER 125 EUROPEAN RESPIRATORY REVIEW

review is to highlight how the findings from the echocardio-graphic assessment can be interpreted clinically.
Parasternal viewsIn normal subjects the anterior RV wall is thin; its mass is lessthan one sixth and its diameter less than one third of the LV.As previously discussed, chronic pressure loading of the RVin PH leads to dilation and hypertrophy of the RV; theparasternal views of the RV allow any such changes to beviewed and various parameters to be measured (table 1).
In the parasternal long-axis view, the moderator band isusually seen close to the IVS traversing the RV and care shouldbe taken not to include the moderator band in the measure-ments of the IVS. In significant PH, the LV cavity may bereduced in size in both systole and diastole, with deviation(bowing) of the septum towards the LV (fig. 1a and b).
The long-axis view of the RV inflow tract may also allow foroptimal alignment for estimation of TRV when the tricuspidregurgitant jet is eccentric. Abnormalities of the leaflets andsubvalvular apparatus should also be assessed to excludeprimary valvular pathology. In addition, this view may beused to provide a qualitative estimate of RV systolic function.
The long- and short-axis views of the right ventricular outflowtract (RVOT) are useful for the assessment of the main
pulmonary artery, which is dilated in relation to the adjacentaorta in PH, and pulmonary regurgitation (fig. 1c and d).However, we are not aware of any data to suggest that dilationof the pulmonary artery is a sensitive measurement for detectionof PH using echocardiography.
As well as demonstrating the atria and RV, the short-axis viewof the aorta and left atrium shows the aortic, tricuspid andpulmonary valves simultaneously, making this a useful viewfor the assessment of structural valvular abnormalities. It canalso help to identify an atrial septal defect using a zoom viewof the interatrial septum with colour Doppler imaging. RVdilation and hypertrophy, as well as dilation of the pulmonaryartery, can also be seen in this view. Finally, the degree ofdistortion of the LV and IVS arising due to increased pressurein the RV during diastole and systole (LV eccentricity index)can be quantified using a short-axis view at the level of leftventricular papillary muscles. While in a normal situation theLV appears circular in shape, in systole and diastole dilation ofthe RV and increased RV pressure in severe PH shifts the IVSto the left, giving the LV a characteristic D-shape. Conse-quently, a RV that is dilated purely due to volume overloadwill deviate the septum, mainly in diastole, due to raised end-diastolic pressure and, conversely, a pressure-loaded RV willdeviate the septum in systole. When pressure overload is severethe septum may even be deviated into the LV cavity itself.
TABLE 1 Parameters affected by pulmonary hypertension (PH) that can be detected by right heart imaging
View Measurements Normal range PH
Long-axis view of LV or short-axis view of
aorta and left atrium
LV end-diastolic diameter cm 4.2–5.9 in males and 3.9–5.3 in females [8–10] Q
LV end-systolic diameter cm 2.1–4.0 in males and 2.4 in females [8–10] Q
Long-axis view of the RV inflow tract Basal diameter of RV cm 3.7–5.4 [11] q
Tricuspid annulus cm 1.3–2.8 [11, 12] q
Tricuspid regurgitant velocity m?s-1 ,2.6 [13] q
Long- and short-axis views of RVOT or short-
axis view of aorta and left atrium
RVOT cm 1.7–2.3 [8, 11] q
Main pulmonary trunk cm 1.5–2.1 [8, 11] q
Right pulmonary artery cm 0.7–1.7 [11, 14] q
Left pulmonary artery cm 0.6–1.4 [8, 11] q
RV outflow acceleration time ms .110 [8, 15, 16] Q
Pulmonary regurgitant velocity (beginning of diastole) m?s-1 ,1 [14, 17] q
Pulmonary regurgitant velocity (end diastole) m?s-1 ,1 [14, 17] q
Apical four-chamber view# Basal diameter of RV cm 2.0–2.8 [8, 11] q
RV end-diastolic area cm2 11–28 [8, 11] q
RV end-systolic area cm2 7.5–16 [8, 11, 18] q
Right atrial area (end-systole) cm2 13.5¡2 cm [18] q
RA volume index mL?m-2 f34 in males and f27 in females [8, 19, 20] q
Tricuspid annulus cm 1.3–2.8 [8, 12] q
Right ventricular fractional area change % 32–60 [8, 21, 22] Q
Apical four-chamber view" Tricuspid regurgitant velocity m?s-1 ,2.6 [13] q
Deceleration time–tricuspid inflow ms 144–244 [23, 24] q
RV MPI (Tei index) ,0.28 [8, 25, 26, 27] q
TAPSE mm o20 [8, 28–30] Q
IVRT (TDI RV free wall) ms ,75 [6, 8, 31, 32] q
LV: left ventricle; RV: right ventricle; RVOT: right ventricular outflow tract; RA: right atrium; MPI: myocardial performance index; TAPSE: tricuspid annular plane systolic
excursion; IVRT: isovolumic relaxation time; TDI: tissue Doppler imaging; Q: decreased in PH; q: increased in PH. #: two-dimensional echocardiograph; ": Doppler
echocardiograph.
L.S. HOWARD ET AL. REVIEW: ECHO IN PH
cEUROPEAN RESPIRATORY REVIEW VOLUME 21 NUMBER 125 241

Apical four-chamber viewsA number of parameters influenced by the presence of PH canbe assessed in this view (table 1), including RV dilation andhypertrophy, with systolic dysfunction and reduced myocardialtissue velocities being quantifiable by tissue Doppler imaging.In PH, the apex is frequently hypertrophied and akinetic, andcareful examination of the apex should be performed to excludethrombus or an apical mass [7]. Diastolic opening of thetricuspid leaflets, which can also be assessed in this view,becomes less vigorous as PH progresses. The tricuspid valveleaflet adjacent to the free wall may be either the anterior (mostcommonly) or posterior leaflet, depending on the exact rota-tion and angulation of the image plane. Tricuspid leaflets areuniformly echogenic, with normal coaptation in systole. Whensignificant tricuspid regurgitation develops in PH, carefulidentification of any structural abnormalities is needed toensure primary tricuspid incompetence is differentiated fromsecondary incompetence due to the annular dilation.
The interatrial and interventricular septums can be clearlydelineated (fig. 1e and f). Drop-out artefact is commonly seenin the region of fossa ovalis and this should not be mistaken foran atrial septal defect. The use of tissue Doppler imaging to theseptal and lateral LV walls may help to identify significant LVdiastolic dysfunction (table 2).
Subcostal viewThe subcostal view allows the degree of RV dysfunction andthe thickness of the RV walls to be estimated. This assessmentis particularly useful in patients where parasternal or apicalwindow views are difficult to image, such as those with COPD.It provides the best view for the measurement of RV inferiorwall thickness and determines the presence of an atrial septaldefect. The diameter of the inferior vena cava measured at restand during inspiration in this view can be used to provide anestimate of right atrial pressure (Pra).
Doppler examinationAs part of a full echocardiographic assessment, Dopplerexamination should be performed in the following sequence:1) colour Doppler in all apical projections; 2) colour Doppler inparasternal projections (long axis/short axis); 3) pulsed-waveDoppler for transmitral velocities; 4) pulsed-wave Doppler forLV outflow tract; 5) pulsed-wave Doppler for the tricuspid inflow;6) pulsed-wave Doppler for the RVOT; 7) continuous-waveDoppler across the LV outflow aortic valve; 8) continuous-waveDoppler across the tricuspid valve (for tricuspid regurgitation);9) continuous-wave Doppler across the pulmonary valve (for
pulmonary regurgitation); and 10) tissue Doppler imaging (TDI)of the RV free wall.
QUALITATIVE ASSESSMENT OF THE RVDilation of the RV can be assessed in the parasternal long-axis,short-axis and the apical four-chamber views. When RVafterload becomes chronically elevated, the RV walls becomehypertrophied. RV hypertrophy is defined by a free wallthickness of .5 mm on the apical four-chamber view. One ofthe first anatomical elements to become hypertrophied is themoderator band. In normal subjects this is thin and difficultto see, but in patients with PH it is clearly visible. In contrastto other conditions affecting the RV (e.g. RV infarction orarrhythmogenic RV cardiomyopathy) where there will beregional wall motion abnormalities, contractility assessment inPH shows global RV impairment. On the basis of these threeparameters (dilation, hypertrophy and contractility), an ex-perienced echocardiographer will be able to make a goodqualitative assessment of RV function and will be able to gradeit as mild, moderate or severe impairment. In patients withPAH, dilation of the RV has been shown to be linked toadverse clinical outcome (increase of .0.25 in absolute value ofRV sphericity index; i.e. ratio of the short axis at the mid-ventricular level of the RV divided by the RV long axis in end-diastole [36]) and mortality (RV diameter .36.5 mm) [37].
PRESSURE MEASUREMENTS IN PHPra can be estimated by measurement of the diameter of theinferior vena cava at end-expiration and during sharp ins-piration using M-mode in the subcostal view (fig. 2d). High Pra
is associated with dilation of the vena cava (normal range 1.5–2.5 cm) and/or failure of the segment adjacent to the rightatrium to collapse by at least 50% with inspiration (table 3).Inferior vena cava diameter o20 mm with respiratory varia-tion of diameter ,50% has been shown to be significantlyassociated with mortality in patients with PAH [38].
TRV reflects the difference in pressure between the RV and theright atrium and can be measured from continuous waveDoppler of the tricuspid regurgitant jet from the apical four-chamber view, or from the parasternal RV inflow view if theregurgitant jet is eccentric (fig. 2a). When pulmonary stenosisis absent, the RV systolic pressure (RVSP) is assumed to beequivalent to the systolic Ppa and can be calculated from theTRV using the Bernoulli equation, using estimated Pra frominferior vena cava diameter (table 3) [7].
systolic Ppa5RVSP54(TRVend)2 +Pra
TABLE 2 Effect of pulmonary hypertension (PH) on measurements from tissue Doppler imaging
Measurements [Ref.] Normal S’ wave cm?s-1 PH Normal E’ cm?s-1 PH Normal A’ cm?s-1 PH
RV free (lateral) wall [33–35] 12–20 Q 10.2–16.2 Q 6.2–10.9 Q
LV septal wall [34] 8.1–10.9 « 9.8–16.0 « 9.0–13.2 «LV lateral wall [34] 9.1–12.9 « 12.5–20.5 « 8.6–14.4 «
S’: systolic wave; A’: late (atrial systole) myocardial diastolic wave; E’: early myocardial diastolic wave; RV: right ventricle; LV: left ventricle; Q: decreased in PH;
«: no change.
REVIEW: ECHO IN PH L.S. HOWARD ET AL.
242 VOLUME 21 NUMBER 125 EUROPEAN RESPIRATORY REVIEW

where TRVend is peak TRV at end diastole. The ability to estimatesystolic Ppa represents a considerable strength of echocardiographyin its role as a diagnostic tool, but with this comes limitationsand there is a danger that too much weight is placed on thissingle measurement. FISHER et al. [39] have shown that, despitegood correlation between measurements, almost 50% of patientshad an estimated systolic Ppa on echocardiography that waso10 mmHg different from the value measured at cardiaccatheterisation. Underestimation of systolic Ppa has led to fre-quent misclassification of PH severity or even failure to identifyPH [39]. The most common causes of inaccurate estimation ofsystolic Ppa were an incomplete Doppler envelope resulting inunderestimation of pressure or an overestimate of Pra frominferior vena cava diameter and collapsibility. With severe free-flow tricuspid regurgitation, the Bernoulli equation cannot be
applied and TRV will underestimate the trans-tricuspid pres-sure difference. In itself, the severity of the tricuspid regurgitationis predictive of survival regardless of the systolic Ppa and irres-pective of the underlying disease [37, 40]. Tricuspid regurgitationmay be assessed in a number of ways, including assessment ofthe structure of the valve, jet area and density or measurementusing continuous wave Doppler [41]. It should be emphasisedthat the severity of the volume of tricuspid regurgitation isdistinct from the velocity. Thus, Doppler-derived estimates ofRVSP/systolic Ppa must only be considered to be estimates [1, 39,42] and cannot be used to diagnose PH. For this reason, it is oftenvaluable to consider other surrogates for Ppa.
Mean Ppa and pulmonary end-diastolic pressure are not routinelyused in the diagnosis or follow-up of PH, but may be useful whenTRV cannot be used or is unreliable. In 2D-echocardiography, thepulmonary valve is best imaged from the parasternal short-axis atthe level of the aortic valve (fig. 1c and 1d). Pulmonary valvularmotion can be determined with M-mode echocardiography andmay show mid-diastolic closure. Mean Ppa and pulmonary end-diastolic pressure can be derived from the TRV at the beginning(PRVbd) and end (PRVed) of diastole, respectively (fig. 2b).
pulmonary end-diastolic pressure54(PRVed)2+Pra
mPpa54(PRVbd)2
RVOT acceleration time has been superseded by TRV in clinicalpractice, although it may be used when the tricuspid velocitycannot be measured, particularly at diagnosis. A value ,105 msis suggestive of PH. By positioning the sample volume atthe centre of the pulmonary artery (ideally at the annulus) inthe short-axis view, acceleration time can be measured in the
c)a) b)
d)
PR Vbd
PR Ved
AT
FIGURE 2. a) Measurement of the peak tricuspid regurgitant velocity. b) Pulmonary regurgitant velocity at the
start of diastole (PRVbd) and end-diastole (PRVed). c) Acceleration time (AT) measured across the pulmonary
outflow tract in the parasternal short-axis view. d) Right atrial pressure: M-mode during sniff manoeuvre.
TABLE 3 Estimation of right atrial pressure from the inferiorvena cava [8]
Inferior vena
cava diameter
Change with
respiration
Estimated right atrial
pressure mmHg
Small ,1.5 cm Collapse 0
Normal 1.5–2.5 cm Decrease by .50% 5
Normal Decrease by ,50% 10
Dilated .2.5 cm Decrease by ,50% 15
Dilated with dilated
hepatic veins
No change 20
L.S. HOWARD ET AL. REVIEW: ECHO IN PH
cEUROPEAN RESPIRATORY REVIEW VOLUME 21 NUMBER 125 243
parasternal short-axis view (fig. 2c). Unlike most other indicesof function, which are unaffected by heart rate, RVOTacceleration time should be corrected when the heart rate is.100 bpm or ,70 bpm. This is achieved by multiplying themeasurement by 75 and dividing by heart rate. Notching of theflow velocity envelope may also be seen in PH. A notch seen inmid-systole is associated with severe PH and RV dysfunction[43]. Normal pressures and those in PH obtained by echocardio-graphy are shown in table 4.
CARDIAC CHAMBER CAVITY MEASUREMENTS IN PHRight atrial volume index is calculated from the apical four-chamber view or from the subcostal view, and is measured atmaximum atrial volume at end-systole. The single plane area–length method is used and right atrium volume is measuredusing the area and the long-axis length of the atrium (fig. 3aand b) [8, 19, 20].
right atrium volume index5(0.85 A2/L)/BSA
where A is the atrium area in any view (cm2), L is the long-axisatrium length (cm) and BSA is body surface area.
In a recent three-dimensional echocardiography study, whileboth right atrium and RV remodelling were found to be signi-ficantly associated with adverse clinical outcome, sensitivity andspecificity were highest for right atrium remodelling [36]. Anincrease of right atrium sphericity index (ratio of the short axis ofthe right atrium, parallel to the tricuspid annulus, mid-cavity,divided by the long axis, perpendicular to the tricuspid annulus,in end systole) .0.24 predicted clinical deterioration with asensitivity of 96% and a specificity of 90% [36].
RV fractional area change is calculated from end-diastolic areaand end-systolic area, measured from the apical four-chamberview. It is a simple method for the assessment of RV systolicfunction and has been shown to correlate with prognosis andresponse to treatment in PH [48], and with survival [37].However, it is limited by difficulties in endocardial definition.
RV fractional area change (%)5(end-diastolic area - end-systolic area)/end-diastolic area
LV eccentricity index is the ratio of the minor axis of theLV parallel to the septum (D2) divided by the minor axisperpendicular to the septum (D1) and is measured in theparasternal short-axis view at the level of the LV papillarymuscles (fig. 3c and d) in both end diastole and end systole. Ina purely pressure-loaded RV, flattening of the IVS occurs inend systole, resulting in an increased end-systolic LVeccentricity index. Conversely, the eccentricity index will beincreased in end diastole in pure volume loading [8, 44, 45]. LVdiastolic eccentricity index in diastole o1.7 has been shown tobe prognostic of mortality in patients with idiopathic PAHwho also have reduced RV function (tricuspid annular planesystolic exertion (TAPSE) f15 mm) [37]. Normal cavity mea-surements and those in PH as obtained by echocardiographyare shown in table 4.
MEASURES OF FUNCTION IN PHMyocardial performance index of the RV, also known as theTei index [49], is made up of a combination of systolic anddiastolic measurements. It has a number of advantages as afunctional measure, including: 1) being relatively unaffected
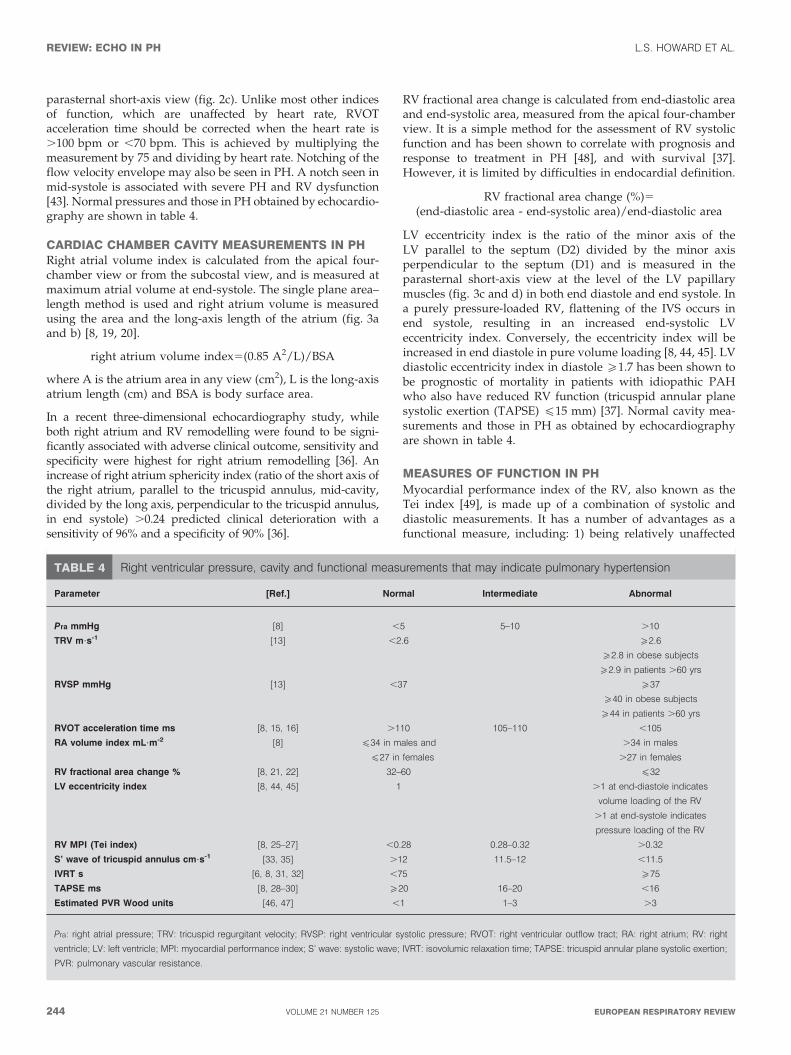
TABLE 4 Right ventricular pressure, cavity and functional measurements that may indicate pulmonary hypertension
Parameter [Ref.] Normal Intermediate Abnormal
Pra mmHg [8] ,5 5–10 .10
TRV m?s-1 [13] ,2.6 o2.6
o2.8 in obese subjects
o2.9 in patients .60 yrs
RVSP mmHg [13] ,37 o37
o40 in obese subjects
o44 in patients .60 yrs
RVOT acceleration time ms [8, 15, 16] .110 105–110 ,105
RA volume index mL?m-2 [8] f34 in males and
f27 in females
.34 in males
.27 in females
RV fractional area change % [8, 21, 22] 32–60 f32
LV eccentricity index [8, 44, 45] 1 .1 at end-diastole indicates
volume loading of the RV
.1 at end-systole indicates
pressure loading of the RV
RV MPI (Tei index) [8, 25–27] ,0.28 0.28–0.32 .0.32
S’ wave of tricuspid annulus cm?s-1 [33, 35] .12 11.5–12 ,11.5
IVRT s [6, 8, 31, 32] ,75 o75
TAPSE ms [8, 28–30] o20 16–20 ,16
Estimated PVR Wood units [46, 47] ,1 1–3 .3
Pra: right atrial pressure; TRV: tricuspid regurgitant velocity; RVSP: right ventricular systolic pressure; RVOT: right ventricular outflow tract; RA: right atrium; RV: right
ventricle; LV: left ventricle; MPI: myocardial performance index; S’ wave: systolic wave; IVRT: isovolumic relaxation time; TAPSE: tricuspid annular plane systolic exertion;
PVR: pulmonary vascular resistance.
REVIEW: ECHO IN PH L.S. HOWARD ET AL.
244 VOLUME 21 NUMBER 125 EUROPEAN RESPIRATORY REVIEW

by heart rate, loading conditions or the presence and severityof tricuspid regurgitation; 2) having good reproducibility; 3)being quick to calculate; 4) not relying on the use of geometricmodels; and 5) being able to be applied even in the presence ofa difficult acoustic window.
The Tei index can be measured either from colour Dopplerimaging (apical four-chamber view for the tricuspid inflowpattern and the parasternal short-axis RVOT view for thedetermination of ejection time) or tissue Doppler imaging(fig. 4a). The Tei index should be indexed for heart rate, asdescribed previously for RVOT acceleration time. In patientswith idiopathic PAH the index correlates with symptoms andvalues .0.88 predict poor survival [25].
Systolic (S’) wave velocity is a measure of myocardial contrac-tion and may be determined from the average of three TDIsignals from different cardiac cycles (fig. 4a). Like TAPSE, S’wave velocity is load dependent and may be pseudonormalunder conditions of increased volume loading (this is discussedin more detail below). Unlike most indices of function, S’ wavevelocity requires correction when heart rate is .100 bpm or fallsto ,70 bpm. Therefore, S’ wave velocity should be indexed for
heart rate, as described previously for RVOT acceleration time.Normal values and those in PH obtained by echocardiographyare shown in table 4.
Isovolumic relaxation time (IVRT) of the RV is defined as thetime from pulmonary valve closure to tricuspid valve openingand can be measured either by pulsed-wave Doppler fromtricuspid inflow or with tissue Doppler imaging of the RV freewall. Prolongation of IVRT indicates poor myocardial relaxa-tion, which is highly suggestive of PH, although it does notprovide prognostic value (fig. 4a). IVRT should be indexed forheart rate as described previously for RVOT acceleration time.
TAPSE is the reflection of the movement of base to apexshortening of the RV in systole and can be derived from thefour-chamber view (fig. 4b). When measuring TAPSE, it isimportant to ensure that the entire RV is included in the view,in particular that there is no dropout in the endocardial outlinealong the IVS and RV free wall. Maximal TAPSE is defined bythe total excursion of the tricuspid annulus from its highestposition after atrial ascent to the peak descent during ven-tricular systole [29]. A TAPSE of ,15 mm is associated with asignificantly higher risk of mortality compared with a TAPSE
a) b)
c)
D1
D2
d)
D1D2
FIGURE 3. a) Measurement of the right atrial a) area and b) long axis for calculation of right atrial volume. c) Measurement of the left ventricular eccentricity index in
c) end-diastole and d) end-systole. DI: minor axis perpendicular to the septum; D2: minor axis of the left ventricle parallel to the septum.
L.S. HOWARD ET AL. REVIEW: ECHO IN PH
cEUROPEAN RESPIRATORY REVIEW VOLUME 21 NUMBER 125 245

of .15 mm [37] and TAPSE is recommended by treatmentguidelines as a prognostic indicator in PAH for the assessmentof disease severity and response to therapy [1]. A significantlimitation of TAPSE is that it is highly load dependent, suchthat it may become pseudonormalised in the presence ofsignificant volume loading, e.g. left-to-right shunting or severefunctional tricuspid regurgitation [37]. Given that so muchweight is placed on this particular measure of function in thetreatment guidelines, it is important that this caveat is takeninto account when interpreting TAPSE.
Stroke volume, cardiac output and pulmonary vascular resis-tance can be calculated from echocardiographic measurements.These parameters correlate with right and left heart function andthe underlying pulmonary vascular resistance, but are not con-sidered to be mandatory measures in PH. Normal values andthose in PH obtained by echocardiography are shown in table 4.
CAUSES OF PHOnce PH has been suspected, further evaluation should beundertaken to establish any potential underlying cause. Thisincludes assessment for congenital heart disease, valvularheart disease and left heart disease. These assessments are outof the scope of this protocol, but as the most frequent cause ofPH will relate to impaired LV function, it is imperative tohighlight that a detailed assessment of diastolic LV function isundertaken. In our experience this is something that is oftenoverlooked. This should include measurement of left atrialdiameter and volume (indexed for body surface area), LVhypertrophy, transmitral inflow patterns, tissue Dopplerimaging of the basal lateral wall of the LV and, in some cases,pulmonary venous flow. Of note, type I diastolic dysfunctionof the LV is common in pre-capillary PH and should not beconsidered as indicative of pulmonary venous hypertension asthe cause of PH. This has been reviewed comprehensively
b)
TAPSE
MPI=(IVCT+IVRT)/ET=(a–b)/b
IVCT
a)
ET
S′
a
b
IVRT
FIGURE 4. a) Measurement of myocardial performance index (MPI) using
tissue Doppler imaging. S’: systolic wave; IVCT: isovolumic contraction time; IVRT:
isovolumic relaxation time. b) Measurement of tricuspid annular plane systolic
excursion (TAPSE); ET: ejections time.
Is PH suspected?
If one or more feature identified,PH may be present
RA volume [8, 20]
RV myocardialperformance index [8, 25–27]
Tissue Doppler index ofRV free wall [7, 8, 31, 32, 34]
Eccentricity index(end-systolic and
diastolic) [8, 43, 44]
Cardiac output [46, 47]
Congenital heart disease(in particular, excludepulmonary stenosis)
Valvular heart disease(in particular, mitral valve)
LV systolic/diastolicdysfunction
Pulmonary vascularresistance [46, 47]
Consider right heartassessment protocol
Assessassociated causes
RV ≥1/2 LV from PLAX [11]RVOT AT <105 ms [8, 15, 16]
RV IVRT >75 ms [8, 31, 32]IVC >20 mm and <50% inspiratory collapse [8]
TAPSE <20 mm [8, 28–30, 33, 53, 54]
End-diastolic PRV >1.0 m.s-1 [14, 17]TRV ≥2.6 m.s-1 [13]#
FIGURE 5. An algorithm for investigating pulmonary hypertension (PH) using
echocardiography. TRV: tricuspid regurgitant velocity; PRV: pulmonary regurgitant
velocity; RV: right ventricle; LV left ventricle; PLAX: parasternal long axis; RVOT:
right ventricular outflow tract; AT: acceleration time; TAPSE: tricuspid annular plane
systolic excursion; IVRT: isovolumic relaxation time; IVC: inferior vena cava; RA:
right atrium. #: in patients .60 yrs of age, a TRV o2.9 m?s-1 is used as a cut-off
value [13].
REVIEW: ECHO IN PH L.S. HOWARD ET AL.
246 VOLUME 21 NUMBER 125 EUROPEAN RESPIRATORY REVIEW

elsewhere, with a proposed scoring system for differentiatingbetween pulmonary venous hypertension and PAH [50].
NEW TECHNIQUESWe have presented a core clinical dataset for PH echocardio-graphy. Outside this dataset other techniques can be applied,but these do not form part of routine investigation either as aresult of complexity or because of lack of clinical validation.Exercise echocardiography has been proposed for early detec-tion of subclinical PH, e.g. in relatives of patients with idiopathicPAH [51], but as yet no clear clinical cut-off values have beenaccepted. Strain and strain rate examine the deformation andrate of deformation, respectively, of the myocardial segmentand, in PH, RV systolic strain and strain rate has been shown topredict morbidity and mortality [52], but at present is stillconsidered outside the standard echocardiography protocol.
ECHOCARDIOGRAPHY REPORTINGAll echocardiographic reports should include measurements,descriptions of all valves, the proximal great arteries, the heartchambers, the pericardium and Doppler findings. Where PH isthe reason for the referral, the emphasis should be put onpulmonary pressures, right heart chamber size and functionand any finding that may indicate a secondary cause (e.g. LVdysfunction, left heart valve disease or congenital heartdisease). Where PH is confirmed, the report should alsoinclude the various parameters that provide prognosticinformation (e.g. right atrial volume index, inferior vena cavadiameter, eccentricity index, presence of pericardial effusionand TAPSE). It is important that the reporter does not judgeseverity of PAH on the basis of estimated Ppa. Instead, con-clusions should be drawn on the severity of RV impairment. Anexample report is shown in figure S1 (online supplementary data).
These criteria should be taken as guides, not rules, and havebeen selected by consensus: it is important not to place toomuch emphasis on a single value, or consider them as precisethresholds for the diagnosis of PH. It may be necessary toundertake catheterisation when clinical suspicion is high, sinceechocardiography may sometimes be normal even in thepresence of PH. For example, in patients with a high pre-testprobability of PH with unexplained breathlessness (such asthose with scleroderma), as pressure can only be estimated byechocardiography, the final diagnosis of PH can only be madeby cardiac catheterisation.
CONCLUSIONSDetailed echocardiographic assessment of patients with PHallows useful diagnostic information to be collected. It can alsobe used to assess severity of right ventricular dysfunction,providing prognostic information and a noninvasive meansof following disease progression or response to therapy. Asuggested algorithm for investigating PH using transthoracicechocardiography is shown in figure 5.
STATEMENT OF INTERESTP. Nihoyannopoulos has received research and educational grantsfrom General Electric and from BRACCO Pharmaceuticals for orga-nising educational meetings. He has also received fees (less than £1,000)for consulting from General Electric.
ACKNOWLEDGEMENTSWe thank A. Kenny for her comments on the standard operating
procedure. Medical writing support was provided by L. Quine
(Elements Communications Ltd, Westerham, UK) and funded by
Actelion (Chiswick, UK).
REFERENCES1 Galie N, Hoeper MM, Humbert M, et al. Guidelines for the
diagnosis and treatment of pulmonary hypertension. Eur Respir J
2009; 34: 1219–1263.
2 Simonneau G, Robbins IM, Beghetti M, et al. Updated clinical
classification of pulmonary hypertension. J Am Coll Cardiol 2009;
54: Suppl. 1, S43–S54.
3 Haddad F, Couture P, Tousignant C, et al. The right ventricle in
cardiac surgery, a perioperative perspective: I. Anatomy, physiol-
ogy, and assessment. Anesth Analg 2009; 108: 407–421.
4 Haddad F, Couture P, Tousignant C, et al. The right ventricle in
cardiac surgery, a perioperative perspective: II. Pathophysiology, cli-
nical importance, and management. Anesth Analg 2009; 108: 422–433.
5 Bogaard HJ, Abe K, Vonk Noordegraaf A, et al. The right ventricle
under pressure: cellular and molecular mechanisms of right-heart
failure in pulmonary hypertension. Chest 2009; 135: 794–804.
6 Santamore WP, Dell’Italia LJ. Ventricular interdependence: sig-
nificant left ventricular contributions to right ventricular systolic
function. Prog Cardiovasc Dis 1998; 40: 289–308.
7 Grapsa J, Dawson D, Nihoyannopoulos P. Assessment of right
ventricular structure and function in pulmonary hypertension.
J Cardiovasc Ultrasound 2011; 19: 115–125.
8 Lang RM, Bierig M, Devereux RB, et al. Recommendations for
chamber quantification: a report from the American Society of
Echocardiography’s Guidelines and Standards Committee and the
Chamber Quantification Writing Group, developed in conjunction
with the European Association of Echocardiography, a branch of
the European Society of Cardiology. J Am Soc Echocardiogr 2005; 18:
1440–1463.
9 Ilercil A, O’Grady MJ, Roman MJ, et al. Reference values for
echocardiographic measurements in urban and rural populations of
differing ethnicity: the Strong Heart Study. J Am Soc Echocardiogr
2001; 14: 601–611.
10 Schiller NB, Shah PM, Crawford M, et al. Recommendations for
quantitation of the left ventricle by two-dimensional echocardio-
graphy. American Society of Echocardiography Committee on
Standards, Subcommittee on Quantitation of Two-Dimensional
Echocardiograms. J Am Soc Echocardiogr 1989; 2: 358–367.
11 Foale R, Nihoyannopoulos P, McKenna W, et al. Echocardiographic
measurement of the normal adult right ventricle. Br Heart J 1986;
56: 33–44.
12 Kitzman DW, Scholz DG, Hagen PT, et al. Age-related changes in
normal human hearts during the first 10 decades of life. Part II
(Maturity): a quantitative anatomic study of 765 specimens from
subjects 20 to 99 years old. Mayo Clin Proc 1988; 63: 137–146.
13 McQuillan BM, Picard MH, Leavitt M, et al. Clinical correlates
and reference intervals for pulmonary artery systolic pressure
among echocardiographically normal subjects. Circulation 2001;
104: 2797–2802.
14 Yoshida K, Yoshikawa J, Shakudo M, et al. Color Doppler
evaluation of valvular regurgitation in normal subjects. Circulation
1988; 78: 840–847.
15 Kitabatake A, Inoue M, Asao M, et al. Noninvasive evaluation
of pulmonary hypertension by a pulsed Doppler technique.
Circulation 1983; 68: 302–309.
16 Maeba H, Nakatani S, Sugawara M, et al. Different time course of
changes in tricuspid regurgitant pressure gradient and pulmonary
artery flow acceleration after pulmonary thromboendarterectomy:
L.S. HOWARD ET AL. REVIEW: ECHO IN PH
cEUROPEAN RESPIRATORY REVIEW VOLUME 21 NUMBER 125 247

implications for discordant recovery of pulmonary artery pressureand compliance. Circ J 2007; 71: 1771–1775.
17 Vahanian A, Baumgartner H, Bax J, et al. Guidelines on themanagement of valvular heart disease: The Task Force on theManagement of Valvular Heart Disease of the European Society ofCardiology. Eur Heart J 2007; 28: 230–268.
18 Triulizi M, Gillam LD, Gentile F, et al. Normal adult cross-sectionalechocardiographic values: linear dimensions and chamber areasechocardiography. Echocardiography 1984; 1: 403–426.
19 Schnittger I, Gordon EP, Fitzgerald PJ, et al. Standardizedintracardiac measurements of two-dimensional echocardiography.J Am Coll Cardiol 1983; 2: 934–938.
20 Wang Y, Gutman JM, Heilbron D, et al. Atrial volume in a normaladult population by two-dimensional echocardiography. Chest
1984; 86: 595–601.21 Anavekar NS, Skali H, Bourgoun M, et al. Usefulness of right
ventricular fractional area change to predict death, heart failure,and stroke following myocardial infarction (from the VALIANTECHO Study). Am J Cardiol 2008; 101: 607–612.
22 Wang J, Prakasa K, Bomma C, et al. Comparison of novelechocardiographic parameters of right ventricular function withejection fraction by cardiac magnetic resonance. J Am Soc
Echocardiogr 2007; 29: 1058–1064.23 Appleton CP, Firstenberg MS, Garcia MJ, et al. The echo-Doppler
evaluation of left ventricular diastolic function. A current per-spective. Cardiol Clin 2000; 18: 513–546.
24 Hatle L, Angelsen B. Doppler Ultrasound in Cardiology. PhysicalPrinciples and Clinical Applications. 2nd Edn. Philadelphia, Lea &Febiger, 1985.
25 Tei C, Dujardin KS, Hodge DO, et al. Doppler echocardiographicindex for assessment of global right ventricular function. J Am SocEchocardiogr 1996; 9: 838–847.
26 Dujardin KS, Tei C, Yeo TC, et al. Prognostic value of a Dopplerindex combining systolic and diastolic performance in idiopathic-dilated cardiomyopathy. Am J Cardiol 1998; 82: 1071–1076.
27 Yeo TC, Dujardin KS, Tei C, et al. Value of a Doppler-derivedindex combining systolic and diastolic time intervals in predictingoutcome in primary pulmonary hypertension. Am J Cardiol 1998;81: 1157–1161.
28 Forfia PR, Fisher MR, Mathai SC, et al. Tricuspid annulardisplacement predicts survival in pulmonary hypertension. Am J
Respir Crit Care Med 2006; 174: 1034–1041.29 Kaul S, Tei C, Hopkins JM, et al. Assessment of right ventricular
function using two-dimensional echocardiography. Am Heart J
1984; 107: 526–531.30 Lee CY, Chang SM, Hsiao SH, et al. Right heart function and
scleroderma: insights from tricuspid annular plane systolicexcursion. Echocardiography 2007; 24: 118–125.
31 Abbas A, Lester S, Moreno FC, et al. Noninvasive assessment ofright atrial pressure using Doppler tissue imaging. J Am Soc
Echocardiogr 2004; 17: 1155–1160.32 Stein PD, Sabbah HN, Anbe DT, et al. Performance of the failing
and nonfailing right ventricle of patients with pulmonaryhypertension. Am J Cardiol 1979; 44: 1050–1055.
33 Olson JM, Samad BA, Alam M. Prognostic value of pulse-wavetissue Doppler parameters in patients with systolic heart failure.Am J Cardiol 2008; 102: 722–725.
34 Alam M, Wardell J, Andersson E, et al. Characteristics of mitraland tricuspid annular velocities determined by pulsed waveDoppler tissue imaging in healthy subjects. J Am Soc Echocardiogr1999; 12: 618–628.
35 Meluzin J, Spinarova L, Bakala J, et al. Pulsed Doppler tissueimaging of the velocity of tricuspid annular systolic motion: a newrapid and non-invasive method of evaluating right ventricularsystolic function. Eur Heart J 2001; 22: 340–348.
36 Grapsa J, Gibbs JS, Cabrita IZ, et al. The association of clinicaloutcome with right atrial and ventricular remodelling in patientswith pulmonary arterial hypertension: study with real-time three-dimensional echocardiography. Eur Heart J Cardiovasc Imaging
2012; [Epub ahead of print DOI: 10.1093/ehjci/jes003].37 Ghio S, Klersy C, Magrini G, et al. Prognostic relevance of the
echocardiographic assessment of right ventricular function inpatients with idiopathic pulmonary arterial hypertension. Int J
Cardiol 2010; 140: 272–278.38 Brierre G, Blot-Souletie N, Degano B, et al. New echocardiographic
prognostic factors for mortality in pulmonary arterial hyperten-sion. Eur J Echocardiogr 2010; 11: 516–522.
39 Fisher MR, Forfia PR, Chamera E, et al. Accuracy of Dopplerechocardiography in the hemodynamic assessment of pulmonaryhypertension. Am J Respir Crit Care Med 2009; 179: 615–621.
40 Nath J, Foster E, Heidenreich PA. Impact of tricuspid regurgitationon long-term survival. J Am Coll Cardiol 2004; 43: 405–409.
41 Zoghbi WA, Enriquez-Sarano M, Foster E, et al. Recommendationsfor evaluation of the severity of native valvular regurgitationwith two-dimensional and Doppler echocardiography. J Am SocEchocardiogr 2003; 16: 777–802.
42 Mukerjee D, St George D, Knight C, et al. Echocardiography and pul-monary function as screening tests for pulmonary arterial hyper-tension in systemic sclerosis. Rheumatology (Oxford) 2004; 43: 461–466.
43 Arkles JS, Opotowsky AR, Ojeda J, et al. Shape of the rightventricular Doppler envelope predicts hemodynamics and rightheart function in pulmonary hypertension. Am J Respir Crit CareMed 2011; 183: 268–276.
44 Feneley M, Gavaghan T. Paradoxical and pseudoparadoxicalinterventricular septal motion in patients with right ventricularvolume overload. Circulation 1986; 74: 230–238.
45 Ryan T, Petrovic O, Dillon JC, et al. An echocardiographic indexfor separation of right ventricular volume and pressure overload.J Am Coll Cardiol 1985; 5: 918–927.
46 Abbas AE, Fortuin FD, Schiller NB, et al. A simple method fornoninvasive estimation of pulmonary vascular resistance. J Am
Coll Cardiol 2003; 41: 1021–1027.47 Scapellato F, Temporelli PL, Eleuteri E, et al. Accurate noninvasive
estimation of pulmonary vascular resistance by Doppler echocar-diography in patients with chronic failure heart failure. J Am Coll
Cardiol 2001; 37: 1813–1819.48 Galie N, Hinderliter AL, Torbicki A, et al. Effects of the oral
endothelin-receptor antagonist bosentan on echocardiographicand Doppler measures in patients with pulmonary arterialhypertension. J Am Coll Cardiol 2003; 41: 1380–1386.
49 Tei C, Ling LH, Hodge DO, et al. New index of combined systolicand diastolic myocardial performance: a simple and reproduciblemeasure of cardiac function – a study in normals and dilatedcardiomyopathy. J Cardiol 1995; 26: 357–366.
50 Roberts JD, Forfia PR. Diagnosis and assessment of pulmonaryvascular disease by Doppler echocardiography. Pulm Circ 2011; 1:160–181.
51 Grunig E, Weissmann S, Ehlken N, et al. Stress Dopplerechocardiography in relatives of patients with idiopathic andfamilial pulmonary arterial hypertension: results of a multicenterEuropean analysis of pulmonary artery pressure response toexercise and hypoxia. Circulation 2009; 119: 1747–1757.
52 Sachdev A, Villarraga HR, Frantz RP, et al. Right ventricular strainfor prediction of survival in patients with pulmonary arterialhypertension. Chest 2011; 139: 1299–1309.
53 Hammarstrom E, Wranne B, Pinto FJ, et al. Tricuspid annularmotion. J Am Soc Echocardiogr 1991; 4: 131–139.
54 Lopez-Candales A, Dohi K, Rajagopalan N, et al. Defining normalvariables of right ventricular size and function in pulmonary hyperten-sion: an echocardiographic study. Postgrad Med J 2008; 84: 40–45.
REVIEW: ECHO IN PH L.S. HOWARD ET AL.
248 VOLUME 21 NUMBER 125 EUROPEAN RESPIRATORY REVIEW