Embed Size (px)
Citation preview

Echocardiographic Assessment of the Right Heart in Adults
A Report from the American Society of Echocardiography, 2010

Learning Objectives Describe the conventional two-dimensional acoustic
windows required for optimal evaluation of the right heart
Describe the echocardiographic parameters required in routine and directed echocardiographic studies, and the views to obtain these parameters for assessing right ventricular size and function
Identify the advantages and disadvantages of each measure or technique as supported by the available literature
Recognize which right sided measures should be included in the standard echocardiographic report
Explain the clinical and prognostic significance of right ventricular assessment

Discussion The right ventricle plays an important role
in the morbidity and mortality of patients presenting with signs and symptoms of cardiopulmonary disease Systematic assessment of right heart not
uniformly carried out Enormous attention given to left heart Lack of familiarity with u/s techniques that can be used
to assess the right heart Scarcity of u/s studies providing normal reference
values

Executive summary In all routine studies, the sonographer and
physician should examine the right heart using multiple windows
The report should represent an assessment based on qualitative and quantitative parameters
The report should include a measure of RV size RA size RV systolic function PASP

Basic views

Basic views

Basic views
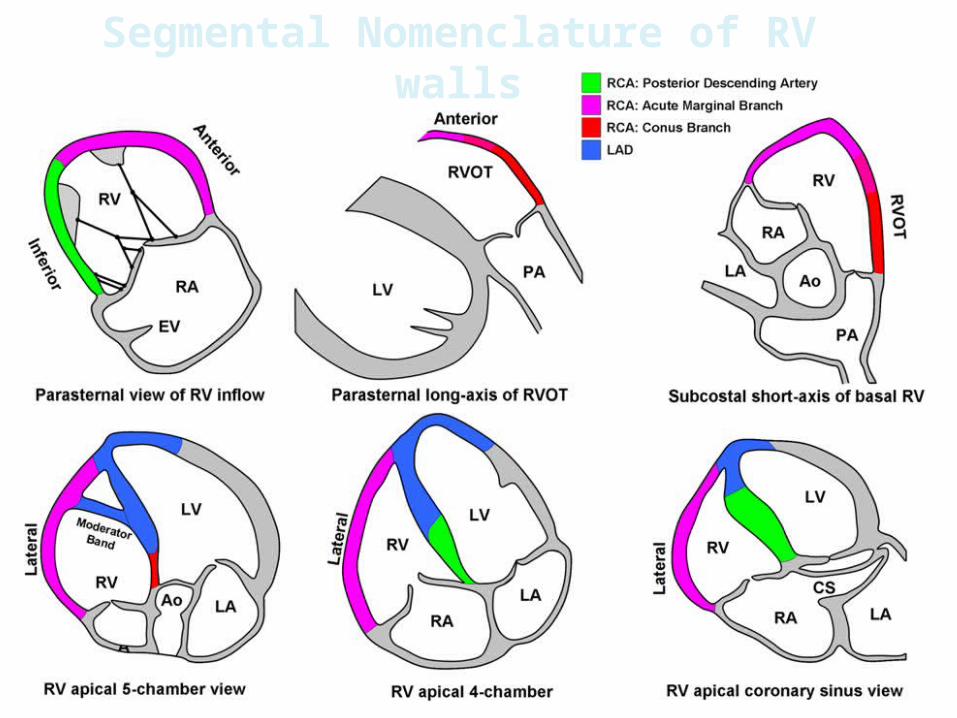
Segmental Nomenclature of RV walls

Right heart dimensions Right ventricle-focused apical 4 chamber view
Measured at end-diastole
Sensitivity of angular change despite similar size and appearance of the left ventricle

Right ventricular dimensions
1. Basal RV diameter2. Mid cavitary RV
diameter3. RV longitudinal
dimension
4.2 cm indicates dilatation 3.5 cm indicates dilatation 8.6 cm indicates RV
enlargement

RV linear dimensions
Advantages Disadvantages
Linear dimensions are easily obtained on apical 4 chamber view
Good markers of RV dilatation
RV dimensions are highly dependent on probe rotation by the user Can result in
underestimation of RV width

Recommendation“Patients with echocardiographic evidence of
right-sided heart disease of PH should ideally have measurements of RV basal, mid cavitary, and longitudinal dimensions on a 4-chamber view. In all complete echocardiographic studies, the RV basal measurement should be reported and the report should state the window from which the measurement was performed (ideally the right ventricle-focused view), to permit interstudy comparisons.”

Right atrial assessment Apical 4-chamber view Estimation of right atrial area by planimetry
The maximum long distance of the RAis from the center of the tricuspid annulus to the superior RA wall, parallel to the interatrial septumA mid RA minor distancve is defined from the mid level of the RA free wall to the interatrial septum perpendicular to the long axisRA area is traced at the end of ventricular systole, excluding the IVC, SVC, and RAA
Normal area < 18 cm²

Advantages Disadvantages
Ra dimensions and area are easily obtained on an apical 4 chamber view
Good markers of RA dilatation
RA area is more time consuming than linear dimensions alone

Recommendation Images adequate for RA area estimation
should be obtained in patients undergoing evaluation for RV or LV dysfunction
RA dimensions should be considered in all patients with significant RV dysfunction in who image quality does not permit for the measurement of RA areaNote: RA volume measurements have not been standardized and are not currently recommended

RA pressure determination
Measurement of the IVC should be obtained at end-expiration and just proximal to the junction of the hepatic veins that lie approximately 0.5 to 3.0 cm proximal to the ostium of the right atriumTo accurately assess IVC collapse, the change in diameter of the IVC with a sniff and also with quiet respiration should be measured, ensuring that the change in diameter does not reflect a translation of the IVC into another plane

Recommendations
For simplicity and uniformity of reporting, specific values of RA pressure , rather than ranges, should be used in the
determination of SPAP
IVC diameter IVC collapsibility RA pressure
≤ 2.1 cm > 50% with a sniff 3 mmHg
> 2.1 cm < 50 % with a sniff 15 mmHg
In indeterminate cases in which IVC diameter and collapse do not fit this paradigm, an intermediate value of 8 mmHg may be used, preferably with use of secondary indices of RA pressures such as: RA dilatation, abnormal bowing of the IAS into the left atrium throughout the cardiac cycleAdvantages Disadvantages
IVC dimensions are usually obtainable from the subcostal window
IVC collapse does not accurately reflect RA pressure in ventilator-dependent patientsIt is less reliable for intermediate values of RA pressure

RV Wall Thickness Useful measurement of RVH From the subcostal view, align the u/s
beam perpendicular to the RV free wall Exclude RV trabeculations and papillary muscle
from endocardial border Moving the focus to the RV wall region and decreasing
the depth will improve endocardial border definition When imaging quality permits use fundamental frequency
Normal < 0.5 cm

RV Wall Thickness
Advantages Disadvantages
RV wall thickness can be measured by M-mode or 2D echocardiography
It can be measured either from the subcostal or left parasternal window
There is a lack of established prognostic information

Recommendation Abnormal RV wall thickness should be
reported, if present, in patients suspected of having RV and/or LV dysfunction

RVOT measurement Best viewed from left parasternal and
subcostal windows Should be measured at end-diastole on the
QRS deflection
Normal 1.7-2.7 cm

RVOT measurement
Advantages Disadvantages
RVOT dimensions are easily obtained from the left PSAX window
Certain lesions may primarily affect the RVOT
Limited normative data are available
The window for measurement of RVOT size has not been standardized
Oblique imaging of the RVOT may underestimate or overestimate its size
The endocardial definition of the anterior wall is often suboptimal

Recommendation On select patients with congenital heart
disease or arrhythmia potentially involving the RVOT, proximal and distal diameters of the RVOT should be measured from the PSAX or PLAX views
The PSAX distal RVOT diameter, just proximal to the pulmonary annulus, is the most reproducible and should be generally used
Cases of suspected ARRVC, the PLAX measure maybe added
RV systolic function All studies should include a measure of RV
systolic function using at least one of the following: Fractional area change (FAC) Tricuspid annular plane systolic excursion (TAPSE) S´
One of these measurements should be reported with or without RV index of myocardial performance (RIMP)

Fractional area change Defined as
RV FAC correlates well with RV EF by MRI RV FAC found to be independent predictor of
heart failure, sudden death, stroke, and/or mortality in studies of patients after pulmonary embolism
End diastolic area – End systolic areaEnd-diastolic area
X 100
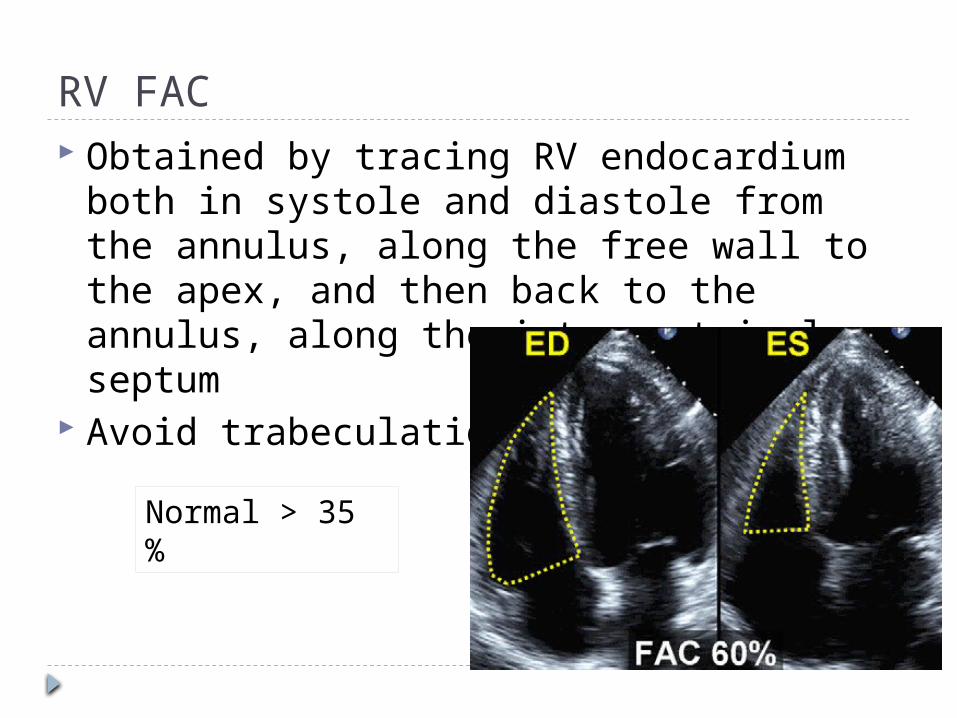
RV FAC Obtained by tracing RV endocardium both
in systole and diastole from the annulus, along the free wall to the apex, and then back to the annulus, along the interventricular septum
Avoid trabeculations
Normal > 35 %

Recommendation 2D Fractional Area Change is one of the
recommended methods of quantitatively estimating RV function

TAPSE or TAM Acquired by placing an M-mode cursor
through the tricuspid annulus and measuring the amount of longitudinal motion of the annulus at peak systole
Normal > 16 mm

TAPSE
Advantages Disadvantages
TAPSE is simple Less dependent on
optimal image quality Reproducible Does not require
sophisticated equipment or prolonged image analysis
TAPSE assumes that the displacement of a single segment represents the function of a complex 3D structure
It is angle dependent There are no large scale
validation studies TAPSE maybe load
dependent

Recommendation TAPSE should be used routinely as a simple
method of estimating RV function

Tissue Doppler Imaging
An apical four chamber view is used The pulsed Doppler sample volume is
placed in either the tricuspid annulus or the middle of the basal segment of the RV free wall
The S´ velocity is read as the highest systolic velocity without over-gaining the Doppler envelope
Normal > 10 cm/s

Tissue Doppler (S´)
Advantages Disadvantages
A simple, reproducible technique with good discriminatory ability to detect normal versus abnormal RV function
Pulsed Doppler is available on all modern systems
Maybe obtained and analyzed off-line
Less reproducible for nonbasal segments
Is angle dependent Limited normative data
in all ranges' and in both sexes
It assumes that the function of a single segment represents the function of the entire right ventricle

Recommendation Interrogation of S´ by pulsed tissue Doppler is
a simple and reproducible measure to assess basal RV free wall function and should be used in the assessment of RV function

RV IMP (Tei Index) RV index of Myocardial Performance Global index of both systolic and diastolic
function of the right ventricle
IVRT + IVCTET
Normal < 0.40 Normal < 0.55

Advantages Disadvantages
This approach is feasible in a large majority of subjects
The MPI is reproducible It avoids geometric
assumptions and limitations of the complex RV geometry
The pulsed TDI method allows for measurement of MPI as well as S´, E´, and A´ all from a single image
The MPI is unreliable when RV ET and TR time are measured with differing R-R intervals, as in atrial fibrillation
It is load dependent and unreliable when RA pressures are elevated

Recommendation The MPI may be used for initial and serial
measurements as an estimate of RV function in complement with other quantitative and qualitative measures
It should not be used as the sole quantitative method for evaluation of RV function and should not be used with irregular heart rates

RV Strain and Strain rate Due to the lack of normative data and the lack
of reproducibility, these methods are not recommended for routine clinical use

RV Diastolic Function From the apical 4-chamber view, the
Doppler beam should be aligned parallel to RV inflow
Sample volume is placed at the tips of the tricuspid valve leaflets
Measure at held end-expiration and/or take the average of ≥ 5 consecutive beats
Measurements are essentially the same as those used for the left side

RV Diastolic FunctionVariable Lower reference
valueUpper reference
value
E (cm/s) 35 73
A (cm/s) 21 58
E/A ratio 0.8 2.1
Deceleration time (ms)
120 229
IVRT (ms) 23 73
E’ (cm/s) 8 20
A’ (cm/s) 7 20
E’/A’ ratio 0.5 1.9
E/E’ 2 6

Recommendation
Measurement of RV diastolic function should be considered in patients with suspected RV impairment as a marker of early or subtle RV dysfunction, or in patients with known RV impairment as a marker for poor prognosis
Transtricupsid E/A ratio, E/E’ ratio, and RA size have been most validated are the preferred measures
Grading of RV Diastolic Dysfunction should be done as follows: E/A ratio < 0.8 suggests impaired relaxation
E/A ratio 0.8-2.1 with an E/E’ ratio > 6 or diastolic prominence in the hepatic veins suggest pseudonormal filling
E/A ratio > 2.1 with deceleration time < 120 ms suggests restrictive filling

Other Recommendations
Visual assessment of ventricular septal curvature looking for a D-shaped pattern in systole and diastole should be used to help in the diagnosis of RV volume an/or pressure overload
RV pressure overload-septal shift throughout cardiac cycle with most marked distortion of LV at end systole
RV volume overload-septal shift occurs predominately in mid to late diastole

Other Recommendations SPAP should be estimated and reported in
all subjects with reliable tricuspid regurgitant jets Discourages use of contrast as it obscures the
clear envelope

Other Recommendations Mean PA pressure
Whenever possible, it is helpful to use several methods to calculate mean pressure so that the internal consistency of the data can be challenged and confirmed. Methods to use:
1/3 (SPAP)
+ 2/3 (PADP)
1. Mean PA pressure =2. Mean PA pressure =
79 – (0.45 x AT)
3. Mean PA pressure =
90 – (0.62 x AT)
4. Mean PA pressure =
4 x (early PR vel²) + est. RAP

Mean PA Pressure
4(early PR vel)² + est. RAP
4(3.05 m/sec)² + est. RAP
Mean PAP= 37 mmHg + RAP
4(2.29 m/sec)² + est. RAP
PADP = 21 mmHg + RAP

Mean PA Pressure In patients with PA hypertension or heart
failure, an estimate of PADP from either the mean gradient of the TR jet or from the pulmonary regurgitant jet should be reported
If the estimated SPAP is > 35-40 mmHg, stronger scrutiny may be warranted to determine if PH is present, factoring in other clinical information
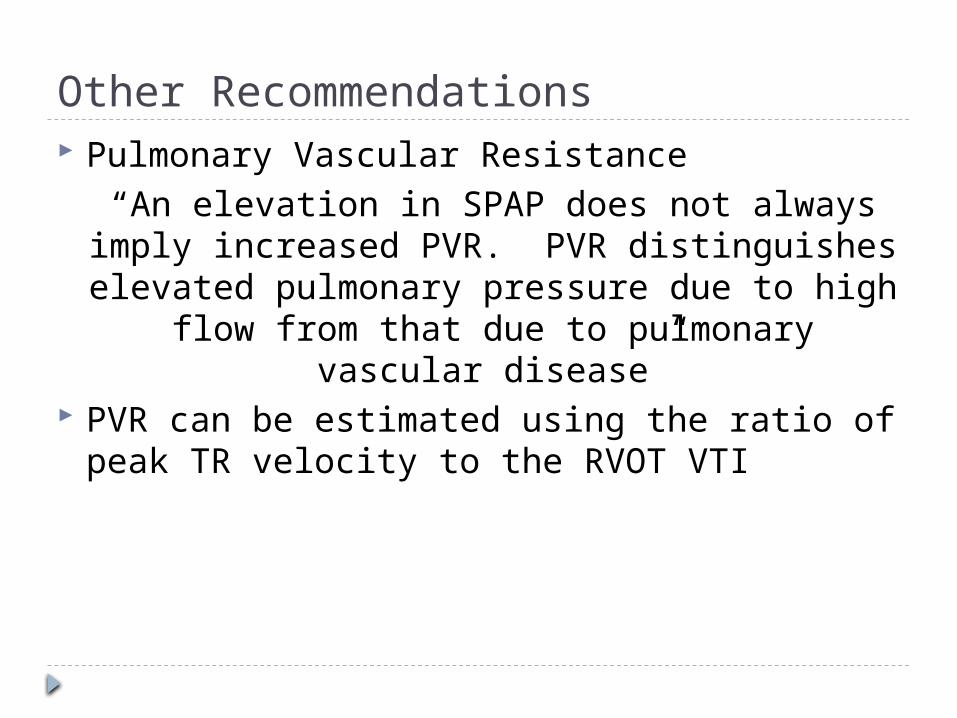
Other Recommendations Pulmonary Vascular Resistance
“An elevation in SPAP does not always imply increased PVR. PVR distinguishes elevated
pulmonary pressure due to high flow from that due to pulmonary vascular disease”
PVR can be estimated using the ratio of peak TR velocity to the RVOT VTI

Pulmonary Vascular Resistance
PVR = TRV max / RVOT TVI x 10 + 0.16 2.78 m/sec ÷ 11 cm x 10 +
0.16 = 2.68 Wood units
Significant PHTN exists when PVR is > 3 Wood units
PVR The estimation of PVR is not adequately
established to be recommended for routine use but may be considered in subjects in whom pulmonary systolic pressure may be exaggerated by high stroke volume or misleading low by reduced stroke volume
The noninvasive estimation of PVR should not be used as a substitute for the invasive evaluation of PVR when this value is an important guide to therapy

RV dP/dt The rate of pressure rise in the right
ventricle Estimated from the ascending limb of the
tricuspid regurgitant CW Doppler signal Measure the time required for the TR jet to
increase in velocity from 1 to 2 m/s (represents a 12 mmHg increase)
30 ms or 0.03 seconds12 mmHg / 0.03 seconds400 mmHg/s
RV dP/dt < 400 mmHg/s is likely abnormal

RV dP/dt Because of the lack of data in normal subjects,
RV dP/dt cannot be recommended for routine uses. It can be considered in subjects with suspected RV dysfunction