Embed Size (px)
Citation preview
atmosphere (attenuation) and spherical spreading losses, assuming that the bat acts as apoint source. The rate of atmospheric absorption is dependent on temperature, humidityand frequency and was calculated as 0.57 dB m21 at 27.1 kHz, 1.09 dB m21 at 39.0 kHz,1.23 dB m21 at 41.7 kHz, and 1.86 dB m21 at 53.6 kHz. Spreading losses are described bythe standard inverse square law for point sources. If the target is a small insect that acts as apoint source it will re-radiate the incident sound back to the bat, so spreading losses aredoubled15.
Total sound losses for a target at R2 ¼ 2ð20 logðR1=R2ÞÞ þ að2ðR2 2R1ÞÞ (in which thetwo terms are spherical spreading and absorption by atmosphere, respectively) if R1 andR2 are two distances at a point from the original source; we follow ref. 15 in assuming thatR1 is 0.1 m in front of the bat, R2 is the target range (distance to target) and a is absorptionloss per metre. The echo strength was then adjusted for target losses, which depend on thecall frequency and size of the prey. We modelled detection distance for prey with winglengths of 25 and 5 mm with frequency-dependent target losses incorporated13,14.
Tissue collection for genetic analysisWing membrane samples were collected from all individuals with a 3-mm biopsy punch(Stiefel Laboratories), and DNA was isolated with Qiagen DNeasy kits.
Microsatellite analysisWe genotyped R. philippinensis morphs (6 large, 4 intermediate, 13 small), R. euryotis (7from Buton, 6 from Kabaena) and R. celebensis (6 from Buton) with 9–12 polymorphicmicrosatellite markers developed from R. ferrumequinum (GenBank accession numbersAF160200, AF160202, AF160207, AF160210, AF160211 (ref. 25), AJ560694, AJ560695b,AJ560698, AJ560702–AJ560704 and AJ560710 (ref. 26)). Primers were fluorescentlylabelled and amplified products were run on an ABI 3700 automated sequencer. Allele sizeswere analysed with the software GENESCAN version 3.1 and GENOTYPER version 3.6.
Allelic diversity (number of polymorphic loci, mean number of alleles per locus)recorded for the five taxa was as follows: large morph, 8, 3.08; small morph, 8, 2.67;intermediate morph, 8, 2.25; R. euryotis (Buton), 9, 6.1; R. celebensis, 10, 4.75. Wecalculated Weir–Cockerham F statistics and assessed their significance with thepermutation routine in the program GENETIX, which is suited to the analysis of smallsample sizes. F is estimates derived for each locus and for all loci together showed nosignificant deviation (P . 0.05) from Hardy–Weinberg expectations in any of the fivetaxa. To determine whether heterozygosity estimates differed significantly between thethree R. philippinensis morphs, we obtained likelihood curves by following the methoddescribed in detail in ref. 27, in which the precision of the maximum-likelihood estimate ofheterozygosity is reflected in the spread of the curve. To check that possible sampling ofclose relatives did not bias our F st estimates, we examined mtDNA haplotypes and derivedQueller–Goodnight pairwise coefficients of relatedness between individuals within eachsize class by using the program RELATEDNESS version 5.0. In only two cases of sharedmtDNA haplotypes, relatedness estimates approximated to zero.
Phylogenetic inferenceWe amplified and sequenced 460 base pairs of the mtDNA control region with the use ofthe primers ThrL16272 (ref. 28) and DLH 16750 (ref. 29). Sequences were aligned withpublished sequences of two morphs sampled from Queensland, Australia, and anoutgroup (R. arcuatus)11. We performed phylogenetic reconstruction by maximumparsimony analysis (heuristic search) in PAUP. We derived a 50% majority-rule consensustree and assessed the reliability of clades by bootstrapping (1,000 iterations). Pairwisedivergence between all sequences was calculated (HKY85 model).
Received 3 December 2003; accepted 11 March 2004; doi:10.1038/nature02487.
1. Schluter, D. Ecology and the origin of species. Trends Ecol. Evol. 16, 372–380 (2001).
2. Via, S. Sympatric speciation in animals: the ugly duckling grows up. Trends Ecol. Evol. 16, 381–390
(2001).
3. Rice, W. R. & Hostert, E. E. Perspective: Laboratory experiments on speciation: what have we learned
in forty years? Evolution 47, 1637–1653 (1993).
4. Guillen Servent, A., Francis, C. M. & Ricklefs, R. E. in Horseshoe Bats of the World (Chiroptera:
Rhinolophidae) (eds Csorba, G., Ujhelyi, P. & Thomas, N) xii–xxiv (Alana Books, Bishop’s Castle,
Shropshire, UK, 2003).
5. Bruns, V. Peripheral auditory tuning for fine frequency analysis by the CF-FM bat,
Rhinolophus ferrumequinum. I. Mechanical specializations of the cochlea. J. Comp. Physiol. 106, 77–86
(1976).
6. Schuller, G. & Pollak, G. D. Disproportionate frequency representation in the inferior colliculus of
Doppler-compensating greater horseshoe bats, evidence for an acoustic fovea. J. Comp. Physiol. A 132,
47–52 (1979).
7. Schnitzler, H.-U. in Recent Advances in the Study of Bats (eds Fenton, M. B., Racey, P. A. & Rayner,
J. M. V.) 226–243 (Cambridge Univ. Press, 1987).
8. Hartley, D. J. & Suthers, R. A. The acoustics of the vocal tract in the horseshoe bat, Rhinolophus
hildebrandti. J. Acoust. Soc. Am. 84, 1201–1213 (1988).
9. Schluter, D. & Nagel, L. M. Parallel speciation by natural selection. Am. Nat. 146, 292–301 (1995).
10. Simmons, N. B. in Mammal Species of the World: ATaxonomic and Geographic Reference
(eds Wilson, D. E. & Reeder, D. M.) 3rd edn (Smithsonian Institution Press, Washington DC, in the
press).
11. Cooper, S. J. B., Reardon, T. B. & Skilins, J. Molecular systematics of Australian rhinolophid bats
(Chiroptera: Rhinolophidae). Aust. J. Zool. 46, 203–220 (1998).
12. Pye, J. D. Is fidelity futile? The ‘true’ signal is illusory, especially with ultrasound. Bioacoustics 4,
271–286 (1993).
13. Kober, R. & Schnitzler, H.-U. Information in sonar echoes of fluttering insects available for
echolocating bats. J. Acoust. Soc. Am. 87, 882–896 (1990).
14. Houston, R. D., Boonman, A. M. & Jones, G. in Echolocation in Bats and Dolphins (eds Thomas, J. A.,
Moss, C. F. & Vater, M.) 339–344 (Univ. of Chicago Press, 2004).
15. Lawrence, B. D. & Simmons, J. A. Measurements of atmospheric attenuation at ultrasonic frequencies
and the significance for echolocation by bats. J. Acoust. Soc. Am. 71, 585–590 (1982).
16. Jones, G. & Barlow, K. E. in Echolocation in Bats and Dolphins (eds Thomas, J. A., Moss, C. F. &
Vater, M.) 345–349 (Univ. of Chicago Press, 2004).
17. NATO Advanced Study Institute & Mohres, F. P. Cours d’Ete OTAN sur les Systemes Sonars Animaux;
Biologie et Bionique 2 939–945 (Laboratoire de Physiologie Acoustique, Paris, 1966).
18. Matsumura, S. Mother–infant communication in a horseshoe bat (Rhinolophus ferrumequinum
nippon): vocal communication in three-week old infants. J. Mamm. 62, 20–28 (1981).
19. Andrews, M. M. & Andrews, P. T. Ultrasound social calls made by greater horseshoe bats (Rhinolophus
ferrumequinum) in a nursery roost. Acta Chiropterol. 5, 221–234 (2003).
20. Long, G. R. & Schnitzler, H.-U. Behavioural audiograms from the bat, Rhinolophus ferrumequinum.
J. Comp. Physiol. A 100, 211–219 (1975).
21. Fenton, M. B. Communication in the Chiroptera (Indiana Univ. Press, 1985).
22. Francis, C. M. & Habersetzer, J. in Bat Biology and Conservation (eds Kunz, T. H. & Racey, P. A.)
169–181 (Smithsonian Institution Press, Washington DC, 1998).
23. Vater, M. in Ontogeny, Functional Ecology and Evolution of Bats (eds Adams, R. A. & Pedersen, S. C.)
137–173 (Cambridge Univ. Press, 2000).
24. Rubsamen, R. & Schafer, M. Audio-vocal interactions during development? Vocalisation in deafened
young horseshoe bats vs. audition invocalization-impaired bats. J.Comp.Physiol. A167,771–784 (1990).
25. Rossiter, S. J., Burland, T. M., Jones, G. & Barratt, E. M. Characterization of microsatellite loci in the
greater horseshoe bat Rhinolophus ferrumequinum. Mol. Ecol. 8, 1957–1969 (1999).
26. Dawson, D. A., Rossiter, S. J., Jones, G. & Faulkes, C. F. Microsatellite loci for the greater horseshoe bat,
Rhinolophus ferrumequinum (Rhinolophidae, Chiroptera) and their cross-utility in 17 other bat
species. Mol. Ecol. Notes 4, 96–100 (2004).
27. Nichols, R. A., Bruford, M. W. & Groombridge, J. J. Sustaining genetic variation in a small population:
evidence from the Mauritius kestrel. Mol. Ecol. 10, 593–602 (2001).
28. Stanley, H. F. et al. Worldwide patterns of mitochondrial DNA differentiation in the harbour seal
(Phoca vitulina). Mol. Biol. Evol. 13, 368–382 (1996).
29. Wilkinson, G. S. & Chapman, A. M. Length and sequence variation in Evening Bat D-Loop mtDNA.
Genetics 128, 607–617 (1991).
30. Churchill, S. Australian Bats (New Holland, Sydney, 1998).
Supplementary Information accompanies the paper on www.nature.com/nature.
Acknowledgements We thank the Indonesian Institute of Science (LIPI) and the Wallacea
Development Institute for granting permissions to undertake this work, and T. Coles, Boeadi and
Operation Wallacea staff and volunteers for logistical support in Indonesia. We thank Ririn and
Samsudin for help in the field; A. Boonman, T. Burland, D. Dawson, C. Faulkes, K. Freeman,
B. Kirsten, R. Nichols, L. Pettersson and J. Storz for advice on analysis and technical support; and
B. Fenton and G. Jones for helpful comments on the manuscript. This work was funded by
Operation Wallacea, and microsatellite development was supported by the NERC-funded
Sheffield Molecular Genetics Facility.
Authors’ contributions T.K. and S.J.R. performed the acoustic and genetic analyses, respectively,
and jointly undertook the fieldwork and wrote the paper. The order of authors is alphabetical.
Competing interests statement The authors declare that they have no competing financial
interests.
Correspondence and requests for materials should be addressed to T.K. ([email protected]). Accession
numbers for new and published sequences are AY568637–AY568646, and AF065069–AF065073
and AF065090 (ref. 12), respectively.
..............................................................
Echolocation signals reflect nichedifferentiation in five sympatriccongeneric bat speciesBjorn M. Siemers & Hans-Ulrich Schnitzler
Animal Physiology, Zoological Institute, University of Tubingen, Morgenstelle 28,72076 Tubingen, Germany.............................................................................................................................................................................
Echolocating bats can be divided into guilds according to theirpreferred habitat and foraging behaviour1–4, which coincide withdistinct adaptations in wing morphology5 and structure ofecholocation signals6. Although coarse structuring of nichespace between different guilds is generally accepted, it is notclear how niches differ within guilds7–10, or whether there is fine-grained niche differentiation reflected in echolocation signalstructure11,12. Using a standardized performance test, here weshow clutter-dependent differences in prey-capture success for
letters to nature
NATURE | VOL 429 | 10 JUNE 2004 | www.nature.com/nature 657© 2004 Nature Publishing Group
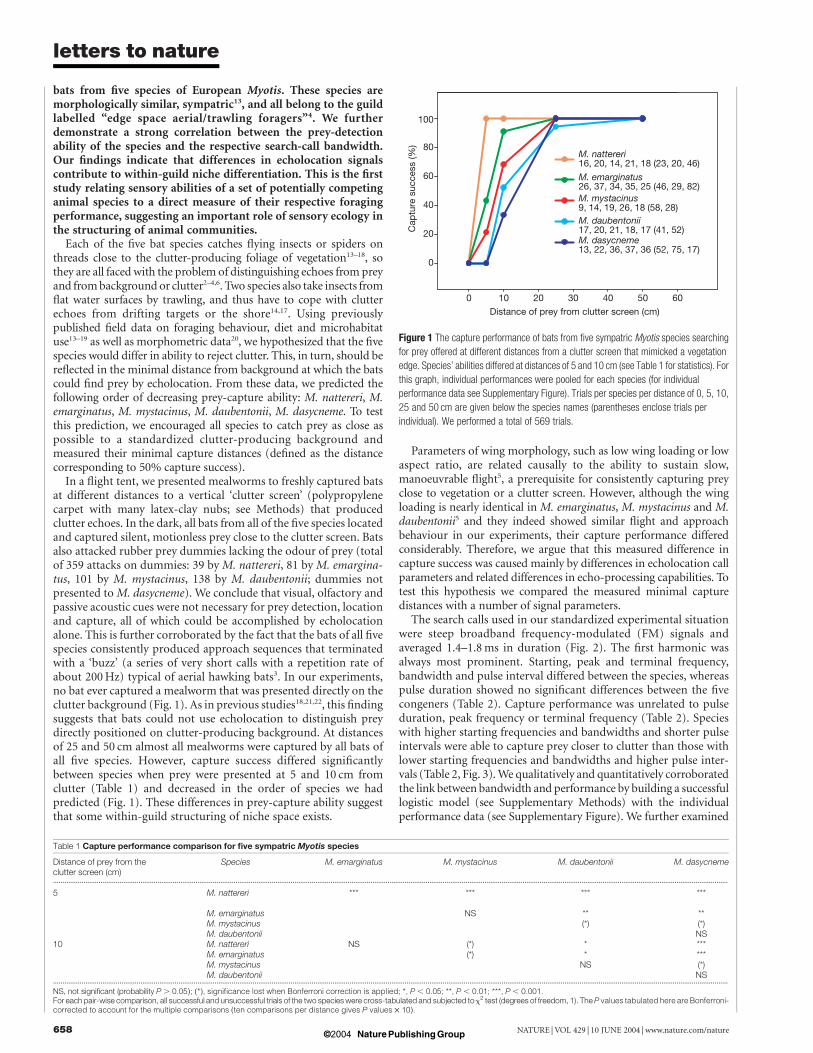
bats from five species of European Myotis. These species aremorphologically similar, sympatric13, and all belong to the guildlabelled “edge space aerial/trawling foragers”4. We furtherdemonstrate a strong correlation between the prey-detectionability of the species and the respective search-call bandwidth.Our findings indicate that differences in echolocation signalscontribute to within-guild niche differentiation. This is the firststudy relating sensory abilities of a set of potentially competinganimal species to a direct measure of their respective foragingperformance, suggesting an important role of sensory ecology inthe structuring of animal communities.
Each of the five bat species catches flying insects or spiders onthreads close to the clutter-producing foliage of vegetation13–18, sothey are all faced with the problem of distinguishing echoes from preyand from background or clutter2–4,6. Two species also take insects fromflat water surfaces by trawling, and thus have to cope with clutterechoes from drifting targets or the shore14,17. Using previouslypublished field data on foraging behaviour, diet and microhabitatuse13–19 as well as morphometric data20, we hypothesized that the fivespecies would differ in ability to reject clutter. This, in turn, should bereflected in the minimal distance from background at which the batscould find prey by echolocation. From these data, we predicted thefollowing order of decreasing prey-capture ability: M. nattereri, M.emarginatus, M. mystacinus, M. daubentonii, M. dasycneme. To testthis prediction, we encouraged all species to catch prey as close aspossible to a standardized clutter-producing background andmeasured their minimal capture distances (defined as the distancecorresponding to 50% capture success).
In a flight tent, we presented mealworms to freshly captured batsat different distances to a vertical ‘clutter screen’ (polypropylenecarpet with many latex-clay nubs; see Methods) that producedclutter echoes. In the dark, all bats from all of the five species locatedand captured silent, motionless prey close to the clutter screen. Batsalso attacked rubber prey dummies lacking the odour of prey (totalof 359 attacks on dummies: 39 by M. nattereri, 81 by M. emargina-tus, 101 by M. mystacinus, 138 by M. daubentonii; dummies notpresented to M. dasycneme). We conclude that visual, olfactory andpassive acoustic cues were not necessary for prey detection, locationand capture, all of which could be accomplished by echolocationalone. This is further corroborated by the fact that the bats of all fivespecies consistently produced approach sequences that terminatedwith a ‘buzz’ (a series of very short calls with a repetition rate ofabout 200 Hz) typical of aerial hawking bats3. In our experiments,no bat ever captured a mealworm that was presented directly on theclutter background (Fig. 1). As in previous studies18,21,22, this findingsuggests that bats could not use echolocation to distinguish preydirectly positioned on clutter-producing background. At distancesof 25 and 50 cm almost all mealworms were captured by all bats ofall five species. However, capture success differed significantlybetween species when prey were presented at 5 and 10 cm fromclutter (Table 1) and decreased in the order of species we hadpredicted (Fig. 1). These differences in prey-capture ability suggestthat some within-guild structuring of niche space exists.
Parameters of wing morphology, such as low wing loading or lowaspect ratio, are related causally to the ability to sustain slow,manoeuvrable flight5, a prerequisite for consistently capturing preyclose to vegetation or a clutter screen. However, although the wingloading is nearly identical in M. emarginatus, M. mystacinus and M.daubentonii5 and they indeed showed similar flight and approachbehaviour in our experiments, their capture performance differedconsiderably. Therefore, we argue that this measured difference incapture success was caused mainly by differences in echolocation callparameters and related differences in echo-processing capabilities. Totest this hypothesis we compared the measured minimal capturedistances with a number of signal parameters.
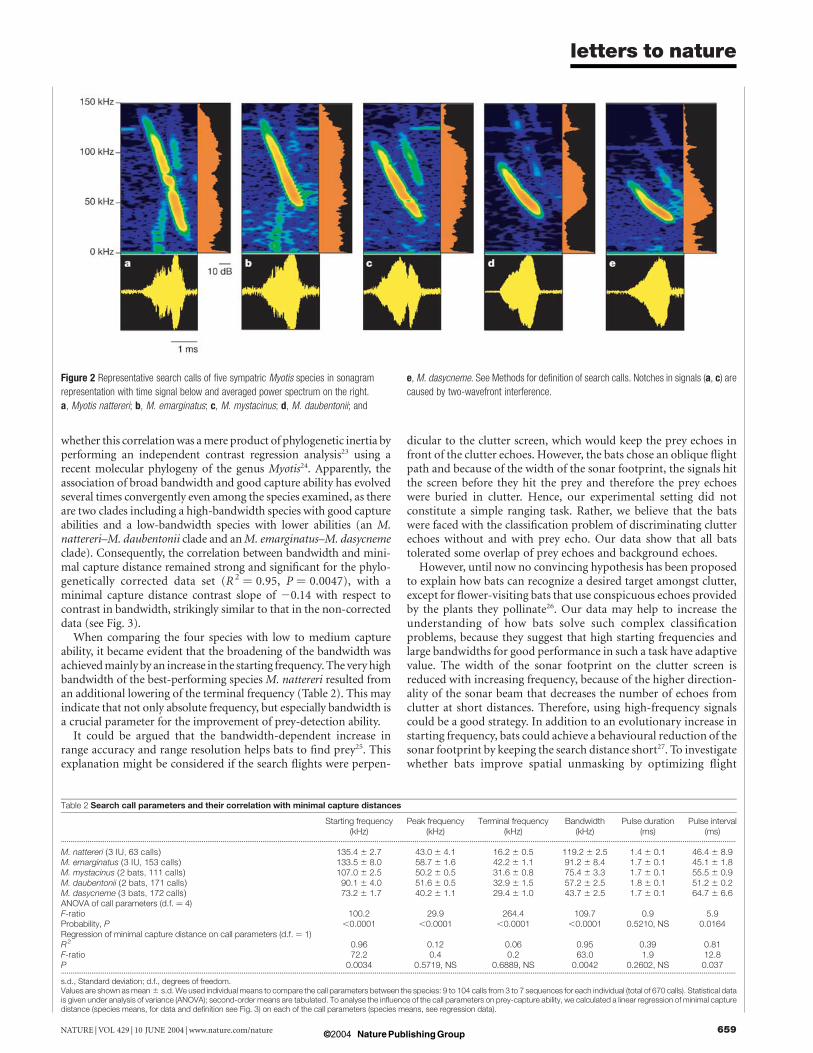
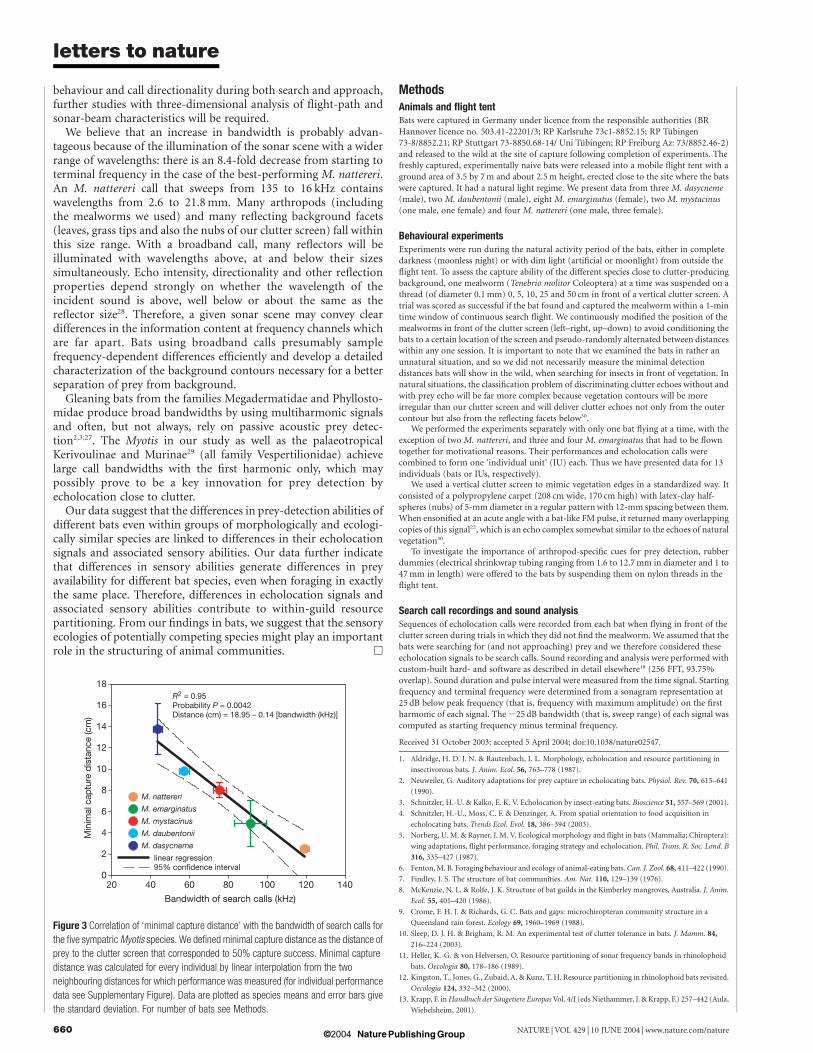
The search calls used in our standardized experimental situationwere steep broadband frequency-modulated (FM) signals andaveraged 1.4–1.8 ms in duration (Fig. 2). The first harmonic wasalways most prominent. Starting, peak and terminal frequency,bandwidth and pulse interval differed between the species, whereaspulse duration showed no significant differences between the fivecongeners (Table 2). Capture performance was unrelated to pulseduration, peak frequency or terminal frequency (Table 2). Specieswith higher starting frequencies and bandwidths and shorter pulseintervals were able to capture prey closer to clutter than those withlower starting frequencies and bandwidths and higher pulse inter-vals (Table 2, Fig. 3). We qualitatively and quantitatively corroboratedthe link between bandwidth and performance by building a successfullogistic model (see Supplementary Methods) with the individualperformance data (see Supplementary Figure). We further examined
Figure 1 The capture performance of bats from five sympatric Myotis species searching
for prey offered at different distances from a clutter screen that mimicked a vegetation
edge. Species’ abilities differed at distances of 5 and 10 cm (see Table 1 for statistics). For
this graph, individual performances were pooled for each species (for individual
performance data see Supplementary Figure). Trials per species per distance of 0, 5, 10,
25 and 50 cm are given below the species names (parentheses enclose trials per
individual). We performed a total of 569 trials.
Table 1 Capture performance comparison for five sympatric Myotis species
Distance of prey from theclutter screen (cm)
Species M. emarginatus M. mystacinus M. daubentonii M. dasycneme
...................................................................................................................................................................................................................................................................................................................................................................
5 M. nattereri *** *** *** ***
M. emarginatus NS ** **M. mystacinus (*) (*)M. daubentonii NS
10 M. nattereri NS (*) * ***M. emarginatus (*) * ***M. mystacinus NS (*)M. daubentonii NS
...................................................................................................................................................................................................................................................................................................................................................................
NS, not significant (probability P . 0.05); (*), significance lost when Bonferroni correction is applied; *, P , 0.05; **, P , 0.01; ***, P , 0.001.For each pair-wise comparison, all successful and unsuccessful trials of the two species were cross-tabulated and subjected to x2 test (degrees of freedom, 1). TheP values tabulated here are Bonferroni-corrected to account for the multiple comparisons (ten comparisons per distance gives P values £ 10).
letters to nature
NATURE | VOL 429 | 10 JUNE 2004 | www.nature.com/nature658 © 2004 Nature Publishing Group
whether this correlation was a mere product of phylogenetic inertia byperforming an independent contrast regression analysis23 using arecent molecular phylogeny of the genus Myotis24. Apparently, theassociation of broad bandwidth and good capture ability has evolvedseveral times convergently even among the species examined, as thereare two clades including a high-bandwidth species with good captureabilities and a low-bandwidth species with lower abilities (an M.nattereri–M. daubentonii clade and anM. emarginatus–M. dasycnemeclade). Consequently, the correlation between bandwidth and mini-mal capture distance remained strong and significant for the phylo-genetically corrected data set (R 2 ¼ 0.95, P ¼ 0.0047), with aminimal capture distance contrast slope of 20.14 with respect tocontrast in bandwidth, strikingly similar to that in the non-correcteddata (see Fig. 3).
When comparing the four species with low to medium captureability, it became evident that the broadening of the bandwidth wasachieved mainly by an increase in the starting frequency. The very highbandwidth of the best-performing species M. nattereri resulted froman additional lowering of the terminal frequency (Table 2). This mayindicate that not only absolute frequency, but especially bandwidth isa crucial parameter for the improvement of prey-detection ability.
It could be argued that the bandwidth-dependent increase inrange accuracy and range resolution helps bats to find prey25. Thisexplanation might be considered if the search flights were perpen-
dicular to the clutter screen, which would keep the prey echoes infront of the clutter echoes. However, the bats chose an oblique flightpath and because of the width of the sonar footprint, the signals hitthe screen before they hit the prey and therefore the prey echoeswere buried in clutter. Hence, our experimental setting did notconstitute a simple ranging task. Rather, we believe that the batswere faced with the classification problem of discriminating clutterechoes without and with prey echo. Our data show that all batstolerated some overlap of prey echoes and background echoes.
However, until now no convincing hypothesis has been proposedto explain how bats can recognize a desired target amongst clutter,except for flower-visiting bats that use conspicuous echoes providedby the plants they pollinate26. Our data may help to increase theunderstanding of how bats solve such complex classificationproblems, because they suggest that high starting frequencies andlarge bandwidths for good performance in such a task have adaptivevalue. The width of the sonar footprint on the clutter screen isreduced with increasing frequency, because of the higher direction-ality of the sonar beam that decreases the number of echoes fromclutter at short distances. Therefore, using high-frequency signalscould be a good strategy. In addition to an evolutionary increase instarting frequency, bats could achieve a behavioural reduction of thesonar footprint by keeping the search distance short27. To investigatewhether bats improve spatial unmasking by optimizing flight
Figure 2 Representative search calls of five sympatric Myotis species in sonagram
representation with time signal below and averaged power spectrum on the right.
a, Myotis nattereri; b, M. emarginatus; c, M. mystacinus; d, M. daubentonii; and
e, M. dasycneme. See Methods for definition of search calls. Notches in signals (a, c) are
caused by two-wavefront interference.
Table 2 Search call parameters and their correlation with minimal capture distances
Starting frequency(kHz)
Peak frequency(kHz)
Terminal frequency(kHz)
Bandwidth(kHz)
Pulse duration(ms)
Pulse interval(ms)
...................................................................................................................................................................................................................................................................................................................................................................
M. nattereri (3 IU, 63 calls) 135.4 ^ 2.7 43.0 ^ 4.1 16.2 ^ 0.5 119.2 ^ 2.5 1.4 ^ 0.1 46.4 ^ 8.9M. emarginatus (3 IU, 153 calls) 133.5 ^ 8.0 58.7 ^ 1.6 42.2 ^ 1.1 91.2 ^ 8.4 1.7 ^ 0.1 45.1 ^ 1.8M. mystacinus (2 bats, 111 calls) 107.0 ^ 2.5 50.2 ^ 0.5 31.6 ^ 0.8 75.4 ^ 3.3 1.7 ^ 0.1 55.5 ^ 0.9M. daubentonii (2 bats, 171 calls) 90.1 ^ 4.0 51.6 ^ 0.5 32.9 ^ 1.5 57.2 ^ 2.5 1.8 ^ 0.1 51.2 ^ 0.2M. dasycneme (3 bats, 172 calls) 73.2 ^ 1.7 40.2 ^ 1.1 29.4 ^ 1.0 43.7 ^ 2.5 1.7 ^ 0.1 64.7 ^ 6.6ANOVA of call parameters (d.f. ¼ 4)F-ratio 100.2 29.9 264.4 109.7 0.9 5.9Probability, P ,0.0001 ,0.0001 ,0.0001 ,0.0001 0.5210, NS 0.0164Regression of minimal capture distance on call parameters (d.f. ¼ 1)R2 0.96 0.12 0.06 0.95 0.39 0.81F-ratio 72.2 0.4 0.2 63.0 1.9 12.8P 0.0034 0.5719, NS 0.6889, NS 0.0042 0.2602, NS 0.037...................................................................................................................................................................................................................................................................................................................................................................
s.d., Standard deviation; d.f., degrees of freedom.Values are shown as mean ^ s.d. We used individual means to compare the call parameters between the species: 9 to 104 calls from 3 to 7 sequences for each individual (total of 670 calls). Statistical datais given under analysis of variance (ANOVA); second-order means are tabulated. To analyse the influence of the call parameters on prey-capture ability, we calculated a linear regression of minimal capturedistance (species means, for data and definition see Fig. 3) on each of the call parameters (species means, see regression data).
letters to nature
NATURE | VOL 429 | 10 JUNE 2004 | www.nature.com/nature 659© 2004 Nature Publishing Group
behaviour and call directionality during both search and approach,further studies with three-dimensional analysis of flight-path andsonar-beam characteristics will be required.
We believe that an increase in bandwidth is probably advan-tageous because of the illumination of the sonar scene with a widerrange of wavelengths: there is an 8.4-fold decrease from starting toterminal frequency in the case of the best-performing M. nattereri.An M. nattereri call that sweeps from 135 to 16 kHz containswavelengths from 2.6 to 21.8 mm. Many arthropods (includingthe mealworms we used) and many reflecting background facets(leaves, grass tips and also the nubs of our clutter screen) fall withinthis size range. With a broadband call, many reflectors will beilluminated with wavelengths above, at and below their sizessimultaneously. Echo intensity, directionality and other reflectionproperties depend strongly on whether the wavelength of theincident sound is above, well below or about the same as thereflector size28. Therefore, a given sonar scene may convey cleardifferences in the information content at frequency channels whichare far apart. Bats using broadband calls presumably samplefrequency-dependent differences efficiently and develop a detailedcharacterization of the background contours necessary for a betterseparation of prey from background.
Gleaning bats from the families Megadermatidae and Phyllosto-midae produce broad bandwidths by using multiharmonic signalsand often, but not always, rely on passive acoustic prey detec-tion2,3,27. The Myotis in our study as well as the palaeotropicalKerivoulinae and Murinae29 (all family Vespertilionidae) achievelarge call bandwidths with the first harmonic only, which maypossibly prove to be a key innovation for prey detection byecholocation close to clutter.
Our data suggest that the differences in prey-detection abilities ofdifferent bats even within groups of morphologically and ecologi-cally similar species are linked to differences in their echolocationsignals and associated sensory abilities. Our data further indicatethat differences in sensory abilities generate differences in preyavailability for different bat species, even when foraging in exactlythe same place. Therefore, differences in echolocation signals andassociated sensory abilities contribute to within-guild resourcepartitioning. From our findings in bats, we suggest that the sensoryecologies of potentially competing species might play an importantrole in the structuring of animal communities. A
MethodsAnimals and flight tentBats were captured in Germany under licence from the responsible authorities (BRHannover licence no. 503.41-22201/3; RP Karlsruhe 73c1-8852.15; RP Tubingen73-8/8852.21; RP Stuttgart 73-8850.68-14/ Uni Tubingen; RP Freiburg Az: 73/8852.46-2)and released to the wild at the site of capture following completion of experiments. Thefreshly captured, experimentally naive bats were released into a mobile flight tent with aground area of 3.5 by 7 m and about 2.5 m height, erected close to the site where the batswere captured. It had a natural light regime. We present data from three M. dasycneme(male), two M. daubentonii (male), eight M. emarginatus (female), two M. mystacinus(one male, one female) and four M. nattereri (one male, three female).
Behavioural experimentsExperiments were run during the natural activity period of the bats, either in completedarkness (moonless night) or with dim light (artificial or moonlight) from outside theflight tent. To assess the capture ability of the different species close to clutter-producingbackground, one mealworm (Tenebrio molitor Coleoptera) at a time was suspended on athread (of diameter 0.1 mm) 0, 5, 10, 25 and 50 cm in front of a vertical clutter screen. Atrial was scored as successful if the bat found and captured the mealworm within a 1-mintime window of continuous search flight. We continuously modified the position of themealworms in front of the clutter screen (left–right, up–down) to avoid conditioning thebats to a certain location of the screen and pseudo-randomly alternated between distanceswithin any one session. It is important to note that we examined the bats in rather anunnatural situation, and so we did not necessarily measure the minimal detectiondistances bats will show in the wild, when searching for insects in front of vegetation. Innatural situations, the classification problem of discriminating clutter echoes without andwith prey echo will be far more complex because vegetation contours will be moreirregular than our clutter screen and will deliver clutter echoes not only from the outercontour but also from the reflecting facets below30.
We performed the experiments separately with only one bat flying at a time, with theexception of two M. nattereri, and three and four M. emarginatus that had to be flowntogether for motivational reasons. Their performances and echolocation calls werecombined to form one ‘individual unit’ (IU) each. Thus we have presented data for 13individuals (bats or IUs, respectively).
We used a vertical clutter screen to mimic vegetation edges in a standardized way. Itconsisted of a polypropylene carpet (208 cm wide, 170 cm high) with latex-clay half-spheres (nubs) of 5-mm diameter in a regular pattern with 12-mm spacing between them.When ensonified at an acute angle with a bat-like FM pulse, it returned many overlappingcopies of this signal22, which is an echo complex somewhat similar to the echoes of naturalvegetation30.
To investigate the importance of arthropod-specific cues for prey detection, rubberdummies (electrical shrinkwrap tubing ranging from 1.6 to 12.7 mm in diameter and 1 to47 mm in length) were offered to the bats by suspending them on nylon threads in theflight tent.
Search call recordings and sound analysisSequences of echolocation calls were recorded from each bat when flying in front of theclutter screen during trials in which they did not find the mealworm. We assumed that thebats were searching for (and not approaching) prey and we therefore considered theseecholocation signals to be search calls. Sound recording and analysis were performed withcustom-built hard- and software as described in detail elsewhere18 (256 FFT, 93.75%overlap). Sound duration and pulse interval were measured from the time signal. Startingfrequency and terminal frequency were determined from a sonagram representation at25 dB below peak frequency (that is, frequency with maximum amplitude) on the firstharmonic of each signal. The 225 dB bandwidth (that is, sweep range) of each signal wascomputed as starting frequency minus terminal frequency.
Received 31 October 2003; accepted 5 April 2004; doi:10.1038/nature02547.
1. Aldridge, H. D. J. N. & Rautenbach, I. L. Morphology, echolocation and resource partitioning in
insectivorous bats. J. Anim. Ecol. 56, 763–778 (1987).
2. Neuweiler, G. Auditory adaptations for prey capture in echolocating bats. Physiol. Rev. 70, 615–641
(1990).
3. Schnitzler, H.-U. & Kalko, E. K. V. Echolocation by insect-eating bats. Bioscience 51, 557–569 (2001).
4. Schnitzler, H.-U., Moss, C. F. & Denzinger, A. From spatial orientation to food acquisition in
echolocating bats. Trends Ecol. Evol. 18, 386–394 (2003).
5. Norberg, U. M. & Rayner, J. M. V. Ecological morphology and flight in bats (Mammalia; Chiroptera):
wing adaptations, flight performance, foraging strategy and echolocation. Phil. Trans. R. Soc. Lond. B
316, 335–427 (1987).
6. Fenton, M. B. Foraging behaviour and ecology of animal-eating bats.Can. J. Zool. 68, 411–422 (1990).
7. Findley, J. S. The structure of bat communities. Am. Nat. 110, 129–139 (1976).
8. McKenzie, N. L. & Rolfe, J. K. Structure of bat guilds in the Kimberley mangroves, Australia. J. Anim.
Ecol. 55, 401–420 (1986).
9. Crome, F. H. J. & Richards, G. C. Bats and gaps: microchiropteran community structure in a
Queensland rain forest. Ecology 69, 1960–1969 (1988).
10. Sleep, D. J. H. & Brigham, R. M. An experimental test of clutter tolerance in bats. J. Mamm. 84,
216–224 (2003).
11. Heller, K.-G. & von Helversen, O. Resource partitioning of sonar frequency bands in rhinolophoid
bats. Oecologia 80, 178–186 (1989).
12. Kingston, T., Jones, G., Zubaid, A. & Kunz, T. H. Resource partitioning in rhinolophoid bats revisited.
Oecologia 124, 332–342 (2000).
13. Krapp, F. in Handbuch der Saugetiere Europas Vol. 4/I (eds Niethammer, J. & Krapp, F.) 257–442 (Aula,
Wiebelsheim, 2001).
Figure 3 Correlation of ‘minimal capture distance’ with the bandwidth of search calls for
the five sympatricMyotis species. We defined minimal capture distance as the distance of
prey to the clutter screen that corresponded to 50% capture success. Minimal capture
distance was calculated for every individual by linear interpolation from the two
neighbouring distances for which performance was measured (for individual performance
data see Supplementary Figure). Data are plotted as species means and error bars give
the standard deviation. For number of bats see Methods.
letters to nature
NATURE | VOL 429 | 10 JUNE 2004 | www.nature.com/nature660 © 2004 Nature Publishing Group
14. Jones, G. & Rayner, J. M. V. Flight performance, foraging tactics and echolocation in free-living
Daubenton’s bats Myotis daubentoni (Chiroptera: Vespertilionidae). J. Zool. 215, 113–132 (1988).
15. Krull, D., Schumm, A., Metzner, W. & Neuweiler, G. Foraging areas and foraging behavior in the
notch-eared bat, Myotis emarginatus (Vespertilionidae). Behav. Ecol. Sociobiol. 28, 247–253 (1991).
16. Schumm, A., Krull, D. & Neuweiler, G. Echolocation in the notch-eared bat, Myotis emarginatus.
Behav. Ecol. Sociobiol. 28, 255–261 (1991).
17. Britton, A. R. C., Jones, G., Rayner, J. M. V., Boonman, A. M. & Verboom, B. Flight performance,
echolocation and foraging behaviour in pond bats, Myotis dasycneme (Chiroptera: Vespertilionidae).
J. Zool. 241, 503–522 (1997).
18. Siemers, B. M. & Schnitzler, H.-U. Natterer’s bat (Myotis nattereri Kuhl, 1818) hawks for prey close to
vegetation using echolocation signals of very broad bandwidth. Behav. Ecol. Sociobiol. 47, 400–412
(2000).
19. Swift, S. M. & Racey, P. A. Gleaning as a foraging strategy in Natterer’s bat Myotis nattereri. Behav. Ecol.
Sociobiol. 52, 408–416 (2002).
20. Fenton, M. B. & Bogdanowicz, W. Relationships between external morphology and foraging
behaviour: bats in the genus Myotis. Can. J. Zool. 80, 1004–1013 (2002).
21. Arlettaz, R., Jones, G. & Racey, P. A. Effect of acoustic clutter on prey detection by bats. Nature 414,
742–745 (2001).
22. Siemers, B. M., Stilz, P. & Schnitzler, H.-U. The acoustic advantage of hunting at low heights above
water: behavioural experiments on the European ’trawling’ bats Myotis capaccinii, M. dasycneme and
M. daubentonii. J. Exp. Biol. 204, 3843–3854 (2001).
23. Harvey, P. H. & Pagel, M. D. The Comparative Method in Evolutionary Biology 138–162 (Oxford Univ.
Press, Oxford, 1991).
24. Ruedi, M. & Mayer, F. Molecular systematics of bats of the genus Myotis (Vespertilionidae) suggests
deterministic ecomorphological convergences. Mol. Phyl. Evol. 21, 436–448 (2001).
25. Simmons, J. A. & Stein, R. A. Acoustic imaging in bat sonar: Echolocation signals and the evolution of
echolocation. J. Comp. Physiol. A 135, 61–84 (1980).
26. von Helversen, O. & von Helversen, D. Acoustic guide in bat pollinated flower. Nature 398, 759–760
(1999).
27. Schmidt, S., Hanke, S. & Pillat, J. The role of echolocation in the hunting of terrestrial prey—new
evidence for an underestimated strategy in the gleaning bat, Megaderma lyra. J. Comp. Physiol. A 186,
975–988 (2000).
28. Morse, P. M. & Ingard, K. U. Theoretical Acoustics (Princeton Univ. Press, Princeton, 1986).
29. Kingston, T., Jones, G., Akbar, Z. & Kunz, T. H. Echolocation signal design in Kerivoulinae and
Murinae (Chiroptera: Vespertilionidae) from Malaysia. J. Zool. 249, 359–374 (1999).
30. Muller, R. & Kuc, R. Foliage echoes: A probe into the ecological acoustics of bat echolocation. J. Acoust.
Soc. Am. 108, 836–845 (2000).
Supplementary Information accompanies this paper on www.nature.com/nature.
Acknowledgements We thank all those who assisted with fieldwork. We also thank A. Boonman,
A. Denzinger, J. Ostwald, D. Menne, E. Muller, P. Pilz, M. Sanchez-Villagra and P. Stilz for
discussions, H. Harty for language assistance and B. Fenton for comments. Our research was
funded by the Deutsche Forschungsgemeinschaft (DFG) and a PhD scholarship by
Studienstiftung des deutschen Volkes to B.M.S.
Competing interests statement The authors declare that they have no competing financial
interests.
Correspondence and requests for materials should be addressed to B.M.S.
..............................................................
Metabolic network analysis ofthe causes and evolution ofenzyme dispensability in yeastBalazs Papp1,2, Csaba Pal1,3 & Laurence D. Hurst1
1Department of Biology and Biochemistry, University of Bath, BA2 7AY Bath,Somerset, UK2Collegium Budapest (Institute for Advanced Study) Szentharomsag utca 2,Budapest H-1014, Hungary3MTA, Ecology and Theoretical Biology Research Group, Eotvos LorandUniversity, Pazmany Peter Setany 1/C, Budapest H-1117, Hungary.............................................................................................................................................................................
Under laboratory conditions 80% of yeast genes seem not to beessential for viability1. This raises the question of what themechanistic basis for dispensability is, and whether it is theresult of selection for buffering or an incidental side product.Here we analyse these issues using an in silico fluxmodel2–5 of theyeastmetabolic network. Themodel correctly predicts the knock-out fitness effects in 88% of the genes studied4 and in vivo fluxes.
Dispensable genes might be important, but under conditions notyet examined in the laboratory. Our model indicates that this isthe dominant explanation for apparent dispensability, account-ing for 37–68% of dispensable genes, whereas 15–28% of themare compensated by a duplicate, and only 4–17% are buffered bymetabolic network flux reorganization. For over one-half of thosenot important under nutrient-rich conditions, we can predictconditions when they will be important. As expected, suchcondition-specific genes have a more restricted phylogeneticdistribution. Gene duplicates catalysing the same reaction arenot more common for indispensable reactions, suggesting thatthe reason for their retention is not to provide compensation.Instead their presence is better explained by selection for highenzymatic flux.
Although many single-gene deletions have negligible effects ongrowth rates under laboratory conditions1,6, the causes and evolu-tion of gene dispensability has remained a controversial issue7–9. Thecapacity of organisms to compensate mutations partly stems fromgene duplicates8, whereas alternative metabolic pathways might alsohave a role7,10–12. The one previous systematic analysis on a eukary-otic organism13 used a gene’s rate of evolution as a proxy fordispensability, a supposition now considered questionable14. Athird possibility, and one that has received relatively little attention,is that genes only seem to be non-essential, and that they haveimportant roles under environmental conditions yet to be repli-cated in the laboratory8,15.
To investigate the causes of gene dispensability, the metaboliccapabilities of the Saccharomyces cerevisiae network were calculatedusing flux balance analysis (FBA)16. The previously reconstructednetwork2,4 consists of 809 metabolites as nodes (including externalmetabolites), connected by 851 different biochemical reactions(including transport processes). The method first defines a solutionspace of fluxes of all metabolic reactions in the network that satisfythe governing constraints (that is, steady state of metabolites, fluxcapacity, direction of reactions, nutrients available in the environ-ments; see Methods). Next, the optimal use of the metabolicnetwork to produce major biosynthetic components for growthcan be found among all possible solutions using various optimiz-ation protocols3,4. The FBA and MOMA5 (minimization of meta-bolic adjustment) protocols enable us to predict the phenotypicbehaviour of nutritional changes and gene deletions, along with theconcomitant changes in flux distributions.
We start by asking how well the mathematical model predictsexperimentally measured fluxes, and the effects of gene deletions.We then use it to address the relative importance of the suggestedmechanisms for gene dispensability. Finally, we ask whether dis-pensability is a directly selected feature or a side consequence.
Owing to the availability of systematic knockout studies1 andsome experimentally measured fluxes under four different growthconditions17, we can directly test the predictive power of themathematical protocol. We initiated the model to mimic the growthconditions used in these experimental studies. The model correctlypredicts: (1) relative differences in flux values; (2) presence orabsence of fluxes in 91–95% of the cases; (3) the fitness effects of88% of single-gene deletions under nutrient-rich growth con-ditions4 (see Supplementary Tables S1–S3). Although the modelignores details of gene regulation, the predicted variations in theactivity of metabolic pathways across environments are consistentwith observations (Supplementary Tables S1 and S2; see also ref. 3).The method, although robust, is not perfect. Although the fre-quency of experimentally verified essential genes in the group ofgenes with zero predicted flux is low on rich medium, it is not zero(8.8% for genes with zero flux compared with 28.8% for the rest;x2 ¼ 18.54, P , 1024, 1 degree of freedom (d.f.)). The few essentialgenes in this group probably represent incomplete biochemicalknowledge, missing components from the biomass equation, orpleiotropic gene functions4.
letters to nature
NATURE | VOL 429 | 10 JUNE 2004 | www.nature.com/nature 661© 2004 Nature Publishing Group