Embed Size (px)
Citation preview

Ecological Carbon and Water Footprints What are they indicating and what is their
spectrum of policy usefulness
Alessandro Galli
(Global Footprint Network)
The goal of the
OPEN EU project is to help
transform the EU
economy to a
One Planet Economy by
2050
Building the evidence base
gt footprint family of indicators (carbon water ecological)
Building the applications
gt scenario modelling and policy analysis
Building the capacity and dissemination
gt network of decision-makers
The OPEN EU Project Aims and Phases
bull Ecological Carbon and Water Footprint definition and calculation
bull Strengths and weaknesses
bull Spectrum of policy usefulness
Objectives
Where do we start from
bull EU is home to nearly 11 of the world population from 1961 to 2007 population has increased by only 13
bull Per capita resource consumption of EU residents is 3 to 5 times higher than residents of developing countries (Giljum et al 2009a WWF 2010 Galli et al in press)
bull Extraction of natural resources stable in EU (past 20 years) but imports of raw materials and products significantly increased
bull From 1990 to 2000 more than 4000 kmsup2 of agricultural and pasture land were transformed into built-up land (EEA 2006)
Where do we start from
bull Each EU-27 citizen emitted on average 102 t of GHG emissions (in CO2-eq) in 2009 (EEA 2009)
bull Europe particularly WE is one of the largest virtual water importers in the world 152 Gm3yr (Chapagain and Hoekstra 2004)
bull EU residents use 20 of the worlds ecosystems supply of fibers food energy and waste absorption (WWF 2005) Such demand has risen by more than 70 since 1961 (WWF 2010 GFN 2010)
The need for a set of Indicators
bull Human societies and economies depend on the biospheres natural capital for many underpinning functions and for the provision of primary resources and life-supporting ecological services
bull Managing the biospherelsquos ecological assets is becoming a central issue for decision makers interested in securing human well-being while respecting our planetrsquos limits
bull Solving the sustainability challenge requires a new holistic approach enabling us to tackle multiple issues concurrently
bull Good governance now depends on natural resource accounting tools in addition to traditional indicators such as GDP and financial accounts
bull Ecological Footprint (Wackernagel amp Rees 1996)Def human pressure on the planet in terms of the aggregate
demand that resource-consumption and CO2
emissions places on ecological assets
bull Water Footprint (Hoekstra 2002)Def human appropriation of natural capital in terms of the
total freshwater volume required (blue green grey) for human consumption
bull Carbon Footprint (multiple authors ~2000 2008)Def human pressure on the planet in terms of the total GHG
emissions (associated with an activity or accumulated
over the life stages of a product) and human
contribution to climate change
The Indicators selected definition
RESEARCH QUESTION
How much of the biospherersquos regenerative capacity is directly and indirectly (ie embodied in trade) used by humans (namely Ecological Footprint) compared with how much is available (namely biocapacity) at both local and global scale
MAIN MESSAGE
To promote recognition of ecological limits and safeguard the ecosystemsrsquo preconditions (healthy forests clean waters clean air fertile soils biodiversity etc) and life-supporting services that enable the biosphere to support mankind in the long term
Ecological Footprint
Ecological Footprint
BiocapacityHow much bioproductive
area is available to us
Ecological FootprintHow much bioproductive area
do we demand
Ecological Footprint
Cropland
Fishing Grounds
Carbon Uptake land
Grazing Land
Forest
Built Area
Ecological Footprint
bull It is a FLOW INDICATOR but each individual flow is translated into the correspondent appropriation of bioproductive land area through a multi-step process
EQFYFY
PEF
NWhere
bull P is the amount of a product harvested or CO2 emitted
bull YN is the national average yield for the product P (or its carbon uptake capacity in cases where P is carbon dioxide)
bull YF and EQF are the yield and equivalence factors respectively for the land use type in question
Ecological Footprint
RESEARCH QUESTION
Human appropriation of natural capital in terms of the volume of freshwater required for human consumption
MAIN MESSAGE
The Water Footprint concept is primarily intended to illustrate the hidden links between human consumption and water use and between global trade and water resources management
Water Footprint
Water Footprint
Green water footprint
volume of rainwater evaporated
Blue water footprint
volume of surface or groundwater evaporated
Grey water footprint
volume of freshwater that is required to assimilate the load
of pollutants based on existing ambient water quality
standards
Water Footprint
total amount of water that is used to produce the goods and
services consumed by the inhabitants of the nation
two components
bull internal water footprint ndash inside the country
bull external water footprint ndash in other countries
National water footprint =
national water use
+ virtual water import
ndash virtual water export
Water Footprint
Direct water footprint Indirect water footprint
Green water footprint Green water footprint
Blue water footprint Blue water footprint
Grey water footprint Grey water footprint
Water
con
sum
ptio
nW
ater p
ollu
tion
Non-consumptive wateruse (return flow)
Water withdrawal
The traditional
statistics
on water use
[SOURCE Hoekstra 2008]
RESEARCH QUESTION
The total amount of greenhouse gas emissions (CO2 CH4 N2O HFC PFC and SF6) that are directly and indirectly caused by human activities or accumulated over the life stages of products
MAIN MESSAGE
The consumption-based perspective of the Carbon Footprint complements the production-based accounting approach taken by national greenhouse gas inventories (eg those considered by the Kyoto Protocol)
Carbon Footprint
Carbon Footprint
bull The six greenhouse gases identified by the Kyoto Protocol are included in the analysis
bull CO2 CH4 N2O HFC PFC and SF6
bull Results are expressed in kg CO2-e and are calculated by multiplying the actual mass of a gas with the global warming potential factor for this particular gas making the global warming effects of different GHGs comparable and additive
bull The prevailing method for national Carbon Footprint accounting is environmentally extended multi-regional input-output analysis (EE-MRIO)
Emissions from source territorial emissions
Emissions from products and services
consumption emissions
Carbon Footprint
Comparing the Indicators coverage
ECOLOGICAL FOOTPRINT CARBON FOOTPRINT WATER FOOTPRINT
bull Temporally explicit and multi-dimensional indicator that can be applied to single products cities regions nations and the whole biosphere
bull More than 200 countries for the period 1961-2007 are tracked (Ewing et al 2010)
bull It has a consumption-based point of view and thus considers trade
bull Multi-dimensional indicator that can be applied to products processes companies industry sectors individuals governments populations etc
bull 73 nations and 14 regions for the year 2001 only are tracked (Hertwich and Peters 2009)
bull It has a consumption-based point of view and thus considers trade
bull Geographically explicit and multi-dimensional indicator calculated for products organizations sectors individuals cities and nations
bull 140 nations for the period 1997-2001 (Chapagain and Hoekstra 2004)
bull It has a consumption-based approach and considers trade
Opting for a ldquoconsumer approachrdquo
bull The Ecological Carbon and Water Footprints emphasize the analysis of human demand from a consumer rather than a producer perspective
bull These indicators are not based on who produces a good or service but on the end-users that consume them
bull As the existing global environmental policy framework holds producers rather than final consumers responsible for human impact industrialized countries are pushed towards imposing increasingly strict regulation on environmentally pressure-intensive industries with the long term effect of outsourcing this production to transition economies where it may be carried out less eco-efficiently
Not everything that is consumed in the Westhellip
World toy imports
World toy exports
hellip is being produced in the West
ECOLOGICAL FOOTPRINT CARBON FOOTPRINT WATER FOOTPRINT
bull Allows benchmarking human demand with nature supply and determining clear targets
bull It provides a holistic assessment of multiple anthropogenic pressures
bull Easy to communicate and understand with a strong conservation message
bull It allows for a comprehensive assessment of human contribution to GHG emissions
bull It is consistent with standards of economic and environmental accounting
bull Represents the spatial distribution of a countryrsquos water ldquodemandrdquo
bull Expands traditional measures of water withdrawal (green and grey waters also included)
bull Visualizes the link between (local) consumption and (global) appropriation of freshwater
bull Integrates water use and pollution over the production chain
Comparing the Indicators strengths
ECOLOGICAL FOOTPRINT CARBON FOOTPRINT WATER FOOTPRINT
bull Cannot cover all aspects of sustainability neither all environmental concerns especially those for which no regenerative capacity exists
bull Shows pressures that could lead to degradation of natural capital (eg reduced quality of land or reduced biodiversity) but does not predict this degradation
bull Not geographically explicit
bull Some underlying assumptions controversial but documented
bull Cannot track the full palette of human demands on the environment
bull Additional impact assessment models are needed to analyze the impact of climate change at both national and sub-national levels
bull Efforts needed to set up and update a system of MRIO tables and related environmental extensions
bull Only track human demands on freshwater
bull It relies on local data frequently unavailable andor hard to collect It suffers from possible truncation errors
bull No uncertainty studies are available though uncertainty can be significant
bull Grey water calculation heavily relies on assumptions and estimations
Comparing the Indicators weaknesses
ECOLOGICAL FOOTPRINT CARBON FOOTPRINT WATER FOOTPRINT
bull Measures overshoot and identifies the ecosystems under human-induced stress
bull Monitors societiesrsquo progresses towards minimum sustainability criteria (demand le supply)
bull Monitor the effectiveness of established resource use and resource efficiency policies
bull Allows analyzing the consequences of using alternative energies
bull Communicate environmental impacts of different life-styles to the overall public
bull Track pressure on biodiversitybull Illustrates the unequal distribution
of resource supply and use can be used for international policies aiming at implementing contraction and convergence principles
bull Offers an alternative angle for international policy on climate change as it complements the territorial-based approach used by the UNFCCC
bull Offers a better understanding of countriesrsquo responsibility and could facilitate international cooperation and partnerships between developing and developed countries
bull Can help design an international harmonized price for greenhouse gas emissions
bull Illustrates the unequal distribution of resource use and can be used to design international policies aiming at implementing contraction and convergence principles
bull Gives a new amp global dimension to the concept of water management amp governance
bull Offers nations a better understanding of their dependency on foreign water resources
bull Offers river basin authorities info on the extent to which scarce water resources are allocated to low-value export crops
bull Offers companies a way to monitor their dependence on scarce water resources alongside their supply-chain
bull Illustrates the unequal distribution of resource use and can be used to design international policies aiming at implementing contraction and convergence principles
Spectrum of Policy Usefulness

Where do we start from
bull Each EU-27 citizen emitted on average 102 t of GHG emissions (in CO2-eq) in 2009 (EEA 2009)
bull Europe particularly WE is one of the largest virtual water importers in the world 152 Gm3yr (Chapagain and Hoekstra 2004)
bull EU residents use 20 of the worlds ecosystems supply of fibers food energy and waste absorption (WWF 2005) Such demand has risen by more than 70 since 1961 (WWF 2010 GFN 2010)
The need for a set of Indicators
bull Human societies and economies depend on the biospheres natural capital for many underpinning functions and for the provision of primary resources and life-supporting ecological services
bull Managing the biospherelsquos ecological assets is becoming a central issue for decision makers interested in securing human well-being while respecting our planetrsquos limits
bull Solving the sustainability challenge requires a new holistic approach enabling us to tackle multiple issues concurrently
bull Good governance now depends on natural resource accounting tools in addition to traditional indicators such as GDP and financial accounts
bull Ecological Footprint (Wackernagel amp Rees 1996)Def human pressure on the planet in terms of the aggregate
demand that resource-consumption and CO2
emissions places on ecological assets
bull Water Footprint (Hoekstra 2002)Def human appropriation of natural capital in terms of the
total freshwater volume required (blue green grey) for human consumption
bull Carbon Footprint (multiple authors ~2000 2008)Def human pressure on the planet in terms of the total GHG
emissions (associated with an activity or accumulated
over the life stages of a product) and human
contribution to climate change
The Indicators selected definition
RESEARCH QUESTION
How much of the biospherersquos regenerative capacity is directly and indirectly (ie embodied in trade) used by humans (namely Ecological Footprint) compared with how much is available (namely biocapacity) at both local and global scale
MAIN MESSAGE
To promote recognition of ecological limits and safeguard the ecosystemsrsquo preconditions (healthy forests clean waters clean air fertile soils biodiversity etc) and life-supporting services that enable the biosphere to support mankind in the long term
Ecological Footprint
Ecological Footprint
BiocapacityHow much bioproductive
area is available to us
Ecological FootprintHow much bioproductive area
do we demand
Ecological Footprint
Cropland
Fishing Grounds
Carbon Uptake land
Grazing Land
Forest
Built Area
Ecological Footprint
bull It is a FLOW INDICATOR but each individual flow is translated into the correspondent appropriation of bioproductive land area through a multi-step process
EQFYFY
PEF
NWhere
bull P is the amount of a product harvested or CO2 emitted
bull YN is the national average yield for the product P (or its carbon uptake capacity in cases where P is carbon dioxide)
bull YF and EQF are the yield and equivalence factors respectively for the land use type in question
Ecological Footprint
RESEARCH QUESTION
Human appropriation of natural capital in terms of the volume of freshwater required for human consumption
MAIN MESSAGE
The Water Footprint concept is primarily intended to illustrate the hidden links between human consumption and water use and between global trade and water resources management
Water Footprint
Water Footprint
Green water footprint
volume of rainwater evaporated
Blue water footprint
volume of surface or groundwater evaporated
Grey water footprint
volume of freshwater that is required to assimilate the load
of pollutants based on existing ambient water quality
standards
Water Footprint
total amount of water that is used to produce the goods and
services consumed by the inhabitants of the nation
two components
bull internal water footprint ndash inside the country
bull external water footprint ndash in other countries
National water footprint =
national water use
+ virtual water import
ndash virtual water export
Water Footprint
Direct water footprint Indirect water footprint
Green water footprint Green water footprint
Blue water footprint Blue water footprint
Grey water footprint Grey water footprint
Water
con
sum
ptio
nW
ater p
ollu
tion
Non-consumptive wateruse (return flow)
Water withdrawal
The traditional
statistics
on water use
[SOURCE Hoekstra 2008]
RESEARCH QUESTION
The total amount of greenhouse gas emissions (CO2 CH4 N2O HFC PFC and SF6) that are directly and indirectly caused by human activities or accumulated over the life stages of products
MAIN MESSAGE
The consumption-based perspective of the Carbon Footprint complements the production-based accounting approach taken by national greenhouse gas inventories (eg those considered by the Kyoto Protocol)
Carbon Footprint
Carbon Footprint
bull The six greenhouse gases identified by the Kyoto Protocol are included in the analysis
bull CO2 CH4 N2O HFC PFC and SF6
bull Results are expressed in kg CO2-e and are calculated by multiplying the actual mass of a gas with the global warming potential factor for this particular gas making the global warming effects of different GHGs comparable and additive
bull The prevailing method for national Carbon Footprint accounting is environmentally extended multi-regional input-output analysis (EE-MRIO)
Emissions from source territorial emissions
Emissions from products and services
consumption emissions
Carbon Footprint
Comparing the Indicators coverage
ECOLOGICAL FOOTPRINT CARBON FOOTPRINT WATER FOOTPRINT
bull Temporally explicit and multi-dimensional indicator that can be applied to single products cities regions nations and the whole biosphere
bull More than 200 countries for the period 1961-2007 are tracked (Ewing et al 2010)
bull It has a consumption-based point of view and thus considers trade
bull Multi-dimensional indicator that can be applied to products processes companies industry sectors individuals governments populations etc
bull 73 nations and 14 regions for the year 2001 only are tracked (Hertwich and Peters 2009)
bull It has a consumption-based point of view and thus considers trade
bull Geographically explicit and multi-dimensional indicator calculated for products organizations sectors individuals cities and nations
bull 140 nations for the period 1997-2001 (Chapagain and Hoekstra 2004)
bull It has a consumption-based approach and considers trade
Opting for a ldquoconsumer approachrdquo
bull The Ecological Carbon and Water Footprints emphasize the analysis of human demand from a consumer rather than a producer perspective
bull These indicators are not based on who produces a good or service but on the end-users that consume them
bull As the existing global environmental policy framework holds producers rather than final consumers responsible for human impact industrialized countries are pushed towards imposing increasingly strict regulation on environmentally pressure-intensive industries with the long term effect of outsourcing this production to transition economies where it may be carried out less eco-efficiently
Not everything that is consumed in the Westhellip
World toy imports
World toy exports
hellip is being produced in the West
ECOLOGICAL FOOTPRINT CARBON FOOTPRINT WATER FOOTPRINT
bull Allows benchmarking human demand with nature supply and determining clear targets
bull It provides a holistic assessment of multiple anthropogenic pressures
bull Easy to communicate and understand with a strong conservation message
bull It allows for a comprehensive assessment of human contribution to GHG emissions
bull It is consistent with standards of economic and environmental accounting
bull Represents the spatial distribution of a countryrsquos water ldquodemandrdquo
bull Expands traditional measures of water withdrawal (green and grey waters also included)
bull Visualizes the link between (local) consumption and (global) appropriation of freshwater
bull Integrates water use and pollution over the production chain
Comparing the Indicators strengths
ECOLOGICAL FOOTPRINT CARBON FOOTPRINT WATER FOOTPRINT
bull Cannot cover all aspects of sustainability neither all environmental concerns especially those for which no regenerative capacity exists
bull Shows pressures that could lead to degradation of natural capital (eg reduced quality of land or reduced biodiversity) but does not predict this degradation
bull Not geographically explicit
bull Some underlying assumptions controversial but documented
bull Cannot track the full palette of human demands on the environment
bull Additional impact assessment models are needed to analyze the impact of climate change at both national and sub-national levels
bull Efforts needed to set up and update a system of MRIO tables and related environmental extensions
bull Only track human demands on freshwater
bull It relies on local data frequently unavailable andor hard to collect It suffers from possible truncation errors
bull No uncertainty studies are available though uncertainty can be significant
bull Grey water calculation heavily relies on assumptions and estimations
Comparing the Indicators weaknesses
ECOLOGICAL FOOTPRINT CARBON FOOTPRINT WATER FOOTPRINT
bull Measures overshoot and identifies the ecosystems under human-induced stress
bull Monitors societiesrsquo progresses towards minimum sustainability criteria (demand le supply)
bull Monitor the effectiveness of established resource use and resource efficiency policies
bull Allows analyzing the consequences of using alternative energies
bull Communicate environmental impacts of different life-styles to the overall public
bull Track pressure on biodiversitybull Illustrates the unequal distribution
of resource supply and use can be used for international policies aiming at implementing contraction and convergence principles
bull Offers an alternative angle for international policy on climate change as it complements the territorial-based approach used by the UNFCCC
bull Offers a better understanding of countriesrsquo responsibility and could facilitate international cooperation and partnerships between developing and developed countries
bull Can help design an international harmonized price for greenhouse gas emissions
bull Illustrates the unequal distribution of resource use and can be used to design international policies aiming at implementing contraction and convergence principles
bull Gives a new amp global dimension to the concept of water management amp governance
bull Offers nations a better understanding of their dependency on foreign water resources
bull Offers river basin authorities info on the extent to which scarce water resources are allocated to low-value export crops
bull Offers companies a way to monitor their dependence on scarce water resources alongside their supply-chain
bull Illustrates the unequal distribution of resource use and can be used to design international policies aiming at implementing contraction and convergence principles
Spectrum of Policy Usefulness

RESEARCH QUESTION
How much of the biospherersquos regenerative capacity is directly and indirectly (ie embodied in trade) used by humans (namely Ecological Footprint) compared with how much is available (namely biocapacity) at both local and global scale
MAIN MESSAGE
To promote recognition of ecological limits and safeguard the ecosystemsrsquo preconditions (healthy forests clean waters clean air fertile soils biodiversity etc) and life-supporting services that enable the biosphere to support mankind in the long term
Ecological Footprint
Ecological Footprint
BiocapacityHow much bioproductive
area is available to us
Ecological FootprintHow much bioproductive area
do we demand
Ecological Footprint
Cropland
Fishing Grounds
Carbon Uptake land
Grazing Land
Forest
Built Area
Ecological Footprint
bull It is a FLOW INDICATOR but each individual flow is translated into the correspondent appropriation of bioproductive land area through a multi-step process
EQFYFY
PEF
NWhere
bull P is the amount of a product harvested or CO2 emitted
bull YN is the national average yield for the product P (or its carbon uptake capacity in cases where P is carbon dioxide)
bull YF and EQF are the yield and equivalence factors respectively for the land use type in question
Ecological Footprint
RESEARCH QUESTION
Human appropriation of natural capital in terms of the volume of freshwater required for human consumption
MAIN MESSAGE
The Water Footprint concept is primarily intended to illustrate the hidden links between human consumption and water use and between global trade and water resources management
Water Footprint
Water Footprint
Green water footprint
volume of rainwater evaporated
Blue water footprint
volume of surface or groundwater evaporated
Grey water footprint
volume of freshwater that is required to assimilate the load
of pollutants based on existing ambient water quality
standards
Water Footprint
total amount of water that is used to produce the goods and
services consumed by the inhabitants of the nation
two components
bull internal water footprint ndash inside the country
bull external water footprint ndash in other countries
National water footprint =
national water use
+ virtual water import
ndash virtual water export
Water Footprint
Direct water footprint Indirect water footprint
Green water footprint Green water footprint
Blue water footprint Blue water footprint
Grey water footprint Grey water footprint
Water
con
sum
ptio
nW
ater p
ollu
tion
Non-consumptive wateruse (return flow)
Water withdrawal
The traditional
statistics
on water use
[SOURCE Hoekstra 2008]
RESEARCH QUESTION
The total amount of greenhouse gas emissions (CO2 CH4 N2O HFC PFC and SF6) that are directly and indirectly caused by human activities or accumulated over the life stages of products
MAIN MESSAGE
The consumption-based perspective of the Carbon Footprint complements the production-based accounting approach taken by national greenhouse gas inventories (eg those considered by the Kyoto Protocol)
Carbon Footprint
Carbon Footprint
bull The six greenhouse gases identified by the Kyoto Protocol are included in the analysis
bull CO2 CH4 N2O HFC PFC and SF6
bull Results are expressed in kg CO2-e and are calculated by multiplying the actual mass of a gas with the global warming potential factor for this particular gas making the global warming effects of different GHGs comparable and additive
bull The prevailing method for national Carbon Footprint accounting is environmentally extended multi-regional input-output analysis (EE-MRIO)
Emissions from source territorial emissions
Emissions from products and services
consumption emissions
Carbon Footprint
Comparing the Indicators coverage
ECOLOGICAL FOOTPRINT CARBON FOOTPRINT WATER FOOTPRINT
bull Temporally explicit and multi-dimensional indicator that can be applied to single products cities regions nations and the whole biosphere
bull More than 200 countries for the period 1961-2007 are tracked (Ewing et al 2010)
bull It has a consumption-based point of view and thus considers trade
bull Multi-dimensional indicator that can be applied to products processes companies industry sectors individuals governments populations etc
bull 73 nations and 14 regions for the year 2001 only are tracked (Hertwich and Peters 2009)
bull It has a consumption-based point of view and thus considers trade
bull Geographically explicit and multi-dimensional indicator calculated for products organizations sectors individuals cities and nations
bull 140 nations for the period 1997-2001 (Chapagain and Hoekstra 2004)
bull It has a consumption-based approach and considers trade
Opting for a ldquoconsumer approachrdquo
bull The Ecological Carbon and Water Footprints emphasize the analysis of human demand from a consumer rather than a producer perspective
bull These indicators are not based on who produces a good or service but on the end-users that consume them
bull As the existing global environmental policy framework holds producers rather than final consumers responsible for human impact industrialized countries are pushed towards imposing increasingly strict regulation on environmentally pressure-intensive industries with the long term effect of outsourcing this production to transition economies where it may be carried out less eco-efficiently
Not everything that is consumed in the Westhellip
World toy imports
World toy exports
hellip is being produced in the West
ECOLOGICAL FOOTPRINT CARBON FOOTPRINT WATER FOOTPRINT
bull Allows benchmarking human demand with nature supply and determining clear targets
bull It provides a holistic assessment of multiple anthropogenic pressures
bull Easy to communicate and understand with a strong conservation message
bull It allows for a comprehensive assessment of human contribution to GHG emissions
bull It is consistent with standards of economic and environmental accounting
bull Represents the spatial distribution of a countryrsquos water ldquodemandrdquo
bull Expands traditional measures of water withdrawal (green and grey waters also included)
bull Visualizes the link between (local) consumption and (global) appropriation of freshwater
bull Integrates water use and pollution over the production chain
Comparing the Indicators strengths
ECOLOGICAL FOOTPRINT CARBON FOOTPRINT WATER FOOTPRINT
bull Cannot cover all aspects of sustainability neither all environmental concerns especially those for which no regenerative capacity exists
bull Shows pressures that could lead to degradation of natural capital (eg reduced quality of land or reduced biodiversity) but does not predict this degradation
bull Not geographically explicit
bull Some underlying assumptions controversial but documented
bull Cannot track the full palette of human demands on the environment
bull Additional impact assessment models are needed to analyze the impact of climate change at both national and sub-national levels
bull Efforts needed to set up and update a system of MRIO tables and related environmental extensions
bull Only track human demands on freshwater
bull It relies on local data frequently unavailable andor hard to collect It suffers from possible truncation errors
bull No uncertainty studies are available though uncertainty can be significant
bull Grey water calculation heavily relies on assumptions and estimations
Comparing the Indicators weaknesses
ECOLOGICAL FOOTPRINT CARBON FOOTPRINT WATER FOOTPRINT
bull Measures overshoot and identifies the ecosystems under human-induced stress
bull Monitors societiesrsquo progresses towards minimum sustainability criteria (demand le supply)
bull Monitor the effectiveness of established resource use and resource efficiency policies
bull Allows analyzing the consequences of using alternative energies
bull Communicate environmental impacts of different life-styles to the overall public
bull Track pressure on biodiversitybull Illustrates the unequal distribution
of resource supply and use can be used for international policies aiming at implementing contraction and convergence principles
bull Offers an alternative angle for international policy on climate change as it complements the territorial-based approach used by the UNFCCC
bull Offers a better understanding of countriesrsquo responsibility and could facilitate international cooperation and partnerships between developing and developed countries
bull Can help design an international harmonized price for greenhouse gas emissions
bull Illustrates the unequal distribution of resource use and can be used to design international policies aiming at implementing contraction and convergence principles
bull Gives a new amp global dimension to the concept of water management amp governance
bull Offers nations a better understanding of their dependency on foreign water resources
bull Offers river basin authorities info on the extent to which scarce water resources are allocated to low-value export crops
bull Offers companies a way to monitor their dependence on scarce water resources alongside their supply-chain
bull Illustrates the unequal distribution of resource use and can be used to design international policies aiming at implementing contraction and convergence principles
Spectrum of Policy Usefulness

Ecological Footprint
RESEARCH QUESTION
Human appropriation of natural capital in terms of the volume of freshwater required for human consumption
MAIN MESSAGE
The Water Footprint concept is primarily intended to illustrate the hidden links between human consumption and water use and between global trade and water resources management
Water Footprint
Water Footprint
Green water footprint
volume of rainwater evaporated
Blue water footprint
volume of surface or groundwater evaporated
Grey water footprint
volume of freshwater that is required to assimilate the load
of pollutants based on existing ambient water quality
standards
Water Footprint
total amount of water that is used to produce the goods and
services consumed by the inhabitants of the nation
two components
bull internal water footprint ndash inside the country
bull external water footprint ndash in other countries
National water footprint =
national water use
+ virtual water import
ndash virtual water export
Water Footprint
Direct water footprint Indirect water footprint
Green water footprint Green water footprint
Blue water footprint Blue water footprint
Grey water footprint Grey water footprint
Water
con
sum
ptio
nW
ater p
ollu
tion
Non-consumptive wateruse (return flow)
Water withdrawal
The traditional
statistics
on water use
[SOURCE Hoekstra 2008]
RESEARCH QUESTION
The total amount of greenhouse gas emissions (CO2 CH4 N2O HFC PFC and SF6) that are directly and indirectly caused by human activities or accumulated over the life stages of products
MAIN MESSAGE
The consumption-based perspective of the Carbon Footprint complements the production-based accounting approach taken by national greenhouse gas inventories (eg those considered by the Kyoto Protocol)
Carbon Footprint
Carbon Footprint
bull The six greenhouse gases identified by the Kyoto Protocol are included in the analysis
bull CO2 CH4 N2O HFC PFC and SF6
bull Results are expressed in kg CO2-e and are calculated by multiplying the actual mass of a gas with the global warming potential factor for this particular gas making the global warming effects of different GHGs comparable and additive
bull The prevailing method for national Carbon Footprint accounting is environmentally extended multi-regional input-output analysis (EE-MRIO)
Emissions from source territorial emissions
Emissions from products and services
consumption emissions
Carbon Footprint
Comparing the Indicators coverage
ECOLOGICAL FOOTPRINT CARBON FOOTPRINT WATER FOOTPRINT
bull Temporally explicit and multi-dimensional indicator that can be applied to single products cities regions nations and the whole biosphere
bull More than 200 countries for the period 1961-2007 are tracked (Ewing et al 2010)
bull It has a consumption-based point of view and thus considers trade
bull Multi-dimensional indicator that can be applied to products processes companies industry sectors individuals governments populations etc
bull 73 nations and 14 regions for the year 2001 only are tracked (Hertwich and Peters 2009)
bull It has a consumption-based point of view and thus considers trade
bull Geographically explicit and multi-dimensional indicator calculated for products organizations sectors individuals cities and nations
bull 140 nations for the period 1997-2001 (Chapagain and Hoekstra 2004)
bull It has a consumption-based approach and considers trade
Opting for a ldquoconsumer approachrdquo
bull The Ecological Carbon and Water Footprints emphasize the analysis of human demand from a consumer rather than a producer perspective
bull These indicators are not based on who produces a good or service but on the end-users that consume them
bull As the existing global environmental policy framework holds producers rather than final consumers responsible for human impact industrialized countries are pushed towards imposing increasingly strict regulation on environmentally pressure-intensive industries with the long term effect of outsourcing this production to transition economies where it may be carried out less eco-efficiently
Not everything that is consumed in the Westhellip
World toy imports
World toy exports
hellip is being produced in the West
ECOLOGICAL FOOTPRINT CARBON FOOTPRINT WATER FOOTPRINT
bull Allows benchmarking human demand with nature supply and determining clear targets
bull It provides a holistic assessment of multiple anthropogenic pressures
bull Easy to communicate and understand with a strong conservation message
bull It allows for a comprehensive assessment of human contribution to GHG emissions
bull It is consistent with standards of economic and environmental accounting
bull Represents the spatial distribution of a countryrsquos water ldquodemandrdquo
bull Expands traditional measures of water withdrawal (green and grey waters also included)
bull Visualizes the link between (local) consumption and (global) appropriation of freshwater
bull Integrates water use and pollution over the production chain
Comparing the Indicators strengths
ECOLOGICAL FOOTPRINT CARBON FOOTPRINT WATER FOOTPRINT
bull Cannot cover all aspects of sustainability neither all environmental concerns especially those for which no regenerative capacity exists
bull Shows pressures that could lead to degradation of natural capital (eg reduced quality of land or reduced biodiversity) but does not predict this degradation
bull Not geographically explicit
bull Some underlying assumptions controversial but documented
bull Cannot track the full palette of human demands on the environment
bull Additional impact assessment models are needed to analyze the impact of climate change at both national and sub-national levels
bull Efforts needed to set up and update a system of MRIO tables and related environmental extensions
bull Only track human demands on freshwater
bull It relies on local data frequently unavailable andor hard to collect It suffers from possible truncation errors
bull No uncertainty studies are available though uncertainty can be significant
bull Grey water calculation heavily relies on assumptions and estimations
Comparing the Indicators weaknesses
ECOLOGICAL FOOTPRINT CARBON FOOTPRINT WATER FOOTPRINT
bull Measures overshoot and identifies the ecosystems under human-induced stress
bull Monitors societiesrsquo progresses towards minimum sustainability criteria (demand le supply)
bull Monitor the effectiveness of established resource use and resource efficiency policies
bull Allows analyzing the consequences of using alternative energies
bull Communicate environmental impacts of different life-styles to the overall public
bull Track pressure on biodiversitybull Illustrates the unequal distribution
of resource supply and use can be used for international policies aiming at implementing contraction and convergence principles
bull Offers an alternative angle for international policy on climate change as it complements the territorial-based approach used by the UNFCCC
bull Offers a better understanding of countriesrsquo responsibility and could facilitate international cooperation and partnerships between developing and developed countries
bull Can help design an international harmonized price for greenhouse gas emissions
bull Illustrates the unequal distribution of resource use and can be used to design international policies aiming at implementing contraction and convergence principles
bull Gives a new amp global dimension to the concept of water management amp governance
bull Offers nations a better understanding of their dependency on foreign water resources
bull Offers river basin authorities info on the extent to which scarce water resources are allocated to low-value export crops
bull Offers companies a way to monitor their dependence on scarce water resources alongside their supply-chain
bull Illustrates the unequal distribution of resource use and can be used to design international policies aiming at implementing contraction and convergence principles
Spectrum of Policy Usefulness

RESEARCH QUESTION
Human appropriation of natural capital in terms of the volume of freshwater required for human consumption
MAIN MESSAGE
The Water Footprint concept is primarily intended to illustrate the hidden links between human consumption and water use and between global trade and water resources management
Water Footprint
Water Footprint
Green water footprint
volume of rainwater evaporated
Blue water footprint
volume of surface or groundwater evaporated
Grey water footprint
volume of freshwater that is required to assimilate the load
of pollutants based on existing ambient water quality
standards
Water Footprint
total amount of water that is used to produce the goods and
services consumed by the inhabitants of the nation
two components
bull internal water footprint ndash inside the country
bull external water footprint ndash in other countries
National water footprint =
national water use
+ virtual water import
ndash virtual water export
Water Footprint
Direct water footprint Indirect water footprint
Green water footprint Green water footprint
Blue water footprint Blue water footprint
Grey water footprint Grey water footprint
Water
con
sum
ptio
nW
ater p
ollu
tion
Non-consumptive wateruse (return flow)
Water withdrawal
The traditional
statistics
on water use
[SOURCE Hoekstra 2008]
RESEARCH QUESTION
The total amount of greenhouse gas emissions (CO2 CH4 N2O HFC PFC and SF6) that are directly and indirectly caused by human activities or accumulated over the life stages of products
MAIN MESSAGE
The consumption-based perspective of the Carbon Footprint complements the production-based accounting approach taken by national greenhouse gas inventories (eg those considered by the Kyoto Protocol)
Carbon Footprint
Carbon Footprint
bull The six greenhouse gases identified by the Kyoto Protocol are included in the analysis
bull CO2 CH4 N2O HFC PFC and SF6
bull Results are expressed in kg CO2-e and are calculated by multiplying the actual mass of a gas with the global warming potential factor for this particular gas making the global warming effects of different GHGs comparable and additive
bull The prevailing method for national Carbon Footprint accounting is environmentally extended multi-regional input-output analysis (EE-MRIO)
Emissions from source territorial emissions
Emissions from products and services
consumption emissions
Carbon Footprint
Comparing the Indicators coverage
ECOLOGICAL FOOTPRINT CARBON FOOTPRINT WATER FOOTPRINT
bull Temporally explicit and multi-dimensional indicator that can be applied to single products cities regions nations and the whole biosphere
bull More than 200 countries for the period 1961-2007 are tracked (Ewing et al 2010)
bull It has a consumption-based point of view and thus considers trade
bull Multi-dimensional indicator that can be applied to products processes companies industry sectors individuals governments populations etc
bull 73 nations and 14 regions for the year 2001 only are tracked (Hertwich and Peters 2009)
bull It has a consumption-based point of view and thus considers trade
bull Geographically explicit and multi-dimensional indicator calculated for products organizations sectors individuals cities and nations
bull 140 nations for the period 1997-2001 (Chapagain and Hoekstra 2004)
bull It has a consumption-based approach and considers trade
Opting for a ldquoconsumer approachrdquo
bull The Ecological Carbon and Water Footprints emphasize the analysis of human demand from a consumer rather than a producer perspective
bull These indicators are not based on who produces a good or service but on the end-users that consume them
bull As the existing global environmental policy framework holds producers rather than final consumers responsible for human impact industrialized countries are pushed towards imposing increasingly strict regulation on environmentally pressure-intensive industries with the long term effect of outsourcing this production to transition economies where it may be carried out less eco-efficiently
Not everything that is consumed in the Westhellip
World toy imports
World toy exports
hellip is being produced in the West
ECOLOGICAL FOOTPRINT CARBON FOOTPRINT WATER FOOTPRINT
bull Allows benchmarking human demand with nature supply and determining clear targets
bull It provides a holistic assessment of multiple anthropogenic pressures
bull Easy to communicate and understand with a strong conservation message
bull It allows for a comprehensive assessment of human contribution to GHG emissions
bull It is consistent with standards of economic and environmental accounting
bull Represents the spatial distribution of a countryrsquos water ldquodemandrdquo
bull Expands traditional measures of water withdrawal (green and grey waters also included)
bull Visualizes the link between (local) consumption and (global) appropriation of freshwater
bull Integrates water use and pollution over the production chain
Comparing the Indicators strengths
ECOLOGICAL FOOTPRINT CARBON FOOTPRINT WATER FOOTPRINT
bull Cannot cover all aspects of sustainability neither all environmental concerns especially those for which no regenerative capacity exists
bull Shows pressures that could lead to degradation of natural capital (eg reduced quality of land or reduced biodiversity) but does not predict this degradation
bull Not geographically explicit
bull Some underlying assumptions controversial but documented
bull Cannot track the full palette of human demands on the environment
bull Additional impact assessment models are needed to analyze the impact of climate change at both national and sub-national levels
bull Efforts needed to set up and update a system of MRIO tables and related environmental extensions
bull Only track human demands on freshwater
bull It relies on local data frequently unavailable andor hard to collect It suffers from possible truncation errors
bull No uncertainty studies are available though uncertainty can be significant
bull Grey water calculation heavily relies on assumptions and estimations
Comparing the Indicators weaknesses
ECOLOGICAL FOOTPRINT CARBON FOOTPRINT WATER FOOTPRINT
bull Measures overshoot and identifies the ecosystems under human-induced stress
bull Monitors societiesrsquo progresses towards minimum sustainability criteria (demand le supply)
bull Monitor the effectiveness of established resource use and resource efficiency policies
bull Allows analyzing the consequences of using alternative energies
bull Communicate environmental impacts of different life-styles to the overall public
bull Track pressure on biodiversitybull Illustrates the unequal distribution
of resource supply and use can be used for international policies aiming at implementing contraction and convergence principles
bull Offers an alternative angle for international policy on climate change as it complements the territorial-based approach used by the UNFCCC
bull Offers a better understanding of countriesrsquo responsibility and could facilitate international cooperation and partnerships between developing and developed countries
bull Can help design an international harmonized price for greenhouse gas emissions
bull Illustrates the unequal distribution of resource use and can be used to design international policies aiming at implementing contraction and convergence principles
bull Gives a new amp global dimension to the concept of water management amp governance
bull Offers nations a better understanding of their dependency on foreign water resources
bull Offers river basin authorities info on the extent to which scarce water resources are allocated to low-value export crops
bull Offers companies a way to monitor their dependence on scarce water resources alongside their supply-chain
bull Illustrates the unequal distribution of resource use and can be used to design international policies aiming at implementing contraction and convergence principles
Spectrum of Policy Usefulness
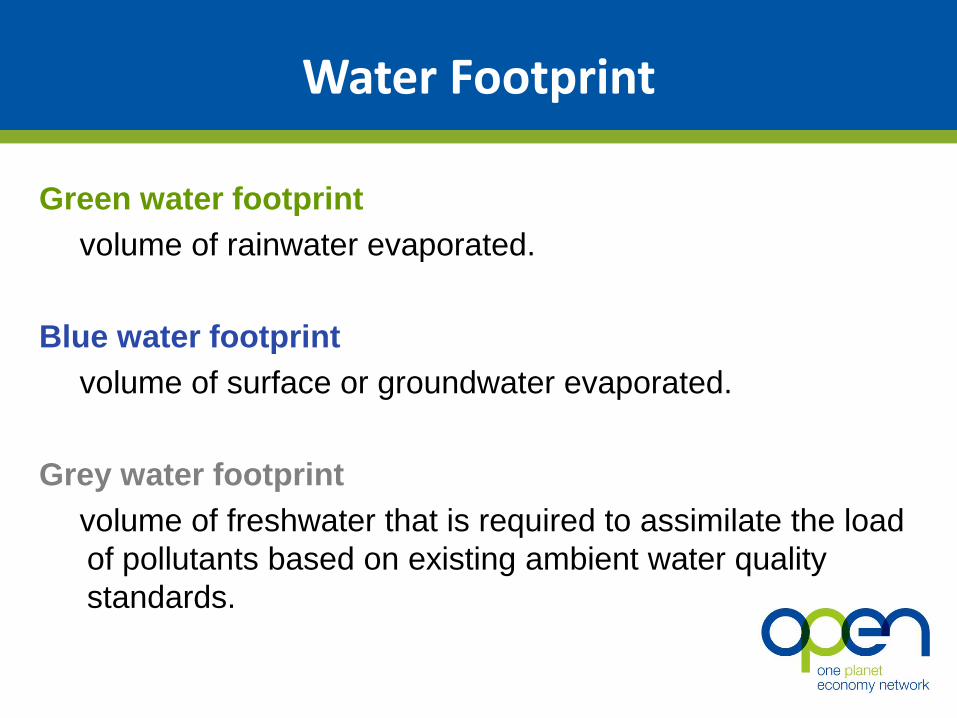
Water Footprint
Direct water footprint Indirect water footprint
Green water footprint Green water footprint
Blue water footprint Blue water footprint
Grey water footprint Grey water footprint
Water
con
sum
ptio
nW
ater p
ollu
tion
Non-consumptive wateruse (return flow)
Water withdrawal
The traditional
statistics
on water use
[SOURCE Hoekstra 2008]
RESEARCH QUESTION
The total amount of greenhouse gas emissions (CO2 CH4 N2O HFC PFC and SF6) that are directly and indirectly caused by human activities or accumulated over the life stages of products
MAIN MESSAGE
The consumption-based perspective of the Carbon Footprint complements the production-based accounting approach taken by national greenhouse gas inventories (eg those considered by the Kyoto Protocol)
Carbon Footprint
Carbon Footprint
bull The six greenhouse gases identified by the Kyoto Protocol are included in the analysis
bull CO2 CH4 N2O HFC PFC and SF6
bull Results are expressed in kg CO2-e and are calculated by multiplying the actual mass of a gas with the global warming potential factor for this particular gas making the global warming effects of different GHGs comparable and additive
bull The prevailing method for national Carbon Footprint accounting is environmentally extended multi-regional input-output analysis (EE-MRIO)
Emissions from source territorial emissions
Emissions from products and services
consumption emissions
Carbon Footprint
Comparing the Indicators coverage
ECOLOGICAL FOOTPRINT CARBON FOOTPRINT WATER FOOTPRINT
bull Temporally explicit and multi-dimensional indicator that can be applied to single products cities regions nations and the whole biosphere
bull More than 200 countries for the period 1961-2007 are tracked (Ewing et al 2010)
bull It has a consumption-based point of view and thus considers trade
bull Multi-dimensional indicator that can be applied to products processes companies industry sectors individuals governments populations etc
bull 73 nations and 14 regions for the year 2001 only are tracked (Hertwich and Peters 2009)
bull It has a consumption-based point of view and thus considers trade
bull Geographically explicit and multi-dimensional indicator calculated for products organizations sectors individuals cities and nations
bull 140 nations for the period 1997-2001 (Chapagain and Hoekstra 2004)
bull It has a consumption-based approach and considers trade
Opting for a ldquoconsumer approachrdquo
bull The Ecological Carbon and Water Footprints emphasize the analysis of human demand from a consumer rather than a producer perspective
bull These indicators are not based on who produces a good or service but on the end-users that consume them
bull As the existing global environmental policy framework holds producers rather than final consumers responsible for human impact industrialized countries are pushed towards imposing increasingly strict regulation on environmentally pressure-intensive industries with the long term effect of outsourcing this production to transition economies where it may be carried out less eco-efficiently
Not everything that is consumed in the Westhellip
World toy imports
World toy exports
hellip is being produced in the West
ECOLOGICAL FOOTPRINT CARBON FOOTPRINT WATER FOOTPRINT
bull Allows benchmarking human demand with nature supply and determining clear targets
bull It provides a holistic assessment of multiple anthropogenic pressures
bull Easy to communicate and understand with a strong conservation message
bull It allows for a comprehensive assessment of human contribution to GHG emissions
bull It is consistent with standards of economic and environmental accounting
bull Represents the spatial distribution of a countryrsquos water ldquodemandrdquo
bull Expands traditional measures of water withdrawal (green and grey waters also included)
bull Visualizes the link between (local) consumption and (global) appropriation of freshwater
bull Integrates water use and pollution over the production chain
Comparing the Indicators strengths
ECOLOGICAL FOOTPRINT CARBON FOOTPRINT WATER FOOTPRINT
bull Cannot cover all aspects of sustainability neither all environmental concerns especially those for which no regenerative capacity exists
bull Shows pressures that could lead to degradation of natural capital (eg reduced quality of land or reduced biodiversity) but does not predict this degradation
bull Not geographically explicit
bull Some underlying assumptions controversial but documented
bull Cannot track the full palette of human demands on the environment
bull Additional impact assessment models are needed to analyze the impact of climate change at both national and sub-national levels
bull Efforts needed to set up and update a system of MRIO tables and related environmental extensions
bull Only track human demands on freshwater
bull It relies on local data frequently unavailable andor hard to collect It suffers from possible truncation errors
bull No uncertainty studies are available though uncertainty can be significant
bull Grey water calculation heavily relies on assumptions and estimations
Comparing the Indicators weaknesses
ECOLOGICAL FOOTPRINT CARBON FOOTPRINT WATER FOOTPRINT
bull Measures overshoot and identifies the ecosystems under human-induced stress
bull Monitors societiesrsquo progresses towards minimum sustainability criteria (demand le supply)
bull Monitor the effectiveness of established resource use and resource efficiency policies
bull Allows analyzing the consequences of using alternative energies
bull Communicate environmental impacts of different life-styles to the overall public
bull Track pressure on biodiversitybull Illustrates the unequal distribution
of resource supply and use can be used for international policies aiming at implementing contraction and convergence principles
bull Offers an alternative angle for international policy on climate change as it complements the territorial-based approach used by the UNFCCC
bull Offers a better understanding of countriesrsquo responsibility and could facilitate international cooperation and partnerships between developing and developed countries
bull Can help design an international harmonized price for greenhouse gas emissions
bull Illustrates the unequal distribution of resource use and can be used to design international policies aiming at implementing contraction and convergence principles
bull Gives a new amp global dimension to the concept of water management amp governance
bull Offers nations a better understanding of their dependency on foreign water resources
bull Offers river basin authorities info on the extent to which scarce water resources are allocated to low-value export crops
bull Offers companies a way to monitor their dependence on scarce water resources alongside their supply-chain
bull Illustrates the unequal distribution of resource use and can be used to design international policies aiming at implementing contraction and convergence principles
Spectrum of Policy Usefulness

Carbon Footprint
bull The six greenhouse gases identified by the Kyoto Protocol are included in the analysis
bull CO2 CH4 N2O HFC PFC and SF6
bull Results are expressed in kg CO2-e and are calculated by multiplying the actual mass of a gas with the global warming potential factor for this particular gas making the global warming effects of different GHGs comparable and additive
bull The prevailing method for national Carbon Footprint accounting is environmentally extended multi-regional input-output analysis (EE-MRIO)
Emissions from source territorial emissions
Emissions from products and services
consumption emissions
Carbon Footprint
Comparing the Indicators coverage
ECOLOGICAL FOOTPRINT CARBON FOOTPRINT WATER FOOTPRINT
bull Temporally explicit and multi-dimensional indicator that can be applied to single products cities regions nations and the whole biosphere
bull More than 200 countries for the period 1961-2007 are tracked (Ewing et al 2010)
bull It has a consumption-based point of view and thus considers trade
bull Multi-dimensional indicator that can be applied to products processes companies industry sectors individuals governments populations etc
bull 73 nations and 14 regions for the year 2001 only are tracked (Hertwich and Peters 2009)
bull It has a consumption-based point of view and thus considers trade
bull Geographically explicit and multi-dimensional indicator calculated for products organizations sectors individuals cities and nations
bull 140 nations for the period 1997-2001 (Chapagain and Hoekstra 2004)
bull It has a consumption-based approach and considers trade
Opting for a ldquoconsumer approachrdquo
bull The Ecological Carbon and Water Footprints emphasize the analysis of human demand from a consumer rather than a producer perspective
bull These indicators are not based on who produces a good or service but on the end-users that consume them
bull As the existing global environmental policy framework holds producers rather than final consumers responsible for human impact industrialized countries are pushed towards imposing increasingly strict regulation on environmentally pressure-intensive industries with the long term effect of outsourcing this production to transition economies where it may be carried out less eco-efficiently
Not everything that is consumed in the Westhellip
World toy imports
World toy exports
hellip is being produced in the West
ECOLOGICAL FOOTPRINT CARBON FOOTPRINT WATER FOOTPRINT
bull Allows benchmarking human demand with nature supply and determining clear targets
bull It provides a holistic assessment of multiple anthropogenic pressures
bull Easy to communicate and understand with a strong conservation message
bull It allows for a comprehensive assessment of human contribution to GHG emissions
bull It is consistent with standards of economic and environmental accounting
bull Represents the spatial distribution of a countryrsquos water ldquodemandrdquo
bull Expands traditional measures of water withdrawal (green and grey waters also included)
bull Visualizes the link between (local) consumption and (global) appropriation of freshwater
bull Integrates water use and pollution over the production chain
Comparing the Indicators strengths
ECOLOGICAL FOOTPRINT CARBON FOOTPRINT WATER FOOTPRINT
bull Cannot cover all aspects of sustainability neither all environmental concerns especially those for which no regenerative capacity exists
bull Shows pressures that could lead to degradation of natural capital (eg reduced quality of land or reduced biodiversity) but does not predict this degradation
bull Not geographically explicit
bull Some underlying assumptions controversial but documented
bull Cannot track the full palette of human demands on the environment
bull Additional impact assessment models are needed to analyze the impact of climate change at both national and sub-national levels
bull Efforts needed to set up and update a system of MRIO tables and related environmental extensions
bull Only track human demands on freshwater
bull It relies on local data frequently unavailable andor hard to collect It suffers from possible truncation errors
bull No uncertainty studies are available though uncertainty can be significant
bull Grey water calculation heavily relies on assumptions and estimations
Comparing the Indicators weaknesses
ECOLOGICAL FOOTPRINT CARBON FOOTPRINT WATER FOOTPRINT
bull Measures overshoot and identifies the ecosystems under human-induced stress
bull Monitors societiesrsquo progresses towards minimum sustainability criteria (demand le supply)
bull Monitor the effectiveness of established resource use and resource efficiency policies
bull Allows analyzing the consequences of using alternative energies
bull Communicate environmental impacts of different life-styles to the overall public
bull Track pressure on biodiversitybull Illustrates the unequal distribution
of resource supply and use can be used for international policies aiming at implementing contraction and convergence principles
bull Offers an alternative angle for international policy on climate change as it complements the territorial-based approach used by the UNFCCC
bull Offers a better understanding of countriesrsquo responsibility and could facilitate international cooperation and partnerships between developing and developed countries
bull Can help design an international harmonized price for greenhouse gas emissions
bull Illustrates the unequal distribution of resource use and can be used to design international policies aiming at implementing contraction and convergence principles
bull Gives a new amp global dimension to the concept of water management amp governance
bull Offers nations a better understanding of their dependency on foreign water resources
bull Offers river basin authorities info on the extent to which scarce water resources are allocated to low-value export crops
bull Offers companies a way to monitor their dependence on scarce water resources alongside their supply-chain
bull Illustrates the unequal distribution of resource use and can be used to design international policies aiming at implementing contraction and convergence principles
Spectrum of Policy Usefulness
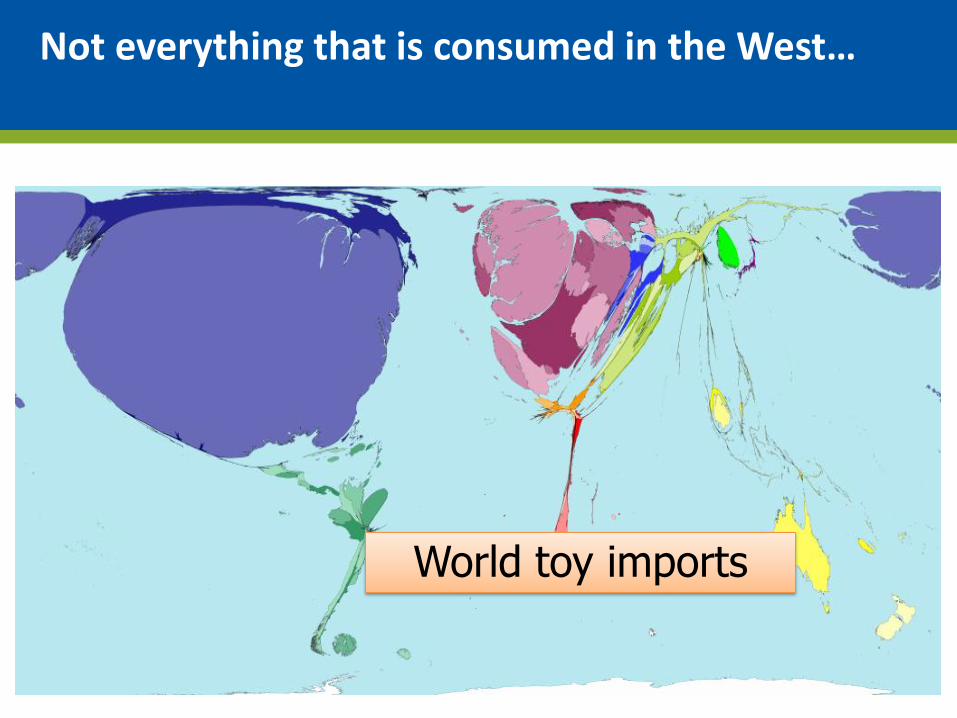

ECOLOGICAL FOOTPRINT CARBON FOOTPRINT WATER FOOTPRINT
bull Measures overshoot and identifies the ecosystems under human-induced stress
bull Monitors societiesrsquo progresses towards minimum sustainability criteria (demand le supply)
bull Monitor the effectiveness of established resource use and resource efficiency policies
bull Allows analyzing the consequences of using alternative energies
bull Communicate environmental impacts of different life-styles to the overall public
bull Track pressure on biodiversitybull Illustrates the unequal distribution
of resource supply and use can be used for international policies aiming at implementing contraction and convergence principles
bull Offers an alternative angle for international policy on climate change as it complements the territorial-based approach used by the UNFCCC
bull Offers a better understanding of countriesrsquo responsibility and could facilitate international cooperation and partnerships between developing and developed countries
bull Can help design an international harmonized price for greenhouse gas emissions
bull Illustrates the unequal distribution of resource use and can be used to design international policies aiming at implementing contraction and convergence principles
bull Gives a new amp global dimension to the concept of water management amp governance
bull Offers nations a better understanding of their dependency on foreign water resources
bull Offers river basin authorities info on the extent to which scarce water resources are allocated to low-value export crops
bull Offers companies a way to monitor their dependence on scarce water resources alongside their supply-chain
bull Illustrates the unequal distribution of resource use and can be used to design international policies aiming at implementing contraction and convergence principles
Spectrum of Policy Usefulness