Embed Size (px)
Citation preview
lable at ScienceDirect
Estuarine, Coastal and Shelf Science 80 (2008) 269–280
Contents lists avai
Estuarine, Coastal and Shelf Science
journal homepage: www.elsevier .com/locate/ecss
Ecological quality of some Tunisian coast and lagoon locations, by usingbenthic community parameters and biotic indices
Ahmed Afli*, Rakia Ayari, Sana ZaabiLaboratoire de Biodiversite et biotechnologies marines, Institut National des Sciences et Technologies de la Mer, 28 rue de 2 mars 1934, 2025 Salammbo, Tunisia
a r t i c l e i n f o
Article history:Received 5 May 2008Accepted 15 August 2008Available online 22 August 2008
Keywords:benthic macrofaunabiotic indicesecological qualityTunisian costal areasTunisian lagoons
* Corresponding author.E-mail address: [email protected] (A. Afli).
0272-7714/$ – see front matter � 2008 Elsevier Ltd.doi:10.1016/j.ecss.2008.08.010
a b s t r a c t
Three Tunisian coastal and lagoon sites, variously affected by human activities, and differing according totheir degree of communication with the sea, were studied. The total organic matter content and thegranulometry of the sediment were measured and the macro-invertebrates were sampled and identified.Currently due to the lack of an efficient single biotic index for quality assessment, indications from thesemeasurements can contribute to enrich our knowledge of the southern Mediterranean areas. Severalbiotic indices (AMBI, BENTIX, BOPA, BOPA modified, I2EC, ITI), most of which have been used in thecontext of the European Water Framework Directive, and some other structural parameters were used.The results show that the Bizerte lagoon, an almost closed area characterized mainly by extreme salinity/temperature and with a strong fluctuation of nutrients, appears biologically more impoverished. TheDkhila coast, which is more open to the sea, however, appears to be less dominated by the principalspecies. Biotic indices showed that the most polluted areas included the region exposed to urban inputsof Bizerte, the mouth of Hamdoun wadi and the harbour areas. In these locations, benthic macrofauna isdominated by opportunistic species like Capitella capitata, Scolelepis fuliginosa, Prionospio malmgreni,Polydora sp., Cirratulus cirratus and Cirriformia tentaculata. Other stations, which are farther from thesources of disturbance such as the mouths of the principal Wadis, the south of the Bizerte ship canal andthe south of the Tunis bay, appear to be in good ecological condition and hosted a variety of sensitivespecies, Other stations were classified differently by the biotic indices used mainly because of the lack ofa real inter-calibration of the various classification methodologies used by these indices.
� 2008 Elsevier Ltd. All rights reserved.
1. Introduction
Coastal industrial and urban development has lead to anincrease of pollution and impacts on marine systems, producingchanges in the structure and functioning of benthic communities.To assess the impact of the increasing pollution, several methodsand indices have been established, such as the Reish Method (Reish,1955) using the distribution pattern of pollution-tolerant poly-chaetes, particularly Capitella capitata, and the SAB model (Pearsonand Rosenberg, 1978) which uses the macrofauna parameters;specific richness (S), abundance (A) and biomass (B). Within thiscontext, Glemarec and Hily (1981) conceived a more generalizedmodel, based on the sensitivity of benthic macrofauna species, toqualify the degradation status of marine coastal areas. Severalsampling stations in Brittany were classified according to theirdegree of organic enrichment and their oxy-reduction potential inthe sediment. The species presenting similar abundance profiles on
All rights reserved.
the gradient were then grouped together to distinguish, fiveecological groups (EG). The respective predominance of thesegroups enabled the assignment of a biotic index to each case. Thismodel was, thereafter, improved in particular by Afli and Glemarec(2000) and Grall and Glemarec (2003, 2005) concerning the clas-sification of the species in the five ecological groups and also thecriteria of attribution of the biotic indices.
Several derived methods using ecological groups were devel-oped thereafter, such as the AZTI Marine Biotic Index (AMBI) (Borjaet al., 2000) and the BENTIX index (Simboura and Zenetos, 2002).These qualify the ecological status within a five-class scale ofpollution, by using simple indices calculated on the basis of therelative proportions of ecological groups. Grall and Glemarec(2003) established the Coastal Endofaunal Evaluation Index (I2EC)based on the percentages of the five ecological groups (EG) andconsisting of five classes of degradation and three transitionalsituations (or ecotones). Rosenberg et al. (2004) proposed theBenthic Quality Index (BQI) based on a combination of the species’tolerance values, abundance and diversity of the macrobenthosinvertebrates. They defined five BQI-classes each corresponding toan ecological status.
A. Afli et al. / Estuarine, Coastal and Shelf Science 80 (2008) 269–280270
Gomez-Gesteira and Dauvin (2000) suggested the use ofsome taxonomic groups to provide an interesting evaluationconcerning the ecological quality of the marine areas. Theyproposed the Benthic Opportunistic Polychaetes Amphipodsindex (BOPA) which measures the relationship between theabundance of opportunistic polychaetes and amphipods. Theidea came from the observations of the consequences oilspillage in benthic communities. Here, the authors noted that, inthe first weeks after the oil spill, the abundance of amphipods,in general and the genus Ampelisca, in particular, rapidlydecreased and thereafter, when the sediment was decontami-nated, the amphipods returned quickly to the areas. The poly-chaetes, however, showed different reactions to pollution;sensitive species disappeared after an oil spill and opportunisticspecies proliferated while benefiting from the excess in organicmatter (Elmgren et al., 1983; Laubier, 1991; Gomez-Gesteira andDauvin, 2000). Dauvin and Ruellet (2007) modified the BOPAindex (BOPA-m) so that it can be used to assign estuarine andcoastal communities to the five Ecological Quality Status (EcoQ)classes suggested by the European Water Framework Directive(WFD). Word (1978) used trophic groups to establish theecological quality of the areas, and proposed the InfaunalTrophic Index (ITI) which defines, depending on the predomi-nance of the different trophic groups, four classes of pollution(Mearns and Word, 1982). The majority of these indices are usedunder the WFD to determine the EcoQ status in monitoringcoastal areas over time. Other more regional indices have beendeveloped across the world, such as the Benthic Index of BioticIntegrity (B-IBI) developed in the USA (Weisberg et al., 1997),the Indicators Species Index (ISI) developed in Norway by Rigg(Salas et al., 2006) and the Fuzzy INdex of Ecosystem integrity(FINE) developed in Italy (Mistri et al., 2007). Other simplevariables have been also widely used in marine ecology for theassessment of environmental quality, such as the joint use of thenumber of species (S) and the number of individuals (N or A). Anumber of Univariate indices were also widely used, like theShannon–Wiener formula H0 (Shannon and Weaver, 1963), theequitability J (or evenness) (Pielou, 1966), the Brillouin index HB(Brillouin, 1956), the McIntosh index D (McIntosh, 1967), theBerger–Parker index d (Berger and Parker, 1970) and theSanders’ rarefaction technique (Sanders, 1968).
The usefulness of the majority of these indices for environ-mental quality assessment has been repeatedly criticized (Gray,1979). Several studies across the world demonstrate that none ofthe available indices should be considered ideal to measure bio-logical effects of pollution, because every index was originallydeveloped for one or few stressors (Quintino et al., 2006; Salaset al., 2006; Chainho et al., 2007). Thus, as suggested by Salas et al.(2006), the joint use of various indices for the assessment of theenvironmental quality should be evaluated by combining a suite ofindices providing complementary information.
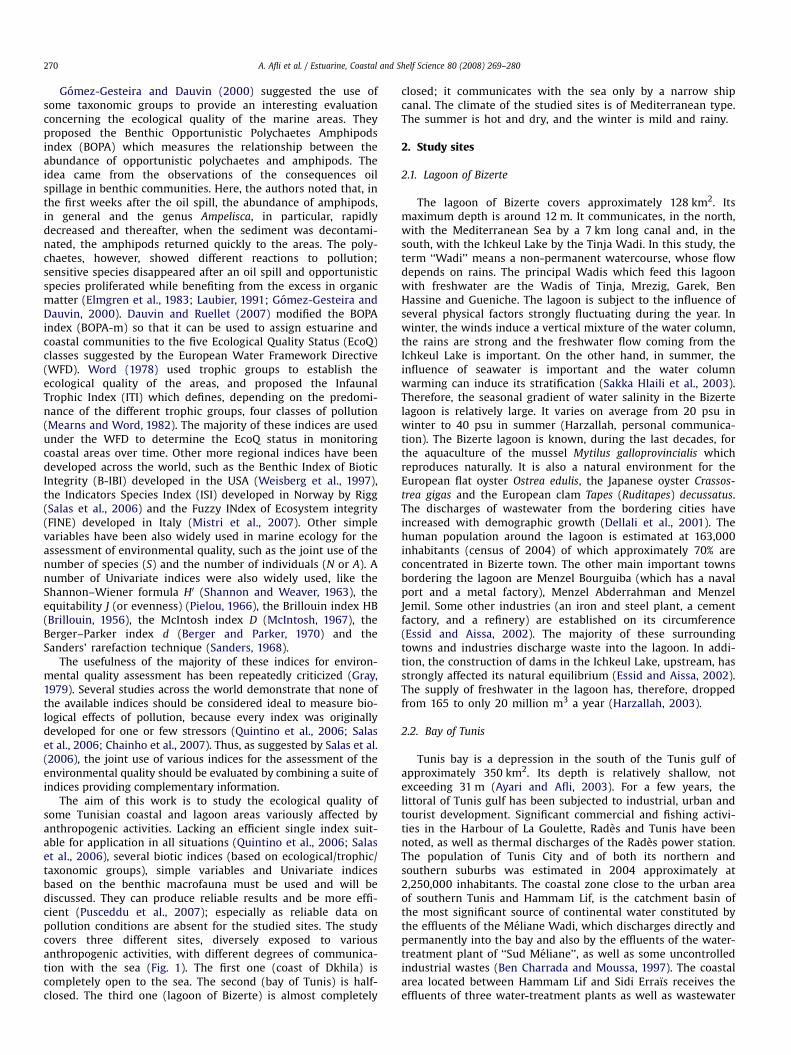
The aim of this work is to study the ecological quality ofsome Tunisian coastal and lagoon areas variously affected byanthropogenic activities. Lacking an efficient single index suit-able for application in all situations (Quintino et al., 2006; Salaset al., 2006), several biotic indices (based on ecological/trophic/taxonomic groups), simple variables and Univariate indicesbased on the benthic macrofauna must be used and will bediscussed. They can produce reliable results and be more effi-cient (Pusceddu et al., 2007); especially as reliable data onpollution conditions are absent for the studied sites. The studycovers three different sites, diversely exposed to variousanthropogenic activities, with different degrees of communica-tion with the sea (Fig. 1). The first one (coast of Dkhila) iscompletely open to the sea. The second (bay of Tunis) is half-closed. The third one (lagoon of Bizerte) is almost completely
closed; it communicates with the sea only by a narrow shipcanal. The climate of the studied sites is of Mediterranean type.The summer is hot and dry, and the winter is mild and rainy.
2. Study sites
2.1. Lagoon of Bizerte
The lagoon of Bizerte covers approximately 128 km2. Itsmaximum depth is around 12 m. It communicates, in the north,with the Mediterranean Sea by a 7 km long canal and, in thesouth, with the Ichkeul Lake by the Tinja Wadi. In this study, theterm ‘‘Wadi’’ means a non-permanent watercourse, whose flowdepends on rains. The principal Wadis which feed this lagoonwith freshwater are the Wadis of Tinja, Mrezig, Garek, BenHassine and Gueniche. The lagoon is subject to the influence ofseveral physical factors strongly fluctuating during the year. Inwinter, the winds induce a vertical mixture of the water column,the rains are strong and the freshwater flow coming from theIchkeul Lake is important. On the other hand, in summer, theinfluence of seawater is important and the water columnwarming can induce its stratification (Sakka Hlaili et al., 2003).Therefore, the seasonal gradient of water salinity in the Bizertelagoon is relatively large. It varies on average from 20 psu inwinter to 40 psu in summer (Harzallah, personal communica-tion). The Bizerte lagoon is known, during the last decades, forthe aquaculture of the mussel Mytilus galloprovincialis whichreproduces naturally. It is also a natural environment for theEuropean flat oyster Ostrea edulis, the Japanese oyster Crassos-trea gigas and the European clam Tapes (Ruditapes) decussatus.The discharges of wastewater from the bordering cities haveincreased with demographic growth (Dellali et al., 2001). Thehuman population around the lagoon is estimated at 163,000inhabitants (census of 2004) of which approximately 70% areconcentrated in Bizerte town. The other main important townsbordering the lagoon are Menzel Bourguiba (which has a navalport and a metal factory), Menzel Abderrahman and MenzelJemil. Some other industries (an iron and steel plant, a cementfactory, and a refinery) are established on its circumference(Essid and Aissa, 2002). The majority of these surroundingtowns and industries discharge waste into the lagoon. In addi-tion, the construction of dams in the Ichkeul Lake, upstream, hasstrongly affected its natural equilibrium (Essid and Aissa, 2002).The supply of freshwater in the lagoon has, therefore, droppedfrom 165 to only 20 million m3 a year (Harzallah, 2003).
2.2. Bay of Tunis
Tunis bay is a depression in the south of the Tunis gulf ofapproximately 350 km2. Its depth is relatively shallow, notexceeding 31 m (Ayari and Afli, 2003). For a few years, thelittoral of Tunis gulf has been subjected to industrial, urban andtourist development. Significant commercial and fishing activi-ties in the Harbour of La Goulette, Rades and Tunis have beennoted, as well as thermal discharges of the Rades power station.The population of Tunis City and of both its northern andsouthern suburbs was estimated in 2004 approximately at2,250,000 inhabitants. The coastal zone close to the urban areaof southern Tunis and Hammam Lif, is the catchment basin ofthe most significant source of continental water constituted bythe effluents of the Meliane Wadi, which discharges directly andpermanently into the bay and also by the effluents of the water-treatment plant of ‘‘Sud Meliane’’, as well as some uncontrolledindustrial wastes (Ben Charrada and Moussa, 1997). The coastalarea located between Hammam Lif and Sidi Erraıs receives theeffluents of three water-treatment plants as well as wastewater
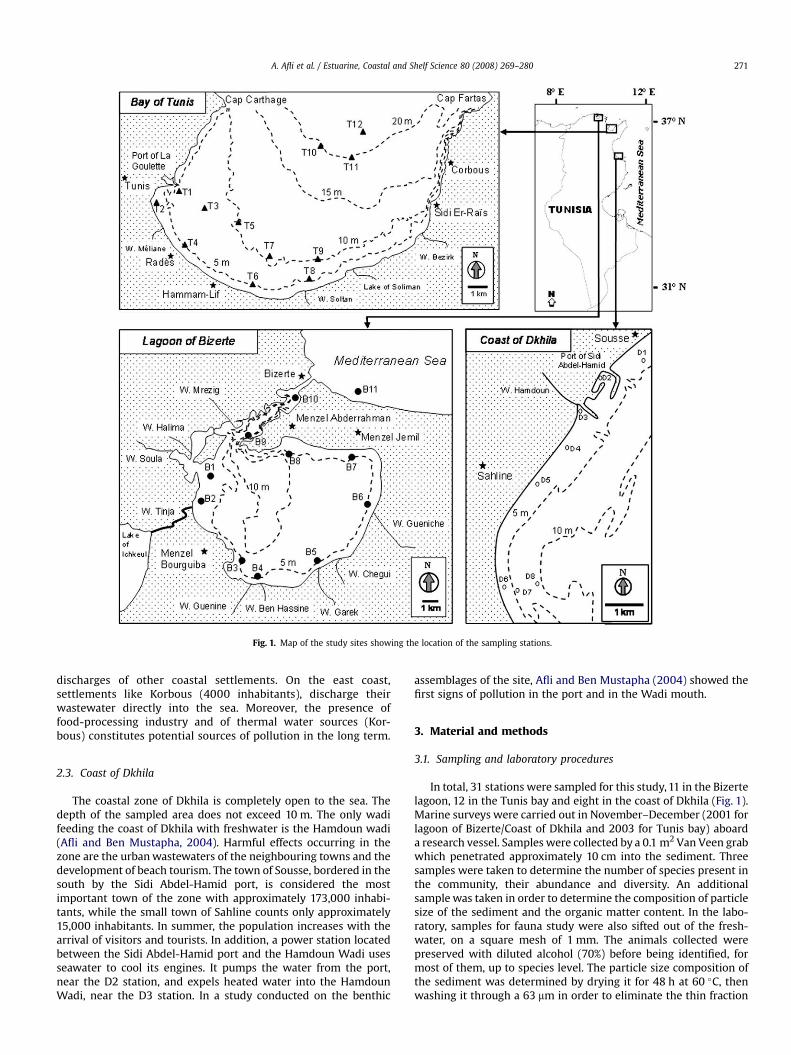
Fig. 1. Map of the study sites showing the location of the sampling stations.
A. Afli et al. / Estuarine, Coastal and Shelf Science 80 (2008) 269–280 271
discharges of other coastal settlements. On the east coast,settlements like Korbous (4000 inhabitants), discharge theirwastewater directly into the sea. Moreover, the presence offood-processing industry and of thermal water sources (Kor-bous) constitutes potential sources of pollution in the long term.
2.3. Coast of Dkhila
The coastal zone of Dkhila is completely open to the sea. Thedepth of the sampled area does not exceed 10 m. The only wadifeeding the coast of Dkhila with freshwater is the Hamdoun wadi(Afli and Ben Mustapha, 2004). Harmful effects occurring in thezone are the urban wastewaters of the neighbouring towns and thedevelopment of beach tourism. The town of Sousse, bordered in thesouth by the Sidi Abdel-Hamid port, is considered the mostimportant town of the zone with approximately 173,000 inhabi-tants, while the small town of Sahline counts only approximately15,000 inhabitants. In summer, the population increases with thearrival of visitors and tourists. In addition, a power station locatedbetween the Sidi Abdel-Hamid port and the Hamdoun Wadi usesseawater to cool its engines. It pumps the water from the port,near the D2 station, and expels heated water into the HamdounWadi, near the D3 station. In a study conducted on the benthic
assemblages of the site, Afli and Ben Mustapha (2004) showed thefirst signs of pollution in the port and in the Wadi mouth.
3. Material and methods
3.1. Sampling and laboratory procedures
In total, 31 stations were sampled for this study, 11 in the Bizertelagoon, 12 in the Tunis bay and eight in the coast of Dkhila (Fig. 1).Marine surveys were carried out in November–December (2001 forlagoon of Bizerte/Coast of Dkhila and 2003 for Tunis bay) aboarda research vessel. Samples were collected by a 0.1 m2 Van Veen grabwhich penetrated approximately 10 cm into the sediment. Threesamples were taken to determine the number of species present inthe community, their abundance and diversity. An additionalsample was taken in order to determine the composition of particlesize of the sediment and the organic matter content. In the labo-ratory, samples for fauna study were also sifted out of the fresh-water, on a square mesh of 1 mm. The animals collected werepreserved with diluted alcohol (70%) before being identified, formost of them, up to species level. The particle size composition ofthe sediment was determined by drying it for 48 h at 60 �C, thenwashing it through a 63 mm in order to eliminate the thin fraction
A. Afli et al. / Estuarine, Coastal and Shelf Science 80 (2008) 269–280272
(silt and clay). The retained material was dried again at 60 �C, afterthat all samples were sieved on AFNOR succession meshes (Holmeand McIntyre, 1984). The classification of the sediment was carriedout according to the three principal fractions (mud, sand, gravel)according to Chasse and Glemarec (1976). The organic mattercontent was determined by the loss on ignition method thatconsists of drying sediment at 105 �C for 24 h and then combustingit at 520 �C for 6 h. The loss on ignition represents the total organicmatter (Holme and McIntyre, 1984).
3.2. Data analysis
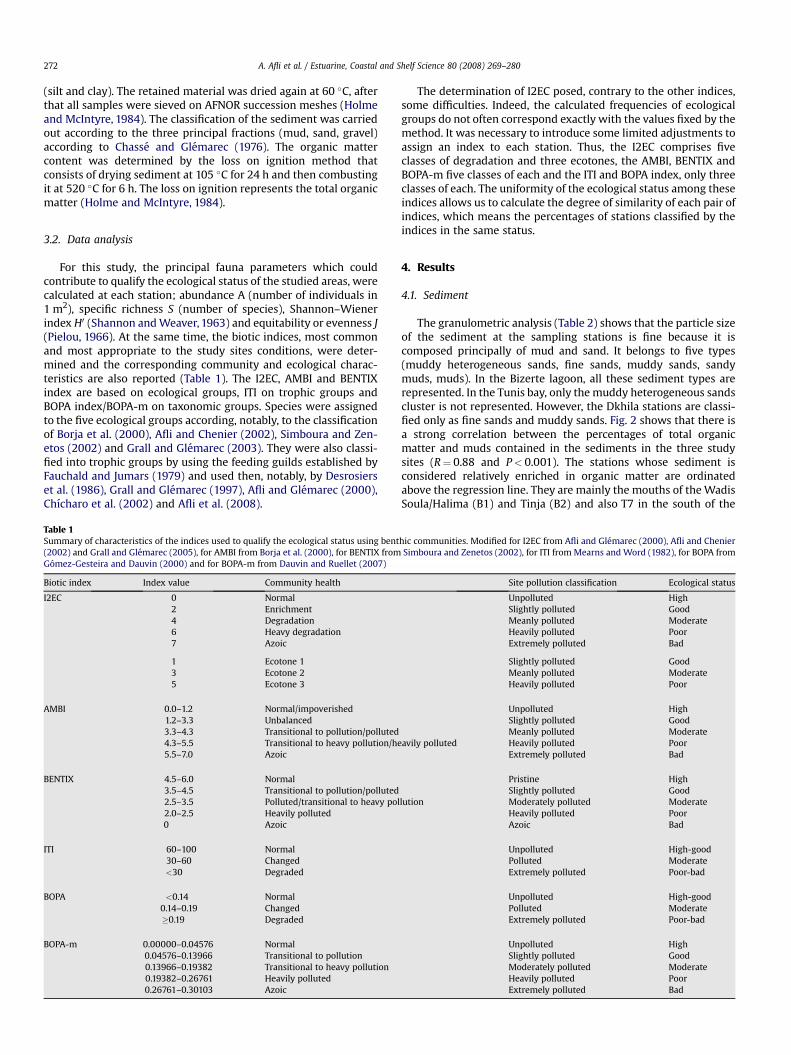
For this study, the principal fauna parameters which couldcontribute to qualify the ecological status of the studied areas, werecalculated at each station; abundance A (number of individuals in1 m2), specific richness S (number of species), Shannon–Wienerindex H0 (Shannon and Weaver, 1963) and equitability or evenness J(Pielou, 1966). At the same time, the biotic indices, most commonand most appropriate to the study sites conditions, were deter-mined and the corresponding community and ecological charac-teristics are also reported (Table 1). The I2EC, AMBI and BENTIXindex are based on ecological groups, ITI on trophic groups andBOPA index/BOPA-m on taxonomic groups. Species were assignedto the five ecological groups according, notably, to the classificationof Borja et al. (2000), Afli and Chenier (2002), Simboura and Zen-etos (2002) and Grall and Glemarec (2003). They were also classi-fied into trophic groups by using the feeding guilds established byFauchald and Jumars (1979) and used then, notably, by Desrosierset al. (1986), Grall and Glemarec (1997), Afli and Glemarec (2000),Chıcharo et al. (2002) and Afli et al. (2008).
Table 1Summary of characteristics of the indices used to qualify the ecological status using bent(2002) and Grall and Glemarec (2005), for AMBI from Borja et al. (2000), for BENTIX fromGomez-Gesteira and Dauvin (2000) and for BOPA-m from Dauvin and Ruellet (2007)
Biotic index Index value Community health
I2EC 0 Normal2 Enrichment4 Degradation6 Heavy degradation7 Azoic
1 Ecotone 13 Ecotone 25 Ecotone 3
AMBI 0.0–1.2 Normal/impoverished1.2–3.3 Unbalanced3.3–4.3 Transitional to pollution/polluted4.3–5.5 Transitional to heavy pollution/he5.5–7.0 Azoic
BENTIX 4.5–6.0 Normal3.5–4.5 Transitional to pollution/polluted2.5–3.5 Polluted/transitional to heavy pol2.0–2.5 Heavily polluted0 Azoic
ITI 60–100 Normal30–60 Changed<30 Degraded
BOPA <0.14 Normal0.14–0.19 Changed�0.19 Degraded
BOPA-m 0.00000–0.04576 Normal0.04576–0.13966 Transitional to pollution0.13966–0.19382 Transitional to heavy pollution0.19382–0.26761 Heavily polluted0.26761–0.30103 Azoic
The determination of I2EC posed, contrary to the other indices,some difficulties. Indeed, the calculated frequencies of ecologicalgroups do not often correspond exactly with the values fixed by themethod. It was necessary to introduce some limited adjustments toassign an index to each station. Thus, the I2EC comprises fiveclasses of degradation and three ecotones, the AMBI, BENTIX andBOPA-m five classes of each and the ITI and BOPA index, only threeclasses of each. The uniformity of the ecological status among theseindices allows us to calculate the degree of similarity of each pair ofindices, which means the percentages of stations classified by theindices in the same status.
4. Results
4.1. Sediment
The granulometric analysis (Table 2) shows that the particle sizeof the sediment at the sampling stations is fine because it iscomposed principally of mud and sand. It belongs to five types(muddy heterogeneous sands, fine sands, muddy sands, sandymuds, muds). In the Bizerte lagoon, all these sediment types arerepresented. In the Tunis bay, only the muddy heterogeneous sandscluster is not represented. However, the Dkhila stations are classi-fied only as fine sands and muddy sands. Fig. 2 shows that there isa strong correlation between the percentages of total organicmatter and muds contained in the sediments in the three studysites (R¼ 0.88 and P< 0.001). The stations whose sediment isconsidered relatively enriched in organic matter are ordinatedabove the regression line. They are mainly the mouths of the WadisSoula/Halima (B1) and Tinja (B2) and also T7 in the south of the
hic communities. Modified for I2EC from Afli and Glemarec (2000), Afli and ChenierSimboura and Zenetos (2002), for ITI from Mearns and Word (1982), for BOPA from
Site pollution classification Ecological status
Unpolluted HighSlightly polluted GoodMeanly polluted ModerateHeavily polluted PoorExtremely polluted Bad
Slightly polluted GoodMeanly polluted ModerateHeavily polluted Poor
Unpolluted HighSlightly polluted GoodMeanly polluted Moderate
avily polluted Heavily polluted PoorExtremely polluted Bad
Pristine HighSlightly polluted Good
lution Moderately polluted ModerateHeavily polluted PoorAzoic Bad
Unpolluted High-goodPolluted ModerateExtremely polluted Poor-bad
Unpolluted High-goodPolluted ModerateExtremely polluted Poor-bad
Unpolluted HighSlightly polluted GoodModerately polluted ModerateHeavily polluted PoorExtremely polluted Bad
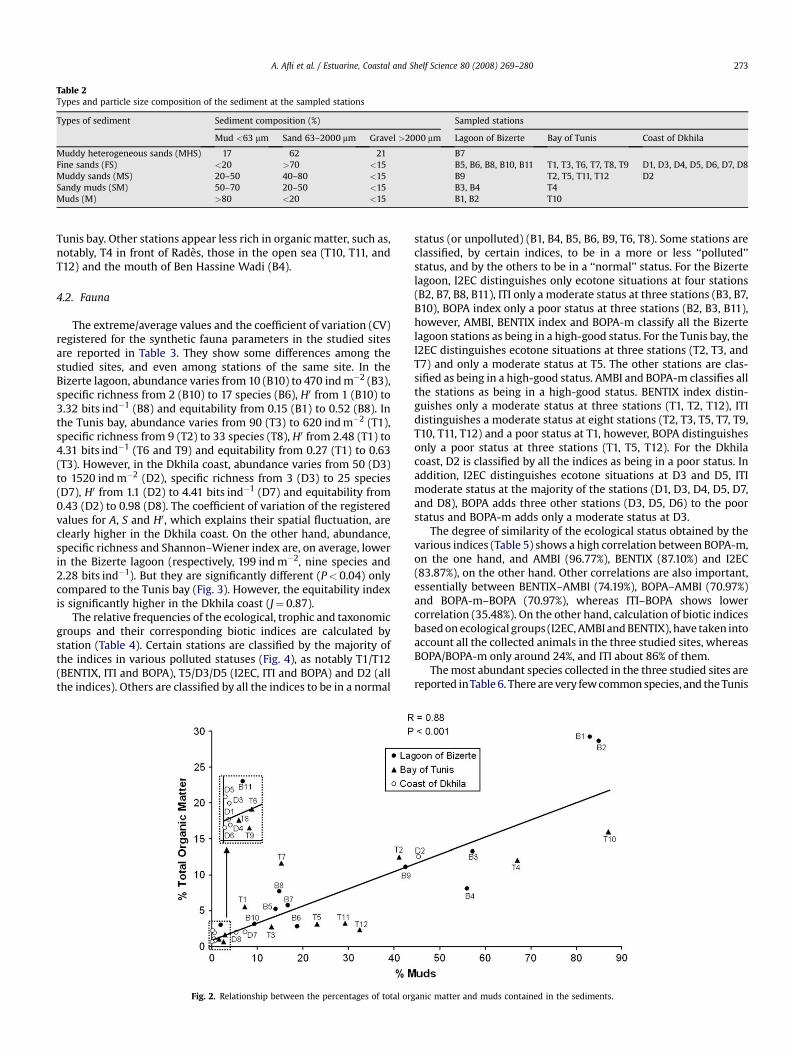
Table 2Types and particle size composition of the sediment at the sampled stations
Types of sediment Sediment composition (%) Sampled stations
Mud <63 mm Sand 63–2000 mm Gravel >2000 mm Lagoon of Bizerte Bay of Tunis Coast of Dkhila
Muddy heterogeneous sands (MHS) 17 62 21 B7Fine sands (FS) <20 >70 <15 B5, B6, B8, B10, B11 T1, T3, T6, T7, T8, T9 D1, D3, D4, D5, D6, D7, D8Muddy sands (MS) 20–50 40–80 <15 B9 T2, T5, T11, T12 D2Sandy muds (SM) 50–70 20–50 <15 B3, B4 T4Muds (M) >80 <20 <15 B1, B2 T10
A. Afli et al. / Estuarine, Coastal and Shelf Science 80 (2008) 269–280 273
Tunis bay. Other stations appear less rich in organic matter, such as,notably, T4 in front of Rades, those in the open sea (T10, T11, andT12) and the mouth of Ben Hassine Wadi (B4).
4.2. Fauna
The extreme/average values and the coefficient of variation (CV)registered for the synthetic fauna parameters in the studied sitesare reported in Table 3. They show some differences among thestudied sites, and even among stations of the same site. In theBizerte lagoon, abundance varies from 10 (B10) to 470 ind m�2 (B3),specific richness from 2 (B10) to 17 species (B6), H0 from 1 (B10) to3.32 bits ind�1 (B8) and equitability from 0.15 (B1) to 0.52 (B8). Inthe Tunis bay, abundance varies from 90 (T3) to 620 ind m�2 (T1),specific richness from 9 (T2) to 33 species (T8), H0 from 2.48 (T1) to4.31 bits ind�1 (T6 and T9) and equitability from 0.27 (T1) to 0.63(T3). However, in the Dkhila coast, abundance varies from 50 (D3)to 1520 ind m�2 (D2), specific richness from 3 (D3) to 25 species(D7), H0 from 1.1 (D2) to 4.41 bits ind�1 (D7) and equitability from0.43 (D2) to 0.98 (D8). The coefficient of variation of the registeredvalues for A, S and H0, which explains their spatial fluctuation, areclearly higher in the Dkhila coast. On the other hand, abundance,specific richness and Shannon–Wiener index are, on average, lowerin the Bizerte lagoon (respectively, 199 ind m�2, nine species and2.28 bits ind�1). But they are significantly different (P< 0.04) onlycompared to the Tunis bay (Fig. 3). However, the equitability indexis significantly higher in the Dkhila coast (J¼ 0.87).
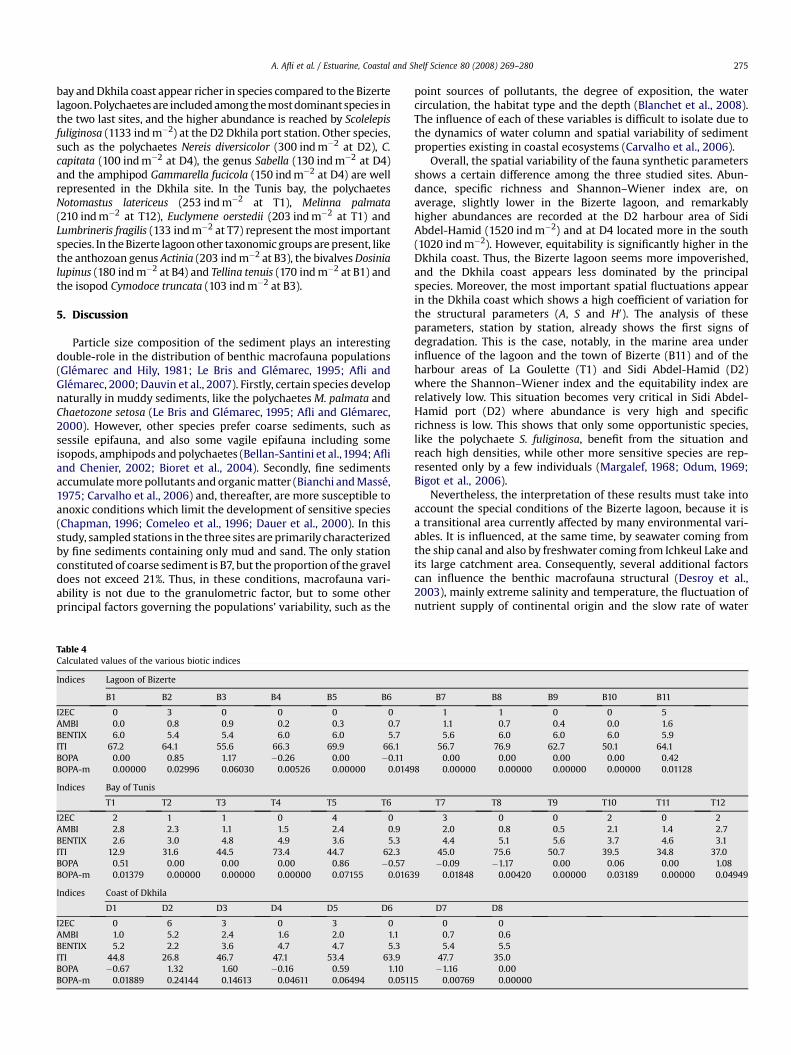
The relative frequencies of the ecological, trophic and taxonomicgroups and their corresponding biotic indices are calculated bystation (Table 4). Certain stations are classified by the majority ofthe indices in various polluted statuses (Fig. 4), as notably T1/T12(BENTIX, ITI and BOPA), T5/D3/D5 (I2EC, ITI and BOPA) and D2 (allthe indices). Others are classified by all the indices to be in a normal
Fig. 2. Relationship between the percentages of total org
status (or unpolluted) (B1, B4, B5, B6, B9, T6, T8). Some stations areclassified, by certain indices, to be in a more or less ‘‘polluted’’status, and by the others to be in a ‘‘normal’’ status. For the Bizertelagoon, I2EC distinguishes only ecotone situations at four stations(B2, B7, B8, B11), ITI only a moderate status at three stations (B3, B7,B10), BOPA index only a poor status at three stations (B2, B3, B11),however, AMBI, BENTIX index and BOPA-m classify all the Bizertelagoon stations as being in a high-good status. For the Tunis bay, theI2EC distinguishes ecotone situations at three stations (T2, T3, andT7) and only a moderate status at T5. The other stations are clas-sified as being in a high-good status. AMBI and BOPA-m classifies allthe stations as being in a high-good status. BENTIX index distin-guishes only a moderate status at three stations (T1, T2, T12), ITIdistinguishes a moderate status at eight stations (T2, T3, T5, T7, T9,T10, T11, T12) and a poor status at T1, however, BOPA distinguishesonly a poor status at three stations (T1, T5, T12). For the Dkhilacoast, D2 is classified by all the indices as being in a poor status. Inaddition, I2EC distinguishes ecotone situations at D3 and D5, ITImoderate status at the majority of the stations (D1, D3, D4, D5, D7,and D8), BOPA adds three other stations (D3, D5, D6) to the poorstatus and BOPA-m adds only a moderate status at D3.
The degree of similarity of the ecological status obtained by thevarious indices (Table 5) shows a high correlation between BOPA-m,on the one hand, and AMBI (96.77%), BENTIX (87.10%) and I2EC(83.87%), on the other hand. Other correlations are also important,essentially between BENTIX–AMBI (74.19%), BOPA–AMBI (70.97%)and BOPA-m–BOPA (70.97%), whereas ITI–BOPA shows lowercorrelation (35.48%). On the other hand, calculation of biotic indicesbased on ecological groups (I2EC, AMBI and BENTIX), have taken intoaccount all the collected animals in the three studied sites, whereasBOPA/BOPA-m only around 24%, and ITI about 86% of them.
The most abundant species collected in the three studied sites arereported inTable 6. There are very few common species, and the Tunis
anic matter and muds contained in the sediments.
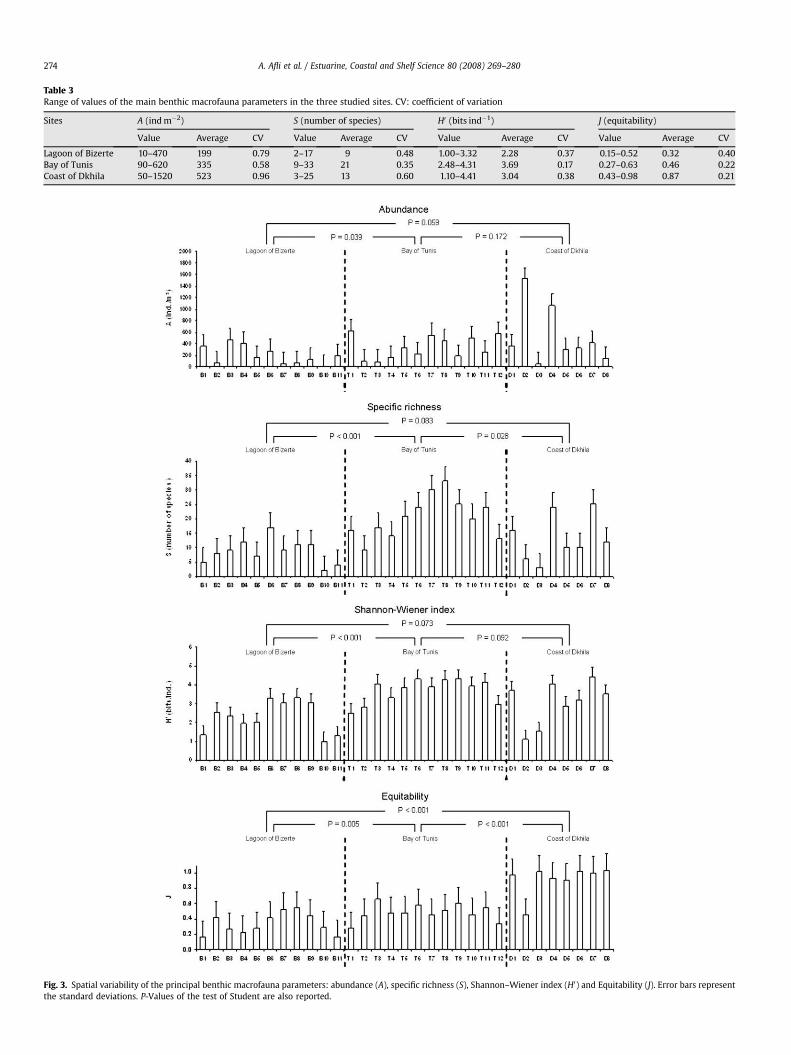
Fig. 3. Spatial variability of the principal benthic macrofauna parameters: abundance (A), specific richness (S), Shannon–Wiener index (H0) and Equitability (J). Error bars representthe standard deviations. P-Values of the test of Student are also reported.
Table 3Range of values of the main benthic macrofauna parameters in the three studied sites. CV: coefficient of variation
Sites A (ind m�2) S (number of species) H0 (bits ind�1) J (equitability)
Value Average CV Value Average CV Value Average CV Value Average CV
Lagoon of Bizerte 10–470 199 0.79 2–17 9 0.48 1.00–3.32 2.28 0.37 0.15–0.52 0.32 0.40Bay of Tunis 90–620 335 0.58 9–33 21 0.35 2.48–4.31 3.69 0.17 0.27–0.63 0.46 0.22Coast of Dkhila 50–1520 523 0.96 3–25 13 0.60 1.10–4.41 3.04 0.38 0.43–0.98 0.87 0.21
A. Afli et al. / Estuarine, Coastal and Shelf Science 80 (2008) 269–280274
A. Afli et al. / Estuarine, Coastal and Shelf Science 80 (2008) 269–280 275
bay and Dkhila coast appear richer in species compared to the Bizertelagoon. Polychaetes are included among the most dominant species inthe two last sites, and the higher abundance is reached by Scolelepisfuliginosa (1133 ind m�2) at the D2 Dkhila port station. Other species,such as the polychaetes Nereis diversicolor (300 ind m�2 at D2), C.capitata (100 ind m�2 at D4), the genus Sabella (130 ind m�2 at D4)and the amphipod Gammarella fucicola (150 ind m�2 at D4) are wellrepresented in the Dkhila site. In the Tunis bay, the polychaetesNotomastus latericeus (253 ind m�2 at T1), Melinna palmata(210 ind m�2 at T12), Euclymene oerstedii (203 ind m�2 at T1) andLumbrineris fragilis (133 ind m�2 at T7) represent the most importantspecies. In the Bizerte lagoon other taxonomic groups are present, likethe anthozoan genus Actinia (203 ind m�2 at B3), the bivalves Dosinialupinus (180 ind m�2 at B4) and Tellina tenuis (170 ind m�2 at B1) andthe isopod Cymodoce truncata (103 ind m�2 at B3).
5. Discussion
Particle size composition of the sediment plays an interestingdouble-role in the distribution of benthic macrofauna populations(Glemarec and Hily, 1981; Le Bris and Glemarec, 1995; Afli andGlemarec, 2000; Dauvin et al., 2007). Firstly, certain species developnaturally in muddy sediments, like the polychaetes M. palmata andChaetozone setosa (Le Bris and Glemarec, 1995; Afli and Glemarec,2000). However, other species prefer coarse sediments, such assessile epifauna, and also some vagile epifauna including someisopods, amphipods and polychaetes (Bellan-Santini et al.,1994; Afliand Chenier, 2002; Bioret et al., 2004). Secondly, fine sedimentsaccumulate more pollutants and organic matter (Bianchi and Masse,1975; Carvalho et al., 2006) and, thereafter, are more susceptible toanoxic conditions which limit the development of sensitive species(Chapman, 1996; Comeleo et al., 1996; Dauer et al., 2000). In thisstudy, sampled stations in the three sites are primarily characterizedby fine sediments containing only mud and sand. The only stationconstituted of coarse sediment is B7, but the proportion of the graveldoes not exceed 21%. Thus, in these conditions, macrofauna vari-ability is not due to the granulometric factor, but to some otherprincipal factors governing the populations’ variability, such as the
Table 4Calculated values of the various biotic indices
Indices Lagoon of Bizerte
B1 B2 B3 B4 B5 B6
I2EC 0 3 0 0 0 0AMBI 0.0 0.8 0.9 0.2 0.3 0.7BENTIX 6.0 5.4 5.4 6.0 6.0 5.7ITI 67.2 64.1 55.6 66.3 69.9 66.1BOPA 0.00 0.85 1.17 �0.26 0.00 �0.11BOPA-m 0.00000 0.02996 0.06030 0.00526 0.00000 0.0149
Indices Bay of Tunis
T1 T2 T3 T4 T5 T6
I2EC 2 1 1 0 4 0AMBI 2.8 2.3 1.1 1.5 2.4 0.9BENTIX 2.6 3.0 4.8 4.9 3.6 5.3ITI 12.9 31.6 44.5 73.4 44.7 62.3BOPA 0.51 0.00 0.00 0.00 0.86 �0.57BOPA-m 0.01379 0.00000 0.00000 0.00000 0.07155 0.0163
Indices Coast of Dkhila
D1 D2 D3 D4 D5 D6
I2EC 0 6 3 0 3 0AMBI 1.0 5.2 2.4 1.6 2.0 1.1BENTIX 5.2 2.2 3.6 4.7 4.7 5.3ITI 44.8 26.8 46.7 47.1 53.4 63.9BOPA �0.67 1.32 1.60 �0.16 0.59 1.10BOPA-m 0.01889 0.24144 0.14613 0.04611 0.06494 0.0511
point sources of pollutants, the degree of exposition, the watercirculation, the habitat type and the depth (Blanchet et al., 2008).The influence of each of these variables is difficult to isolate due tothe dynamics of water column and spatial variability of sedimentproperties existing in coastal ecosystems (Carvalho et al., 2006).
Overall, the spatial variability of the fauna synthetic parametersshows a certain difference among the three studied sites. Abun-dance, specific richness and Shannon–Wiener index are, onaverage, slightly lower in the Bizerte lagoon, and remarkablyhigher abundances are recorded at the D2 harbour area of SidiAbdel-Hamid (1520 ind m�2) and at D4 located more in the south(1020 ind m�2). However, equitability is significantly higher in theDkhila coast. Thus, the Bizerte lagoon seems more impoverished,and the Dkhila coast appears less dominated by the principalspecies. Moreover, the most important spatial fluctuations appearin the Dkhila coast which shows a high coefficient of variation forthe structural parameters (A, S and H0). The analysis of theseparameters, station by station, already shows the first signs ofdegradation. This is the case, notably, in the marine area underinfluence of the lagoon and the town of Bizerte (B11) and of theharbour areas of La Goulette (T1) and Sidi Abdel-Hamid (D2)where the Shannon–Wiener index and the equitability index arerelatively low. This situation becomes very critical in Sidi Abdel-Hamid port (D2) where abundance is very high and specificrichness is low. This shows that only some opportunistic species,like the polychaete S. fuliginosa, benefit from the situation andreach high densities, while other more sensitive species are rep-resented only by a few individuals (Margalef, 1968; Odum, 1969;Bigot et al., 2006).
Nevertheless, the interpretation of these results must take intoaccount the special conditions of the Bizerte lagoon, because it isa transitional area currently affected by many environmental vari-ables. It is influenced, at the same time, by seawater coming fromthe ship canal and also by freshwater coming from Ichkeul Lake andits large catchment area. Consequently, several additional factorscan influence the benthic macrofauna structural (Desroy et al.,2003), mainly extreme salinity and temperature, the fluctuation ofnutrient supply of continental origin and the slow rate of water
B7 B8 B9 B10 B11
1 1 0 0 51.1 0.7 0.4 0.0 1.65.6 6.0 6.0 6.0 5.9
56.7 76.9 62.7 50.1 64.10.00 0.00 0.00 0.00 0.42
8 0.00000 0.00000 0.00000 0.00000 0.01128
T7 T8 T9 T10 T11 T12
3 0 0 2 0 22.0 0.8 0.5 2.1 1.4 2.74.4 5.1 5.6 3.7 4.6 3.1
45.0 75.6 50.7 39.5 34.8 37.0�0.09 �1.17 0.00 0.06 0.00 1.08
9 0.01848 0.00420 0.00000 0.03189 0.00000 0.04949
D7 D8
0 00.7 0.65.4 5.5
47.7 35.0�1.16 0.00
5 0.00769 0.00000
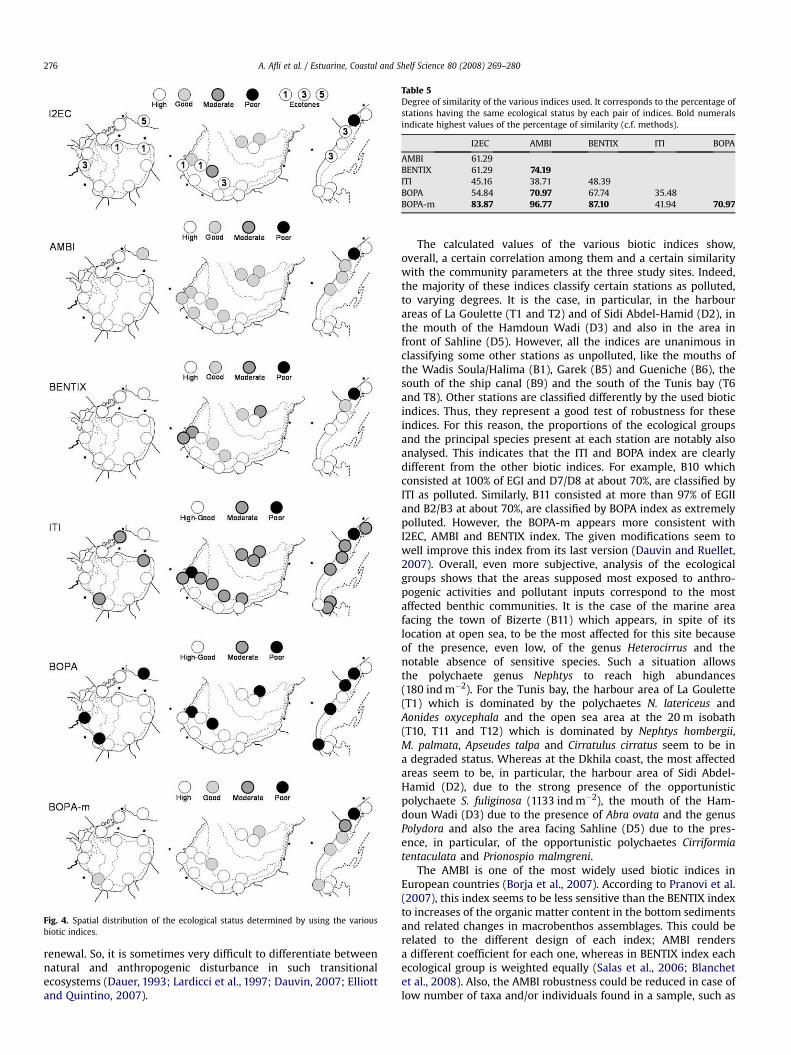
Fig. 4. Spatial distribution of the ecological status determined by using the variousbiotic indices.
Table 5Degree of similarity of the various indices used. It corresponds to the percentage ofstations having the same ecological status by each pair of indices. Bold numeralsindicate highest values of the percentage of similarity (c.f. methods).
I2EC AMBI BENTIX ITI BOPA
AMBI 61.29BENTIX 61.29 74.19ITI 45.16 38.71 48.39BOPA 54.84 70.97 67.74 35.48BOPA-m 83.87 96.77 87.10 41.94 70.97
A. Afli et al. / Estuarine, Coastal and Shelf Science 80 (2008) 269–280276
renewal. So, it is sometimes very difficult to differentiate betweennatural and anthropogenic disturbance in such transitionalecosystems (Dauer, 1993; Lardicci et al., 1997; Dauvin, 2007; Elliottand Quintino, 2007).
The calculated values of the various biotic indices show,overall, a certain correlation among them and a certain similaritywith the community parameters at the three study sites. Indeed,the majority of these indices classify certain stations as polluted,to varying degrees. It is the case, in particular, in the harbourareas of La Goulette (T1 and T2) and of Sidi Abdel-Hamid (D2), inthe mouth of the Hamdoun Wadi (D3) and also in the area infront of Sahline (D5). However, all the indices are unanimous inclassifying some other stations as unpolluted, like the mouths ofthe Wadis Soula/Halima (B1), Garek (B5) and Gueniche (B6), thesouth of the ship canal (B9) and the south of the Tunis bay (T6and T8). Other stations are classified differently by the used bioticindices. Thus, they represent a good test of robustness for theseindices. For this reason, the proportions of the ecological groupsand the principal species present at each station are notably alsoanalysed. This indicates that the ITI and BOPA index are clearlydifferent from the other biotic indices. For example, B10 whichconsisted at 100% of EGI and D7/D8 at about 70%, are classified byITI as polluted. Similarly, B11 consisted at more than 97% of EGIIand B2/B3 at about 70%, are classified by BOPA index as extremelypolluted. However, the BOPA-m appears more consistent withI2EC, AMBI and BENTIX index. The given modifications seem towell improve this index from its last version (Dauvin and Ruellet,2007). Overall, even more subjective, analysis of the ecologicalgroups shows that the areas supposed most exposed to anthro-pogenic activities and pollutant inputs correspond to the mostaffected benthic communities. It is the case of the marine areafacing the town of Bizerte (B11) which appears, in spite of itslocation at open sea, to be the most affected for this site becauseof the presence, even low, of the genus Heterocirrus and thenotable absence of sensitive species. Such a situation allowsthe polychaete genus Nephtys to reach high abundances(180 ind m�2). For the Tunis bay, the harbour area of La Goulette(T1) which is dominated by the polychaetes N. latericeus andAonides oxycephala and the open sea area at the 20 m isobath(T10, T11 and T12) which is dominated by Nephtys hombergii,M. palmata, Apseudes talpa and Cirratulus cirratus seem to be ina degraded status. Whereas at the Dkhila coast, the most affectedareas seem to be, in particular, the harbour area of Sidi Abdel-Hamid (D2), due to the strong presence of the opportunisticpolychaete S. fuliginosa (1133 ind m�2), the mouth of the Ham-doun Wadi (D3) due to the presence of Abra ovata and the genusPolydora and also the area facing Sahline (D5) due to the pres-ence, in particular, of the opportunistic polychaetes Cirriformiatentaculata and Prionospio malmgreni.
The AMBI is one of the most widely used biotic indices inEuropean countries (Borja et al., 2007). According to Pranovi et al.(2007), this index seems to be less sensitive than the BENTIX indexto increases of the organic matter content in the bottom sedimentsand related changes in macrobenthos assemblages. This could berelated to the different design of each index; AMBI rendersa different coefficient for each one, whereas in BENTIX index eachecological group is weighted equally (Salas et al., 2006; Blanchetet al., 2008). Also, the AMBI robustness could be reduced in case oflow number of taxa and/or individuals found in a sample, such as
A. Afli et al. / Estuarine, Coastal and Shelf Science 80 (2008) 269–280 277
the case of the Bizerte lagoon where the abundance is very low atsome stations.
In this study, the AMBI appears to be among the less severeindices since it classifies the majority of the stations in the threesites to be in an unpolluted status. For example, in the Bizertelagoon, only B11, located in open sea, is classed as being in a slightlypolluted status and all the others are considered unpolluted. In thisstudy, AMBI has the highest value of the degree of similarity withBOPA-m, which means that these indices are quite similar. More-over I2EC, AMBI and BENTIX index take into account all thecollected animals because all the collected species were assigned toecological groups. Whereas BOPA/BOPA-m and especially ITI basedrespectively on some taxonomic and trophic groups, take intoaccount only a part of them.
The BOPA index appears to be the most severe since only twoenvironmental statuses (unpolluted and extremely polluted) areestablished in the studied sites and 10 of the 31 sampled stations areclassified to be in an extremely polluted status. According to Blanchetet al. (2008), the BOPA index did not carry the same bias than the AMBIand BENTIX index because it is not based on the same ecologicalmodel of sensitivity/tolerance of species to increasing organic matter,but to assess the impact of oil spills on benthic invertebratecommunities (Gomez-Gesteira and Dauvin, 2000; Dauvin and Ruel-let, 2007). However, the BOPA-m appears to be the least severe since itclassifies only two stations in, respectively, moderate (D3) and poor(D2) statuses, and all the other sampled stations are classified to be inhigh-good status. Based on the frequencies of opportunistic poly-chaetes and amphipods only, the BOPA/BOPA-m is actually widelycriticized because, notably, the sensitivity to pollution for the sametaxonomic group differs from one species to another. While themajority of the amphipods, for example, are sensitive to pollution,certain species are on the contrary, tolerant like Dexamine spinosa,G. fucicola, Melita palmata and the genus Corophium (Borja et al.,2000; Glemarec, 2003). The main advantage of BOPA/BOPA-m is theireasiness to use compared to both AMBI and BENTIX because the needfor taxonomic knowledge is reduced. It is only necessary to recognizeamphipods and a reduced list of opportunistic polychaetes (Dauvinand Ruellet, 2007).
For the ITI which is based on predominance of the principaltrophic groups, certain significant differences, compared to theother indices, appear. For example, in the Bizerte lagoon, two of thethree stations considered by this index to be in a polluted status (B7and B10), are classified by the other indices to be in an unpollutedstatus and the third station (B3) is considered polluted only by theITI and BOPA index. These examples confirm that the ITI is lessconsistent with the other used indices. According to Salas et al.(2006), the ITI was always inefficient in pointing up disturbancesituations. In some cases and contrarily to what could be expectedin accordance to Word (1978), the ITI exhibited the highest valuesprecisely in the less organically enriched areas. On the other hand,according to Holling (1973), the settlement of the pioneer inver-tebrate populations in the sediments depends, in this first phase,only on physical–chemical factors and food resources available inthe area. Then, after adaptation, the populations reach highdensities, and various biotic interactions can be established amongthe populations. Thus, if the area is unpolluted, the trophic orga-nization of the communities can correctly reflect this statusbecause it depends primarily on the resources (food and space)available (Glemarec, 1993). However, in a polluted area, this inter-pretation is not always possible because other intrinsic character-istics of the species (resistance, tolerance and opportunism) canplay an interesting role.
All the indices based on ecological groups (I2EC, AMBI andBENTIX) and the BOPA-m seem to be quite similar in classifying thestudied stations, since their percentages of similarity is more than61%. I2EC seems to be more precise (Glemarec, 2003; Dauvin et al.,
2007). It comprises, in all, eight classes of degradation and ischaracterized by ecotones, recognizable by the joint use ofpredominance of the different ecological groups and also of thetotal abundance of the community. However, the problemencountered in the application of this index, I2EC, lies in the diffi-culty in assigning an index value in some cases where predomi-nance of the ecological groups do not correspond exactly to theboundary limits defined by the method (Bazairi et al., 2005).Moreover, the identification of the ecotones raises certain difficul-ties. The threshold of which an abundance value is considered verylow cannot be universal and applicable to all the various marinegeographical areas of our planet because it depends also on severalother factors, in particular the availability of the food resources(Glemarec, 1993). A very low abundance of a community can berelated to a very low availability of food resources and not neces-sarily to severe pollution.
The comparison of the indices used must take into account thatthose based on ecological groups are dependent on the Pearson–Rosenberg model and were, thus, related with the gradient oforganic matter content (Labrune et al., 2006; Quintino et al., 2006;Pranovi et al., 2007; Blanchet et al., 2008; Munari and Mistri, 2008).Thus, Grall and Glemarec (1997), Muxika et al. (2005) and Carvalhoet al. (2006) note that the increase in organic matter content isassociated with the dominance of opportunistic species, which inthe case of group V are capable of proliferating in reduced sedi-ments and can also tolerate toxic conditions. However, metals arenot related to the biotic indices based on ecological groups (Car-valho et al., 2006; Quintino et al., 2006), and the positive correla-tions often observed with certain contaminants may be the result ofthe preferential association of metals with fine sediments (Windomet al., 1989). Thus, biotic indices must be validated for otherstressors such as physical disturbance and chemical pollution(Labrune et al., 2006). Also, to be really inter-comparable, they mustundergo an inter-calibration by determining the degree of agree-ment among used methodologies (Borja et al., 2007, 2008; Blanchetet al., 2008; Borja and Dauer, 2008; Weisberg et al., 2008). Thisconsists, essentially, to well-fix the boundaries among the variousstatuses for every index. As example, the re-examination of theBOPA index has clearly improved its consistence with the otherindices, notably with those used in the context of the WFD (Dauvinand Ruellet, 2007).
An ideal method would consist in assigning to each speciesa ‘‘reasonable’’ coefficient depending on its sensitivity in responseto pollution conditions. This is because even sensitive species, forexample, are not, all, equally sensitive to all types of anthropo-genic disturbances and thus are likely to respond differently tovarious types of perturbations (Dauvin et al., 2007; Pranovi et al.,2007). Then, an average value calculated per species could bemore rigorous and more judicious concerning the status of thecommunity. In order to reach a wide consensus on the adoption ofsuch a method, it is necessary to assign a suitable coefficientagreed by all scientists to all benthic macrofauna species, eventhose which are rare, limited to small geographical areas or moreabundant in some areas than others. Lacking an ideal method, thejoint use of several indices can give better results and preferen-tially in association with community parameters (Llanso andDauer, 2002; Borja and Muxika, 2005; Muniz et al., 2005; Muxikaet al., 2005; Rogers and Greenaway, 2005; Labrune et al., 2006;Dauvin et al., 2007).
The variation of organic matter contained in the sediments, showsthe existence of a strong correlation between total organic mattercontent and muds. The majority of stations, classified by the indicesand the calculated parameters as polluted, are located at the top ofthe straight regression line. They correspond in particular to thevicinities of the marine areas under the influence of the town ofBizerte (B11), of the mouth of the Hamdoun Wadi (D3) and of the
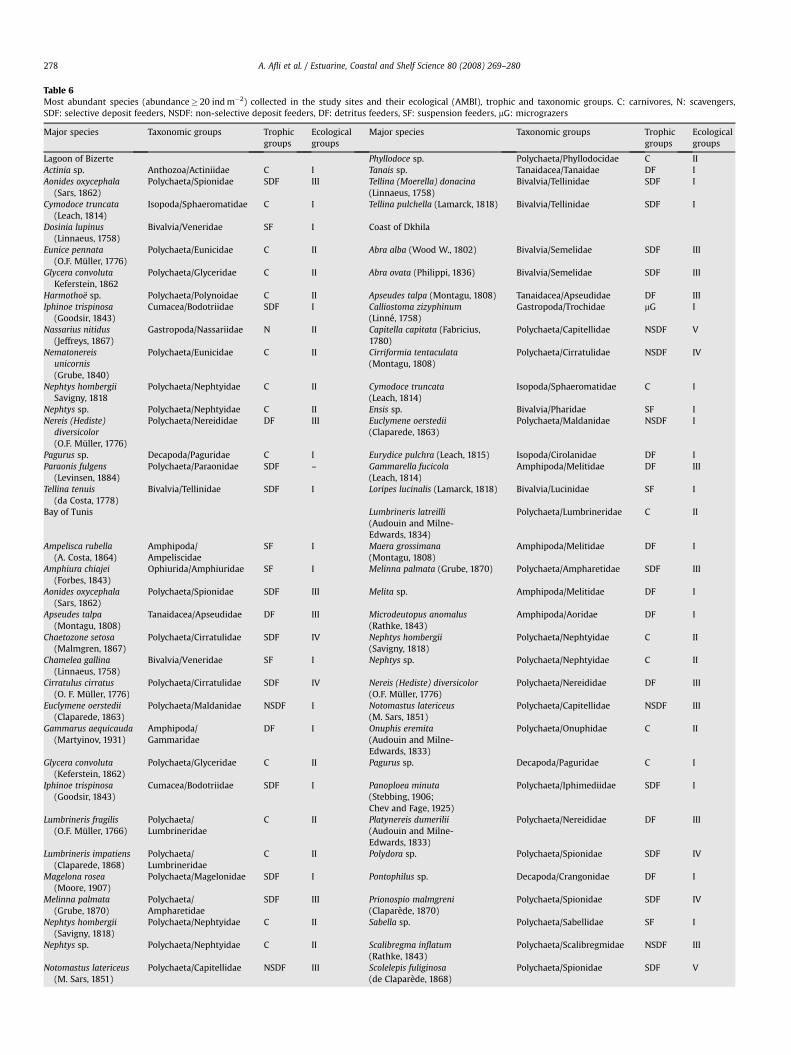
Table 6Most abundant species (abundance� 20 ind m�2) collected in the study sites and their ecological (AMBI), trophic and taxonomic groups. C: carnivores, N: scavengers,SDF: selective deposit feeders, NSDF: non-selective deposit feeders, DF: detritus feeders, SF: suspension feeders, mG: micrograzers
Major species Taxonomic groups Trophicgroups
Ecologicalgroups
Major species Taxonomic groups Trophicgroups
Ecologicalgroups
Lagoon of Bizerte Phyllodoce sp. Polychaeta/Phyllodocidae C IIActinia sp. Anthozoa/Actiniidae C I Tanais sp. Tanaidacea/Tanaidae DF IAonides oxycephala
(Sars, 1862)Polychaeta/Spionidae SDF III Tellina (Moerella) donacina
(Linnaeus, 1758)Bivalvia/Tellinidae SDF I
Cymodoce truncata(Leach, 1814)
Isopoda/Sphaeromatidae C I Tellina pulchella (Lamarck, 1818) Bivalvia/Tellinidae SDF I
Dosinia lupinus(Linnaeus, 1758)
Bivalvia/Veneridae SF I Coast of Dkhila
Eunice pennata(O.F. Muller, 1776)
Polychaeta/Eunicidae C II Abra alba (Wood W., 1802) Bivalvia/Semelidae SDF III
Glycera convolutaKeferstein, 1862
Polychaeta/Glyceridae C II Abra ovata (Philippi, 1836) Bivalvia/Semelidae SDF III
Harmothoe sp. Polychaeta/Polynoidae C II Apseudes talpa (Montagu, 1808) Tanaidacea/Apseudidae DF IIIIphinoe trispinosa
(Goodsir, 1843)Cumacea/Bodotriidae SDF I Calliostoma zizyphinum
(Linne, 1758)Gastropoda/Trochidae mG I
Nassarius nitidus(Jeffreys, 1867)
Gastropoda/Nassariidae N II Capitella capitata (Fabricius,1780)
Polychaeta/Capitellidae NSDF V
Nematonereisunicornis(Grube, 1840)
Polychaeta/Eunicidae C II Cirriformia tentaculata(Montagu, 1808)
Polychaeta/Cirratulidae NSDF IV
Nephtys hombergiiSavigny, 1818
Polychaeta/Nephtyidae C II Cymodoce truncata(Leach, 1814)
Isopoda/Sphaeromatidae C I
Nephtys sp. Polychaeta/Nephtyidae C II Ensis sp. Bivalvia/Pharidae SF INereis (Hediste)
diversicolor(O.F. Muller, 1776)
Polychaeta/Nereididae DF III Euclymene oerstedii(Claparede, 1863)
Polychaeta/Maldanidae NSDF I
Pagurus sp. Decapoda/Paguridae C I Eurydice pulchra (Leach, 1815) Isopoda/Cirolanidae DF IParaonis fulgens
(Levinsen, 1884)Polychaeta/Paraonidae SDF – Gammarella fucicola
(Leach, 1814)Amphipoda/Melitidae DF III
Tellina tenuis(da Costa, 1778)
Bivalvia/Tellinidae SDF I Loripes lucinalis (Lamarck, 1818) Bivalvia/Lucinidae SF I
Bay of Tunis Lumbrineris latreilli(Audouin and Milne-Edwards, 1834)
Polychaeta/Lumbrineridae C II
Ampelisca rubella(A. Costa, 1864)
Amphipoda/Ampeliscidae
SF I Maera grossimana(Montagu, 1808)
Amphipoda/Melitidae DF I
Amphiura chiajei(Forbes, 1843)
Ophiurida/Amphiuridae SF I Melinna palmata (Grube, 1870) Polychaeta/Ampharetidae SDF III
Aonides oxycephala(Sars, 1862)
Polychaeta/Spionidae SDF III Melita sp. Amphipoda/Melitidae DF I
Apseudes talpa(Montagu, 1808)
Tanaidacea/Apseudidae DF III Microdeutopus anomalus(Rathke, 1843)
Amphipoda/Aoridae DF I
Chaetozone setosa(Malmgren, 1867)
Polychaeta/Cirratulidae SDF IV Nephtys hombergii(Savigny, 1818)
Polychaeta/Nephtyidae C II
Chamelea gallina(Linnaeus, 1758)
Bivalvia/Veneridae SF I Nephtys sp. Polychaeta/Nephtyidae C II
Cirratulus cirratus(O. F. Muller, 1776)
Polychaeta/Cirratulidae SDF IV Nereis (Hediste) diversicolor(O.F. Muller, 1776)
Polychaeta/Nereididae DF III
Euclymene oerstedii(Claparede, 1863)
Polychaeta/Maldanidae NSDF I Notomastus latericeus(M. Sars, 1851)
Polychaeta/Capitellidae NSDF III
Gammarus aequicauda(Martyinov, 1931)
Amphipoda/Gammaridae
DF I Onuphis eremita(Audouin and Milne-Edwards, 1833)
Polychaeta/Onuphidae C II
Glycera convoluta(Keferstein, 1862)
Polychaeta/Glyceridae C II Pagurus sp. Decapoda/Paguridae C I
Iphinoe trispinosa(Goodsir, 1843)
Cumacea/Bodotriidae SDF I Panoploea minuta(Stebbing, 1906;Chev and Fage, 1925)
Polychaeta/Iphimediidae SDF I
Lumbrineris fragilis(O.F. Muller, 1766)
Polychaeta/Lumbrineridae
C II Platynereis dumerilii(Audouin and Milne-Edwards, 1833)
Polychaeta/Nereididae DF III
Lumbrineris impatiens(Claparede, 1868)
Polychaeta/Lumbrineridae
C II Polydora sp. Polychaeta/Spionidae SDF IV
Magelona rosea(Moore, 1907)
Polychaeta/Magelonidae SDF I Pontophilus sp. Decapoda/Crangonidae DF I
Melinna palmata(Grube, 1870)
Polychaeta/Ampharetidae
SDF III Prionospio malmgreni(Claparede, 1870)
Polychaeta/Spionidae SDF IV
Nephtys hombergii(Savigny, 1818)
Polychaeta/Nephtyidae C II Sabella sp. Polychaeta/Sabellidae SF I
Nephtys sp. Polychaeta/Nephtyidae C II Scalibregma inflatum(Rathke, 1843)
Polychaeta/Scalibregmidae NSDF III
Notomastus latericeus(M. Sars, 1851)
Polychaeta/Capitellidae NSDF III Scolelepis fuliginosa(de Claparede, 1868)
Polychaeta/Spionidae SDF V
A. Afli et al. / Estuarine, Coastal and Shelf Science 80 (2008) 269–280278
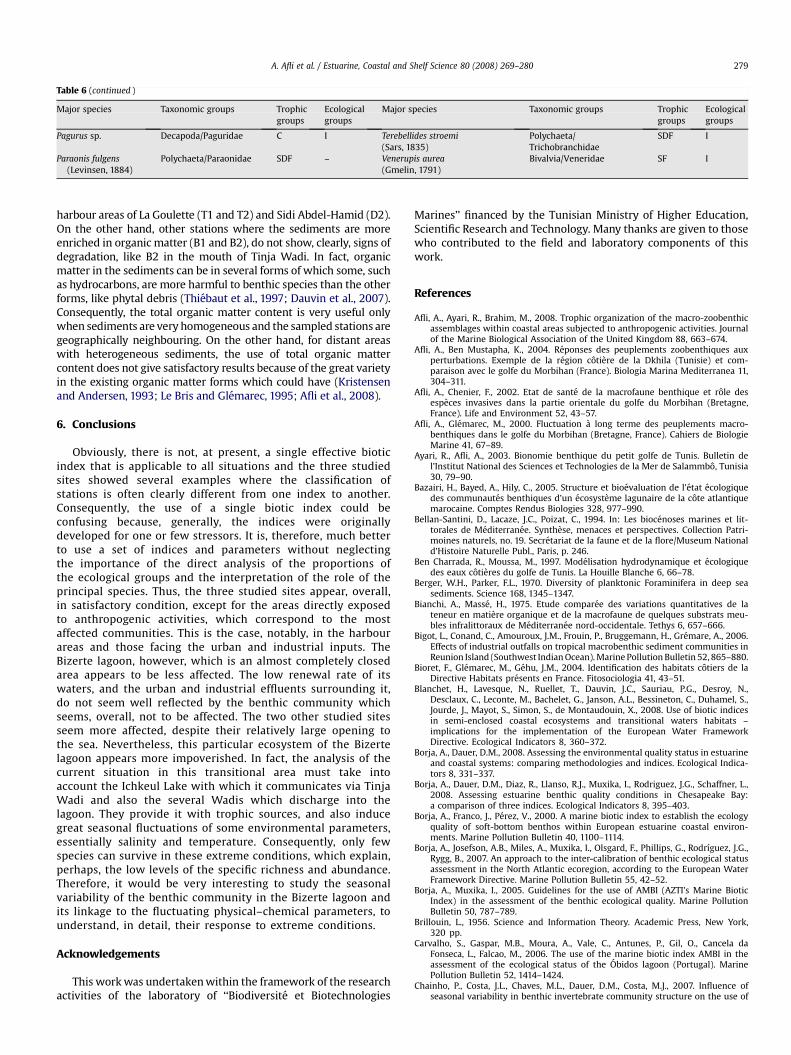
Table 6 (continued )
Major species Taxonomic groups Trophicgroups
Ecologicalgroups
Major species Taxonomic groups Trophicgroups
Ecologicalgroups
Pagurus sp. Decapoda/Paguridae C I Terebellides stroemi(Sars, 1835)
Polychaeta/Trichobranchidae
SDF I
Paraonis fulgens(Levinsen, 1884)
Polychaeta/Paraonidae SDF – Venerupis aurea(Gmelin, 1791)
Bivalvia/Veneridae SF I
A. Afli et al. / Estuarine, Coastal and Shelf Science 80 (2008) 269–280 279
harbour areas of La Goulette (T1 and T2) and Sidi Abdel-Hamid (D2).On the other hand, other stations where the sediments are moreenriched in organic matter (B1 and B2), do not show, clearly, signs ofdegradation, like B2 in the mouth of Tinja Wadi. In fact, organicmatter in the sediments can be in several forms of which some, suchas hydrocarbons, are more harmful to benthic species than the otherforms, like phytal debris (Thiebaut et al., 1997; Dauvin et al., 2007).Consequently, the total organic matter content is very useful onlywhen sediments are very homogeneous and the sampled stations aregeographically neighbouring. On the other hand, for distant areaswith heterogeneous sediments, the use of total organic mattercontent does not give satisfactory results because of the great varietyin the existing organic matter forms which could have (Kristensenand Andersen, 1993; Le Bris and Glemarec, 1995; Afli et al., 2008).
6. Conclusions
Obviously, there is not, at present, a single effective bioticindex that is applicable to all situations and the three studiedsites showed several examples where the classification ofstations is often clearly different from one index to another.Consequently, the use of a single biotic index could beconfusing because, generally, the indices were originallydeveloped for one or few stressors. It is, therefore, much betterto use a set of indices and parameters without neglectingthe importance of the direct analysis of the proportions ofthe ecological groups and the interpretation of the role of theprincipal species. Thus, the three studied sites appear, overall,in satisfactory condition, except for the areas directly exposedto anthropogenic activities, which correspond to the mostaffected communities. This is the case, notably, in the harbourareas and those facing the urban and industrial inputs. TheBizerte lagoon, however, which is an almost completely closedarea appears to be less affected. The low renewal rate of itswaters, and the urban and industrial effluents surrounding it,do not seem well reflected by the benthic community whichseems, overall, not to be affected. The two other studied sitesseem more affected, despite their relatively large opening tothe sea. Nevertheless, this particular ecosystem of the Bizertelagoon appears more impoverished. In fact, the analysis of thecurrent situation in this transitional area must take intoaccount the Ichkeul Lake with which it communicates via TinjaWadi and also the several Wadis which discharge into thelagoon. They provide it with trophic sources, and also inducegreat seasonal fluctuations of some environmental parameters,essentially salinity and temperature. Consequently, only fewspecies can survive in these extreme conditions, which explain,perhaps, the low levels of the specific richness and abundance.Therefore, it would be very interesting to study the seasonalvariability of the benthic community in the Bizerte lagoon andits linkage to the fluctuating physical–chemical parameters, tounderstand, in detail, their response to extreme conditions.
Acknowledgements
This work was undertaken within the framework of the researchactivities of the laboratory of ‘‘Biodiversite et Biotechnologies
Marines’’ financed by the Tunisian Ministry of Higher Education,Scientific Research and Technology. Many thanks are given to thosewho contributed to the field and laboratory components of thiswork.
References
Afli, A., Ayari, R., Brahim, M., 2008. Trophic organization of the macro-zoobenthicassemblages within coastal areas subjected to anthropogenic activities. Journalof the Marine Biological Association of the United Kingdom 88, 663–674.
Afli, A., Ben Mustapha, K., 2004. Reponses des peuplements zoobenthiques auxperturbations. Exemple de la region cotiere de la Dkhila (Tunisie) et com-paraison avec le golfe du Morbihan (France). Biologia Marina Mediterranea 11,304–311.
Afli, A., Chenier, F., 2002. Etat de sante de la macrofaune benthique et role desespeces invasives dans la partie orientale du golfe du Morbihan (Bretagne,France). Life and Environment 52, 43–57.
Afli, A., Glemarec, M., 2000. Fluctuation a long terme des peuplements macro-benthiques dans le golfe du Morbihan (Bretagne, France). Cahiers de BiologieMarine 41, 67–89.
Ayari, R., Afli, A., 2003. Bionomie benthique du petit golfe de Tunis. Bulletin del’Institut National des Sciences et Technologies de la Mer de Salammbo, Tunisia30, 79–90.
Bazairi, H., Bayed, A., Hily, C., 2005. Structure et bioevaluation de l’etat ecologiquedes communautes benthiques d’un ecosysteme lagunaire de la cote atlantiquemarocaine. Comptes Rendus Biologies 328, 977–990.
Bellan-Santini, D., Lacaze, J.C., Poizat, C., 1994. In: Les biocenoses marines et lit-torales de Mediterranee. Synthese, menaces et perspectives. Collection Patri-moines naturels, no. 19. Secretariat de la faune et de la flore/Museum Nationald’Histoire Naturelle Publ., Paris, p. 246.
Ben Charrada, R., Moussa, M., 1997. Modelisation hydrodynamique et ecologiquedes eaux cotieres du golfe de Tunis. La Houille Blanche 6, 66–78.
Berger, W.H., Parker, F.L., 1970. Diversity of planktonic Foraminifera in deep seasediments. Science 168, 1345–1347.
Bianchi, A., Masse, H., 1975. Etude comparee des variations quantitatives de lateneur en matiere organique et de la macrofaune de quelques substrats meu-bles infralittoraux de Mediterranee nord-occidentale. Tethys 6, 657–666.
Bigot, L., Conand, C., Amouroux, J.M., Frouin, P., Bruggemann, H., Gremare, A., 2006.Effects of industrial outfalls on tropical macrobenthic sediment communities inReunion Island (Southwest Indian Ocean). Marine Pollution Bulletin 52, 865–880.
Bioret, F., Glemarec, M., Gehu, J.M., 2004. Identification des habitats cotiers de laDirective Habitats presents en France. Fitosociologia 41, 43–51.
Blanchet, H., Lavesque, N., Ruellet, T., Dauvin, J.C., Sauriau, P.G., Desroy, N.,Desclaux, C., Leconte, M., Bachelet, G., Janson, A.L., Bessineton, C., Duhamel, S.,Jourde, J., Mayot, S., Simon, S., de Montaudouin, X., 2008. Use of biotic indicesin semi-enclosed coastal ecosystems and transitional waters habitats –implications for the implementation of the European Water FrameworkDirective. Ecological Indicators 8, 360–372.
Borja, A., Dauer, D.M., 2008. Assessing the environmental quality status in estuarineand coastal systems: comparing methodologies and indices. Ecological Indica-tors 8, 331–337.
Borja, A., Dauer, D.M., Diaz, R., Llanso, R.J., Muxika, I., Rodriguez, J.G., Schaffner, L.,2008. Assessing estuarine benthic quality conditions in Chesapeake Bay:a comparison of three indices. Ecological Indicators 8, 395–403.
Borja, A., Franco, J., Perez, V., 2000. A marine biotic index to establish the ecologyquality of soft-bottom benthos within European estuarine coastal environ-ments. Marine Pollution Bulletin 40, 1100–1114.
Borja, A., Josefson, A.B., Miles, A., Muxika, I., Olsgard, F., Phillips, G., Rodrıguez, J.G.,Rygg, B., 2007. An approach to the inter-calibration of benthic ecological statusassessment in the North Atlantic ecoregion, according to the European WaterFramework Directive. Marine Pollution Bulletin 55, 42–52.
Borja, A., Muxika, I., 2005. Guidelines for the use of AMBI (AZTI’s Marine BioticIndex) in the assessment of the benthic ecological quality. Marine PollutionBulletin 50, 787–789.
Brillouin, L., 1956. Science and Information Theory. Academic Press, New York,320 pp.
Carvalho, S., Gaspar, M.B., Moura, A., Vale, C., Antunes, P., Gil, O., Cancela daFonseca, L., Falcao, M., 2006. The use of the marine biotic index AMBI in theassessment of the ecological status of the Obidos lagoon (Portugal). MarinePollution Bulletin 52, 1414–1424.
Chainho, P., Costa, J.L., Chaves, M.L., Dauer, D.M., Costa, M.J., 2007. Influence ofseasonal variability in benthic invertebrate community structure on the use of
A. Afli et al. / Estuarine, Coastal and Shelf Science 80 (2008) 269–280280
biotic indices to assess the ecological status of a Portuguese estuary. MarinePollution Bulletin 54, 1586–1597.
Chapman, P.M., 1996. Presentation and interpretation of sediment quality triad data.Ecotoxicology 5, 327–339.
Chasse, C., Glemarec, M., 1976. Principes generaux de la classification des fondspour la cartographie sedimentaire. Journal de Recherche Oceanographique 1,1–12.
Chıcharo,L.,Chıcharo,A., Gaspar, M., Alves, F.,Regala, J., 2002. Ecologicalcharacterizationof dredged and non-dredged bivalve fishing areas off south Portugal. Journal of theMarine Biological Association of the United Kingdom 82, 41–50.
Comeleo, R.L., Paul, J.F., August, P.V., Copeland, J., Baker, C., Hale, S.S., Latimer, R.L.,1996. Relationships between watershed stressors and sediment contaminationin Chesapeake Bay estuaries. Landscape Ecology 11, 307–319.
Dauer, D.M., 1993. Biological criteria, environmental health and estuarine macro-benthic community structure. Marine Pollution Bulletin 26, 249–257.
Dauer, D.M., Weisberg, S.B., Ranasinghe, J.A., 2000. Relationships between benthiccommunity condition, water quality, sediment quality, nutrient loads, and landuse patterns in Chesapeake Bay. Estuaries 23, 80–96.
Dauvin, J.C., 2007. Paradox of estuarine quality: benthic indicators and indices,consensus or debate for the future. Marine Pollution Bulletin 55, 271–281.
Dauvin, J.C., Ruellet, T., 2007. Polychaete/amphipod ratio revisited. Marine PollutionBulletin 55, 215–224.
Dauvin, J.C., Ruellet, T., Desroy, N., Janson, A.L., 2007. The ecological quality status ofthe Bay of Seine and the Seine estuary: use of biotic indices. Marine PollutionBulletin 55, 241–257.
Dellali, M., Elbour, M., Aıssa, P., 2001. Evaluation de la pollution bacterienne dans lalagune de Bizerte: Resultats preliminaires. Journal de Recherche Ocean-ographique 26, 18–28.
Desrosiers, G., Bellan-Santini, D., Brethes, J.C., 1986. Organisation trophique dequatre peuplements de substrats rocheux selon un gradient de pollutionindustrielle (Golfe de Fos, France). Marine Biology 91, 107–120.
Desroy, N., Warembourg, C., Dewarumez, J.M., Dauvin, J.C., 2003. Macrobenthicresources of the shallow soft-bottom sediments in the Eastern English Channeland southern North Sea. ICES Journal of Sea Research 60, 120–131.
Elliott, M., Quintino, V., 2007. Estuarine quality paradox, environmental homeo-stasis and the difficulty of detecting anthropogenic stress in naturally stressedareas. Marine Pollution Bulletin 54, 640–645.
Elmgren, E., Hansson, S., Larsson, U., Sundelin, B., Boehm, P.D., 1983. The ‘thesis’oil spill: acute and long term impact on the benthos. Marine Biology 73,51–65.
Essid, N., Aissa, P., 2002. Etude quantitative des nematodes libres des secteurs Nordet Est de la lagune de Bizerte (Tunisie). Bulletin de l’Institut National desSciences et Technologies de la Mer de Salammbo, Tunisia 29, 53–63.
Fauchald, K., Jumars, P.A., 1979. The diet of worms: a study of Polychaete feedingguilds. Oceanography and Marine Biology an Annual Review 17, 173–284.
Glemarec, M., 1993. Variabilite temporelle des systemes littoraux. Journal deRecherche Oceanographique 18, 19–23.
Glemarec, M., 2003. Les indices biotiques en milieu sedimentaire. In: Alzieu, C. (Ed.),Bioevaluation de la qualite environnementale des sediments portuaires et deszones d’immersion. Edition Ifremer, pp. 31–50.
Glemarec, M., Hily, C., 1981. Perturbations apportees a la macrofaune benthique dela baie de Concarneau par les effluents urbains et portuaires. Acta OecologicaOecologia Applicata 2, 139–150.
Gomez-Gesteira, J.L., Dauvin, J.C., 2000. Amphipods are good bioindicators of theimpact of oil spills on soft-bottom macrobenthic communities. Marine PollutionBulletin 40, 1017–1027.
Grall, J., Glemarec, M., 1997. Using biotic indices to estimate macrobenthiccommunity perturbations in the bay of Brest. Estuarine, Coastal and ShelfScience 44 (Suppl. A), 43–53.
Grall, J., Glemarec, M., 2003. L’indice d’evaluation de l’endofaune cotiere. In:Alzieu, C. (Ed.), Bioevaluation de la qualite environnementale des sedimentsportuaires et des zones d’immersion. Edition Ifremer, pp. 51–85.
Grall, J., Glemarec, M., 2005. The I2EC, index for evaluation of the coastal endo-fauna. In: Alzieu, C. (Ed.), Dredging and Marine Environment. Edition Ifremer,pp. 79–93.
Gray, J.S., 1979. Pollution-induced changes in populations. Philosophical Trans-actions of the Royal Society of London 286, 545–561.
Harzallah, A., 2003. Transport de polluants dans la lagune de Bizerte simule par unmodele de circulation de l’eau. Bulletin de l’Institut National des Sciences etTechnologies de la Mer de Salammbo, Tunisia 30, 121–133.
Holling, C.S., 1973. Resilience and stability of ecological systems. Annual Review ofEcology and Systematics 4, 1–24.
Holme, N.A., McIntyre, D.A., 1984. Methods for the Study of Marine Benthos, seconded., no. 16. Blackwell Scientific Publications, Oxford, 387 pp.
Kristensen, E., Andersen, F.O., 1993. Determination of organic carbon in marinesediments: a comparison of two CHN-analyzer methods. Journal of Experi-mental Marine Biology and Ecology 109, 15–23.
Labrune, C., Amouroux, J.M., Sarda, R., Dutrieux, E., Thorin, S., Rosenberg, R.,Gremare, A., 2006. Characterization of the ecological quality of the coastal Gulfof Lions (NW Mediterranean). A comparative approach based on three bioticindices. Marine Pollution Bulletin 52, 34–47.
Lardicci, C., Rossi, F., Castelli, A., 1997. Analysis of macrozoobenthic communitystructure after severe dystrophic crises in a Mediterranean coastal lagoon.Marine Pollution Bulletin 34, 536–547.
Laubier, L., 1991. Les marees noires. Consequences a long terme. La Recherche 22,814–823.
Le Bris, H., Glemarec, M., 1995. Les peuplements macrozoobenthiques d’un eco-systeme cotier sous-sature en oxygene: la baie de Vilaine (sud-Bretagne).Oceanologica Acta 18, 573–581.
Llanso, R.J., Dauer, D.M., 2002. Methods for calculating the Chesapeake Bay BenthicIndex of Biotic Integrity (Final Report, Chesapeake Bay Benthic MonitoringProgram, p. 24). In: Dauvin, J.C., Ruellet, T., Desroy, N., Janson, A.L. (Eds.), TheEcological Quality Status of the Bay of Seine and the Seine estuary: Use of BioticIndices. Marine Pollution Bulletin, 55, pp. 241–257.
Margalef, R., 1968. Perspectives in Ecological Theory. In: Chicago Series in Biology.University of Chicago Press, 11 pp.
McIntosh, R.P., 1967. An index of diversity and the relation of certain concepts todiversity. Ecology 48, 392–404.
Mearns, A.J., Word, J.Q., 1982. Forecasting effects of sewage solids on marine benthiccommunities. In: SEPA (2006), Regulation and Monitoring of Marine Cage FishFarming in Scotland – a Procedures Manual Standard Baseline Survey APS STDBASE 001. Scottish Environment Protection Agency, Stirling, UK, pp. 1–10.
Mistri, M., Munari, C., Rossi, R., Marchini, A., 2007. Response of a Fuzzy INdex ofEcosystem integrity (FINE) to water and sedimentary chemical data in twonorthern Adriatic lagoons. Chemistry and Ecology 23, 443–454.
Munari, C., Mistri, M., 2008. The performance of benthic indicators of ecologicalchange in Adriatic coastal lagoons: throwing the baby with the water. MarinePollution Bulletin 56, 95–105.
Muniz, P., Venturini, N., Pires-Vanin, A.M.S., Tommasi, L.R., Borja, A., 2005. Testingthe applicability of a Marine Biotic Index (AMBI) to assessing the ecologicalquality of softbottom benthic communities, in the south America Atlanticregion. Marine Pollution Bulletin 50, 624–637.
Muxika, I., Borja, A., Bonne, W., 2005. The suitability of the marine biotic index(AMBI) to new impact sources along European coasts. Ecological Indicators 5,19–31.
Odum, E.P., 1969. The strategy of ecosystem development. Science 1964, 262–270.Pearson, T., Rosenberg, R., 1978. Macrobenthic succession in relation to organic
enrichment and pollution of the marine environment. Oceanography andMarine Biology an Annual Review 16, 229–311.
Pielou, E.C., 1966. Shannon’s formula as a measure of specific diversity: its use andmeasure. American Naturalist 100, 463–465.
Pranovi, F., Da Ponte, F., Torricelli, P., 2007. Application of biotic indices and rela-tionship with structural and functional features of macrobenthic community inthe lagoon of Venice: an example over a long time series of data. MarinePollution Bulletin 54, 1607–1618.
Pusceddu, A., Gambi, C., Manini, E., Danovaro, R., 2007. Trophic state, ecosystemefficiency and biodiversity of transitional aquatic ecosystems: analysis ofenvironmental quality based on different benthic indicators. Chemistry andEcology 23, 505–515.
Quintino, V., Elliott, M., Rodrigues, A.M., 2006. The derivation, performance and roleof univariate and multivariate indicators of benthic change: case studies atdiffering spatial scales. Journal of Experimental Marine Biology and Ecology330, 368–382.
Reish, D.J., 1955. The Relation of Polychaetous Annelids to Harbor Pollution. UnitedStates Public Health Reports. vol. 70. Washington, pp. 1168–1174.
Rogers, S.I., Greenaway, B., 2005. A UK perspective of the development of marineecosystem indicators. Marine Pollution Bulletin 50, 9–19.
Rosenberg, R., Blomqvist, M., Nilsson, H.C., Cederwall, H., Dimming, A., 2004. Marinequality assessment by use of benthic species-abundance distributions:a proposed new protocol within the European Union Water FrameworkDirective. Marine Pollution Bulletin 49, 728–739.
Sakka Hlaili, A., Chikhaoui, M.A., El Grami, B., Hadj Mabrouk, H., 2003. Variationhivernoestivale de la communaute phytoplanctonique de la lagune de Bizerteen milieux naturel et fertilise en nutriments. Revue de la Faculte des Sciencesde Bizerte, Tunisia 2, 37–49.
Salas, F., Marcos, C., Neto, J.M., Patricio, J., Perez-Ruzafa, A., Marques, J.C., 2006. User-friendly guide for using benthic ecological indicators in coastal and marinequality assessment. Ocean & Coastal Management 49, 308–331.
Sanders, H.L., 1968. Marine benthic diversity: a comparative study. AmericanNaturalist 102, 243–282.
Shannon, F.P., Weaver, W., 1963. The Mathematical Theory of Communication.University Illinois Press, Urbana, 117 pp.
Simboura, N., Zenetos, A., 2002. Benthic indicators to use in ecological qualityclassification of Mediterranean soft bottom marine ecosystems, including a newbiotic index. Mediterranean Marine Science 3, 77–111.
Thiebaut, E., Cabioch, L., Dauvin, J.C., Retiere, C., Gentil, F., 1997. Spatio-temporalpersistence of the Abra alba–Pectinaria koreni muddy-fine sand community ofthe eastern Bay of Seine. Journal of the Marine Biological Association of theUnited Kingdom 77, 1165–1185.
Weisberg, S.B., Ranasinghe, J.A., Dauer, D.M., Schaffner, L.C., Dıaz, R.J., Frithsen, J.B.,1997. An estuarine benthic index of biotic integrity (B–BI) for Chesapeake Bay.Estuaries 20, 149–158.
Weisberg, S.B., Thompson, B., Ranasinghe, J.A., Montagne, D.E., Cadien, D.B.,Dauer, D.M., Diener, D., Oliver, J., Reish, D.J., Velarde, R.G., Word, J.Q., 2008. Thelevel of agreement among experts applying best professional judgment to assessthe condition of benthic infaunal communities. Ecological Indicators 8, 389–394.
Windom, H.L., Schropp, S.J., Calder, F.D., Ryan, J.D., Smith, R.G., Burney, L.C.,Lewis, F.G., Rawlinson, C.H., 1989. Natural trace metal concentration in estuarineand coastal marine sediments of the southeastern United States. EnvironmentalScience and Technology 23, 314–320.
Word, J.Q., 1978. The infaunal trophic index. Southern California Coastal WaterResearch Project Annual Report, 19–39.