Embed Size (px)
Citation preview
I. Levels of Study ● Ecology: Figure 1: Levels of Study
Important Terms ● Population: describes all of the individuals of a particular species in a place at a given time. ● Community: describes all of the different populations in a place at a given time. ● Ecosystem: a community in addition to the nonliving (abiotic) factors of the environment (soil, water, light, etc). ● Biome: describes wide geographic region that is characterized by the same climatic factors leading to the establishment of specific plant & animal species (e.g. rainforests, desserts, grasslands, etc). ● Biosphere: represents the layer of the Earth in which all living things exist.
II. Population Ecology ● Habitat: Studying Populations: Distribution Patterns ● When an ecologist goes out to study a certain population some things that need to be determined are the population’s distribution pattern, density, and growth rate.
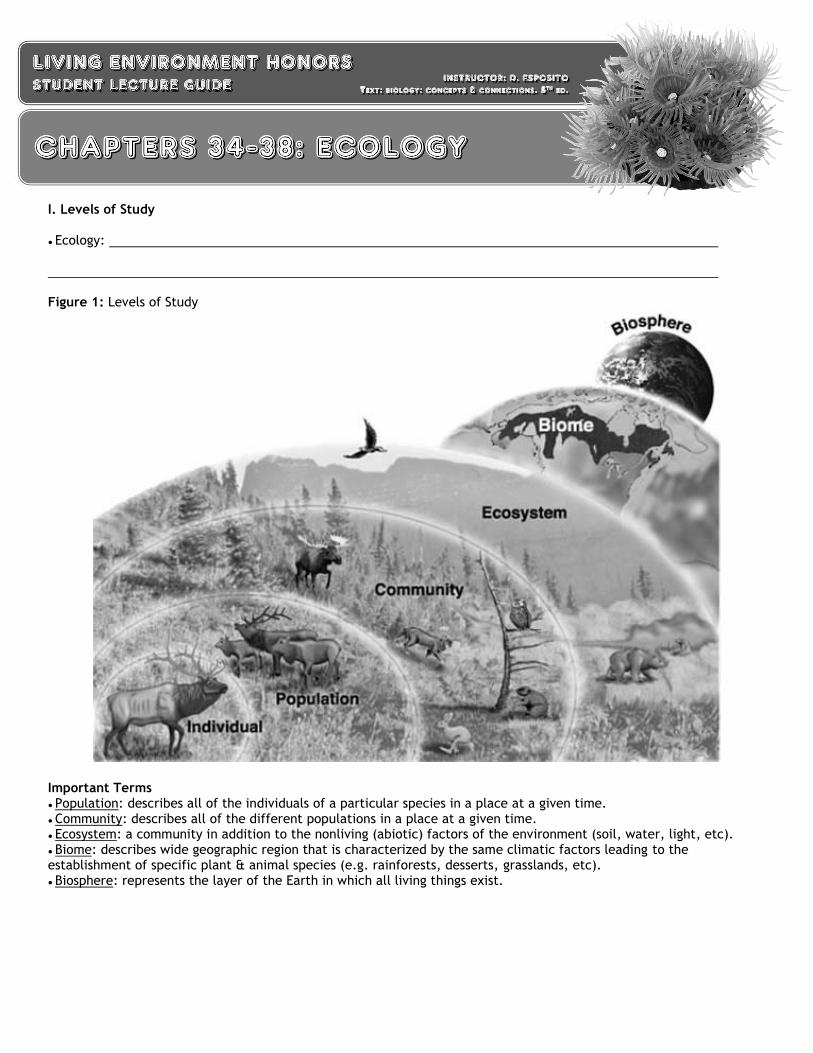
● If you mark on a map the location of each member of a population you will be able to see the population’s distribution pattern. There are three typical patterns. The first is called Random. If members of the population are found at no predictable point in their habitat then their distribution pattern is random. This suggests that the habitat has abundant resources throughout.
Figure 2: Species Distribution Patterns: Random
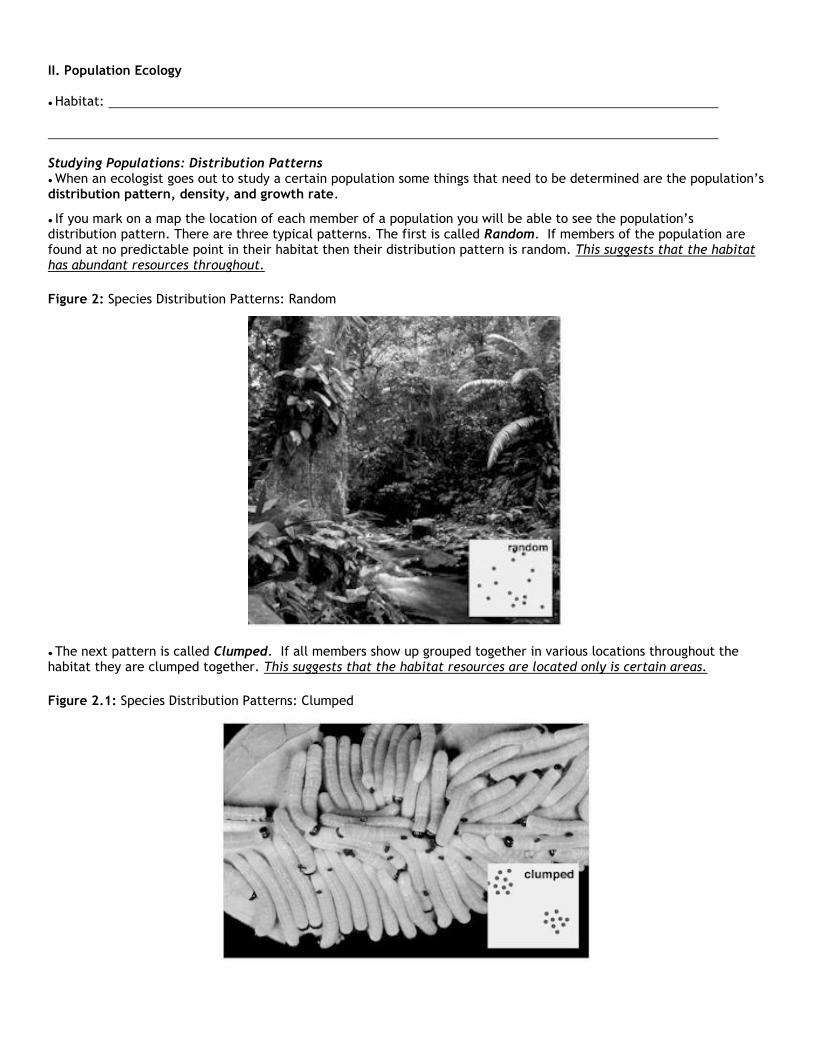
● The next pattern is called Clumped. If all members show up grouped together in various locations throughout the habitat they are clumped together. This suggests that the habitat resources are located only is certain areas.
Figure 2.1: Species Distribution Patterns: Clumped
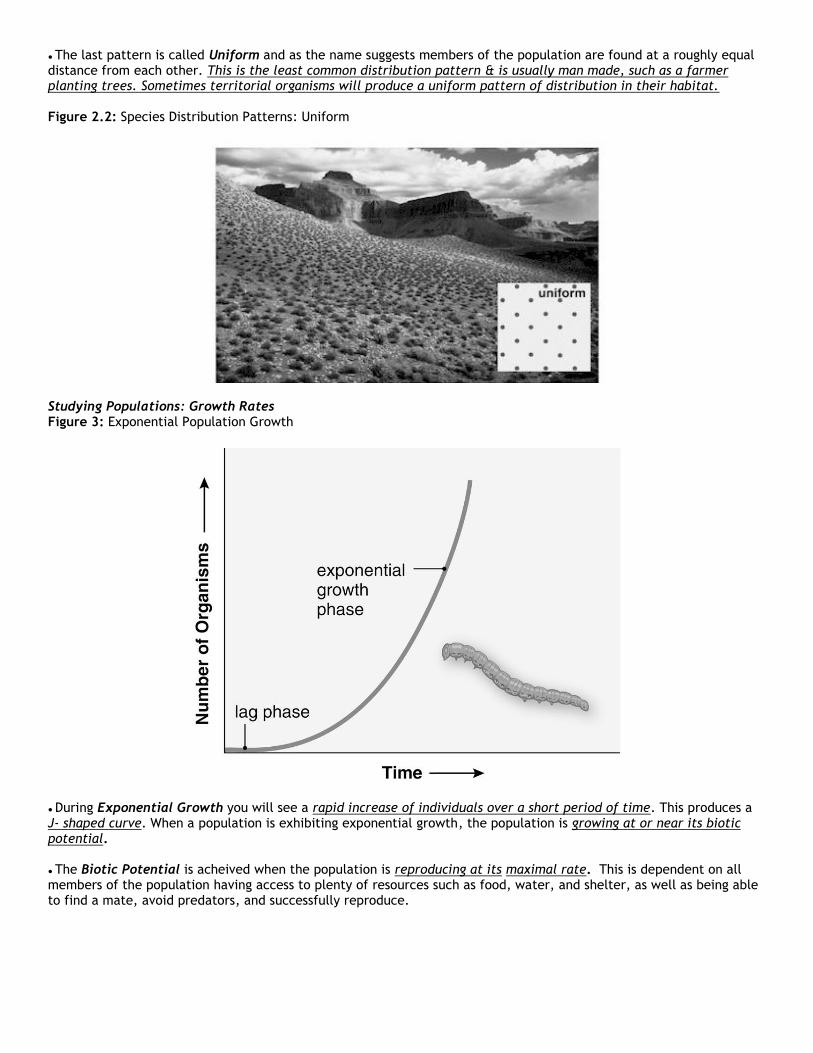
● The last pattern is called Uniform and as the name suggests members of the population are found at a roughly equal distance from each other. This is the least common distribution pattern & is usually man made, such as a farmer planting trees. Sometimes territorial organisms will produce a uniform pattern of distribution in their habitat. Figure 2.2: Species Distribution Patterns: Uniform
Studying Populations: Growth Rates Figure 3: Exponential Population Growth
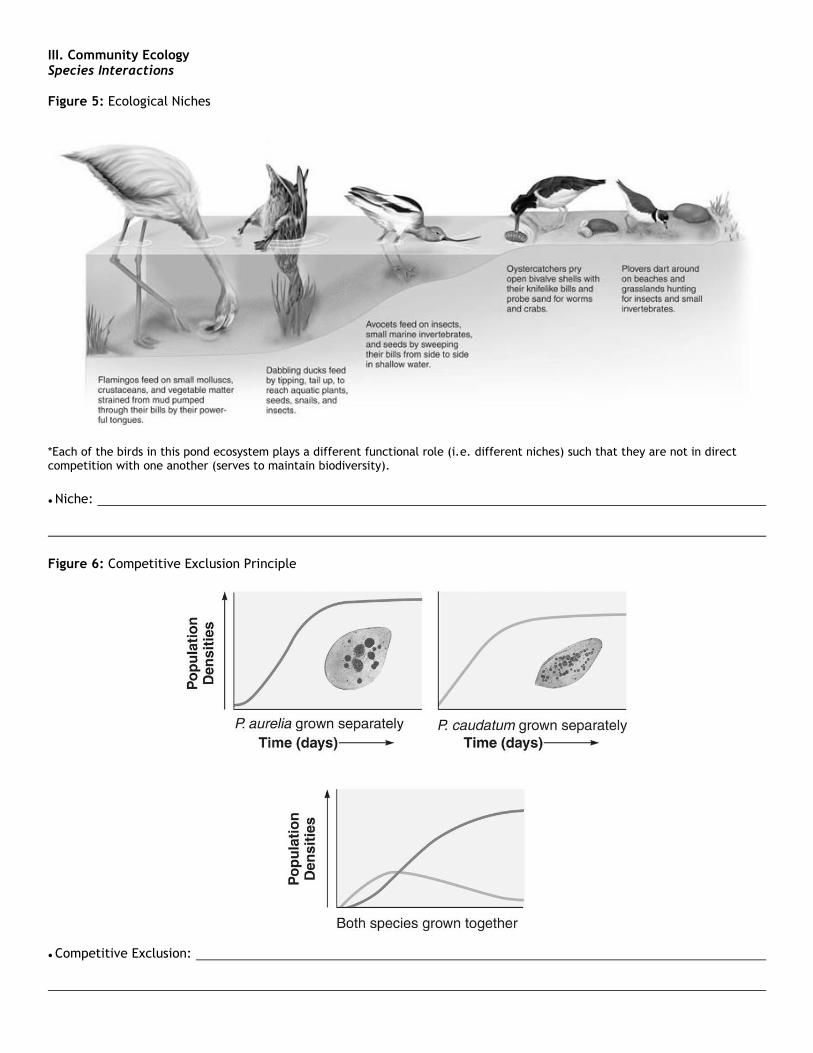
● During Exponential Growth you will see a rapid increase of individuals over a short period of time. This produces a J- shaped curve. When a population is exhibiting exponential growth, the population is growing at or near its biotic potential. ● The Biotic Potential is acheived when the population is reproducing at its maximal rate. This is dependent on all members of the population having access to plenty of resources such as food, water, and shelter, as well as being able to find a mate, avoid predators, and successfully reproduce.

Figure 3.1: Logarithmic Population Growth
● Carrying Capacity: Figure 4: Survivorship Curves
● When studying a population, ecologists often like to determine the Survivorship Curve for the population: a) Type I curves represent populations in which many offspring survive due to a great deal of parental care;
individuals live for a relatively long period of time & then begin to die off rapidly at old age. Human populations & other large members exhibit these survivorship curves.
b) Type II curves represent populations in which the death rate of individuals is the same at ANY age. Birds & small mammals exhibit this type of curve.
c) Type III represents populations with high mortality rates of offspring due to very little parental care. Fish & certain reptiles exhibit this type of survivorship curve.
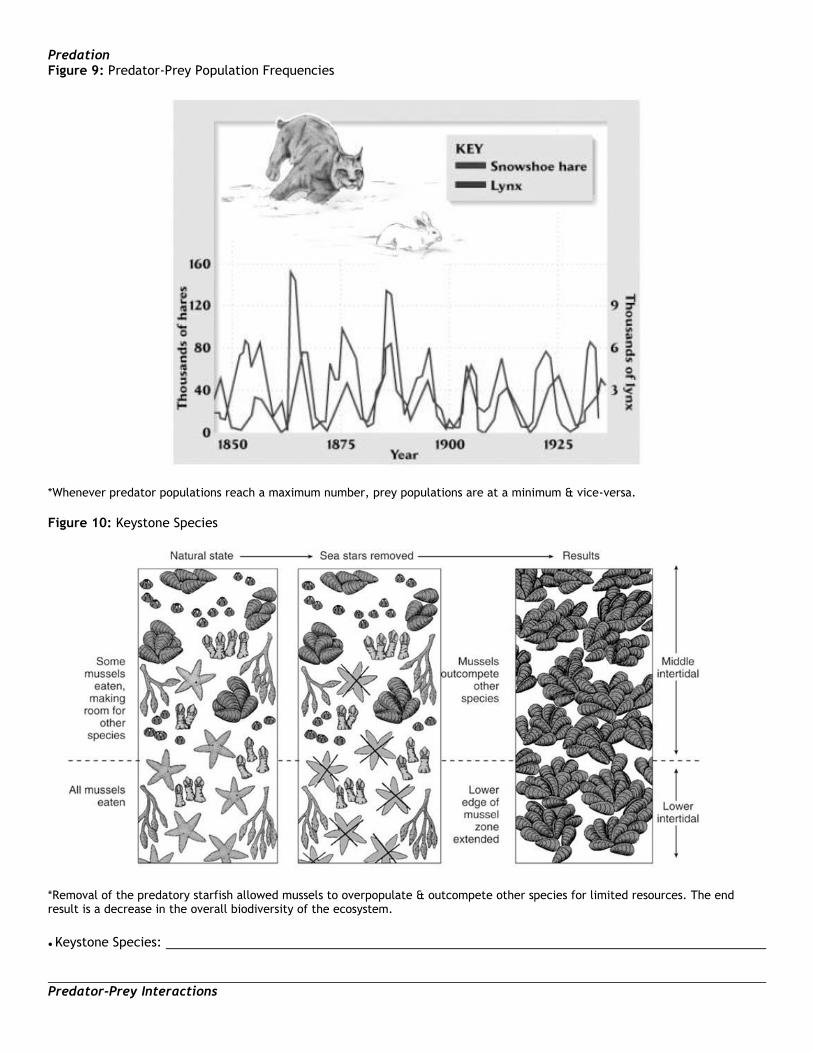
III. Community Ecology Species Interactions Figure 5: Ecological Niches
*Each of the birds in this pond ecosystem plays a different functional role (i.e. different niches) such that they are not in direct competition with one another (serves to maintain biodiversity).
● Niche:
Figure 6: Competitive Exclusion Principle
● Competitive Exclusion:

Figure 7: Competitive Exclusion: Fundamental vs Realized Niche
*If not for the presence of Chthamalus, Balanus could exist along the entire rock surface (fundamental niche). However, competition with Chthamalus limits Balanus to levels closer to the water (realized niche). Thus the fundamental niche of Balanus is not totally fulfilled.
● Fundamental Niche:
● Realized Niche:
Figure 8: Niche Partitioning
● Niche Partitioning:
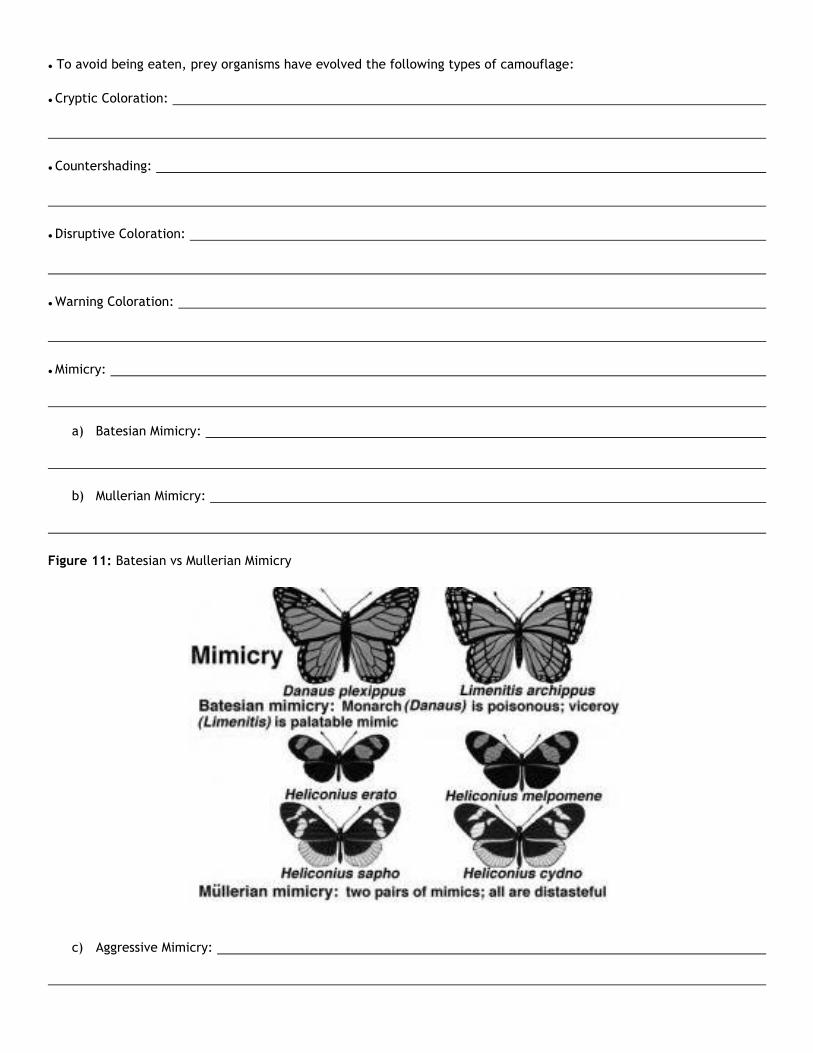
Predation Figure 9: Predator-Prey Population Frequencies
*Whenever predator populations reach a maximum number, prey populations are at a minimum & vice-versa.
Figure 10: Keystone Species
*Removal of the predatory starfish allowed mussels to overpopulate & outcompete other species for limited resources. The end result is a decrease in the overall biodiversity of the ecosystem.
● Keystone Species:
Predator-Prey Interactions
● To avoid being eaten, prey organisms have evolved the following types of camouflage:
● Cryptic Coloration:
● Countershading:
● Disruptive Coloration:
● Warning Coloration:
● Mimicry:
a) Batesian Mimicry:
b) Mullerian Mimicry:
Figure 11: Batesian vs Mullerian Mimicry
c) Aggressive Mimicry:
Symbiotic Relationships
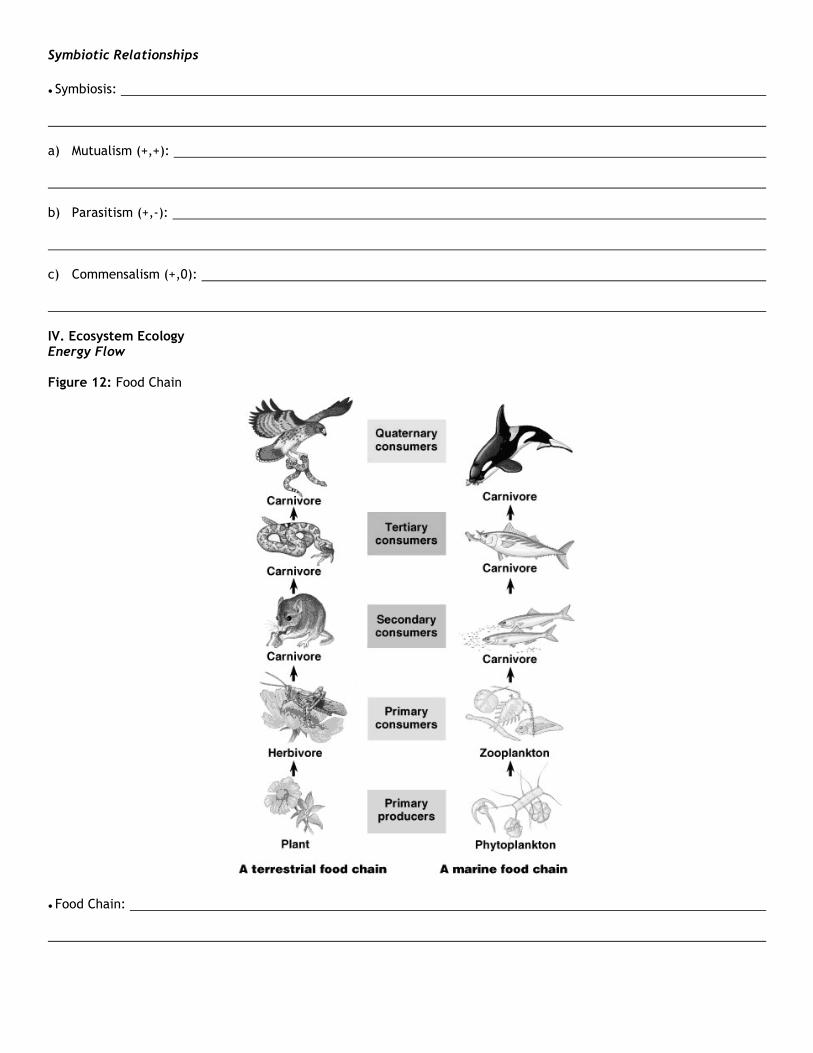
● Symbiosis: a) Mutualism (+,+): b) Parasitism (+,-): c) Commensalism (+,0): IV. Ecosystem Ecology Energy Flow Figure 12: Food Chain
● Food Chain:
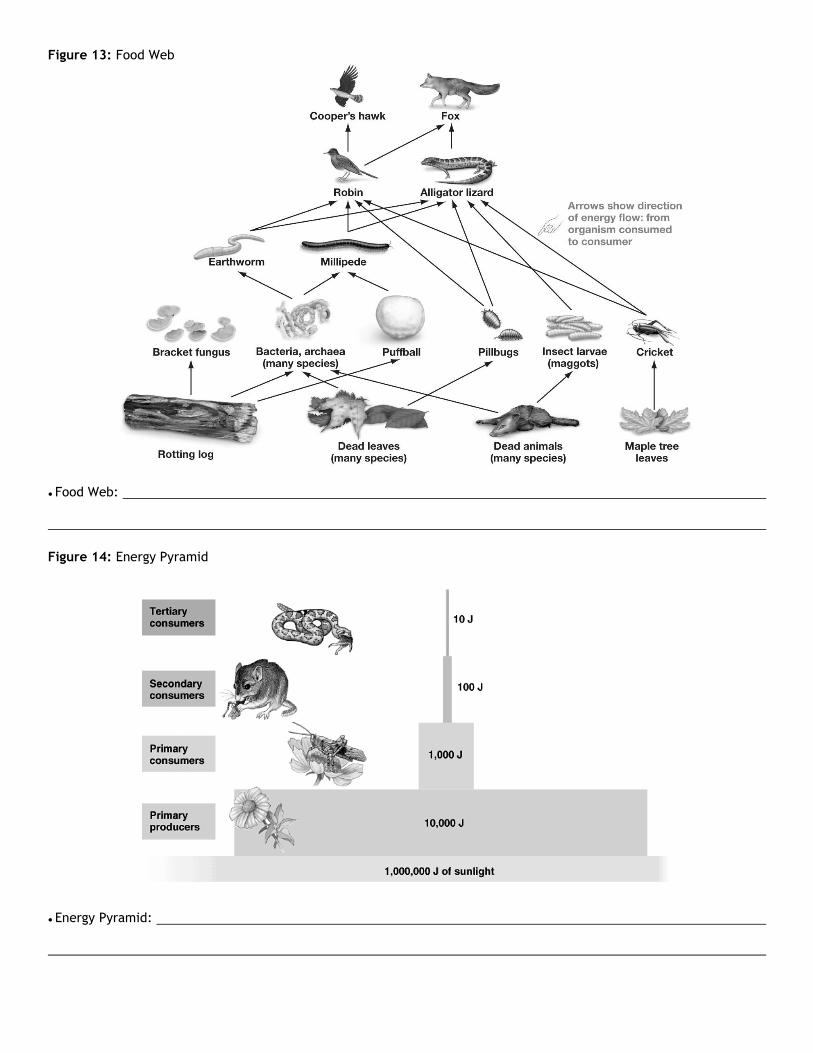
Figure 13: Food Web
● Food Web:
Figure 14: Energy Pyramid
● Energy Pyramid:
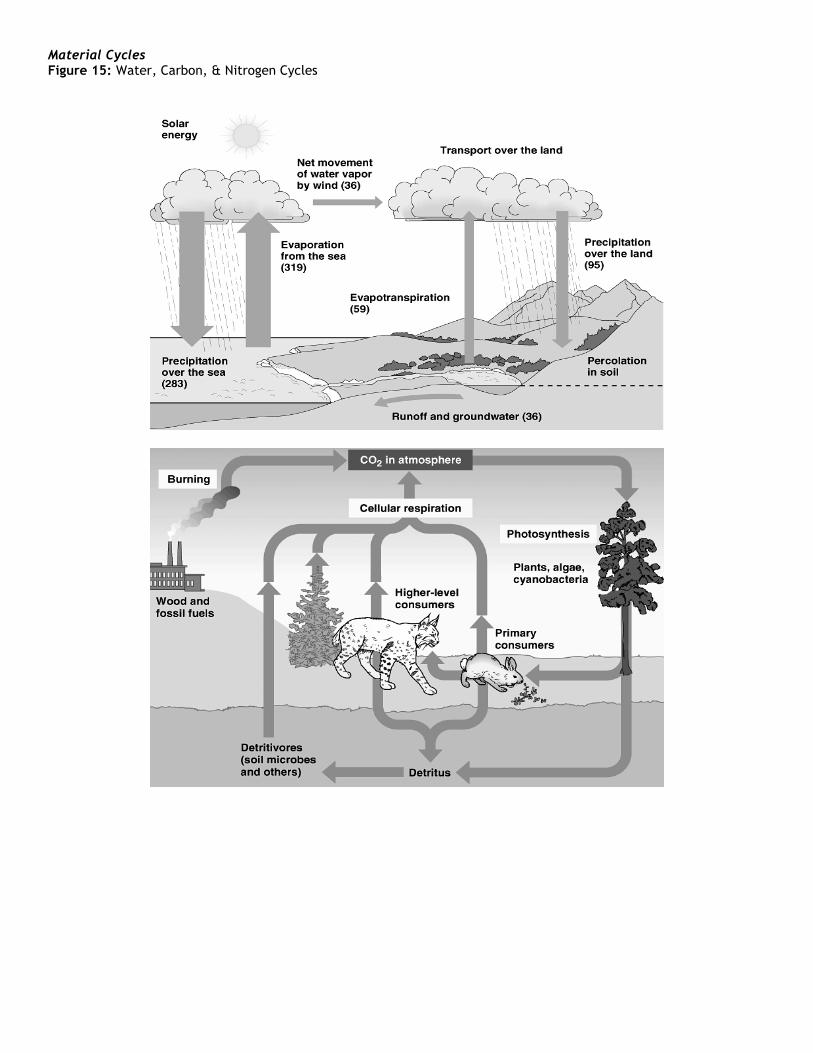
Material Cycles Figure 15: Water, Carbon, & Nitrogen Cycles
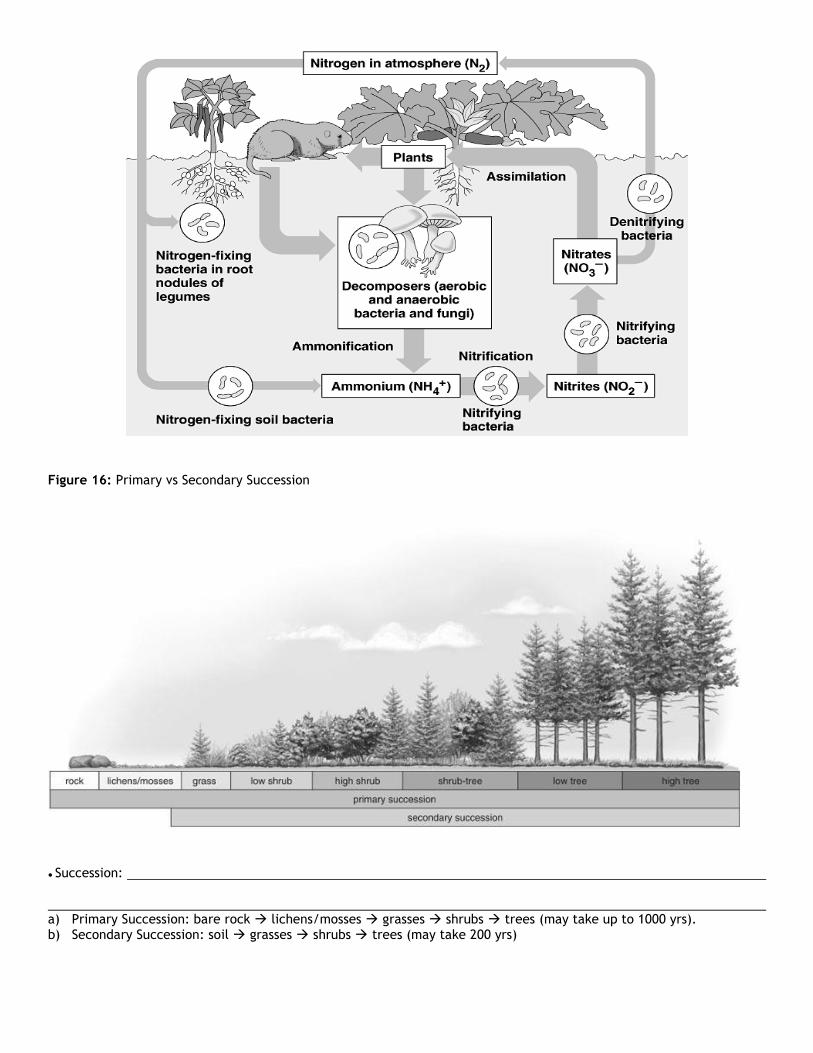
Figure 16: Primary vs Secondary Succession
● Succession: a) Primary Succession: bare rock lichens/mosses grasses shrubs trees (may take up to 1000 yrs). b) Secondary Succession: soil grasses shrubs trees (may take 200 yrs)
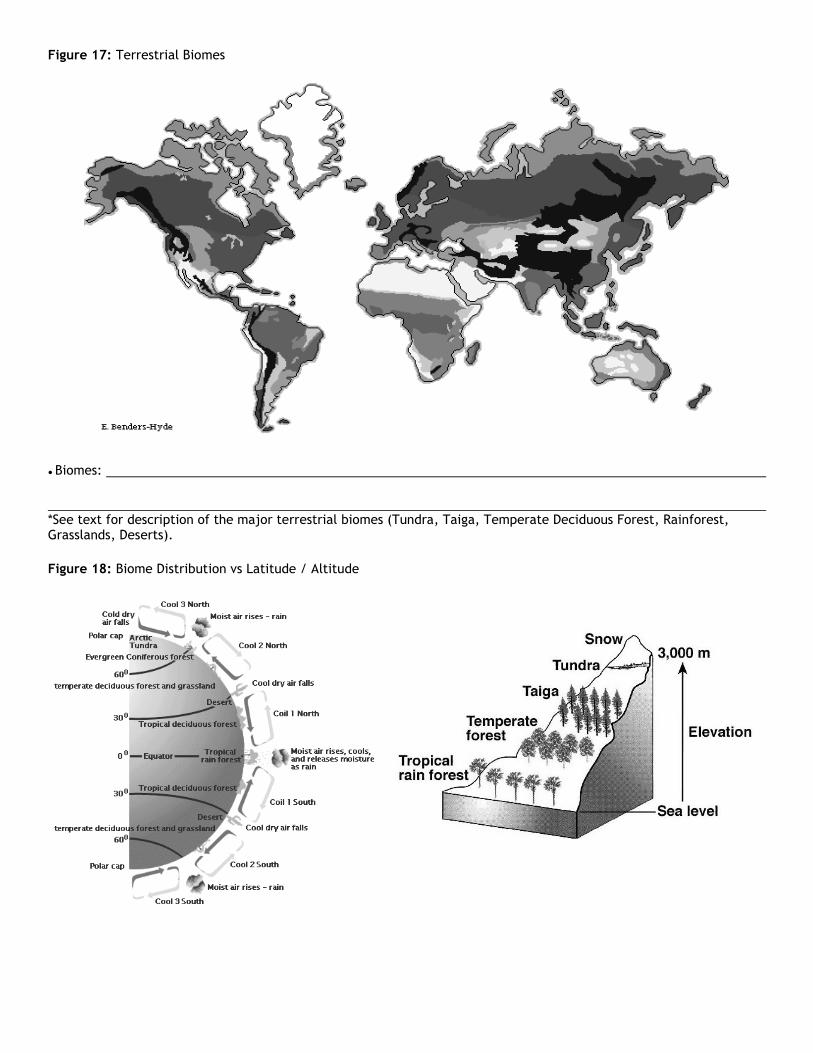
Figure 17: Terrestrial Biomes
● Biomes:
*See text for description of the major terrestrial biomes (Tundra, Taiga, Temperate Deciduous Forest, Rainforest, Grasslands, Deserts).
Figure 18: Biome Distribution vs Latitude / Altitude