Embed Size (px)
Citation preview

Moodle
• Moodle: https://modules.lancs.ac.uk/– Coursepaper, Tutorial worksheets, Lecture
Recordings, General Announcements• My tutorial page:
www.lancaster.ac.uk/postgrad/murphys4/– Tutorial Slides (will be posted Tuesday evening),
General Tutorial-related announcements

Question 1
• Normal Good:– A good for which, other things equal, an increase in
income leads to an increase in demand (and vice versa)
– Examples:• Inferior Good:– A good for which, other things equal, an increase in
income leads to a decrease in demand (and vice versa)
– Examples:
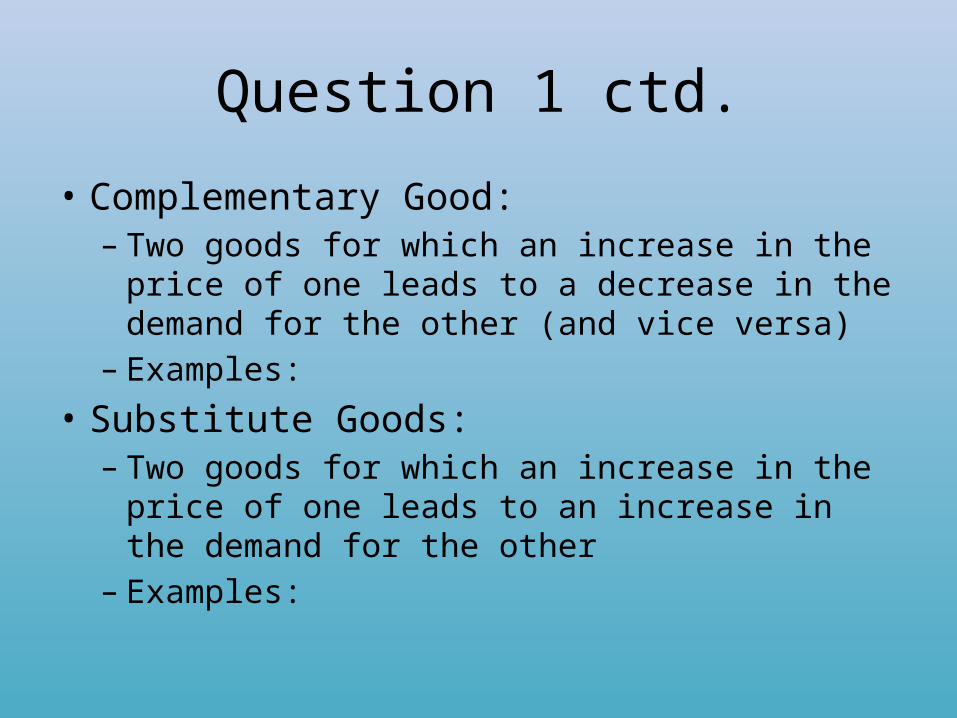
Question 1 ctd.
• Complementary Good:– Two goods for which an increase in the price of one
leads to a decrease in the demand for the other (and vice versa)
– Examples:• Substitute Goods:– Two goods for which an increase in the price of one
leads to an increase in the demand for the other– Examples:
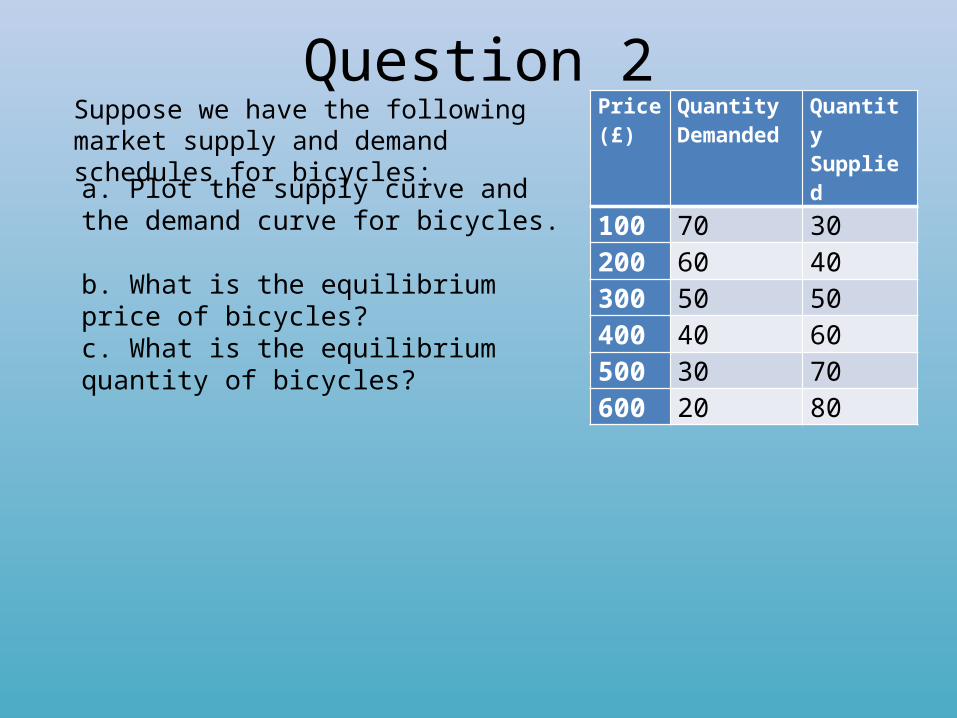
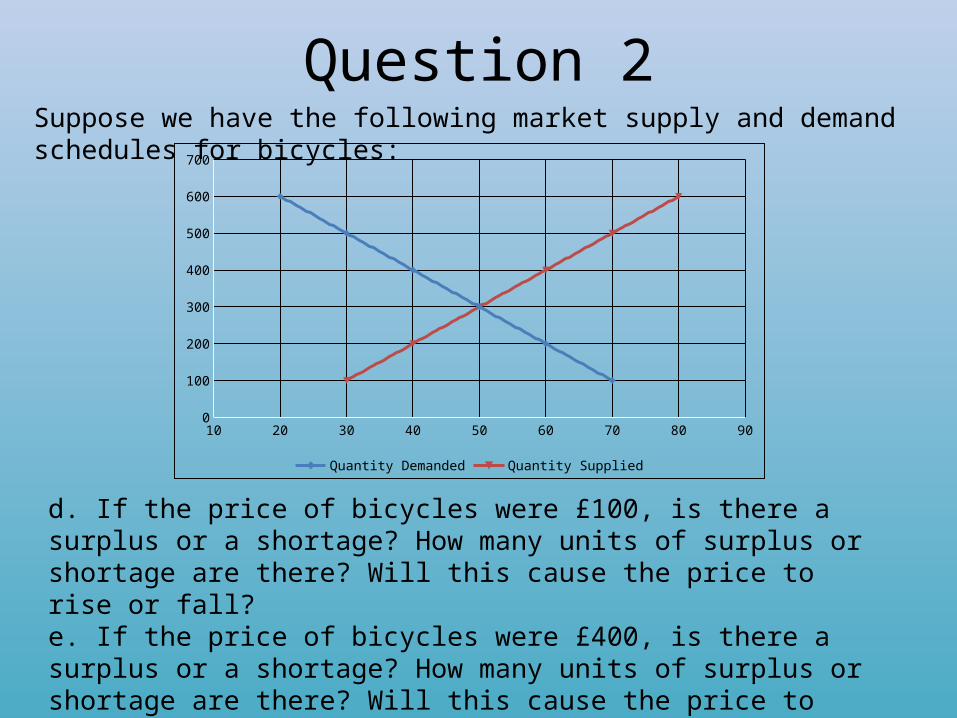
Question 2Suppose we have the following market supply and demand schedules for bicycles:
Price (£)
Quantity Demanded
Quantity Supplied
100 70 30200 60 40300 50 50400 40 60500 30 70600 20 80
a. Plot the supply curve and the demand curve for bicycles. b. What is the equilibrium price of bicycles? c. What is the equilibrium quantity of bicycles?
Question 2Suppose we have the following market supply and demand schedules for bicycles:
d. If the price of bicycles were £100, is there a surplus or a shortage? How many units of surplus or shortage are there? Will this cause the price to rise or fall? e. If the price of bicycles were £400, is there a surplus or a shortage? How many units of surplus or shortage are there? Will this cause the price to rise or fall?
10 20 30 40 50 60 70 80 900
100
200
300
400
500
600
700
Quantity Demanded Quantity Supplied
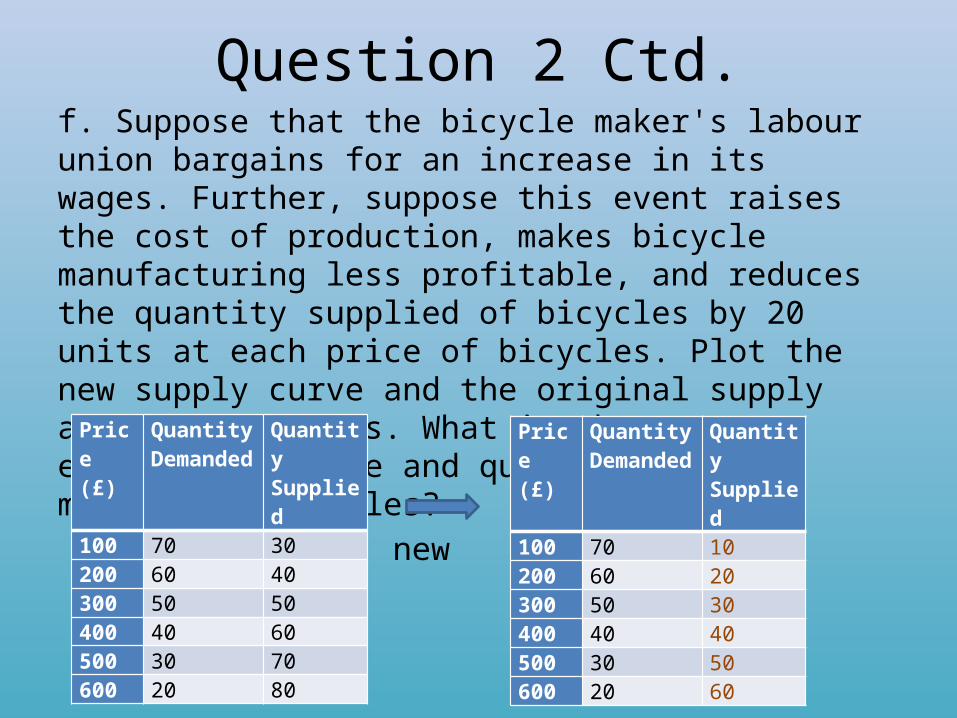
Question 2 Ctd.f. Suppose that the bicycle maker's labour union bargains for an increase in its wages. Further, suppose this event raises the cost of production, makes bicycle manufacturing less profitable, and reduces the quantity supplied of bicycles by 20 units at each price of bicycles. Plot the new supply curve and the original supply and demand curves. What is the new equilibrium price and quantity in the market for bicycles?
original new Price (£)
Quantity Demanded
Quantity Supplied
100 70 30200 60 40300 50 50400 40 60500 30 70600 20 80
Price (£)
Quantity Demanded
Quantity Supplied
100 70 10200 60 20300 50 30400 40 40500 30 50600 20 60
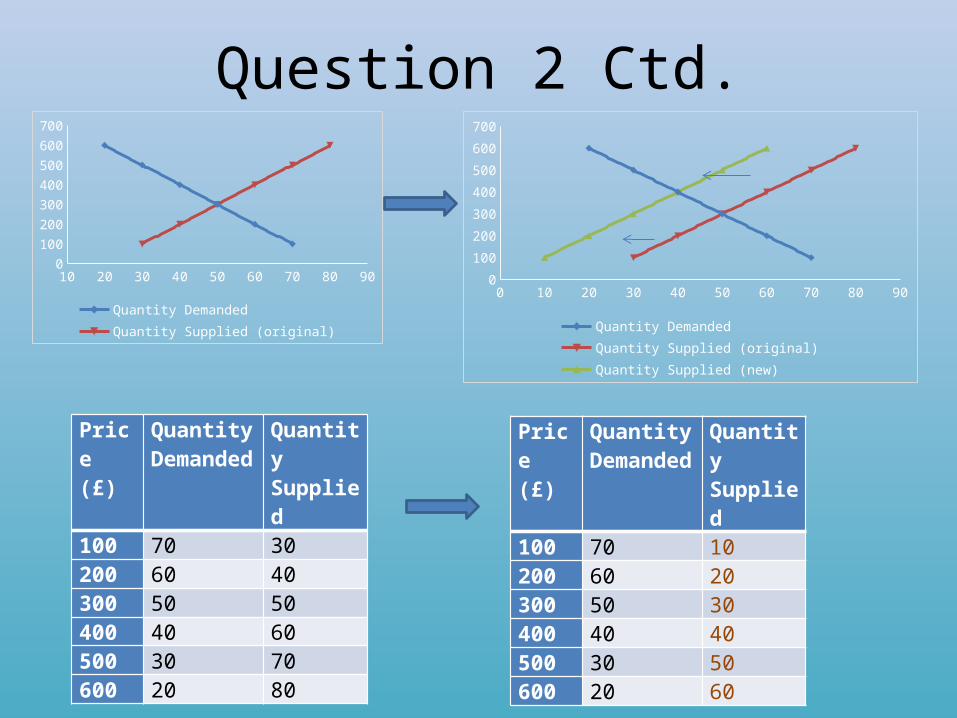
Question 2 Ctd.
10 20 30 40 50 60 70 80 900
100
200
300
400
500
600
700
Quantity DemandedQuantity Supplied (original) 0 10 20 30 40 50 60 70 80 90
0
100
200
300
400
500
600
700
Quantity Demanded Quantity Supplied (original)Quantity Supplied (new)
Price (£)
Quantity Demanded
Quantity Supplied
100 70 30200 60 40300 50 50400 40 60500 30 70600 20 80
Price (£)
Quantity Demanded
Quantity Supplied
100 70 10200 60 20300 50 30400 40 40500 30 50600 20 60
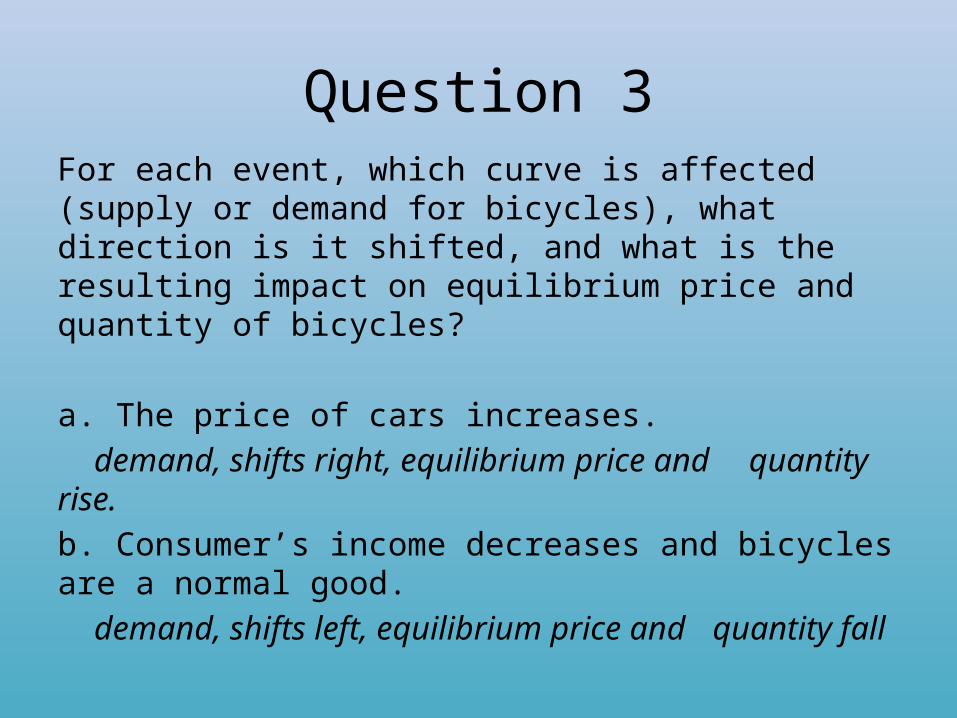
Question 3For each event, which curve is affected (supply or demand for bicycles), what direction is it shifted, and what is the resulting impact on equilibrium price and quantity of bicycles?
a. The price of cars increases.demand, shifts right, equilibrium price and quantity
rise.b. Consumer’s income decreases and bicycles are a normal good.
demand, shifts left, equilibrium price and quantity fall

Question 3 ctd.
c. Price of steel used to make bicycle frames increases.supply, shifts left, equilibrium price rises, equilibrium
quantity falls d. An environmental movement shifts tastes towards bicycling.
demand, shifts right, equilibrium price and quantity rise e. Consumers expect the price of bicycles to fall in the future.
demand, shifts left, equilibrium price and quantity fall.

Question 3 ctd.
f. A technological advance in the manufacturing of bicycles occurs.
supply, shifts right, equilibrium price falls, equilibrium quantity rises. g. The price of bicycle helmets and shoes is reduced.
demand, shifts right, equilibrium price and quantity rise.h. Consumers’ incomes decrease, if bicycles are an inferior good.
demand, shifts right, equilibrium price and quantity rise .
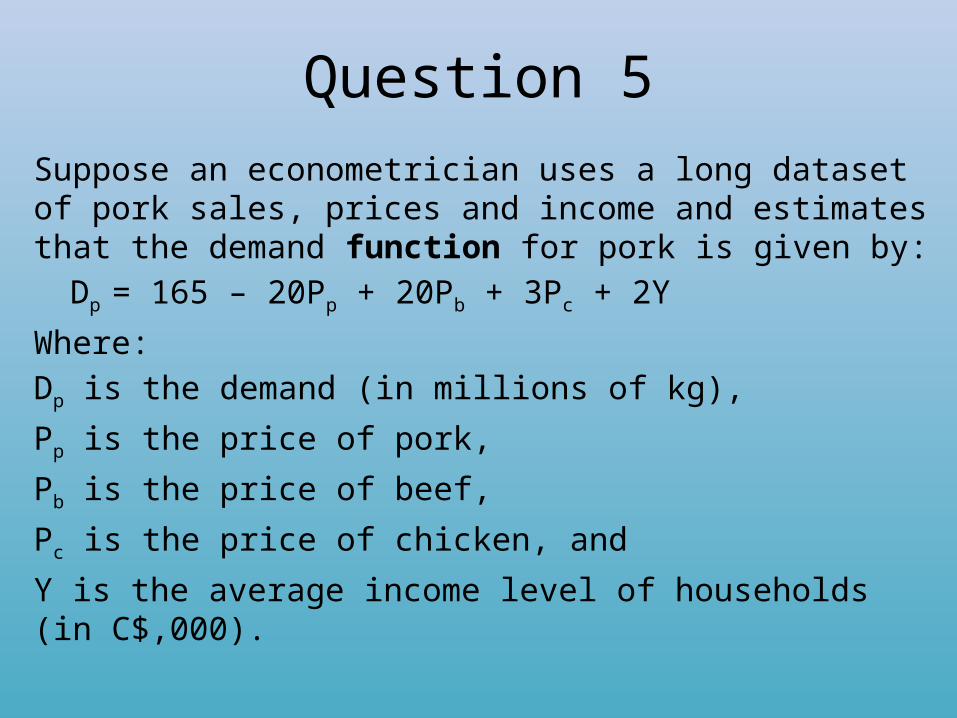
Question 5Suppose an econometrician uses a long dataset of pork sales, prices and income and estimates that the demand function for pork is given by:
Dp = 165 – 20Pp + 20Pb + 3Pc + 2Y
Where: Dp is the demand (in millions of kg),
Pp is the price of pork,
Pb is the price of beef,
Pc is the price of chicken, and
Y is the average income level of households (in C$,000).
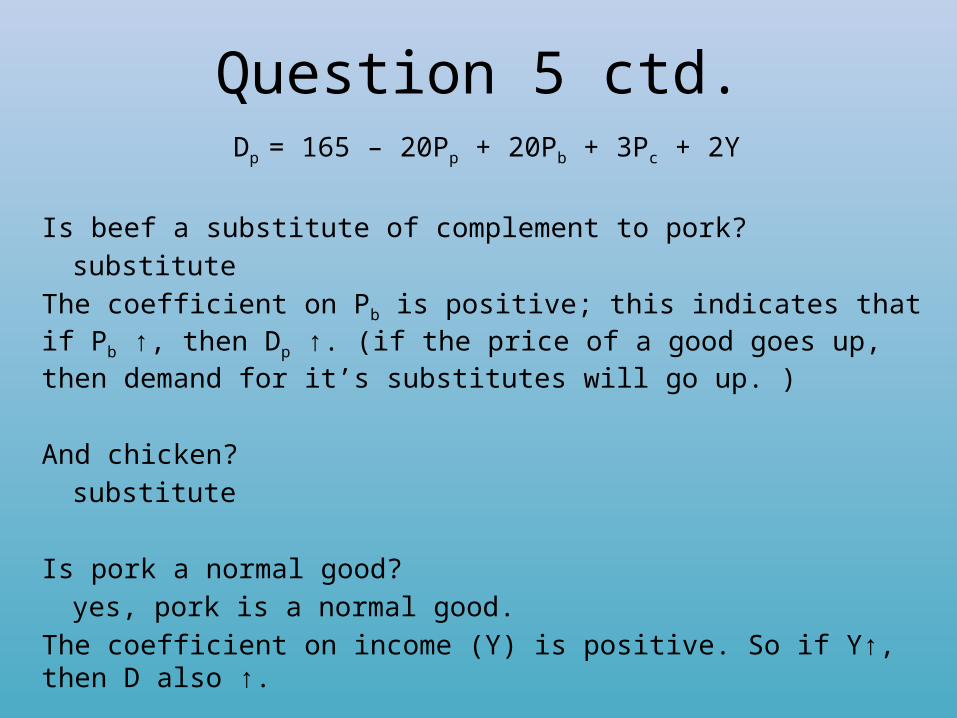
Question 5 ctd.Dp = 165 – 20Pp + 20Pb + 3Pc + 2Y
Is beef a substitute of complement to pork? substitute
The coefficient on Pb is positive; this indicates that if Pb ↑, then Dp ↑. (if the price of a good goes up, then demand for it’s substitutes will go up. )
And chicken? substitute
Is pork a normal good?yes, pork is a normal good.
The coefficient on income (Y) is positive. So if Y↑, then D also ↑.
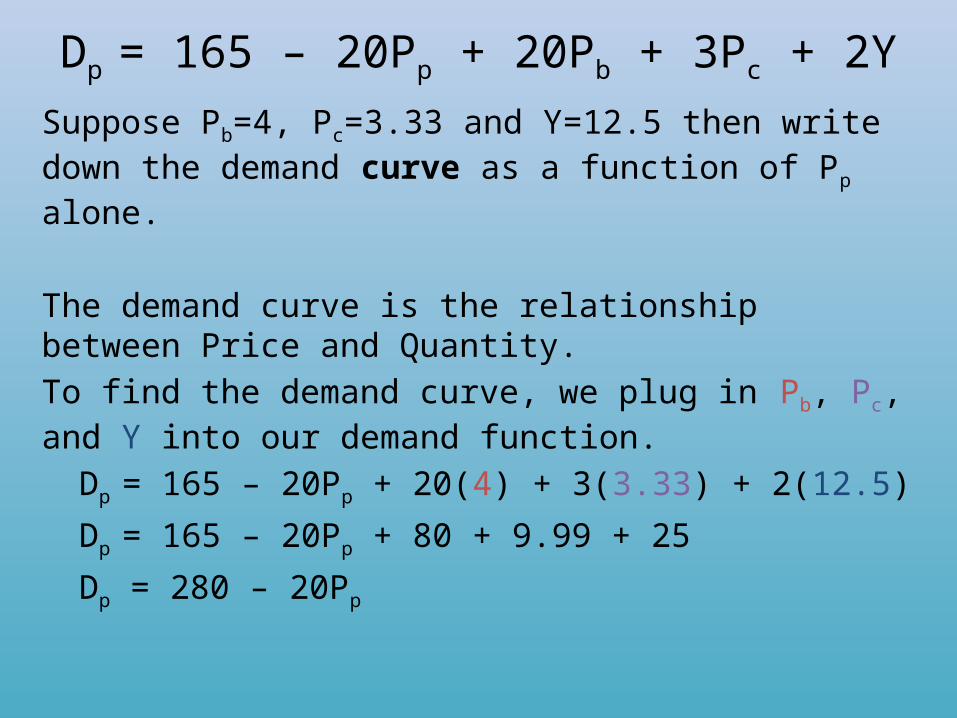
Dp = 165 – 20Pp + 20Pb + 3Pc + 2YSuppose Pb=4, Pc=3.33 and Y=12.5 then write down the demand curve as a function of Pp alone.
The demand curve is the relationship between Price and Quantity. To find the demand curve, we plug in Pb, Pc, and Y into our demand function.
Dp = 165 – 20Pp + 20(4) + 3(3.33) + 2(12.5)
Dp = 165 – 20Pp + 80 + 9.99 + 25
Dp = 280 – 20Pp

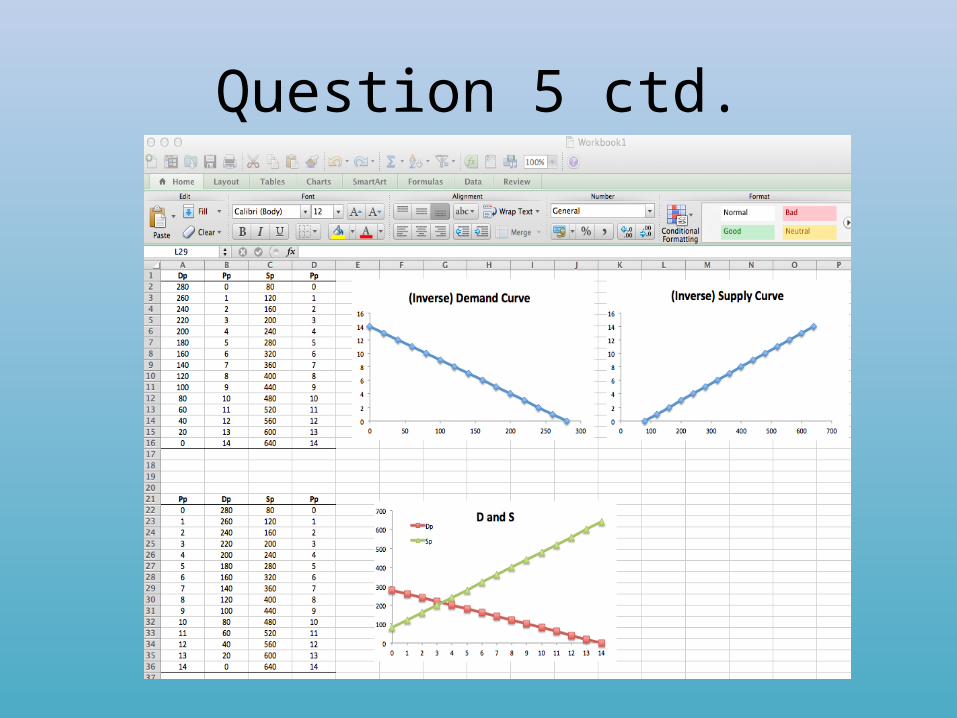
Question 5 ctd.Using Excel draw a diagram of what the inverse demand curve looks like (i.e. with Pp on the vertical axis and Dp on the horizontal).
HINT: Enter a column headed Pp (in the top left cell – labelled A1) and then enter 0, 1,2,3,4 ….. up to 14 in the cells below the heading. Head the next (B) column Dp and in the cell below this heading enter the “formula” for the demand curve. Draw the inverse demand curve using Excel’s chart facility. HINT highlight the two columns and then click on CHARTS and then the SCATTER icon and chose Straight Marked Scatter. It should produce dots connected by a line. If you have an older EXCEL it may be different - but probably easier! And there are many ways of doing this in the EXCEL – so do whatever works for you. What is the slope and intercept? If all else fails draw it with pencil and ruler!
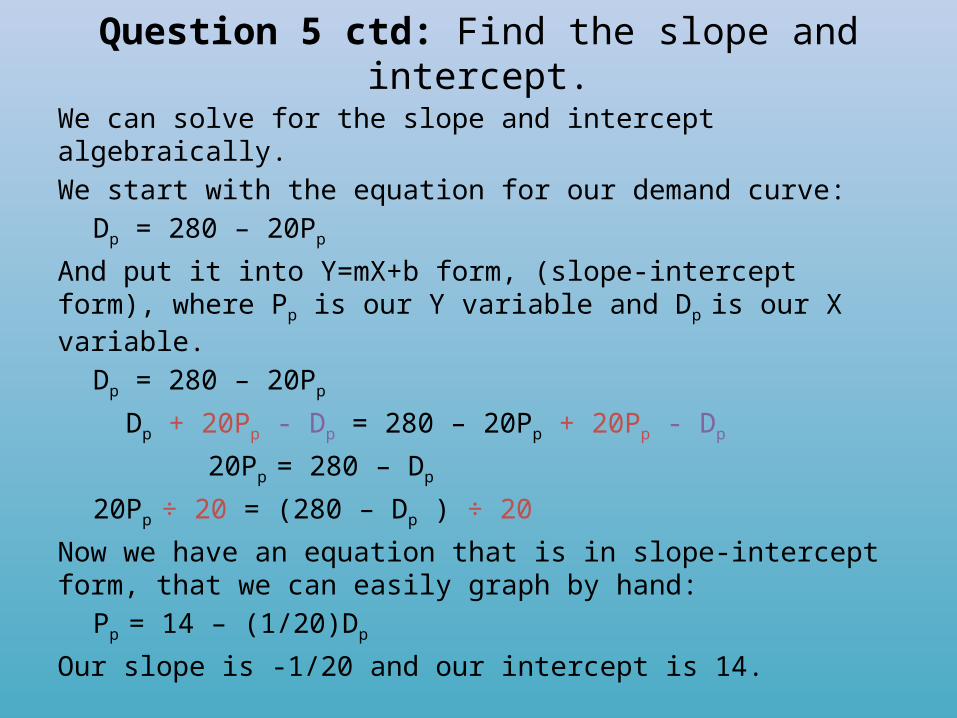
Question 5 ctd: Find the slope and intercept.
We can solve for the slope and intercept algebraically. We start with the equation for our demand curve:
Dp = 280 – 20Pp
And put it into Y=mX+b form, (slope-intercept form), where Pp is our Y variable and Dp is our X variable.
Dp = 280 – 20Pp
Dp + 20Pp - Dp = 280 – 20Pp + 20Pp - Dp
20Pp = 280 – Dp
20Pp ÷ 20 = (280 – Dp ) ÷ 20
Now we have an equation that is in slope-intercept form, that we can easily graph by hand:
Pp = 14 – (1/20)Dp
Our slope is -1/20 and our intercept is 14.
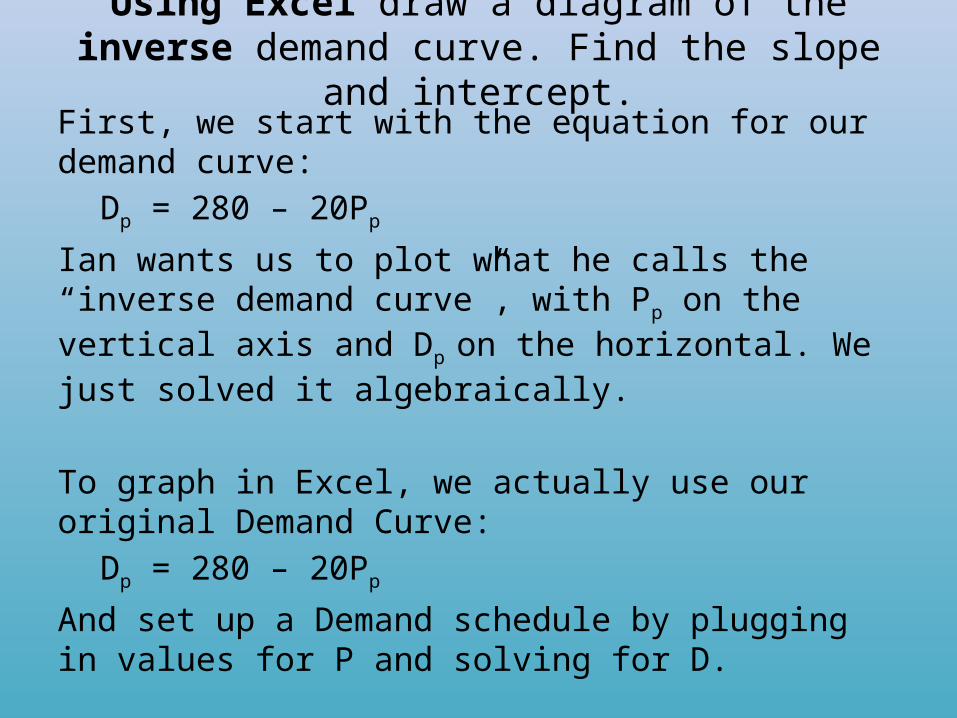
Using Excel draw a diagram of the inverse demand curve. Find the slope and intercept.
First, we start with the equation for our demand curve:Dp = 280 – 20Pp
Ian wants us to plot what he calls the “inverse demand curve”, with Pp on the vertical axis and Dp on the horizontal. We just solved it algebraically.
To graph in Excel, we actually use our original Demand Curve:
Dp = 280 – 20Pp
And set up a Demand schedule by plugging in values for P and solving for D.

Question 5 ctd.
Suppose Pb rises by $1.00 what happens to this demand curve – show this in Excel. What are the new values of the slope and intercept?Answer: -1/20 and 15.

Question 5 ctd.
Suppose incomes rise to 22.5? What happens to the slope and intercept? Answer: Nothing, also rises by 1.
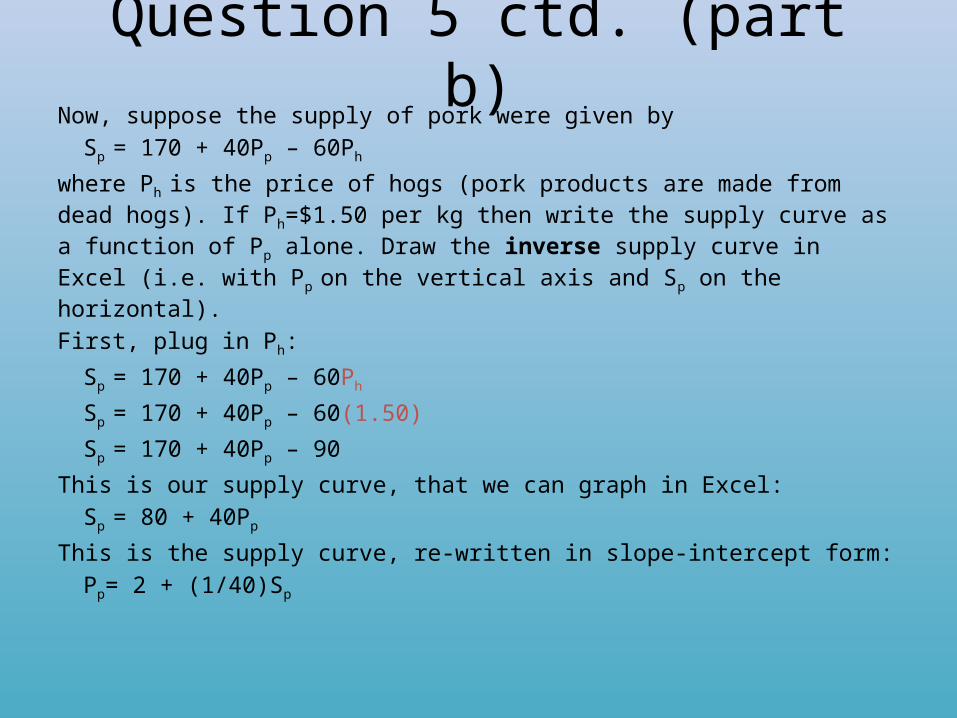
Question 5 ctd. (part b)Now, suppose the supply of pork were given by
Sp = 170 + 40Pp – 60Ph
where Ph is the price of hogs (pork products are made from dead hogs). If Ph=$1.50 per kg then write the supply curve as a function of Pp alone. Draw the inverse supply curve in Excel (i.e. with Pp on the vertical axis and Sp on the horizontal). First, plug in Ph:
Sp = 170 + 40Pp – 60Ph
Sp = 170 + 40Pp – 60(1.50)
Sp = 170 + 40Pp – 90
This is our supply curve, that we can graph in Excel:Sp = 80 + 40Pp
This is the supply curve, re-written in slope-intercept form:Pp= 2 + (1/40)Sp

Question 5 ctd. (part b)Now Suppose Ph rises by $1 what happens to the slope and intercept of the supply curve. Show this using Excel.
Sp = 170 + 40Pp – 60Ph
Answer: slope remains the same at 1/40 and the intercept rises from -2 to -½
Question 5 ctd. (part c)
(c) Suppose Dp = 280 – 20Pp and Sp = 80+ 40Pp what is the equilibrium price and demand level? Show this using Excel. Answer: Pp*=3.33 and Dp*=213
Question 5 ctd. (part c, ctd.)
What would happen to the equilibrium if the price of hogs rose by $1.Answer: the equilibrium price rises to $4.50 and demand is 190.
Question 5 ctd.

For Next Week
• Attend lectures• Read relevant pages in book.• Work through and complete the tutorial
worksheet prior to coming to tutorial. (Working together is fine, as long as you understand the material.)
• Bring your questions to the tutorial or email them to me.
• Be prepared to participate in tutorial.