Embed Size (px)
Citation preview
Economic Analysis and Information Modeling of
Smart Multi-purpose Utility Tunnels
Ali Alaghbandrad
A Thesis
In the Department
Of
Building, Civil, and Environmental Engineering
Presented in Partial Fulfillment of the Requirements
For the Degree of
Doctor of Philosophy (Building Engineering) at
Concordia University
Montreal, Quebec, Canada
September 2020
© Ali Alaghbandrad, 2020
CONCORDIA UNIVERSITY
SCHOOL OF GRADUATE STUDIES
This is to certify that the thesis prepared
By: Ali Alaghbandrad
Entitled: Economic Analysis and Information Modeling of Smart Multi-purpose Utility
Tunnels
and submitted in partial fulfillment of the requirements for the degree of
Doctor of Philosophy (Building Engineering)
complies with the regulations of the University and meets the accepted standards with respect to
originality and quality.
Signed by the final examining committee:
Chair
Dr. Ahmed Kishk
External Examiner
Dr. Islam Shahrour
External to Program
Dr. Javad Dargahi
Examiner
Dr. Osama Moselhi
Examiner
Dr. Sang Hyeok Han
Thesis Supervisor
Dr. Amin Hammad
Approved by Dr. Michelle Nokken, Graduate Program Director
10/12/2020
Date of Defense Dr. Mourad Debbabi, Dean, Gina Cody School of Engineering and Computer Science
iii
ABSTRACT
Economic Analysis and Information Modeling of Smart Multi-purpose Utility Tunnels
Ali Alaghbandrad, PhD
Concordia University, 2020
The traditional method of buried utilities (i.e. water, sewer and gas pipes, and electrical and
telecommunication cables) has been used for many decades particularly in urban areas. Repeated
excavations are needed to access these underground utilities for maintenance, repair, and renewal
activities. Urban areas have been experiencing many street closures and traffic disruptions because
of excavation for maintaining underground utilities. These construction works have imposed major
costs on public and private utility companies as well as on citizens and local businesses (social
cost). Multi-purpose Utility Tunnels (MUTs) have been built since the 19th century as a solution
and alternative way that not only avoids these excavations but also facilitates inspection and
protects utilities. However, MUTs are not widely used in most of the countries because of the high
initial investment, safety and security issues, complicated design and construction, and complex
coordination of utility companies. Despite the higher design and construction cost of MUTs,
operational cost-savings can justify the investment from the project point of view. From the
organization's point of view and based on cost-sharing, MUT should be more economical as well
and the MUT benefits should be distributed fairly to convince utility companies to participate in
the MUT project. Lifecycle Cost (LCC) analysis of the MUT and the buried utilities method is
complicated because of various factors that influence the LCC. Also, there is a gap in defining the
concept of fairness and applying mathematical methods for a fair cost-sharing. On the other hand,
to facilitate the complicated design and construction, and complex coordination of utility
companies in MUT projects, Building Information Modeling (BIM) tools are very helpful.
However, BIM is mainly developed for buildings and there are efforts to extend it to civil structures
(e.g. bridges, tunnels). Although using BIM for MUTs has progressed in recent years, there is still
lack of a comprehensive framework covering MUT components and information requirements for
all use cases, as well as its integration with Geographic Information System (GIS) and other
technologies.
This research aims to: (1) improve the decision-making related to MUT selection process by
developing a comprehensive and systematic approach for MUT and buried utilities LCC analysis.
iv
In addition, this research investigates the influence of factors of utility specifications, location
conditions, and construction methods. The output of this model determines the LCC of MUT and
buried utilities, and the design and construction cost of MUT at the breakeven point to ensure the
project decision-makers that MUT is the economic method; (2) improve the fairness of MUT cost-
sharing by developing a fair model that considers fairness based on (a) balance of risk, (b) balance
of benefit and cost, and (c) balance of contributed benefit and gained benefit. This model makes
MUT the economical method for utility companies and distributes the benefits and costs of MUT
fairly among the utility companies; and (3) improve the coordination among the MUT stakeholders
by developing a framework integrating BIM and 3D GIS for Smart Multi-purpose Utility Tunnel
Information Modeling (SMUTIM). The framework defines MUT information requirements,
identifies SMUTIM use cases, and extends Industry Foundation Classes (IFC) to MUT.
The contributions of this research are: (1) developing a comprehensive and systematic approach
for MUT and buried utilities LCC analysis by considering the factors of utility specifications,
location conditions, and construction/maintenance methods. The output of this model estimates
the LCC of MUT and buried utilities. The proposed model can justify whether an MUT project is
an economic alternative method for buried utilities; (2) developing an MUT cost-sharing method
to ensure the decision-makers of utility companies that MUT is the economic method for their
company and also the benefits and costs of MUT are distributed fairly among the utility companies.
The fairness is defined based on three principals: balance of risk, balanced benefit-cost ratio, and
balance in contributed benefit and gained benefit; (3) categorizing and integrating smart MUT
physical and functional components and their relationships in a systematic way; (4) completing,
integrating, and organizing the available knowledge about SMUTIM use cases within a
framework. Then, using the case study to show the capabilities and gaps of current BIM
applications, GIS, databases, and facility management tools for MUT lifecycle management; and
(5) partially extending IFC to MUT by proposing Model View Definition (MVD), new entities
and relationships, and taking advantage of reusable IFC entities, properties, and relationships.
It is expected that the proposed model promotes using MUT by (1) facilitating economic analysis
and cost-sharing for MUT projects from project and organization points of view; and (2)
facilitating the design, construction, and operation of MUTs, and the coordination of utility
companies.
v
ACKNOWLEDGEMENT
I am thankful for the kind help and support of my supervisor, Dr. Amin Hammad. I would like to
thank Mr. Michel Saindon and Ms. Salamatou Modieli from Centre d'expertise et de recherche en
infrastructures urbaines (CERIU), Mr. Serge Boileau from Commission des Services Electriques
De Montreal (CSEM), and Mr. Martin Gaudette and Mr. Jean-Pierre Bossé from the City of
Montreal, for providing information related to the case study through meetings and sharing
documents.
I would, also, like to thank the members of my committee, Dr. Isam Shahrour, Dr. Javad Dargahi,
Dr. Osama Moselhi, and Dr. Sang Hyeok Han for their valuable inputs and precious time.
This research has been funded by MITACS project number IT12092 and Concordia University
Gina Cody School of Engineering and Computer Science. These supports are greatly appreciated.
I also appreciate Mrs. Yisha Luo for providing information in some parts of the literature review
about MUT in East Asia and Mr. Tersoo K. Genger for providing Figure 2-12 about the location
of MUTs built at different time periods in the world and his contribution in parts of Section 2.3
about the review of MUT projects around the world.

vi
Dedicated to my wife and my parents for their endless love and spiritual support and
encouragement.
vii
TABLE OF CONTENTS
LIST OF FIGURES ...................................................................................................................... x
LIST OF TABLES ..................................................................................................................... xiii
LIST OF ABBREVIATIONS .................................................................................................... xv
CHAPTER 1. INTRODUCTION ........................................................................................... 1
1.1 Background ...................................................................................................................... 1
1.2 Problem Statement and Research Gaps ............................................................................ 2
1.3 Research Objectives ......................................................................................................... 4
1.4 Thesis Organization.......................................................................................................... 4
CHAPTER 2. LITERATURE REVIEW ............................................................................... 6
2.1 Introduction ...................................................................................................................... 6
2.1 Multi-purpose Utility Tunnel (MUT) ............................................................................... 6
2.1.1 MUT Classification ................................................................................................... 6
2.1.2 MUT Construction Methods ..................................................................................... 8
2.1.3 MUT Benefits ......................................................................................................... 10
2.1.4 MUT Disadvantages ............................................................................................... 14
2.2 Lifecycle Cost of MUT versus Buried Utilities ............................................................. 15
2.2.1 Economy of MUTs ................................................................................................. 20
2.2.2 Public-Private Partnerships ..................................................................................... 21
2.2.3 Game Theory .......................................................................................................... 23
2.2.4 Financing and Cost-sharing of MUTs ..................................................................... 26
2.3 Review of MUT Projects and Studies Around the World .............................................. 32
2.3.1 MUT Projects in Europe ......................................................................................... 34
viii
2.3.2 MUT Projects in North America............................................................................. 35
2.3.3 MUT Projects in Asia ............................................................................................. 40
2.3.4 Studies about MUTs ............................................................................................... 44
2.3.5 MUT Case Studies .................................................................................................. 46
2.4 Building/Civil Information Modeling (BIM/CIM) ........................................................ 53
2.4.1 BIM Extension to Civil Information Modeling ...................................................... 53
2.4.2 Industry Foundation Classes (IFC) ......................................................................... 54
2.4.3 BIM Applications for MUT Lifecycle Management .............................................. 57
2.5 Summary and Conclusions ............................................................................................. 65
CHAPTER 3. OVERVIEW OF THE RESEARCH APPROACH .................................... 69
3.1 Introduction .................................................................................................................... 69
3.2 Overview of the Proposed Approach ............................................................................. 69
3.2.1 MUT Lifecycle Economy Assessment ................................................................... 71
3.2.2 Lifecycle Cost-sharing of MUTs ............................................................................ 72
3.2.3 BIM Extension to MUT .......................................................................................... 73
3.3 Summary ........................................................................................................................ 75
CHAPTER 4. LIFECYCLE COST ASSESSMENT AND COST-SHARING OF MUT 76
4.1 Introduction .................................................................................................................... 76
4.2 Proposed Method............................................................................................................ 76
4.2.1 Phase 1: Lifecycle Economy Assessment of MUTs ............................................... 78
4.2.2 Phase 2: Lifecycle Cost-sharing of MUTs .............................................................. 84
4.3 Case Study ...................................................................................................................... 89
4.3.1 Phase 1: Lifecycle Economy Assessment ............................................................... 89
ix
4.3.2 Phase 2: Lifecycle Cost-sharing .............................................................................. 92
4.4 Summary and Conclusions ............................................................................................. 99
CHAPTER 5. SMART MUT INFORMATION MODELING FOR LIFECYCLE
MANAGEMENT ...................................................................................................................... 100
5.1 Introduction ..................................................................................................................... 100
5.1 Proposed Framework for Smart MUT Information Modeling ..................................... 101
5.1.1 MUT lifecycle Information Requirements ............................................................ 102
5.1.2 SMUTIM Use Cases ............................................................................................. 119
5.1.3 IFC Extension to Accommodate SMUTIM .......................................................... 125
5.2 Case Study .................................................................................................................... 129
5.2.1 MUT 3D Design ................................................................................................... 130
5.2.2 4D Construction Simulation ................................................................................. 133
5.2.3 Facility Management ............................................................................................ 135
5.3 Summary and Conclusions ........................................................................................... 137
CHAPTER 6. SUMMARY, CONSTRIBUTIONS AND FUTURE WORKS ................ 138
6.1 Summary of Research .................................................................................................. 138
6.2 Research Contributions and Conclusions ..................................................................... 138
6.3 Limitations and Future Work ....................................................................................... 140
REFERENCES ....................................................................................................................... 143
APPENDICES ....................................................................................................................... 154
Appendix A – VED Quantification ......................................................................................... 155
Appendix B – PPP Cost-sharing ............................................................................................. 158
x
LIST OF FIGURES
Figure 2-1 MUTs around the world from 1866 (Laistner & Laistner, 2012) ................................. 7
Figure 2-2 Different types of MUTs (Hunt et al., 2014) ................................................................ 7
Figure 2-3 MUT types and position (Rogers & Hunt, 2006) .......................................................... 8
Figure 2-4 Example of modular MUT with pipes (AKpipe, 2017) ................................................ 9
Figure 2-5 MUT and Buried utilities LCCs .................................................................................. 16
Figure 2-6 VED cost visualization (Oum, 2017) .......................................................................... 18
Figure 2-7 Operational cost comparison of MUT and buried utility method (Laistner and Laistner,
2012) ............................................................................................................................................. 19
Figure 2-8 Cost curve of open-cut and MUT (Yang & Peng, 2016) ........................................... 20
Figure 2-9 MUT costs versus open-cut with and without yearly E&R (2mm pipe, undeveloped)
(Hunt et al. 2014) .......................................................................................................................... 21
Figure 2-10 PPP model for MUT projects in China (Yang & Peng, 2016) .................................. 27
Figure 2-11 Location of MUTs built at different time periods (Luo et al., 2020) ........................ 34
Figure 2-12 Primary utility duct in Bhopal, India (TATA, 2017) ................................................ 40
Figure 2-13 Secondary utility duct for Bhopal in India (TATA, 2017) ........................................ 41
Figure 2-14 MUT development planning map in Qatar (Lusail, 2015) ........................................ 41
Figure 2-15 Growth curve of MUT construction in China (Yang & Peng, 2016)........................ 43
Figure 2-16 Cross-section of CST (Japhethlim, 2012) ................................................................. 44
Figure 2-17 Main gallery section (Ramírez Chasco et al., 2011) ................................................. 47
Figure 2-18 Cross-section of the secondary utility gallery that connects from the main gallery to
the individual plots (Ramírez Chasco et al., 2011) ....................................................................... 48
Figure 2-19 Forming of the top slab (Ramírez Chasco et al., 2011) ............................................ 49
Figure 2-20 CAD drawing of rebar plan for precast reinforced sections (BYU, 2015) ............... 50
Figure 2-21 Cross-section of the precast concrete tunnel (BYU, 2015) ....................................... 50
Figure 2-22 Cross-section of steel tunnel (BYU, 2015) ............................................................... 50
Figure 2-23 3D rendering of steel tunnel design (BYU, 2015) .................................................... 50
Figure 2-24 Jack and bore tunneling operation (BYU, 2015) ...................................................... 52
Figure 2-25 Overview of infrastructure components and dependencies (Adapted from
BuildingSMART, 2019) ............................................................................................................... 54
xi
Figure 2-26 IFC Data schema architecture with conceptual layers (IFC, 2016) .......................... 55
Figure 2-27 Modeling of MUT and the elevated highway in AutoCad Civil 3D (Bao, 2017) ..... 59
Figure 2-28 Resulting MUT and the elevated highway in Autodesk Revit using Dynamo (Bao,
2017) ............................................................................................................................................. 59
Figure 2-29 Integrated model of existing pipes with other structures (Bao, 2017) ...................... 60
Figure 2-30 BIM model and 3D GIS model (Lee et al., 2018) ..................................................... 61
Figure 2-31 The Structure of the proposed framework of BIM-3D GIS integration (Lee et al., 2018)
....................................................................................................................................................... 63
Figure 2-32 Data flow of the proposed BIM-3D GIS and maintenance management framework
(Lee et al., 2018) ........................................................................................................................... 64
Figure 3-1 Structure of the proposed research approach .............................................................. 70
Figure 3-2 Factors influencing the lifecycle cost of MUT and buried utilities ............................ 71
Figure 4-1 MUT lifecycle economy assessment and cost-sharing method .................................. 77
Figure 4-2 Data requirements of the proposed MUT lifecycle economy assessment model ....... 82
Figure 4-3 BCR Balancing based on the threshold T and cost transfer ........................................ 87
Figure 4-4 Buried utilities in Ottawa Street in ArcGIS ................................................................ 89
Figure 4-5 Cross-section of MUT (adapted from drawings provided by City of Montreal) ........ 93
Figure 4-6 𝐿𝐶𝐶𝑖𝑀𝑈𝑇 before and after cost adjustments ................................................................. 98
Figure 5-1 Research methodology .............................................................................................. 102
Figure 5-2 Overview of MUT lifecycle information domains.................................................... 103
Figure 5-3 Relationships between MUT components and information domains ....................... 118
Figure 5-4 The main SMUTIM lifecycle use cases .................................................................... 119
Figure 5-5 MVD for MUT components...................................................................................... 126
Figure 5-6 New MUT physical and spatial IFC entities (new entities in gray) and examples of
entities for MUT sensory, pipe, and electrical systems .............................................................. 128
Figure 5-7 Part of IfcMUTElement EXPRESS file in JSDAI for Eclipse platform ................... 129
Figure 5-8 Examples of new families created for MUT in Revit ............................................... 130
Figure 5-9 MUT main components............................................................................................. 131
Figure 5-10 Screenshot of the connection of main to lateral MUT in a walkthrough animation 132
Figure 5-11 Underground view of a sample SMUTIM in Infraworks........................................ 132
Figure 5-12 Examples of detected clashes .................................................................................. 133

xii
Figure 5-13 Snapshots of 4D construction simulation ................................................................ 133
Figure 5-14 4D simulation of MUT construction in Fuzor......................................................... 134
Figure 5-15 Construction scheduling in Fuzor ........................................................................... 134
Figure 5-16 A prototype interface of environmental monitoring and control system ................ 136
Figure 6-1 Smart MUT system (Luo et al., 2019) ...................................................................... 141
xiii
LIST OF TABLES
Table 2-1 MUTs advantages/benefits for utility companies and municipalities .......................... 11
Table 2-2 MUT Benefits for utility users and citizens (social and environmental benefits) ........ 13
Table 2-3 Sharable MUT risk management actions (adapted from CERIU, 2011) ...................... 30
Table 2-4 MUT projects in Europe (Luo et al., 2020) .................................................................. 36
Table 2-5 MUTs in North America (Luo et al., 2020) .................................................................. 39
Table 2-6 MUTs in the Middle East and parts of Asia (Luo et al., 2020) .................................... 42
Table 2-7 Statistics of MUT length and cost in Taiwan (Ministry of the Interior, 2017) ............ 43
Table 2-8 Cost estimate summary by alternative (BYU, 2015).................................................... 52
Table 2-9 An example of MUT model data elements and data sources (Lee et al., 2018) ........... 62
Table 2-10 Summary of research using BIM and GIS for MUT .................................................. 64
Table 2-11 List of the main related research works ...................................................................... 66
Table 4-1 Factors influencing the lifecycle cost of MUT and buried utilities .............................. 78
Table 4-2 Case study information about MUT or buried utilities factors..................................... 90
Table 4-3 Total shared design and construction cost of MUT (CMTotal shared) (Adapted from Boileau,
2013) ............................................................................................................................................. 91
Table 4-4 Design and construction cost of buried utilities (CBi) and specific cost of installation in
MUT (CIMi) (Adapted from Boileau, 2013) ................................................................................ 91
Table 4-5 Operational (maintenance) yearly cost of buried utilities (OCBi) and MUT (SOCMi).
(Adapted from Boileau, 2013) ...................................................................................................... 91
Table 4-6 Lifecycle cost of buried utilities ................................................................................... 93
Table 4-7 Occupied volume of utilities in MUT .......................................................................... 93
Table 4-8 Lifecycle cost of utilities in MUT and gained benefit (before risk and benefit
adjustments) .................................................................................................................................. 94
Table 4-9 Comparison of the construction and operational costs of buried utilities and MUT .... 94
Table 4-10 Cost distribution for MUT sharable risk management actions ................................... 94
Table 4-11 Lifecycle cost of utilities in MUT and gained benefit after risk adjustment .............. 95
Table 4-12 The amounts of BCRi, BCRave, and their variances at 1st iteration ............................ 96
Table 4-13 The amounts of BCRi, BCRave, and their variances at 2nd iteration ........................... 96
Table 4-14 𝐿𝐶𝐶𝑖𝑀𝑈𝑇and GBi after risk and BCR adjustment ........................................................ 96
xiv
Table 4-15 Value of LCC and lifecycle benefit for each coalition ............................................... 97
Table 4-16 Contributed benefits and differences from gain benefit, cost transfer and 𝐿𝐶𝐶𝑖𝑀𝑈𝑇 .. 97
Table 5-1 Information requirements for tunnel structure ........................................................... 113
Table 5-2 Information requirements for pipes and their monitoring systems ............................ 114
Table 5-3 Information requirements for cables and their monitoring systems ........................... 115
Table 5-4 Information requirements for MUT ancillary facilities .............................................. 116
Table 5-5 Available sensors in IfcSensorTypeEnum applicable for MUT (IFC, 2016) ............. 127
Table 5-6 Some of the available property sets applicable for MUT in IfcPipeSegment (IFC, 2016)
..................................................................................................................................................... 127
xv
LIST OF ABBREVIATIONS
3D 3 Dimensional
4D 4 Dimensional
AHP Analytical Hierarchy Process
BCR Benefit-Cost Ratio
BIM Building Information Modeling
CB Design and construction cost of buried utilities
CCTV Closed-Circuit Television
CIPP Cured-In-Place Pipe
CIM Civil Information Modeling
CIM Common Information Model
CIM Specific utility installation cost of a company in MUT
CM Design and construction cost of MUT
COBie Construction Operations Building Information Exchange
CR Cost of risk management
CST Common Services Tunnel
CT Cost transfer
E&R Excavation and Reinstatement
FNDM Fiber Network Data Model
FV Future Value
GB Gained lifecycle benefit of a company by participating in MUT
GIS Geographic Information System
GUID Global Unique Identifier
HDPE High-density polyethylene
HTML Hypertext Markup Language
HVAC Heating, Ventilation, and Air Conditioning
HWR Hourly Wage Rate
IDM Information Delivery Manual
IEC International Electrotechnical Commission
IFC Industry Foundation Classes
INC Incentive for a company
IoT Internet of Things
ISO International Standards Organization
xvi
LCC Life Cycle Cost
LOD Level of Development
MUT Multi-purpose Utility Tunnel
MVD Model View Definition
O&M Operation and Maintenance
OB Operational cost of buried utilities
OCCS OmniClass Construction Classification System
OCM Operational cost of MUT
OCP Open-Cut Pulverization
OV Occupied volume of a utility company in MUT
PBC Proportion of Buried Cost
PD Project Duration
PODS Pipeline Open Data Standard
PUVO Proportion of Utility Volume Occupancy
PV Present Value
PVC Poly Vinyl Chloride
PPP Public-Private Partnership
RFID Radio-frequency identification
ROW Right of Way
SHM Structural health monitoring
SMUTIM Smart Multi-purpose Utility Tunnel Information Modeling
SOCM Specific operational cost of a company in MUT
STEP Standard for the Exchange of Product model data
SWOT Strengths, Weaknesses, Opportunities and Threats
TIM Tunnel Information Modeling
TxDOT Texas Department of Transportation
UAV Unmanned Aerial Vehicle
UUID Universal Unique Identifier
UV Ultra Violet curing
VED Vehicle Delay
VOR Vehicle Occupancy Rate
VOT Value of Time
VTD Vehicle Traffic Density
1
CHAPTER 1. INTRODUCTION
1.1 Background
Utility networks (e.g. gas, water and sewer pipes, and electrical and telecommunication cables) are
developed above and under the ground. Above ground utilities in urban areas can cause problems,
such as aesthetic issues, occupation of limited urban space, limited accessibility space, safety
issues related to utilities exposed to weather changes (e.g. hurricane, extreme high/low
temperature, and accident). Therefore, the traditional method of buried utilities is common for the
development of utility networks, especially in urban areas.
Different studies have reported that underground utilities infrastructure in developed countries has
aged and almost reached their service lives (Gagnon et al., 2008; Ormsby, 2009). Therefore, to
access aging buried utilities for repair, maintenance, and renewal activities, repeated excavation
and street cuts are needed. Urban areas have been experiencing many street closures and traffic
disruptions because of excavation for maintaining underground utilities. These construction works
have imposed major costs on public and private utility companies as well as on citizens and local
businesses (i.e. social cost) (Oum, 2017). As a solution, Multi-purpose Utility Tunnels (MUTs),
are defined as “underground utilidors containing one or more utility systems, permitting the
installation, maintenance, and removal of the system without making street cuts or excavations”
(Canto-Perello and Curiel-Esparza, 2013).
Two groups can benefit from MUTs: (a) utility companies, and (b) utility users and citizens. The
main benefits for utility companies include: (a) major cost-saving by reduction of repeated
excavation (Cano-Hurtado & Canto-Perello, 1999; Laistner, 1997; Rogers & Hunt, 2006), utility
installation (Canto-Perello & Curiel-Esparza, 2013), repair of streets and sidewalks (Hunt et al.,
2014), traffic control (Gilchrist & Allouche, 2005), and repair of detour road damage bearing extra
traffic load (Najafi & Kim, 2004), (b) reduced damage (Canto-Perello & Curiel-Esparza, 2013)
and corrosion of utilities (Canto-Perello & Curiel-Esparza, 2003), (c) facilitated inspection and
maintenance of utilities (Canto-Perello & Curiel-Esparza, 2013; Hunt et al., 2014; Clé de Sol,
2005), (d) cost savings related to facilitated future development and upgrade of utilities (Kang &
Choi, 2015; Clé de Sol, 2005), (e) reduction of municipal revenue loss from parking meter
2
machines, parking ticket (Ormsby, 2009; De Marcellis-Warin et al, 2013), and sales tax (Gilchrist
& Allouche, 2005; De Marcellis-Warin et al., 2013) , (f) decrease in labor accidental injury and
death (Ormsby, 2009; Clé de Sol, 2005) and (g) more organized underground space planning
(Sterling et al, 2012).
The utility users and citizens mainly benefit from MUTs (social benefits) because of: (a) cost and
time saving because of major reduction of traffic congestion (Gilchrist & Allouche, 2005; Clé de
Sol, 2005; Ormsby, 2009), (b) increased quality of utility services and customer satisfaction (Cano-
Hurtado & Canto-Perello, 1999; Laistner, 1997; Canto-Perello et al., 2009), (c) improved social
health, environment, and safety by preventing problems of construction works such as accidental
safety issues, noise, dust, vibration, and air, soil, and water pollution (Gilchrist & Allouche, 2005;
Najafi & Kim, 2004; Ormsby, 2009; CERIU, 2010; Jung & Sinha, 2007; Ferguson, 1995), (d)
reduced negative impact of construction work on local business because of fewer customers
(Ormsby, 2009; Manuilova et al., 2009), and (e) decrease in damage/temporary closure of
recreational facilities, e.g. parks (Ormsby, 2009).
1.2 Problem Statement and Research Gaps
Despite MUT benefits, MUTs are not extensively used in most countries, except China, due to
complicated (a) lifecycle economical assessment and justification, (b) fair cost-sharing, and (c)
coordination of utility companies.
• Lifecycle economical assessment and justification of MUT: Despite the high initial
investment needed, direct operational and social cost savings can make MUT Life Cycle Cost
(LCC) less than conventional buried utilities. To investigate if MUT is an economically viable
alternative for the traditional method of buried utilities in a specific project, different factors should
be considered related to the specifications of utilities, the location of the project, and the
construction method. The LCC of each method is a function of these factors. Therefore, there is a
need for a systematic approach to estimate the LCC and find a breakeven point where the costs of
both methods are equal. MUT is the economic method when the estimated LCC of MUT is lower
than that of buried utilities method.
3
• Fair cost-sharing of MUTs: After deciding on an MUT project, the next challenge is
financing and cost-sharing of the project (Canto-Perello & Curiel-Esparza, 2013). MUT should be
more economical for each utility company compared with the buried utility option (i.e.
organization level economic justification), and the MUT costs and benefits should be distributed
fairly to convince utility companies to participate in the MUT project. However, there is a gap in
defining the concept of fairness. Mathematical methods should be applied to define fairness based
on different concepts (i.e. balance of risk management costs, balance of benefits).
• Coordination issues of utility companies: Integrating different utilities in the confined
and shared space of MUT requires a high degree of coordination among utility companies.
Building Information Modeling (BIM) can be used for improving the coordination of utility
companies and facilitating the design, construction, and operation of MUTs. However, BIM is
mainly developed for buildings and has been extended to some civil structures (e.g. bridges,
tunnels). Despite the efforts for using BIM in MUT projects, there is a gap in extending BIM to
Smart MUT Information Modeling (SMUTIM). A smart MUT is equipped with sensors that
monitor MUT and ancillary facilities (e.g. security, Heating, Ventilation, and Air Conditioning
(HVAC), and communication systems). Also, using BIM is not enough to satisfy all the MUT
information requirements because: (1) BIM cannot support the information requirements of
surrounding environment (e.g. streets, buildings, underground structures); and (2) BIM is not able
to process the huge amount of real-time sensory data during MUT operation. Therefore, BIM
should be linked with Geographic Information Systems (GIS) to include the surrounding
environment information, and external databases for supporting real-time sensory data (Lee et al.,
2018). The use cases of BIM should be identified and extended to MUT. Industry Foundation
Classes (IFC), as the standard of BIM, should be extended to include the MUT-specific
components which are not available in buildings. Although the available resources, which use BIM
for MUTs, only concentrate on one or some aspects of MUTs (Kang et al., 2014; Bao, 2017; Lee
et al., 2018; Hu & Zhang, 2019; Ge & Xu, 2019; Li et al., 2019; Wu et al., 2019; Sfere, 2020;
Shahrour et al., 2020, Yin et al., 2020), the full extension of BIM to MUT should benefit from the
available resources to identify all the MUT components and information requirements.
4
1.3 Research Objectives
This research aims to achieve the following objectives:
(1) Improving the decision-making process related to MUT selection process by developing a
comprehensive and systematic approach for MUT and buried utilities LCC analysis. In addition,
investigating the influence of factors of utility specifications, location conditions, and construction
methods. The output of this model determines the LCC of MUT and buried utilities, and the design
and construction cost of MUT at the breakeven point.
(2) Improving the fairness of MUT cost-sharing by developing a fair model that considers
fairness based on (a) balance of risk, (b) balance of benefit and cost, and (c) balance of contributed
benefit and gained benefit. This model makes MUT the economical method for utility companies
and distributes the benefits and costs of MUT fairly among the utility companies.
(3) Improving the coordination among the MUT stakeholders by developing a framework
integrating BIM and 3D GIS for SMUTIM. The framework defines MUT information
requirements, identifies SMUTIM use cases, and extends Industry Foundation Classes (IFC) to
MUT.
1.4 Thesis Organization
The structure of this thesis is presented as follows:
Chapter 2 Literature review: This chapter reviews different aspects of MUT, such as classification,
construction methods, benefits and disadvantages, lifecycle cost assessment of MUT and buried
utilities, financing and cost-sharing of MUTs, and a review of MUT projects and studies around
the world. Finally, BIM extension for Civil Information Modeling (CIM), the current use of BIM-
based systems for MUT projects, and Industry Foundation Classes (IFC) extension for MUT are
reviewed.
Chapter 3 Overview of the research approach: The overview of the proposed research approach
and methodology are presented in this chapter.
5
Chapter 4 Lifecycle cost assessment and cost-sharing of MUT: This chapter covers cost issues
including (a) economy assessment of MUT and comparison with buried utilities method, and (b)
lifecycle cost-sharing of MUTs.
Chapter 5 Smart MUT information modeling for lifecycle management: This chapter goes through
the details of the proposed method for BIM extension to SMUTIM. The steps include (a) proposing
MUT lifecycle information modeling requirements, (b) identification of SMUTIM use cases, and
(c) proposing IFC extension to SMUTIM.
Chapter 6 Summary, Contributions, and Future Works: The work done in this research is
summarized in this chapter. The contributions at the end of this research are discussed and the
remaining work is explained as future work.
6
CHAPTER 2. LITERATURE REVIEW
2.1 Introduction
In this chapter, MUT classification, construction methods, benefits, and disadvantages are
discussed. Lifecycle costs of MUT and buried utilities are reviewed and compared afterward.
Then, the economy of MUT is compared with buried utilities within the lifecycle of MUT, to
investigate the long-term economic viability of MUTs. Other obstacles for promoting MUTs, i.e.
lifecycle financing and cost-sharing, are also discussed. A review of MUT projects and studies in
the world and case studies of MUT are presented afterward. Then, BIM/CIM and its application
and extension for MUT are discussed in this chapter.
2.1 Multi-purpose Utility Tunnel (MUT)
MUT classification, construction methods, benefits, and disadvantages are explained as follows.
2.1.1 MUT Classification
As shown in Figure 2-1, the history of MUT in the modern age started from 19th century (Laistner
& Laistner, 2012). Rectangular sections and rectangular/semi-circular sections of MUTs were
common in the 19th and 20th centuries. Circular sections have been used in recent years because of
the uniform distribution of forces on a circular tube and less damage from the concentration of
forces.
Rogers and Hunt (2006) classified MUTs based on depth, type, the position of installation, shape,
and material (Rogers & Hunt, 2006). Considering the depth of cover, MUT can be categorized into
three groups of flush-fitting (0.0 m), shallow (0.5–2 m), and deep (2–80 m), as shown by (Hunt et
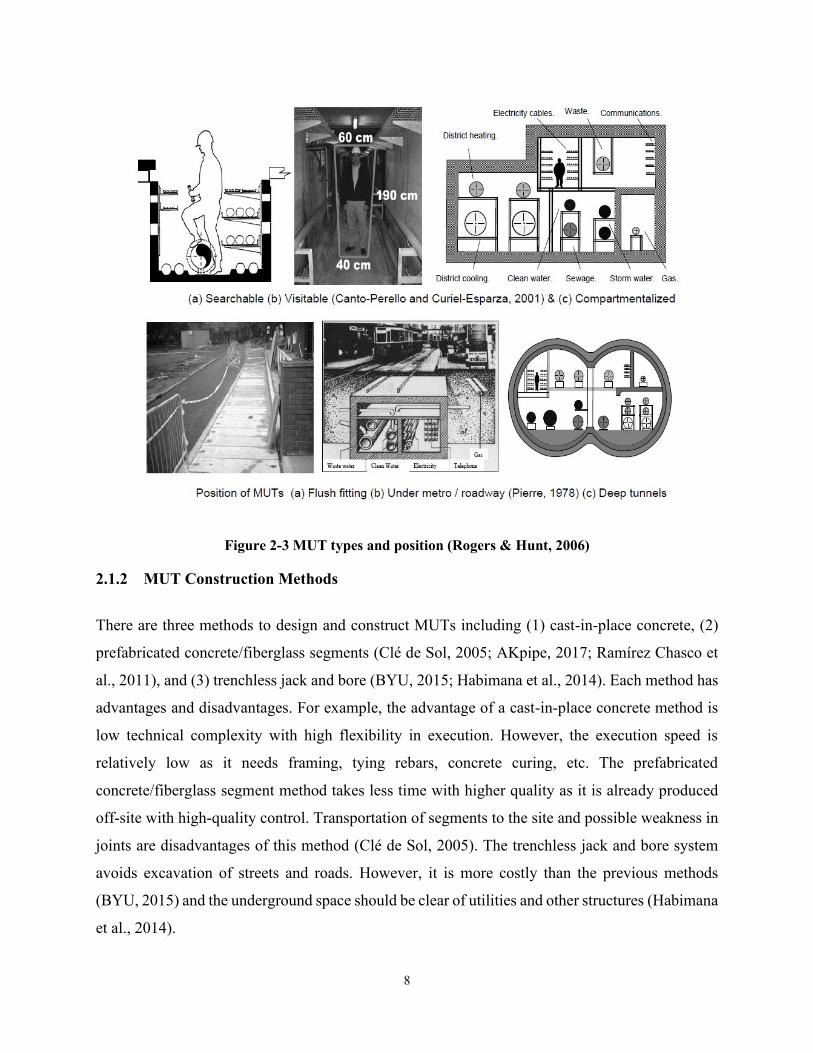
al., 2014) in Figure 2-2. Based on accessibility and internal space, MUT types of searchable,
visitable, and compartmentalized are defined. MUTs can be situated under roads, pathways, and
metros (Figure 2-3). They can be constructed with different shapes including trapezoid,
rectangular, rectangular with lid, circular, ovoid with the gutter, and double oval. The possible
materials of the tunnel are High-Density Polyethylene (HDPE), cast-in-place concrete, pre-cast
concrete sections, steel, brick and mortar, and sprayed concrete.
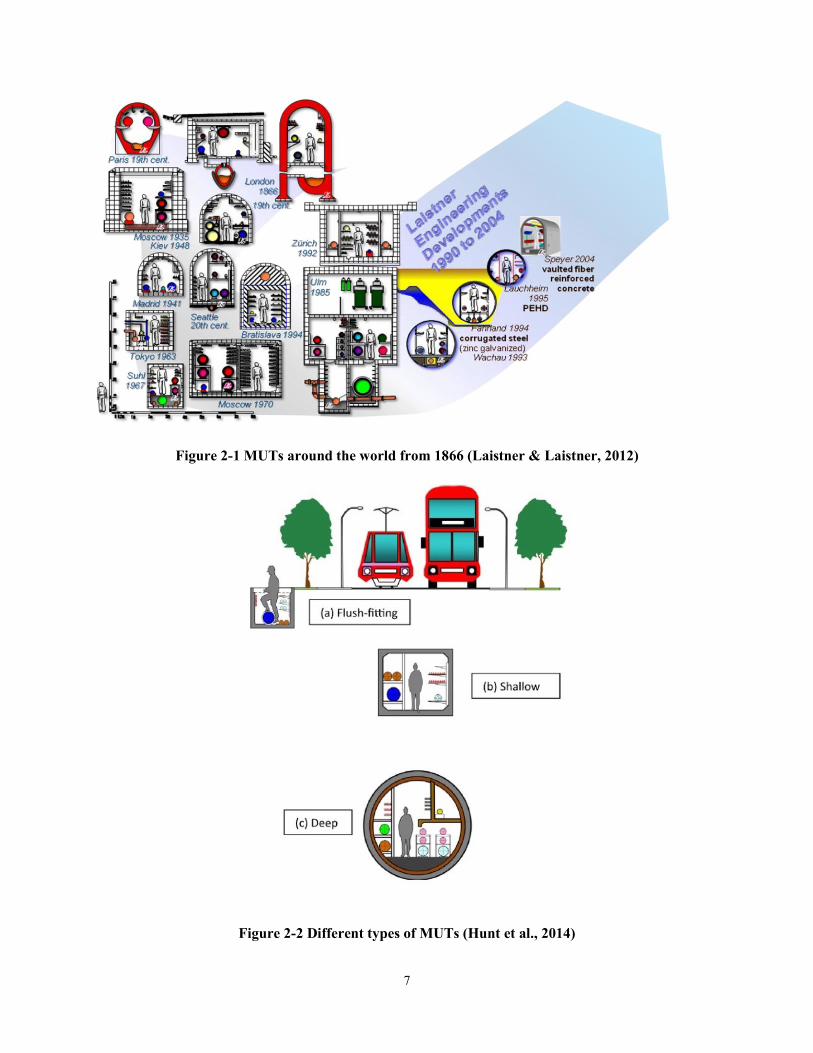
7
Figure 2-1 MUTs around the world from 1866 (Laistner & Laistner, 2012)
Figure 2-2 Different types of MUTs (Hunt et al., 2014)
8
Figure 2-3 MUT types and position (Rogers & Hunt, 2006)
2.1.2 MUT Construction Methods
There are three methods to design and construct MUTs including (1) cast-in-place concrete, (2)
prefabricated concrete/fiberglass segments (Clé de Sol, 2005; AKpipe, 2017; Ramírez Chasco et
al., 2011), and (3) trenchless jack and bore (BYU, 2015; Habimana et al., 2014). Each method has
advantages and disadvantages. For example, the advantage of a cast-in-place concrete method is
low technical complexity with high flexibility in execution. However, the execution speed is
relatively low as it needs framing, tying rebars, concrete curing, etc. The prefabricated
concrete/fiberglass segment method takes less time with higher quality as it is already produced
off-site with high-quality control. Transportation of segments to the site and possible weakness in
joints are disadvantages of this method (Clé de Sol, 2005). The trenchless jack and bore system
avoids excavation of streets and roads. However, it is more costly than the previous methods
(BYU, 2015) and the underground space should be clear of utilities and other structures (Habimana
et al., 2014).
9
The high initial investment for the design and construction of MUTs can be reduced by applying
new construction technologies, such as prefabrication and modularization, which provide economy
of scale. It means that the cost of production per unit is reduced with a high volume of production.
Prefabrication and modular design of MUTs need to consider specific conditions of a project, such
as soil characteristics, underground water elevation, on-site urban structures and facilities, the
distance of transportation of modules, available space of road for transportation and installation of
modules, the scale of the project, and geographic features of the region. Modularization is a new
technology that can potentially reduce MUTs construction cost and time, and also improve its
quality. In modularization, the modules of a system, such as a building, sewer system, tunnel, etc.,
are completely fabricated in a factory away from the construction site. The large modules are
divided into smaller portions to be transported to the site (Haas et al., 2000). In the prefabrication
process, different materials are joined, to produce a component of the building system to be
installed later on the site (Tatum et al., 1987).
Modular construction is widely used for building construction (O’Connor et al., 2014). Also, the
construction of sewer lines benefits from prefabricated modular segments (e.g. concrete culvert)
which are buried underground. Since MUTs are underground tunnels that encompass different
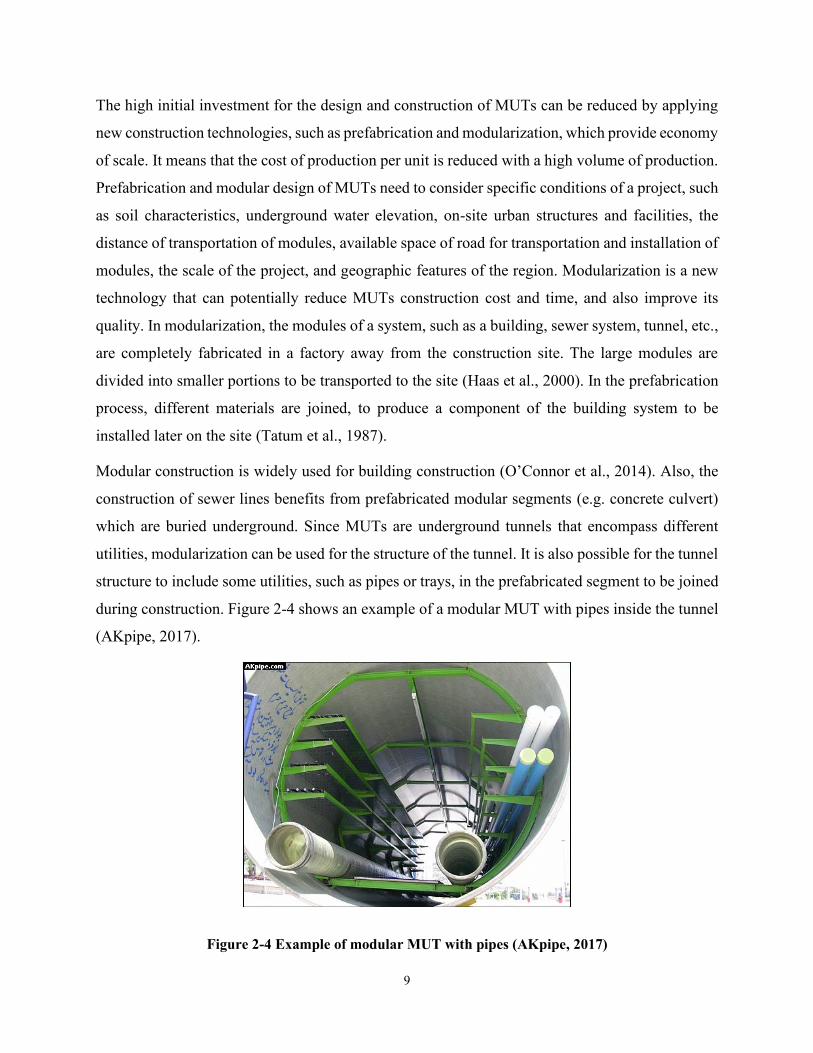
utilities, modularization can be used for the structure of the tunnel. It is also possible for the tunnel
structure to include some utilities, such as pipes or trays, in the prefabricated segment to be joined
during construction. Figure 2-4 shows an example of a modular MUT with pipes inside the tunnel
(AKpipe, 2017).
Figure 2-4 Example of modular MUT with pipes (AKpipe, 2017)
10
2.1.3 MUT Benefits
MUT benefits can be categorized into two groups: benefits for utility companies and
municipalities, and benefits for utility users and citizens (social and environmental benefits). These
benefits are explained in detail as follows.
2.1.3.1 MUT Advantages for Utility Companies and Municipalities
The municipality and utility companies (e.g. electricity and telecommunication network
companies, water and sewer companies) can gain great benefits from using MUTs. These benefits
are shown in Table 2-1 and explained below.
(1) Major reduction of construction costs (i.e. costs of excavation, traffics congestion, road repair,
injury, and death): The costs of excavation and reinstatement related to underground utilities
during their lifecycle will be greatly reduced by using MUTs. These costs pertain to the long-term
sustainability costs of utilities (Cano-Hurtado & Canto-Perello, 1999; Canto-Perello & Curiel-
Esparza, 2013; Laistner A., 1997; Rogers & Hunt, 2006). Maintenance work inside the space of
the tunnel decreases the volume of construction work on the ground, as well as the needed
equipment and machinery, workforce, and material. Blocking streets due to construction work will
be reduced majorly and normal traffic continues Consequently the traffic control costs are
decreased (Gilchrist & Allouche, 2005). During construction work, the vehicles use detour roads,
which may not be designed for heavy traffic load. MUTs reduce the damage to detour roads by
avoiding lifecycle repeated excavations and reinstatements for utility maintenance and repair
(Najafi & Kim, 2004). There are fewer disturbances for local businesses and residents of that area.
The impact of excavation on the roads, sidewalks, tree roots, and other structures around the project
is reduced majorly, which leads to reduced repair costs (Hunt et al., 2014). Less construction work
during the lifecycle of utilities results in less accidental injury and death of labor and also less
collision of vehicles with traffic control and safety tools, construction structures, construction
vehicles, equipment, and workers (Ormsby, 2009; CERIU, 2010).
(2) Improved inspection and maintenance of utilities: The space of MUTs provides better access
for inspection and assessment of underground utilities (Hunt et al., 2014; Canto-Perello & Curiel-
Esparza, 2013). This preventive inspection leads to a reduction in the failure of utilities (e.g. pipe
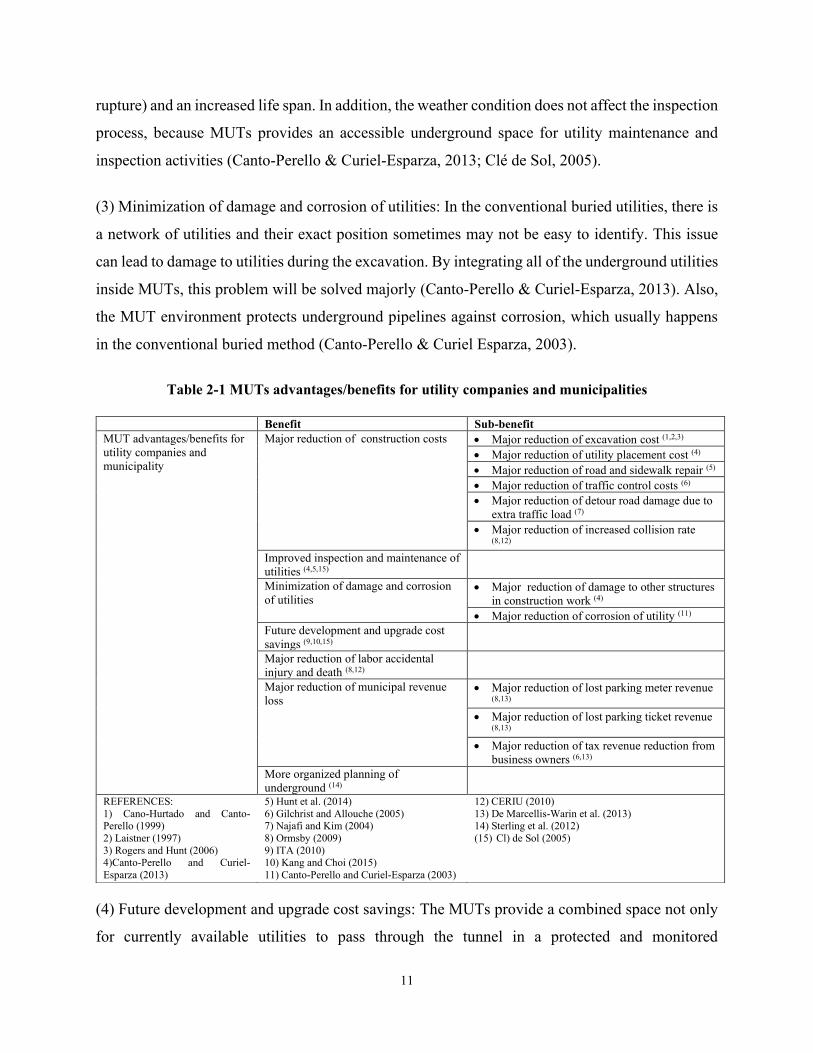
11
rupture) and an increased life span. In addition, the weather condition does not affect the inspection
process, because MUTs provides an accessible underground space for utility maintenance and
inspection activities (Canto-Perello & Curiel-Esparza, 2013; Clé de Sol, 2005).
(3) Minimization of damage and corrosion of utilities: In the conventional buried utilities, there is
a network of utilities and their exact position sometimes may not be easy to identify. This issue
can lead to damage to utilities during the excavation. By integrating all of the underground utilities
inside MUTs, this problem will be solved majorly (Canto-Perello & Curiel-Esparza, 2013). Also,
the MUT environment protects underground pipelines against corrosion, which usually happens
in the conventional buried method (Canto-Perello & Curiel Esparza, 2003).
Table 2-1 MUTs advantages/benefits for utility companies and municipalities
(4) Future development and upgrade cost savings: The MUTs provide a combined space not only
for currently available utilities to pass through the tunnel in a protected and monitored
Benefit Sub-benefit
MUT advantages/benefits for
utility companies and
municipality
Major reduction of construction costs • Major reduction of excavation cost (1,2,3)
• Major reduction of utility placement cost (4)
• Major reduction of road and sidewalk repair (5)
• Major reduction of traffic control costs (6)
• Major reduction of detour road damage due to
extra traffic load (7)
• Major reduction of increased collision rate (8,12)
Improved inspection and maintenance of
utilities (4,5,15)
Minimization of damage and corrosion
of utilities • Major reduction of damage to other structures
in construction work (4)
• Major reduction of corrosion of utility (11)
Future development and upgrade cost
savings (9,10,15)
Major reduction of labor accidental
injury and death (8,12)
Major reduction of municipal revenue
loss • Major reduction of lost parking meter revenue
(8,13)
• Major reduction of lost parking ticket revenue (8,13)
• Major reduction of tax revenue reduction from
business owners (6,13)
More organized planning of
underground (14)
REFERENCES:
1) Cano-Hurtado and Canto-Perello (1999)
2) Laistner (1997)
3) Rogers and Hunt (2006) 4)Canto-Perello and Curiel-
Esparza (2013)
5) Hunt et al. (2014)
6) Gilchrist and Allouche (2005) 7) Najafi and Kim (2004)
8) Ormsby (2009)
9) ITA (2010) 10) Kang and Choi (2015)
11) Canto-Perello and Curiel-Esparza (2003)
12) CERIU (2010)
13) De Marcellis-Warin et al. (2013) 14) Sterling et al. (2012)
(15) Cl) de Sol (2005)
12
environment, but also make the future placement, change, decommission, and upgrading of
utilities much easier and cheaper than the open-cut method (ITA, 2010; Kang & Choi, 2015; Clé
de Sol, 2005).
(5) Major reduction of labor accidental injury and death: Construction work includes activities that
can be harmful to the laborers and employees. It can cause illness, injury, and death. The workers
are subject to the risk of trenching-related death and serious injuries (Ormsby, 2009; CERIU,
2010). Therefore, MUTs reduce labor accidental injury and death by avoiding repeated
constructions.
(6) Major reduction of municipal revenue loss: By closing the streets, parking meter machines
become deactivated and no more income is gained by them. The parking ticket revenue is reduced
majorly too (Ormsby, 2009; De Marcellis-Warin et al., 2013). Closing streets leads to less
shopping from local businesses and reduces the sale tax revenue (Gilchrist & Allouche, 2005; De
Marcellis-Warin et al., 2013).
(7) More organized planning of underground space: Integrating all utilities in the closed space of
MUT enables utility companies and municipalities to better organize underground space (Sterling
et al., 2012).
2.1.3.2 MUT Advantages for Utility Users and Citizens (Social and Environmental
Benefits)
The social and environmental benefits of MUTs are related to the users of the utilities and the
roads, and generally, all citizens who are living or have a business in the area or even the city.
These benefits/advantages are shown in Table 2-2, and include:
(1) Major reduction of traffic congestion or detour road: Due to traffic congestion or detour roads,
the vehicles arrive destination with delay. This delay wastes the time of the vehicle passengers and
imposes them delay cost (Gilchrist & Allouche, 2005; Ormsby, 2009; Oum, 2017). Also, the
operation costs of vehicles increase because of the extra operation time due to traffic congestion
or detour roads (Ormsby, 2009; CERIU, 2010; De Marcellis-Warin et al., 2013; Clé de Sol, 2005).
In addition to the vehicle's passenger, pedestrians are also affected by delays because of
construction works and losing time (Ormsby, 2009). Another cost is imposed to emergency
13
vehicles (e.g. ambulance, firefighter vehicle, police) because of loss of time due to the road
obstruction (Ormsby, 2009; CERIU, 2010; De Marcellis-Warin et al., 2013).
Table 2-2 MUT Benefits for utility users and citizens (social and environmental benefits)
(2) Improved health, environment, and safety: Construction work for open-cut utility maintenance
and placement activities causes safety issues (e.g. injuries or death by accident) due to falling into
excavation or collapse of trenches. Also, closing roads will be an obstacle for emergency vehicles
to pass fast (Ormsby, 2009; CERIU, 2010). In addition, the noise and vibration of machinery in
construction works of the open-cut method (Jung & Sinha, 2007), cause health problems for
citizens (e.g. high blood pressure, disturbance for sleep) and consequently reduced productivity
(Gilchrist & Allouche, 2005). The dust propagation to the air from construction work and emission
of toxic gases and air, soil (Ferguson, 1995), and underground water pollution (Gilchrist &
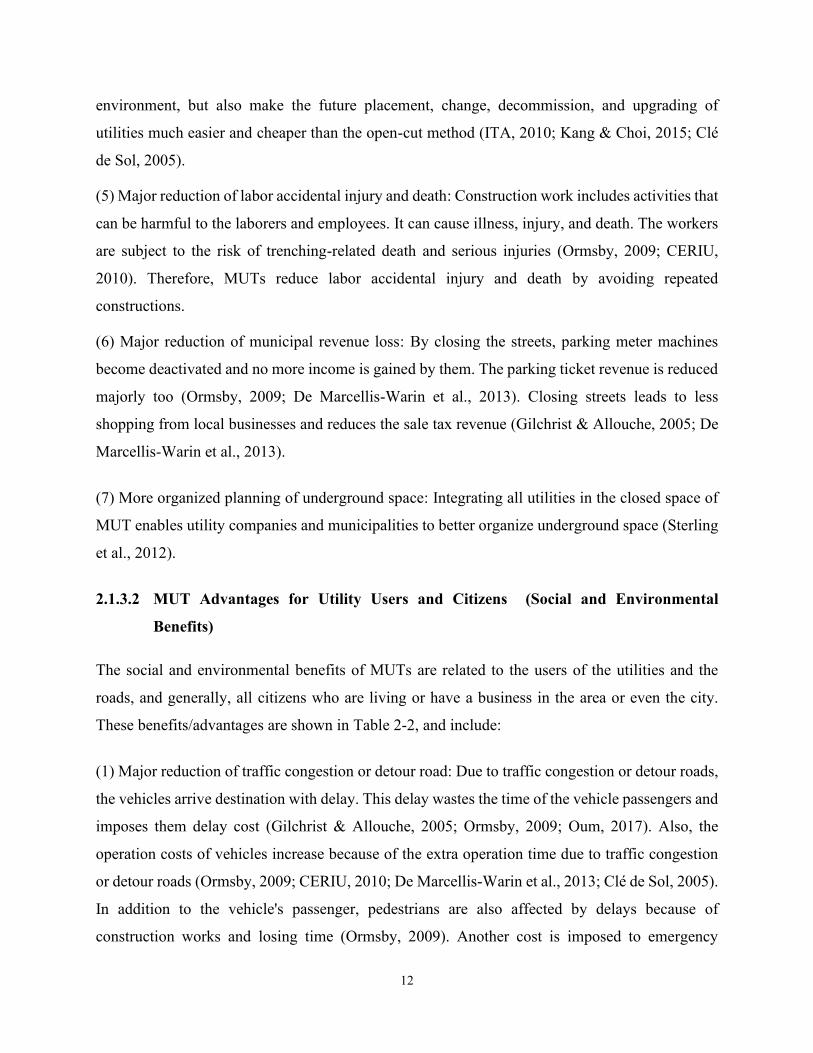
Benefit Sub-benefit
MUT Benefits for users
(social and environmental
benefits)
Major reduction of traffic
congestion or detour • Major reduction of vehicle delay time costs (3,5,13,
14)
• Major reduction of pedestrian delay time costs (5)
• Major reduction of extra operation costs of
vehicles (5,6,7)
• Major reduction of emergency vehicle obstruction (5,6,7)
Improved health • Major reduction of the dust of construction work (6,8,9)
• Major reduction of noise of construction work (3,4,10)
• Major reduction of vibration of construction work (3,7,10)
Major reduction of environmental
pollution • Major reduction of air pollution (3,9)
• Major reduction of soil pollution (3,9)
• Major reduction of underground water
contamination (3,8,9)
Improved safety • Major reduction of accidental injury and death (5,6)
• Major reduction of emergency vehicles
obstruction (5,6)
Improved quality of utility services
and customer satisfaction (1,2,11)
Major reduction of local business
loss (5,12)
Major reduction of
damage/temporary closure of
recreational facilities (5)
REFERENCES:
1) Cano-Hurtado and Canto-
Perello (1999) 2) Laistner (1997)
3) Gilchrist and Allouche (2005)
4) Najafi and Kim (2004)
5) Ormsby (2009) 6) CERIU (2010)
7) De Marcellis-Warin et al. (2013) 8) Werey et al. (2005)
9) Ferguson (1995)
10) Jung and Sinha (2007)
11) Canto-Perello et al. (2009) 12) Manuilova et al. (2009)
13) Clé de Sol (2005) 14) Oum (2017)
14
Allouche, 2005; Ferguson, 1995; Werey et al., 2005) are other issues related to the health of people
and environmental problem.
(3) Improved quality of utility services and customer satisfaction: Because of better inspection
and maintenance of utilities by using tunnels, the number of faults and breakdowns decreases, and
the expected life span of the utilities increases (Laistner, 1997). This helps the utility companies
to provide a better quality of services with fewer service disruption and cheaper services cost
(Cano-Hurtado & Canto-Perello, 1999; Canto-Perello et al., 2009). Customer satisfaction increases
through the higher quality of services and fewer charges.
(4) Major reduction of local business loss: The local businesses in the area of construction work
can be affected negatively and lose income because of reduced customers. As an example, the
businesses that provide delivery services will encounter delays as a consequence of traffic
congestion and road closure (Ormsby, 2009; Manuilova et al., 2009).
(5) Major reduction of damage/temporary closure of recreational facilities: Recreational facilities
(e.g. parks, playgrounds) are usually closed or damaged temporarily because of construction
works. This has a negative impact on the users of these facilities (Ormsby, 2009).
2.1.4 MUT Disadvantages
The main disadvantages of MUTs are:
(1) High initial investment cost: The initial investment to construct an MUT is much more than
the conventional buried utilities method and is not affordable for a single utility company (Rogers
& Hunt, 2006) even by considering the possibility of renting the space to other utility companies
after construction (Hunt et al., 2014). The huge investment is needed because more volume of
construction work is required, from excavation to the structure of the MUT, for items such as
material, labor, and equipment (McKim, 1997). Some conditions are more likely for construction
of MUT (e.g. deep excavation, waterproofing, shoring) that are not needed usually for
conventional open-cut methods, and add expenses to MUT projects (Najafi & Kim, 2004). In
addition, the need for installing temporary bypass utilities for keeping the utilities in service and
their diversion imposes an extra cost for MUT projects (McKim, 1997; Rogers & Hunt, 2006).
15
(2) Disruption of services: The disruption duration of utility services can be critical for
decommissioning and construction of new MUTs. A high density of underground utilities needs
very deep MUTs to pass under them while construction work is ongoing, to keep the services
during a project (Cano-Hurtado & Canto-Perello, 1999; Hunt & Rogers, 2005).
(3) Compatibility and safety issue: Placing of some utilities close to each other has a high risk,
because of their incompatibility (Cano-Hurtado & Canto-Perello, 1999; Hunt & Rogers, 2005).
For example, (1) housing of gas pipes and electricity cables together imposes a potential risk of
fire (Canto-Perello & Curiel-Esparza, 2001; Legrand et al., 2004; Canto-Perello et al., 2009).
Therefore, if a utility fails, the other utilities are in danger of damage (Hunt et al., 2014).
(4) Security risks: Providing the security of MUTs from human attacks to the integrated and
accessible utilities in MUTs is another issue. To improve the security of MUTs, various solutions
are suggested, such as limiting access doors, limiting access for people, sensors, and surveillance
systems (Canto-Perello & Curiel-Esparza, 2013).
(5) Coordination issue: A higher degree of coordination between utility companies, municipality,
and the utility users is required in MUTs for installation and maintenance activities (Canto-Perello
et al., 2009). Since MUTs integrate different utilities in a tunnel, the responsible people and
organizations of these utilities (e.g. technical operators and engineers) need more cooperation than
the usual system (Laistner & Laistner, 2012). This coordination needs a very good level of
management compared to conventional open-cut maintenance and installation works.
2.2 Lifecycle Cost of MUT versus Buried Utilities
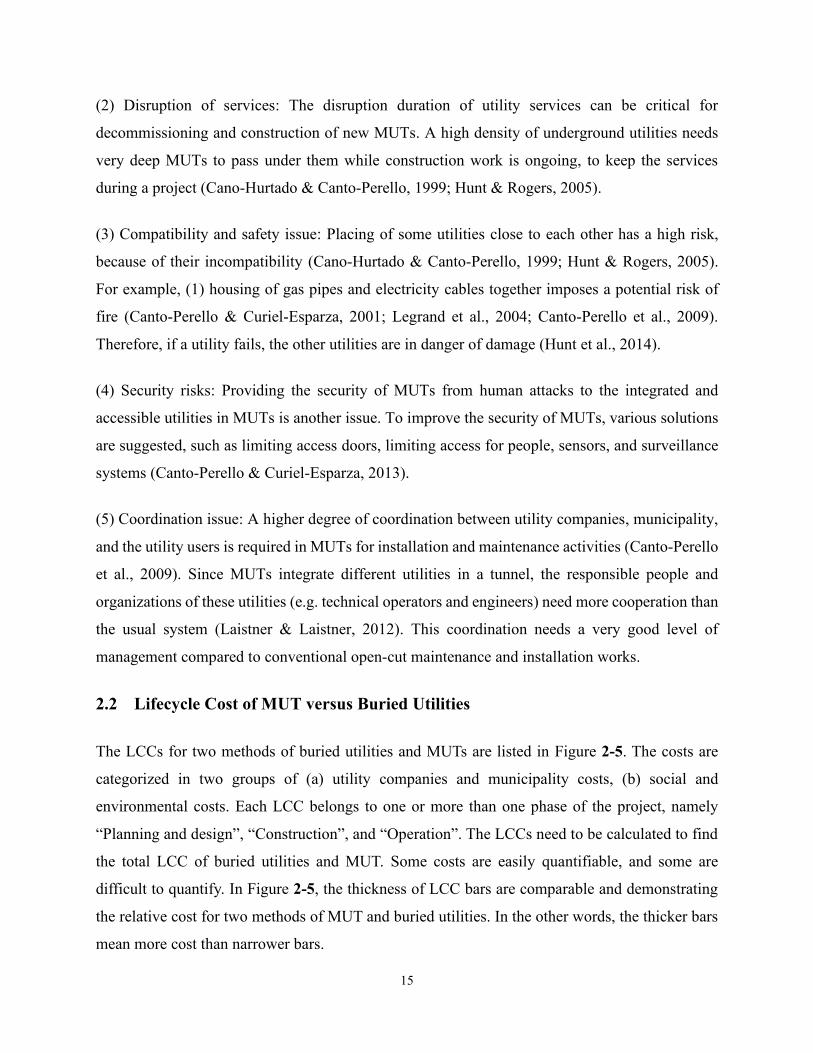
The LCCs for two methods of buried utilities and MUTs are listed in Figure 2-5. The costs are
categorized in two groups of (a) utility companies and municipality costs, (b) social and
environmental costs. Each LCC belongs to one or more than one phase of the project, namely
“Planning and design”, “Construction”, and “Operation”. The LCCs need to be calculated to find
the total LCC of buried utilities and MUT. Some costs are easily quantifiable, and some are
difficult to quantify. In Figure 2-5, the thickness of LCC bars are comparable and demonstrating
the relative cost for two methods of MUT and buried utilities. In the other words, the thicker bars
mean more cost than narrower bars.
16
Figure 2-5 MUT and Buried utilities LCCs
Although quantifying the social costs is not always easy, some mathematical methods have been
developed for this purpose (Oum, 2017). For example, the cost of Dirt and Dust Cleaning (DDC)
for the buildings affected by construction can be calculated by Equation (2-1) (Oum, 2017):
𝐷𝐷𝐶 = 𝐿𝐶𝐶 × 𝑃𝐷 × ∑ 𝐹𝐶𝐵𝑏 × 𝐴𝑆𝐶𝑏
𝐵𝑢𝑖𝑙𝑑𝑖𝑛𝑔 (𝑏)
(2-1)
Where
LCC: local cleaning cost per m2
PD: project duration in days
FCBb: frequency of cleaning buildings per day
ASCb: area of the surface to be cleaned
17
Another example of quantification of social costs is Vehicle Delay (VED) cost for both partial and
complete road closures, presented by Oum (2017). A vehicle delay (VED) cost is defined to
calculate the costs of travel delays borne by vehicle passengers because of increased travel route
or time. Using Equations (2-2), (2-3) and (2-4), the needed variables to predict VED costs include
the project duration (PDi), the increased travel time (∆Tij), the vehicle traffic density (VTDijkl), the
value of time lost in traffic (VOTijkl) and vehicle occupancy rate (VORk), where i is the day of the
week, j is the time of the day, k is the type of vehicle and l is the type of trips (Appendix A).
𝑉𝐸𝐷𝑝𝑎𝑟𝑡𝑖𝑎𝑙 𝑐𝑙𝑜𝑠𝑢𝑟𝑒,𝑓𝑜𝑟 𝑣𝑒ℎ𝑖𝑐𝑙𝑒𝑠 𝑔𝑜𝑖𝑛𝑔 𝑡ℎ𝑟𝑜𝑢𝑔ℎ 𝑡ℎ𝑒 𝑤𝑜𝑟𝑘 𝑧𝑜𝑛𝑒
= ∑ 𝑃𝐷𝑖 × (∑ 𝛥𝑇𝑖𝑗 𝑐𝑜𝑛𝑔𝑒𝑠𝑡𝑖𝑜𝑛
6
𝑗=1
3
𝑖=1
× (∑ 𝑉𝑂𝑅𝑘 × ∑(𝑉𝑇𝐷𝑖𝑗𝑘𝑙 × 𝑉𝑂𝑇𝑖𝑗𝑘𝑙)
2
𝑙=1
))
4
𝑘=1
(2-2)
𝑉𝐸𝐷𝑐𝑜𝑚𝑝𝑙𝑒𝑡𝑒 𝑐𝑙𝑜𝑠𝑢𝑟𝑒,𝑓𝑜𝑟 𝑣𝑒ℎ𝑖𝑐𝑙𝑒𝑠 𝑡ℎ𝑎𝑡 𝑎𝑟𝑒 𝑑𝑒𝑡𝑜𝑢𝑟𝑒𝑑
= ∑ 𝑃𝐷𝑖 × (∑(𝛥𝑇𝑖𝑗
6
𝑗=1
3
𝑖=1
+ 𝛥𝑇𝑖𝑗 𝑐𝑜𝑛𝑔𝑒𝑠𝑡𝑖𝑜𝑛) × (∑ 𝑉𝑂𝑅𝑘 × ∑(𝑉𝑇𝐷𝑖𝑗𝑘𝑙 × 𝑉𝑂𝑇𝑖𝑗𝑘𝑙)
2
𝑙=1
))
4
𝑘=1
(2-3)
𝑉𝐸𝐷𝑐𝑜𝑚𝑝𝑙𝑒𝑡𝑒 𝑐𝑙𝑜𝑠𝑢𝑟𝑒,𝑓𝑜𝑟 𝑣𝑒ℎ𝑖𝑐𝑙𝑒𝑠 𝑡ℎ𝑎𝑡 𝑎𝑟𝑒 𝑛𝑜𝑟𝑚𝑎𝑙𝑙𝑦 𝑖𝑛 𝑐𝑖𝑟𝑐𝑢𝑙𝑎𝑡𝑖𝑜𝑛 𝑜𝑛 𝑎𝑙𝑡𝑒𝑟𝑛𝑎𝑡𝑒 𝑟𝑜𝑎𝑑𝑠
= ∑ 𝑃𝐷𝑖 × (∑ 𝛥𝑇𝑖𝑗
6
𝑗=1
3
𝑖=1
× (∑ 𝑉𝑂𝑅𝑘 × ∑(𝑉𝑇𝐷𝑖𝑗𝑘𝑙 × 𝑉𝑂𝑇𝑖𝑗𝑘𝑙)
2
𝑙=1
))
4
𝑘=1
(2-4)
VED is discretized based on the day of the week (i= Weekday, Saturday, Sunday), the time of day
(j= Night, Morning, Morning peak hours, Midday, Afternoon peak hour, Evening), the type of
vehicle (k=automobile, bus, light truck, heavy truck), and the type of trips (l=business-trip, non-
business trip). Then VTD can be obtained either manually or by a radar traffic counter. The
assumed value of VOT is $17.6/per hr according to the average Hourly Wage Rate (HWR) of the
province of Quebec. This leads to very high social costs for vehicle delays. To avoid this
assumption that VOT of each driver is $17.6 for one hour of delay, Oum (2017) proposed to use a
VOT based on HWR around $17 for business trips and a VOT of 1.5$ based on the price of a cup
of coffee for non-business trips. For non-business trips during off-peak hours and during nighttime
for all trips, VOT is assumed to be $0.
After a mathematical process, Oum (2017) presented Equation (2-5):
18
𝑉𝐸𝐷 𝑐𝑜𝑠𝑡𝑠 = ((𝑎 × 𝑉𝑇𝐷𝑎𝑢𝑡𝑜 + 𝑏 × 𝑉𝑇𝐷𝑙𝑖𝑔ℎ𝑡 𝑡𝑟𝑢𝑐𝑘 + 𝑐 × 𝑉𝑇𝐷ℎ𝑒𝑎𝑣𝑦 𝑡𝑟𝑢𝑐𝑘
+ 𝑑 × 𝑉𝑇𝐷𝑏𝑢𝑠). 𝑒𝑒.𝑅𝑜𝑎𝑑 𝑙𝑒𝑛𝑔𝑡ℎ) × 𝑃𝑟𝑜𝑗𝑒𝑐𝑡 𝑑𝑢𝑟𝑎𝑡𝑖𝑜𝑛𝑓)
(2-5)
where Road length is in meter and Project duration is in days. The values of coefficients are
calculated using a regression method.
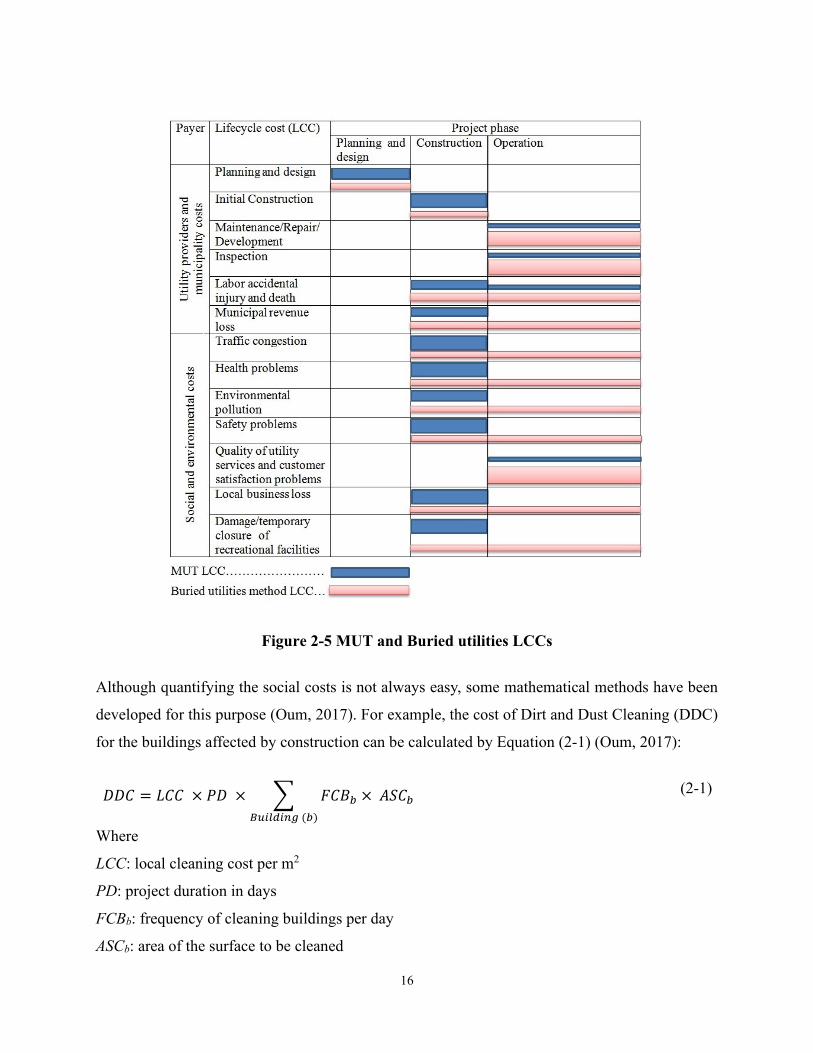
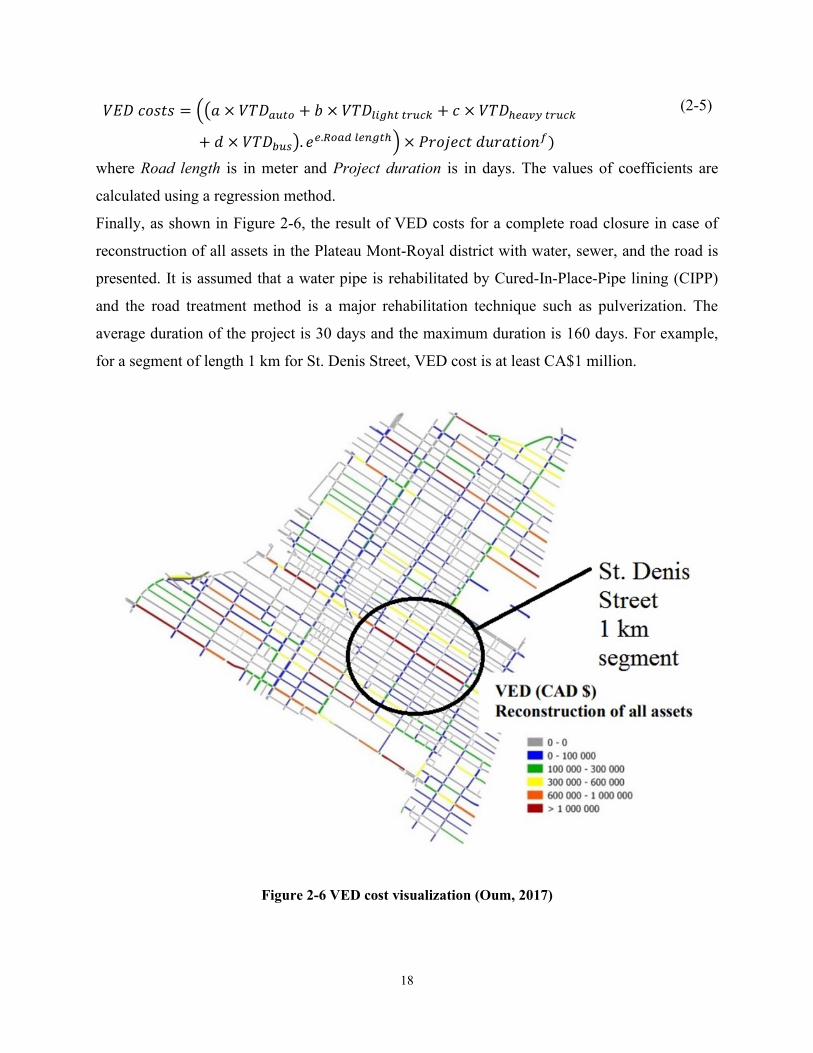
Finally, as shown in Figure 2-6, the result of VED costs for a complete road closure in case of
reconstruction of all assets in the Plateau Mont-Royal district with water, sewer, and the road is
presented. It is assumed that a water pipe is rehabilitated by Cured-In-Place-Pipe lining (CIPP)
and the road treatment method is a major rehabilitation technique such as pulverization. The
average duration of the project is 30 days and the maximum duration is 160 days. For example,
for a segment of length 1 km for St. Denis Street, VED cost is at least CA$1 million.
Figure 2-6 VED cost visualization (Oum, 2017)
19
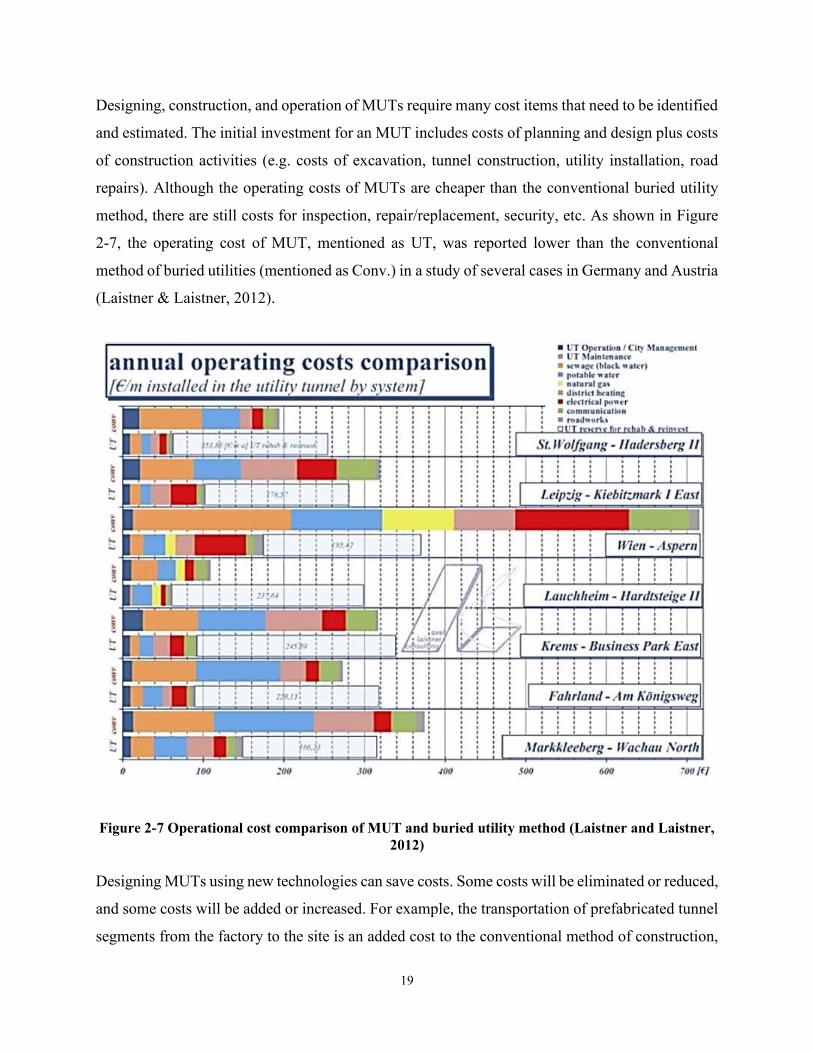
Designing, construction, and operation of MUTs require many cost items that need to be identified
and estimated. The initial investment for an MUT includes costs of planning and design plus costs
of construction activities (e.g. costs of excavation, tunnel construction, utility installation, road
repairs). Although the operating costs of MUTs are cheaper than the conventional buried utility
method, there are still costs for inspection, repair/replacement, security, etc. As shown in Figure
2-7, the operating cost of MUT, mentioned as UT, was reported lower than the conventional
method of buried utilities (mentioned as Conv.) in a study of several cases in Germany and Austria
(Laistner & Laistner, 2012).
Figure 2-7 Operational cost comparison of MUT and buried utility method (Laistner and Laistner,
2012)
Designing MUTs using new technologies can save costs. Some costs will be eliminated or reduced,
and some costs will be added or increased. For example, the transportation of prefabricated tunnel
segments from the factory to the site is an added cost to the conventional method of construction,
20
while the fast installation of the tunnel reduces labor costs. There is a need for identification and
measurement of costs to enable project stakeholders to compare the cost savings from using new
technology.
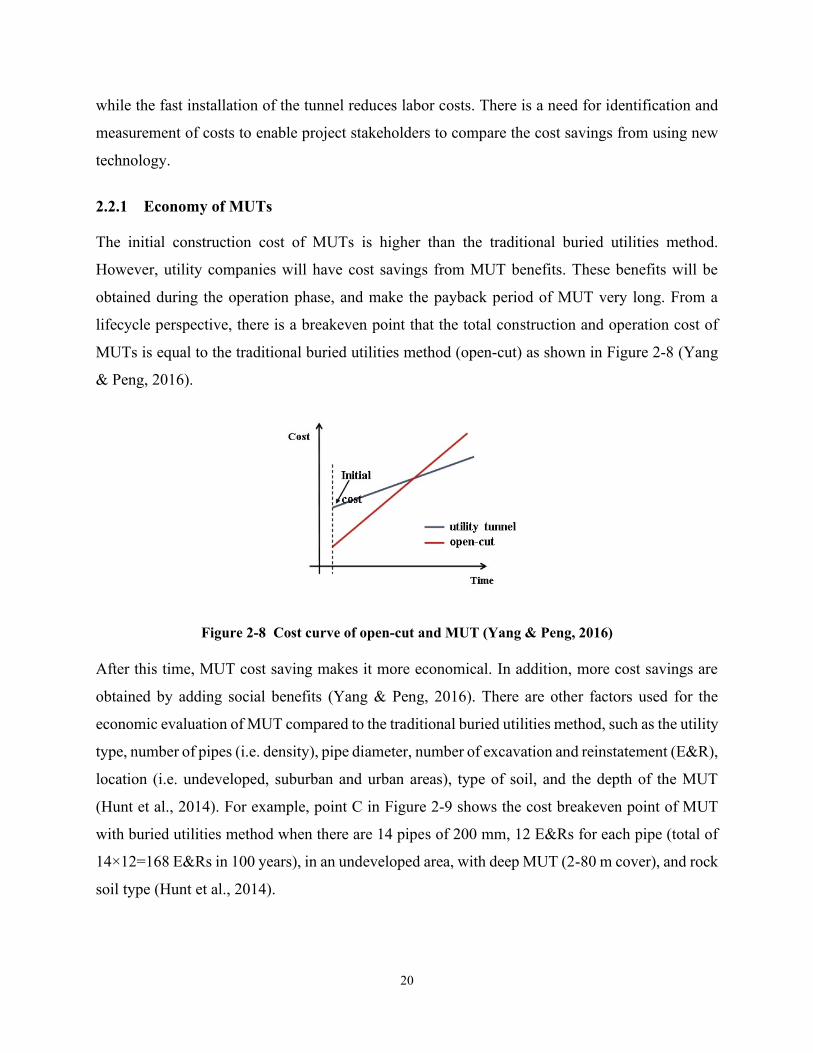
2.2.1 Economy of MUTs
The initial construction cost of MUTs is higher than the traditional buried utilities method.
However, utility companies will have cost savings from MUT benefits. These benefits will be
obtained during the operation phase, and make the payback period of MUT very long. From a
lifecycle perspective, there is a breakeven point that the total construction and operation cost of
MUTs is equal to the traditional buried utilities method (open-cut) as shown in Figure 2-8 (Yang
& Peng, 2016).
Figure 2-8 Cost curve of open-cut and MUT (Yang & Peng, 2016)
After this time, MUT cost saving makes it more economical. In addition, more cost savings are
obtained by adding social benefits (Yang & Peng, 2016). There are other factors used for the
economic evaluation of MUT compared to the traditional buried utilities method, such as the utility
type, number of pipes (i.e. density), pipe diameter, number of excavation and reinstatement (E&R),
location (i.e. undeveloped, suburban and urban areas), type of soil, and the depth of the MUT
(Hunt et al., 2014). For example, point C in Figure 2-9 shows the cost breakeven point of MUT
with buried utilities method when there are 14 pipes of 200 mm, 12 E&Rs for each pipe (total of
14×12=168 E&Rs in 100 years), in an undeveloped area, with deep MUT (2-80 m cover), and rock
soil type (Hunt et al., 2014).
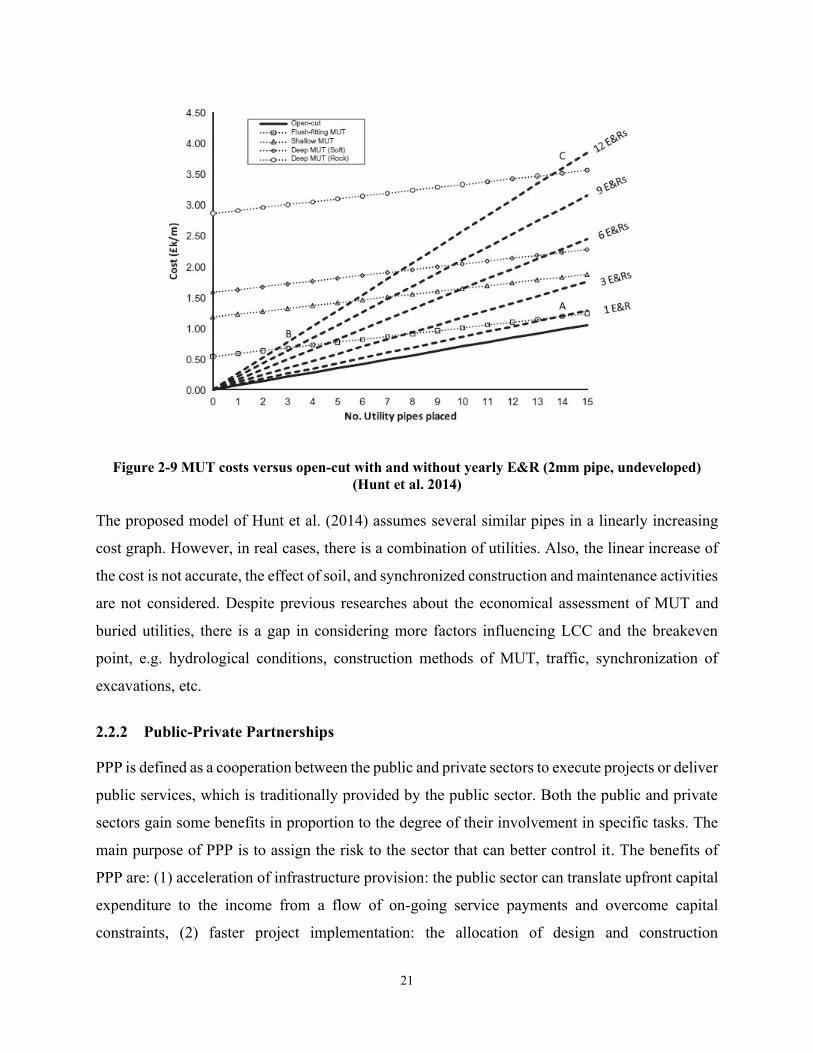
21
Figure 2-9 MUT costs versus open-cut with and without yearly E&R (2mm pipe, undeveloped)
(Hunt et al. 2014)
The proposed model of Hunt et al. (2014) assumes several similar pipes in a linearly increasing
cost graph. However, in real cases, there is a combination of utilities. Also, the linear increase of
the cost is not accurate, the effect of soil, and synchronized construction and maintenance activities
are not considered. Despite previous researches about the economical assessment of MUT and
buried utilities, there is a gap in considering more factors influencing LCC and the breakeven
point, e.g. hydrological conditions, construction methods of MUT, traffic, synchronization of
excavations, etc.
2.2.2 Public-Private Partnerships
PPP is defined as a cooperation between the public and private sectors to execute projects or deliver
public services, which is traditionally provided by the public sector. Both the public and private
sectors gain some benefits in proportion to the degree of their involvement in specific tasks. The
main purpose of PPP is to assign the risk to the sector that can better control it. The benefits of
PPP are: (1) acceleration of infrastructure provision: the public sector can translate upfront capital
expenditure to the income from a flow of on-going service payments and overcome capital
constraints, (2) faster project implementation: the allocation of design and construction
22
responsibility to the private sector shortens the construction time, (3) reduced whole life costs: the
private sector is motivated to minimize the lifecycle cost of the project, which is sometimes hard
for the public sector with constraints, (4) better risk allocation: risk transfer is optimized by
transferring to the party that can better manage it, (5) better incentives to perform: through risk
allocation and full payments conditions, the private sector is motivated to improve management
and performance, (6) better quality of service: improved quality of services can be achieved
through better integration of services with available assets, using economy of scale, innovations,
incentives, and penalty mechanism , (7) gaining additional revenues: the private sector may
generate more revenues from third parties by using spare capacity or disposal of surplus assets, (8)
improved public management: government can better plan and monitor public services instead of
managing delivery of public service. Better cost performance evaluation and transparency of
public services costs are possible (European Commission, 2003).
Unlike the traditional method that the government invests in public infrastructure and provides
services and accepts the risk of investment, in PPP the private sector is expected to participate in
investment and providing services. Therefore, the risks are shared between the public and private
entities. PPP is mainly used for, but not limited to, large scale infrastructure projects, such as roads
and railways (IMF, 2004). According to Kennedy (2013) in a PPP, the government goal may be
minimizing the risk of the project while the private stakeholder(s) may want to maximize its/their
profit.
2.2.2.1 Incentive Mechanism in PPP
Using the incentive mechanism, mainly in form of payments to PPP project stakeholders, for
different purposes have been reported in the literature. For example, Shang and Aziz (2018)
investigated the incentive payment mechanisms in Canada and the USA for transportation PPP
projects (e.g. roads, bridges, tunnels, airports) to encourage companies to improve their
performance. The study shows that the incentive mechanism is used for safety performance,
Operation and Maintenance (O&M) overall performance, fast construction, and energy-saving for
improved sustainability (Shang & Aziz, 2018). Incentive regulations can be used in PPP projects
by the government to encourage the private sector to increase efficiency and reduce the cost (IMF,
2004). In Finland, incentives and disincentives were used for concessionaires of PPP road projects
23
for construction and maintenance phases. During construction, there were disincentives for closing
the roadway and delays (e.g. for rock blasting) and early completion of the project was awarded.
For the O&M phase, there were disincentives for violations of excessive salt usage (Mäkinen &
Pakkala, 2015). According to the European Commission (2003), improved quality of services
under PPP can be achieved through performance incentives and penalties.
2.2.3 Game Theory
Game theory, also called “conflict analysis” or “interactive decision theory” is “the study of
mathematical models of conflict and cooperation between intelligent rational decision-makers”
(Myerson, 1991). Regardless of intents and purposes, game theory is a study of decision making
where the decision of each player potentially can affect the interests or welfare of the other
involved players. The main goals of game theory are to predict how a game will be played and to
find the optimum strategy for the players to address or solve a problem. However, based on the
strategies of each player, more than one solution may be possible and different results are shown
in payoff tables and/or decision trees (Kennedy, 2013). Two basic assumptions of the game theory
include: the players are “rational” and reason “strategically” (Osborne & Rubinstein, 1994).
Kennedy (2013) defines a player who reasons strategically as “the one who considers the other
players' behavior before making his own move”. Myerson defines a rational player “if he makes
decisions consistently in pursuit of his own objectives” (Myerson, 1997).
2.2.3.1 Game Types
Cooperative and non-cooperative games: Based on the interactions of the players with each
other, the games can be categorized into “non-cooperative” and “cooperative”. The co-operative
game is possible only if the players can make binding obligations, such as a contract. If no binding
obligation can occur, then the game is non-cooperative. In the non-cooperative games, the order
and timing of the players are essential to determine the result of the game and more details for each
scenario are available. On the contrary, co-operative games timing is not important and less detail
is available and the final solutions are presented (Kennedy, 2013).
Static and dynamic games: Based on the timing of decision making, two types of games are
defined: static and dynamic games. In the games where the players act simultaneously without
24
knowing the decisions of the other players, the game is static; while in the dynamic games, the
players act sequentially (Ho, 2009).
2.2.3.2 Shapley Value Theorem
As explained in Section 2.2.3.1, game theory can be cooperative or non-cooperative. In non-
cooperative games, there is a set of solutions based on the combination of players’ choices. The Nash
equilibrium is the best strategy for each player that does not will to change it. On the other hand, for a
cooperative game, a solution, called Shapley value, is based on the allocation of benefits or costs
considering the gain from the coalitions of players. After the calculation of the weighted average of
participants’ contributions, a cost or benefit is allocated proportionally to the participant’s contribution
to the total gain of the participant group. A cooperative game includes players, coalitional forms, and
characteristic functions. Players can decide to cooperate with other players or not. Therefore,
coalitional forms have resulted from players’ choices. The benefit or cost given to a certain coalitional
form is represented by the characteristic function. Each player is given a number from 1 to n, and the
set of the players is defined as N = {1,2,…,n}. N is called the grand coalition, and S is a subset of N,
which includes all forms of cooperation. The maximum number of coalitional forms that players can
create is 2n. The characteristic function v, shown as v(S), is a function of S and represents the gain
obtained by the form of coalitions. The characteristic function satisfies v(S ∪ T) ≥ v(S) + v(T), with S
∩ T = ∅, where S and T are the subsets of N, a condition of super additivity, which means the worth of
coalition is at least equal to the worth of its part acting separately (Jeong et al., 2018; Von Neumann
& Morgenstern, 1944; Samsami & Tavakolan, 2016). Assuming that all the players are rational and
will choose the maximum profit, based on superadditivity the players make a grand coalition and
achieve v(N) as the gain. After reaching the grand coalition, the challenge is how to share v(N) (Jeong
et al., 2018).
The marginal contribution of player i to coalition S means the value added to this coalition of the n-
players cooperative game by player i’s entry to the coalition and can be calculated by Equation (2-6)
(Asgari et al, 2013; Shapley, 1953; Shapley, 1988).
𝑀(𝑖, 𝑆) = 𝑣(𝑆 ∪ 𝑖) − 𝑣(𝑆), ∀ 𝑆 ⊆ 𝑁 \ {𝑖} (2-6)
According to Shapley (1953) and Asgari et al. (2013), a Shapley value of player i is a function that
assigns to each game v a number φ i (v) for each player to distribute the total gain to the players. It
25
satisfies three conditions: (1) the symmetry axiom: the players who are treated identically by the
characteristic function be treated identically by the value, which means that the name of players does
not affect in determining value; (2) the carrier axiom: the sum of φ i (v) over all players i in any carrier
N equals v(N); and (3) the additivity axiom: for any games v and w, φ(v) + φ(w) = φ (v + w). This axiom
determines how the values of different games should be related to each other.
The Shapley value (Shapley, 1988) for player i, φ i (v) is calculated by Equation (2-7).
𝜑𝑖 = ∑(𝑠−1)!(𝑛−𝑠)!
𝑛!𝑀(𝑖, 𝑆), 𝑠 = |𝑆| & 𝑛 = |𝑁| 𝑆 ⊆ 𝑁 \ {𝑖} (2-7)
The Shapley value formula for player i, represented by φ i (v), is the result of the weighted sum of the
marginal contribution of player i, represented by M(i, S). Suppose n players enter a room in some order
that totals to n! orders which are equally likely and φ i (v) represents the expected marginal contribution
of player i. The probability (weight of M(i, S)) that player i enters the room to find exactly the players
in S – i already there is equal to (𝑠−1)!(𝑛−𝑠)!
𝑛!. Out of n! permutations of N there are (s - 1)! different
orders that the first s - 1 players can precede i. The remaining n –s players can have (n – s)! different
orders after player i entry, which results to a total of (s – 1)!(n – s)! permutations that players S – i
precede i (Shapley, 1988).
2.2.3.3 Game Theory for Infrastructure Projects
Game theory was used as a decision-making system in the water infrastructure investment of
Thailand and is called “option game” (Suttinon et al., 2011). The expected payoff (profit or project
value) for the public sector (Government of Thailand) and the private sector in four scenarios of
this static and non-cooperative game, shown in matrix form, are calculated: (1) both public and
private sectors invest, (2) the first one invests but the second waits, (3) the second one invests but
the first waits, and (4) no one invests. Suttinon et al. (2011) applied various concepts of demand,
probability, price, benefit, cost, and profit at starting time with a discounted rate or Net Present
Value (NPV) in calculations. The waiting option is to observe these concepts for a period of time
and then to decide to invest or not. Both sectors are flexible by taking the option of investing if
demand is high or the option of waiting if demand is low. The proposed method of option games
“addresses an existing need in water infrastructure management, which is characterized by big
budgets, uncertainties, and competition between various public sector water supply schemes and
26
private side water demand measures.” (Suttinon et al., 2011). Based on the expected payoff in four
scenarios, it is concluded that the best strategy for them (Nash equilibrium) is in the case that both
sectors wait.
Jeong et al. (2018) proposed a cooperative and static game, shown in matrix form, a theatrical
framework for allocating the cost of adaptation of water infrastructures (e.g. dam and sewer pipes)
to climate change, i.e. expanding capacity or new development infrastructure of the participants.
The Shapley value is applied for cost allocation according to the estimated benefits and costs of
adaptation. The allocated cost is reduced “for participants who contribute more to saving the
construction cost, whereas it increases for those who benefit more from flood damage prevention”
(Jeong et al., 2018). Sanchez (2008) integrated game theory with Expected Utility Theory, as the
theory of decision making under uncertainty to model different scenarios and to calculate the
expected payoffs.
2.2.4 Financing and Cost-sharing of MUTs
The high initial construction cost of MUTs and also operational costs need to be financed and
shared fairly among utility companies. Reviewing previous MUT projects in several countries
shows various private and public sources of financing. In France (Clé de Sol, 2005), bank loans,
MUT owner investment, and the entrance fee of MUT occupants (utility companies) are used. In
China (Yang & Peng, 2016), MUT projects are financed by the government, private investors,
utility companies, and bank loans. In Taiwan (CPAMI, 2011), engineering authority and utility
companies invest in MUT projects. For financing MUT projects by loans at any phase of the
project, extra costs, such as loan interest, the commission of arrangement, and commission of
engagement, should be added (Clé de Sol, 2005).
2.2.4.1 PPP for MUT Cost-sharing
The long-term economic perspective for MUT and cooperation between several public and private
MUT stakeholders make PPP a practical form of contract for these projects (Yang & Peng, 2016).
PPP model was adopted for MUT projects in China and France (Yang & Peng, 2016; Clé de Sol,
2005). The Chinese government adopted the PPP approach to attract private capital to MUT
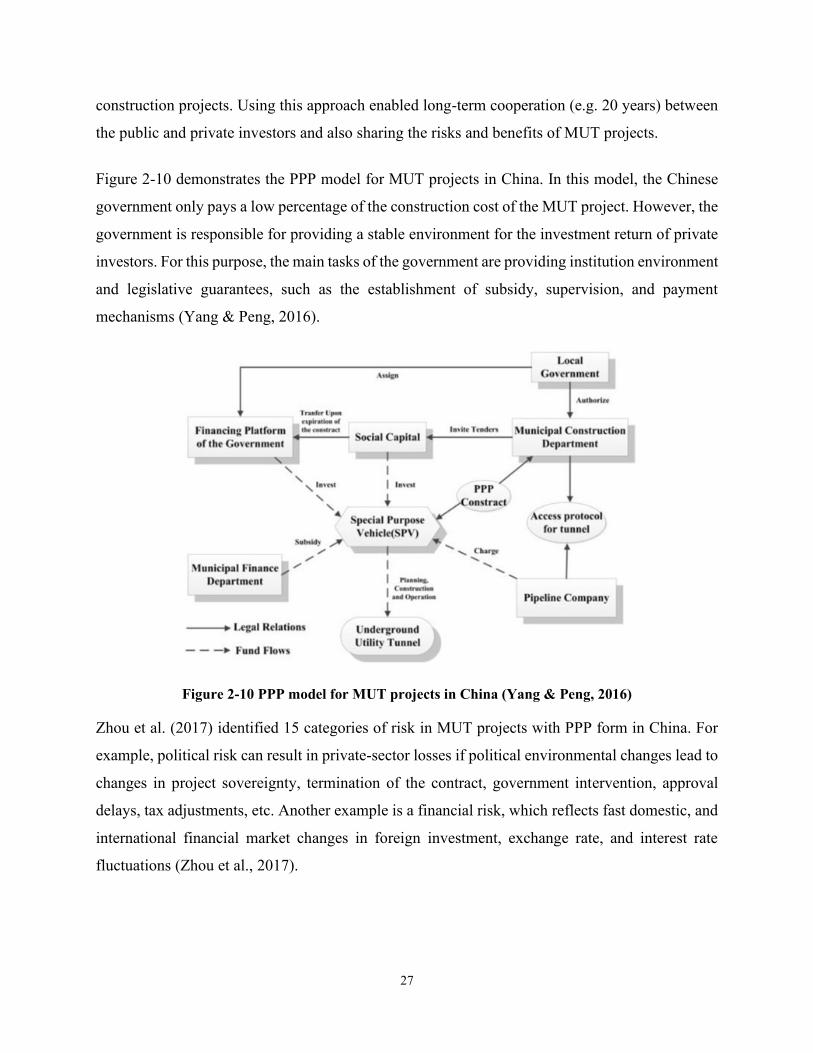
27
construction projects. Using this approach enabled long-term cooperation (e.g. 20 years) between
the public and private investors and also sharing the risks and benefits of MUT projects.
Figure 2-10 demonstrates the PPP model for MUT projects in China. In this model, the Chinese
government only pays a low percentage of the construction cost of the MUT project. However, the
government is responsible for providing a stable environment for the investment return of private
investors. For this purpose, the main tasks of the government are providing institution environment
and legislative guarantees, such as the establishment of subsidy, supervision, and payment
mechanisms (Yang & Peng, 2016).
Figure 2-10 PPP model for MUT projects in China (Yang & Peng, 2016)
Zhou et al. (2017) identified 15 categories of risk in MUT projects with PPP form in China. For
example, political risk can result in private-sector losses if political environmental changes lead to
changes in project sovereignty, termination of the contract, government intervention, approval
delays, tax adjustments, etc. Another example is a financial risk, which reflects fast domestic, and
international financial market changes in foreign investment, exchange rate, and interest rate
fluctuations (Zhou et al., 2017).
28
The PPP model of MUT for each country can be adjusted by considering the specific conditions
of the context, such as the government power for interventions and guarantees in MUT projects,
the anticipated profit and risks of the MUT project, etc.
Another model of MUT project organization is “municipal governance” (Clé de Sol, 2005). In this
model, the municipality is the owner and manager of the MUT and the participant utility companies
pay a rental fee. The MUT operation and management in the city of Prague at the Czech Republic
is an example of the municipal governance model (Kolektory Praha, 2019), where operators (e.g.
utility companies) have to inspect their networks once a year (i.e. visual inspection, leak
inspection, hazard test) (CERIU, 2009).
Clé de Sol (2005) proposed a financing and cost-sharing model for both methods of PPP and
municipal governance. Part of the model related to the PPP is explained in detail in Appendix B.
2.2.4.2 MUT Cost-sharing Methods
Utility companies, including public and private entities, are responsible for financing most or all
the costs of these projects. The fairness of cost allocation for MUT projects is a challenging issue.
Currently, the common two methods of MUT cost allocation are (CPAMI, 2011; Xiaoqin et al.,
2011; Zhang et al., 2019): (a) The proportion of buried cost (PBC) method, in which the utility
companies are charged based on the same proportion they were paying in traditional buried utilities
method, and (b) The proportion of utility volume occupancy (PUVO) method, in which utility
companies are charged based on the volume of space they occupy in MUT. Zhang et al. (2019)
proposed to allocate occupied cross-sectional areas of utilities using the Shapely value theorem. A
combination of these two methods is also proposed (Zhang et al., 2019; Xiaoqin et al.,2011). It
was also proposed to use the same ratio of each company lifecycle benefit over the total lifecycle
benefit from MUT for sharing the cost of MUT between utility companies (Zhang et al., 2019).
The benefit of MUT is defined as the profit or construction and maintenance cost reduction of
MUT (Zhang et al., 2019). Zhang et al. (2019) proposed to use bargaining power for cost-sharing
in form of an index including net investment income, payback period, and cost-benefit ratio.
Although bargaining power can influence the cost-sharing process, it may not always guarantee a
fair cost-sharing. Therefore, there is limited research on cost-sharing models that consider fairness.
29
In a fair cost-sharing model, higher investment should result in a higher benefit for a utility
company. In other words, the benefit-cost ratios of utility companies should not be very different.
Extra costs of MUTs to manage safety and security risks can also be a challenge for cost-sharing.
Fair cost-sharing of the risks should be based on this concept: the risk creator should pay the risk
management cost. However, this concept is fuzzy in MUTs because risk can be distributed between
two or more utility companies (e.g. risk of placing gas and electrical cables in an MUT). Therefore,
there is a need to adjust cost allocation by distributing the cost of risks in the cost-sharing of MUTs.
The issue regarding cost-sharing of the MUT and the resulting rules for rights and responsibilities
of each stakeholder are usually agreed upon at the project initiation either in the form of a
consortium or a joint venture.
2.2.4.3 Sharable Risks in MUT Cost-sharing
For the purpose of sharing the cost of risk management, only the shared risks are considered in
this research. This means that the risks that are produced by a company and affect only the same
company is not a sharable risk and all the costs to manage that risk should be paid by the same
company. Sharable risks are defined as risks with more than one responsible company (e.g. fire
because of the proximity of gas and electricity) and shared risk management actions
Table 2-3 presents a list of sharable risks, risk management actions with cost, the main responsible
company, and the related MUT lifecycle phase (CERIU, 2011). The utility companies include
municipality as the owner of water and sewer pipes, gas, and electricity companies. The MUT
manager consists of representatives from all the utility companies and the responsibility of risk
depends on the company whose representative makes the risk.
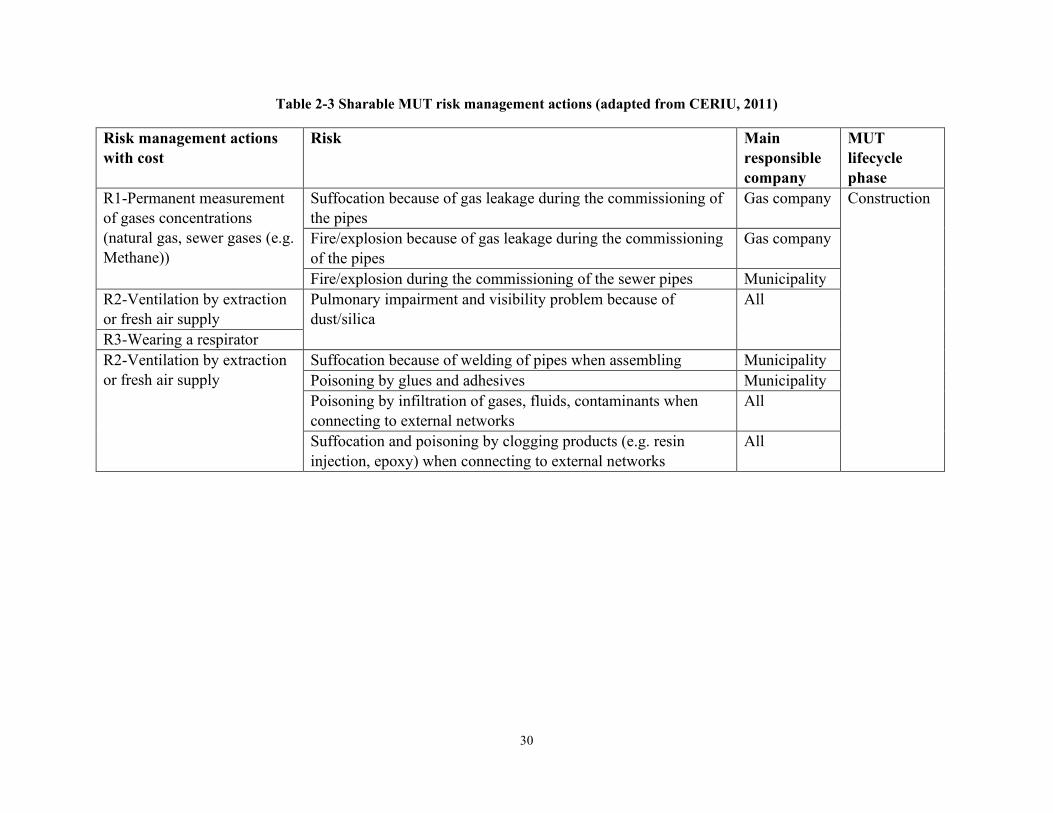
30
Table 2-3 Sharable MUT risk management actions (adapted from CERIU, 2011)
Risk management actions
with cost
Risk Main
responsible
company
MUT
lifecycle
phase
R1-Permanent measurement
of gases concentrations
(natural gas, sewer gases (e.g.
Methane))
Suffocation because of gas leakage during the commissioning of
the pipes
Gas company Construction
Fire/explosion because of gas leakage during the commissioning
of the pipes
Gas company
Fire/explosion during the commissioning of the sewer pipes Municipality
R2-Ventilation by extraction
or fresh air supply
Pulmonary impairment and visibility problem because of
dust/silica
All
R3-Wearing a respirator
R2-Ventilation by extraction
or fresh air supply
Suffocation because of welding of pipes when assembling Municipality
Poisoning by glues and adhesives Municipality
Poisoning by infiltration of gases, fluids, contaminants when
connecting to external networks
All
Suffocation and poisoning by clogging products (e.g. resin
injection, epoxy) when connecting to external networks
All
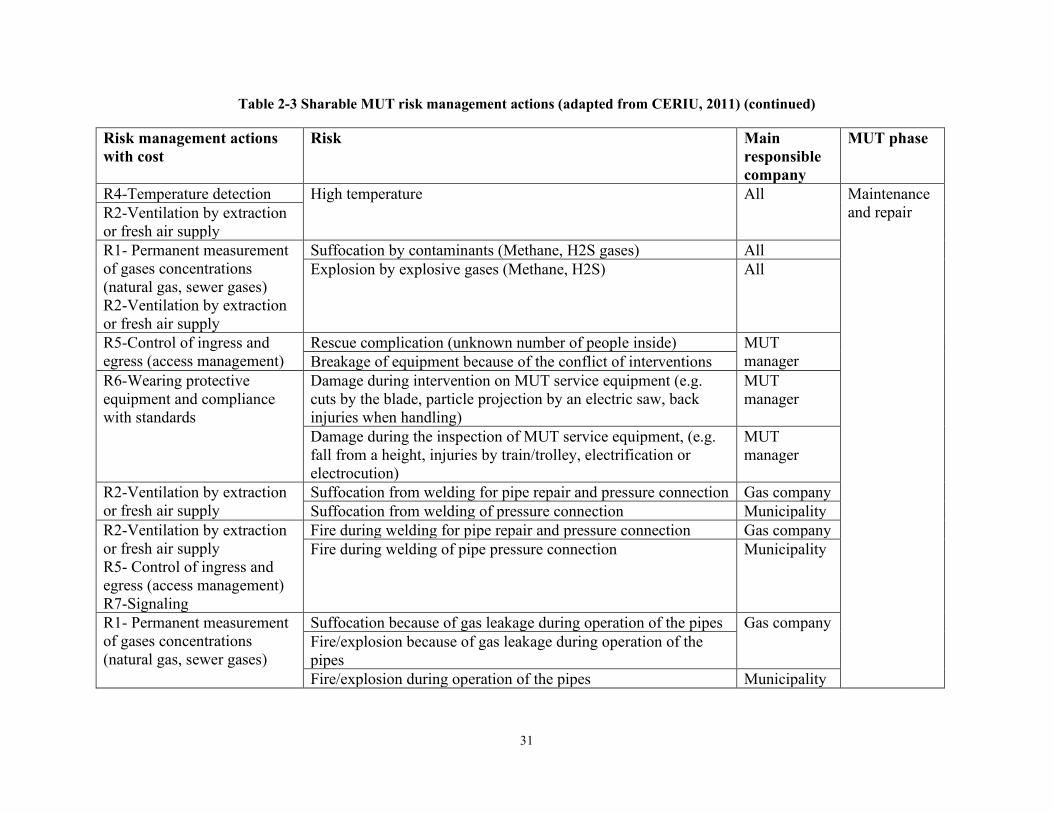
31
Table 2-3 Sharable MUT risk management actions (adapted from CERIU, 2011) (continued)
Risk management actions
with cost
Risk Main
responsible
company
MUT phase
R4-Temperature detection High temperature All Maintenance
and repair R2-Ventilation by extraction
or fresh air supply
R1- Permanent measurement
of gases concentrations
(natural gas, sewer gases)
R2-Ventilation by extraction
or fresh air supply
Suffocation by contaminants (Methane, H2S gases) All
Explosion by explosive gases (Methane, H2S) All
R5-Control of ingress and
egress (access management)
Rescue complication (unknown number of people inside) MUT
manager Breakage of equipment because of the conflict of interventions
R6-Wearing protective
equipment and compliance
with standards
Damage during intervention on MUT service equipment (e.g.
cuts by the blade, particle projection by an electric saw, back
injuries when handling)
MUT
manager
Damage during the inspection of MUT service equipment, (e.g.
fall from a height, injuries by train/trolley, electrification or
electrocution)
MUT
manager
R2-Ventilation by extraction
or fresh air supply
Suffocation from welding for pipe repair and pressure connection Gas company
Suffocation from welding of pressure connection Municipality
R2-Ventilation by extraction
or fresh air supply
R5- Control of ingress and
egress (access management)
R7-Signaling
Fire during welding for pipe repair and pressure connection Gas company
Fire during welding of pipe pressure connection Municipality
R1- Permanent measurement
of gases concentrations
(natural gas, sewer gases)
Suffocation because of gas leakage during operation of the pipes Gas company
Fire/explosion because of gas leakage during operation of the
pipes
Fire/explosion during operation of the pipes Municipality
32
2.2.4.4 Game Theory for MUT Cost-sharing
A method based on non-cooperative game theory for the cost-sharing strategy of MUT was
proposed in China. The game is based on the decision to participate or not in an MUT project and
some costs and incentives (e.g. construction and maintenance cost, subsidy) are allocated to the
utility companies in each scenario (Xi & Fuling, 2013). Game theory is applied to design a
government incentive mechanism for financing MUT construction. The game is based on two
utility companies making four possible scenarios of sharing or not sharing the construction cost:
(1) if both utility companies accept to share the construction cost, the cost is shared between them
by a certain ratio. (2) If one of the two companies does not agree to share the construction cost,
but the other company agrees, a percentage of the share is reduced to the paying company as a
reward and added to the other company as a penalty. (3) In case both companies do not agree to
share the construction cost, the MUT will be built anyways and both companies must pay a certain
fee every year to place utilities inside the MUT (Xiaoqin et al., 2011).
Both of these game models for MUT cost-sharing are based on a high degree of public entities
intervention, such as government or municipality. Although the role of public entities in legislative
and coordination affairs is undeniable, various financing options should be given to the other
private MUT stakeholders.
Using cooperative game theory for MUT cost-sharing is very rare. Although the Shapely value
theorem was proposed to allocate occupied cross-sectional areas of utilities by Zhang et al. (2019),
there is a gap to determine the contributed benefit of each utility company to the MUT project by
the Shapely value theorem. The benefit that each utility company contributes to the project by
participation in MUT and avoiding buried utilities is called contributed benefit of that company.
A factor for a fair MUT cost-sharing is the balance of the gained benefit of a company with its
contributed benefit.
2.3 Review of MUT Projects and Studies Around the World
There are many examples of MUT since the 19th century. According to Rogers and Hunt (2006),
different names have been given to MUTs, such as ‘utilidors’ (USA), Common Service Tunnels
in Singapore, Common Utility Tunnels in Malaysia, Common Utility Enclosures in Hong Kong,
Common Utility Ducts in Taiwan and Multi-networks Gallery in France.
33
Luo et al. (2020) reviewed the history and recent development of MUTs in the world. The first
MUT was built in France in 1850. It integrated the sewage system and water pipes with a large
cross-sectional area (Cano-Hurtado & Canto-Perello, 1999; Canto-Perello & Curiel-Esparza,
2001; Wang et al., 2018). Subsequently, a tunnel was built in England in the 1860s to host foul
and drinking water (Canto-Perello et al., 2009; Laistner & Laistner, 2012; Rogers & Hunt, 2006).
This MUT allows man-access and is still in use. Germany (1893) was also among the countries
that first implemented MUTs as shown in Figure 2-11(a). There was a lag from 1893 to about 1920
in the construction of MUTs. Figure 2-11(b) shows that between 1921 and 1960, several MUTs
were constructed in parts of North America (Alaska), Asia (Japan), and Europe (France, Germany,
Czech, etc.). Figure 2-11(c) shows that from 1961 to 1980, there was a rise in the construction of
MUTs with a total of about 30 MUTs constructed. During this period, about 50% of the world’s
MUTs were built in France in cities like Angers, Paris, Rouen, Lyon, etc. Following the Utility
Tunnel Law passed in 1963, Japan was able to build approximately 2000 km of utility tunnels in
80 Japanese cities (Wang et al., 2018). Countries like Belgium, Czech Republic, Germany,
Switzerland, etc., were also involved in the construction of MUTs. Subsequently, between 1981
and 2000, the Czech Republic increased the construction of MUTs with a total of ten out of a total
of about 36 MUTs constructed worldwide during this period. These MUTs were built in cities like
Prague, Brno, etc. Japan increased the construction of MUTs during this period to about 30% of
the world MUTs. However, countries like France and Germany continued to build MUTs. This
period also saw the construction of MUTs in countries like Norway, Spain, China, and the USA
as shown in Figure 2-11(d). The 21st century has seen a relative increase in the construction of
MUTs in Asia. 80% of the world MUTs are currently being constructed in China as shown in
Figure 2-11(e). Countries like Israel, Malaysia, India, Qatar, Singapore, and Canada have also
implemented MUTs, while countries like Czech Republic, England, USA, have continued to
construct MUTs with the latter two having MUTs constructed mainly on university campuses,
hospitals, private establishments, and military installations.
In recent years, MUT has been developed in the world, particularly in Asia. Also, many studies
have been conducted for MUT around the world. Reviewing these projects and studies provides a
rich basis for the future development of MUT. Examples of MUTs around the world are presented
in Table 2-4 for MUT projects in Europe, and Table 2-5 for MUTs in North America, and Table
2-6 for the Middle East and parts of Asia (Luo et al., 2020).
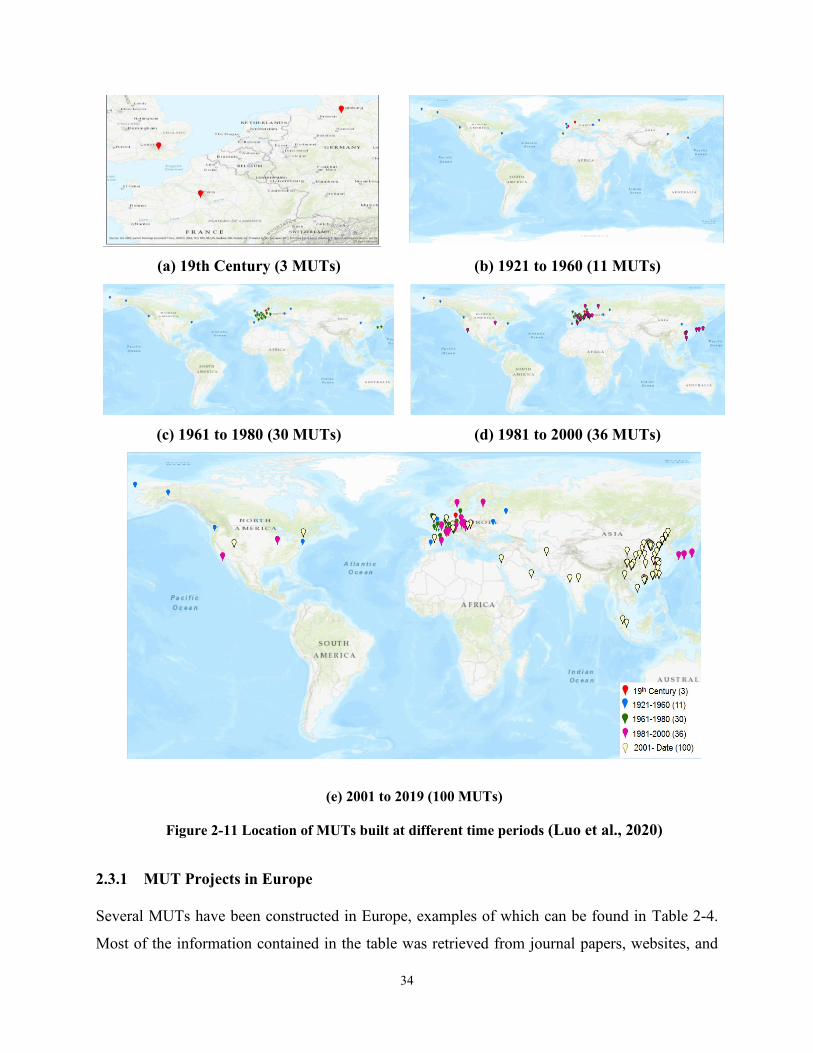
34
(a) 19th Century (3 MUTs) (b) 1921 to 1960 (11 MUTs)
(c) 1961 to 1980 (30 MUTs) (d) 1981 to 2000 (36 MUTs)
(e) 2001 to 2019 (100 MUTs)
Figure 2-11 Location of MUTs built at different time periods (Luo et al., 2020)
2.3.1 MUT Projects in Europe
Several MUTs have been constructed in Europe, examples of which can be found in Table 2-4.
Most of the information contained in the table was retrieved from journal papers, websites, and

35
reports. The grey cells in the table represent information that is either unclear or unknown. Based
on the table, the Czech Republic, France, and Germany have the highest number of MUTs in
Europe. Different countries in Europe built MUTs as a solution to one or more challenges, for
example, France and the UK both built MUTs to stop the spread of cholera. Subsequently, the UK
later built MUTs to eliminate traffic congestion caused by excavations for utility repairs. The
Czech Republic on the other hand built MUTs to reduce the excavation impact in historical areas.
2.3.2 MUT Projects in North America
A large number of university campuses, hospitals, military installations, and airports in North
America appreciate the advantages of adopting MUTs in the long term (Laistner & Laistner, 2012).
One reason for this adoption is that these bodies own and operate their utility infrastructure (Hunt
et al., 2012). Furthermore, barriers such as utility coordination, security, funding, and operation of
the utilities hosted in the MUTs are easily overcome in this case. However, in the public sector,
very little work has been done in recent years related to MUTs in North America. Most states in
the US are interested in MUTs according to a survey (Kuhn et al., 2002). However, security and
operational issues are the main concerns for undertaking MUT projects. Table 2-5 contains
detailed information on some of the MUTs in North America.
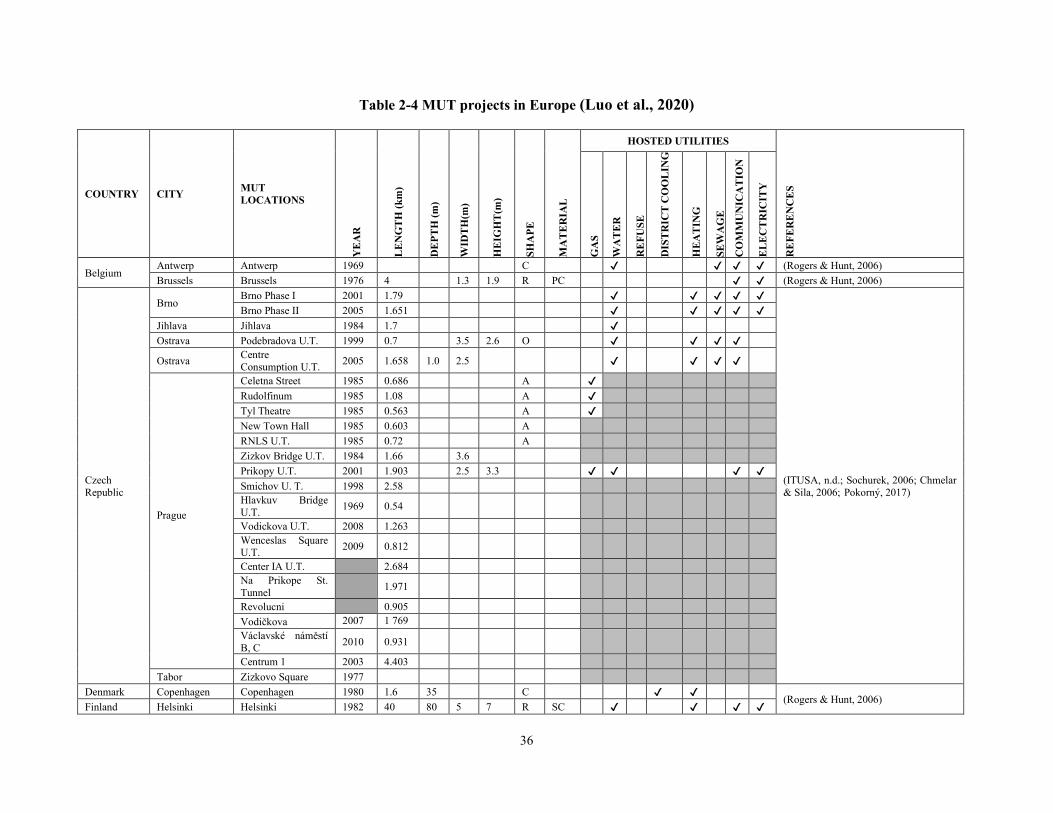
36
Table 2-4 MUT projects in Europe (Luo et al., 2020)
COUNTRY CITY MUT
LOCATIONS
YE
AR
LE
NG
TH
(k
m)
DE
PT
H (
m)
WID
TH
(m)
HE
IGH
T(m
)
SH
AP
E
MA
TE
RIA
L
HOSTED UTILITIES
RE
FE
RE
NC
ES
GA
S
WA
TE
R
RE
FU
SE
DIS
TR
ICT
CO
OL
ING
HE
AT
ING
SE
WA
GE
CO
MM
UN
ICA
TIO
N
EL
EC
TR
ICIT
Y
Belgium Antwerp Antwerp 1969 C ✔ ✔ ✔ ✔ (Rogers & Hunt, 2006)
Brussels Brussels 1976 4 1.3 1.9 R PC ✔ ✔ (Rogers & Hunt, 2006)
Czech
Republic
Brno Brno Phase I 2001 1.79 ✔ ✔ ✔ ✔ ✔
(ITUSA, n.d.; Sochurek, 2006; Chmelar
& Sila, 2006; Pokorný, 2017)
Brno Phase II 2005 1.651 ✔ ✔ ✔ ✔ ✔
Jihlava Jihlava 1984 1.7 ✔
Ostrava Podebradova U.T. 1999 0.7 3.5 2.6 O ✔ ✔ ✔ ✔
Ostrava Centre
Consumption U.T. 2005 1.658 1.0 2.5 ✔ ✔ ✔ ✔
Prague
Celetna Street 1985 0.686 A ✔
Rudolfinum 1985 1.08 A ✔
Tyl Theatre 1985 0.563 A ✔
New Town Hall 1985 0.603 A
RNLS U.T. 1985 0.72 A
Zizkov Bridge U.T. 1984 1.66 3.6
Prikopy U.T. 2001 1.903 2.5 3.3 ✔ ✔ ✔ ✔
Smichov U. T. 1998 2.58
Hlavkuv Bridge
U.T. 1969 0.54
Vodickova U.T. 2008 1.263
Wenceslas Square U.T.
2009 0.812
Center IA U.T. 2.684
Na Prikope St.
Tunnel 1.971
Revolucni 0.905
Vodičkova 2007 1 769
Václavské náměstí
B, C 2010 0.931
Centrum 1 2003 4.403
Tabor Zizkovo Square 1977
Denmark Copenhagen Copenhagen 1980 1.6 35 C ✔ ✔ (Rogers & Hunt, 2006)
Finland Helsinki Helsinki 1982 40 80 5 7 R SC ✔ ✔ ✔ ✔
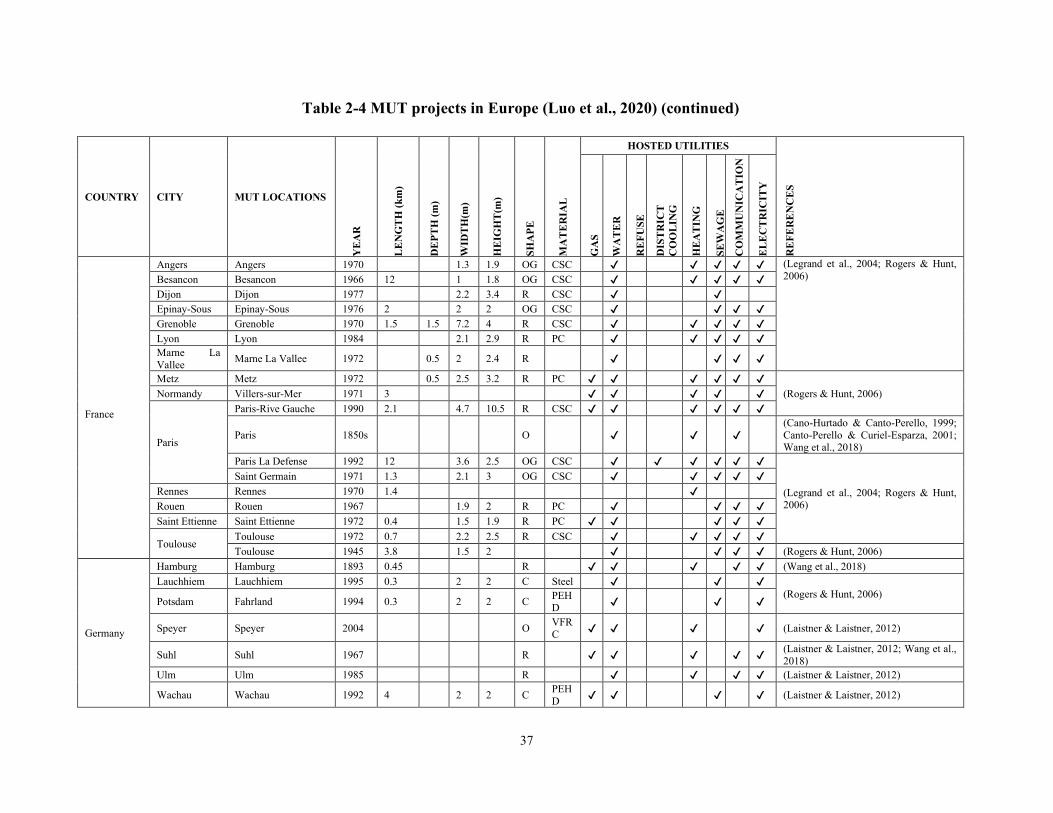
37
Table 2-4 MUT projects in Europe (Luo et al., 2020) (continued)
COUNTRY CITY MUT LOCATIONS
YE
AR
LE
NG
TH
(k
m)
DE
PT
H (
m)
WID
TH
(m)
HE
IGH
T(m
)
SH
AP
E
MA
TE
RIA
L
HOSTED UTILITIES
RE
FE
RE
NC
ES
GA
S
WA
TE
R
RE
FU
SE
DIS
TR
ICT
CO
OL
ING
HE
AT
ING
SE
WA
GE
CO
MM
UN
ICA
TIO
N
EL
EC
TR
ICIT
Y
France
Angers Angers 1970 1.3 1.9 OG CSC ✔ ✔ ✔ ✔ ✔ (Legrand et al., 2004; Rogers & Hunt,
2006) Besancon Besancon 1966 12 1 1.8 OG CSC ✔ ✔ ✔ ✔ ✔
Dijon Dijon 1977 2.2 3.4 R CSC ✔ ✔
Epinay-Sous Epinay-Sous 1976 2 2 2 OG CSC ✔ ✔ ✔ ✔
Grenoble Grenoble 1970 1.5 1.5 7.2 4 R CSC ✔ ✔ ✔ ✔ ✔
Lyon Lyon 1984 2.1 2.9 R PC ✔ ✔ ✔ ✔ ✔
Marne La
Vallee Marne La Vallee 1972 0.5 2 2.4 R ✔ ✔ ✔ ✔
Metz Metz 1972 0.5 2.5 3.2 R PC ✔ ✔ ✔ ✔ ✔ ✔
(Rogers & Hunt, 2006) Normandy Villers-sur-Mer 1971 3 ✔ ✔ ✔ ✔ ✔
Paris
Paris-Rive Gauche 1990 2.1 4.7 10.5 R CSC ✔ ✔ ✔ ✔ ✔ ✔
Paris 1850s O ✔ ✔ ✔ (Cano-Hurtado & Canto-Perello, 1999;
Canto-Perello & Curiel-Esparza, 2001; Wang et al., 2018)
Paris La Defense 1992 12 3.6 2.5 OG CSC ✔ ✔ ✔ ✔ ✔ ✔
(Legrand et al., 2004; Rogers & Hunt, 2006)
Saint Germain 1971 1.3 2.1 3 OG CSC ✔ ✔ ✔ ✔ ✔
Rennes Rennes 1970 1.4 ✔
Rouen Rouen 1967 1.9 2 R PC ✔ ✔ ✔ ✔
Saint Ettienne Saint Ettienne 1972 0.4 1.5 1.9 R PC ✔ ✔ ✔ ✔ ✔
Toulouse Toulouse 1972 0.7 2.2 2.5 R CSC ✔ ✔ ✔ ✔ ✔
Toulouse 1945 3.8 1.5 2 ✔ ✔ ✔ ✔ (Rogers & Hunt, 2006)
Germany
Hamburg Hamburg 1893 0.45 R ✔ ✔ ✔ ✔ ✔ (Wang et al., 2018)
Lauchhiem Lauchhiem 1995 0.3 2 2 C Steel ✔ ✔ ✔
(Rogers & Hunt, 2006) Potsdam Fahrland 1994 0.3 2 2 C
PEHD
✔ ✔ ✔
Speyer Speyer 2004 O VFR
C ✔ ✔ ✔ ✔ (Laistner & Laistner, 2012)
Suhl Suhl 1967 R ✔ ✔ ✔ ✔ ✔ (Laistner & Laistner, 2012; Wang et al.,
2018)
Ulm Ulm 1985 R ✔ ✔ ✔ ✔ (Laistner & Laistner, 2012)
Wachau Wachau 1992 4 2 2 C PEH
D ✔ ✔ ✔ ✔ (Laistner & Laistner, 2012)
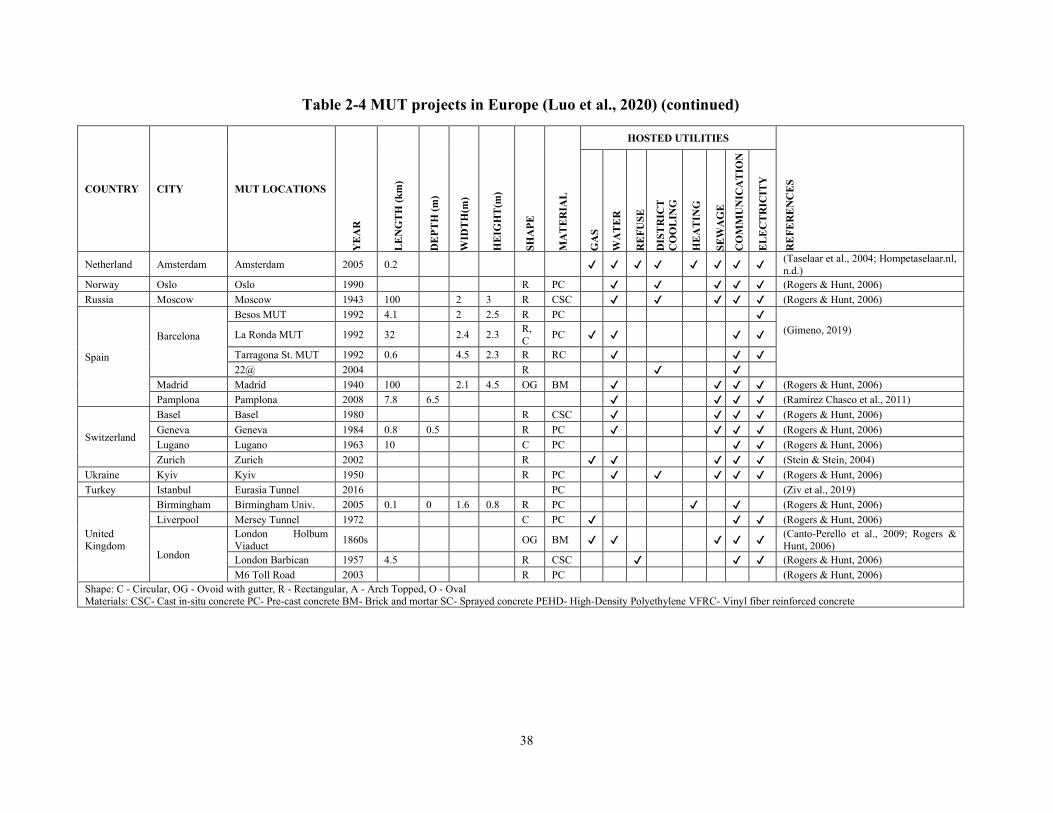
38
Table 2-4 MUT projects in Europe (Luo et al., 2020) (continued)
COUNTRY CITY MUT LOCATIONS
YE
AR
LE
NG
TH
(k
m)
DE
PT
H (
m)
WID
TH
(m)
HE
IGH
T(m
)
SH
AP
E
MA
TE
RIA
L
HOSTED UTILITIES
RE
FE
RE
NC
ES
GA
S
WA
TE
R
RE
FU
SE
DIS
TR
ICT
CO
OL
ING
HE
AT
ING
SE
WA
GE
CO
MM
UN
ICA
TIO
N
EL
EC
TR
ICIT
Y
Netherland Amsterdam Amsterdam 2005 0.2 ✔ ✔ ✔ ✔ ✔ ✔ ✔ ✔ (Taselaar et al., 2004; Hompetaselaar.nl,
n.d.)
Norway Oslo Oslo 1990 R PC ✔ ✔ ✔ ✔ ✔ (Rogers & Hunt, 2006)
Russia Moscow Moscow 1943 100 2 3 R CSC ✔ ✔ ✔ ✔ ✔ (Rogers & Hunt, 2006)
Spain
Barcelona
Besos MUT 1992 4.1 2 2.5 R PC ✔
(Gimeno, 2019)
La Ronda MUT 1992 32 2.4 2.3 R,
C PC ✔ ✔ ✔ ✔
Tarragona St. MUT 1992 0.6 4.5 2.3 R RC ✔ ✔ ✔
22@ 2004 R ✔ ✔
Madrid Madrid 1940 100 2.1 4.5 OG BM ✔ ✔ ✔ ✔ (Rogers & Hunt, 2006)
Pamplona Pamplona 2008 7.8 6.5 ✔ ✔ ✔ ✔ (Ramírez Chasco et al., 2011)
Switzerland
Basel Basel 1980 R CSC ✔ ✔ ✔ ✔ (Rogers & Hunt, 2006)
Geneva Geneva 1984 0.8 0.5 R PC ✔ ✔ ✔ ✔ (Rogers & Hunt, 2006)
Lugano Lugano 1963 10 C PC ✔ ✔ (Rogers & Hunt, 2006)
Zurich Zurich 2002 R ✔ ✔ ✔ ✔ ✔ (Stein & Stein, 2004)
Ukraine Kyiv Kyiv 1950 R PC ✔ ✔ ✔ ✔ ✔ (Rogers & Hunt, 2006)
Turkey Istanbul Eurasia Tunnel 2016 PC (Ziv et al., 2019)
United Kingdom
Birmingham Birmingham Univ. 2005 0.1 0 1.6 0.8 R PC ✔ ✔ (Rogers & Hunt, 2006)
Liverpool Mersey Tunnel 1972 C PC ✔ ✔ ✔ (Rogers & Hunt, 2006)
London
London Holbum Viaduct
1860s OG BM ✔ ✔ ✔ ✔ ✔ (Canto-Perello et al., 2009; Rogers & Hunt, 2006)
London Barbican 1957 4.5 R CSC ✔ ✔ ✔ (Rogers & Hunt, 2006)
M6 Toll Road 2003 R PC (Rogers & Hunt, 2006)
Shape: C - Circular, OG - Ovoid with gutter, R - Rectangular, A - Arch Topped, O - Oval
Materials: CSC- Cast in-situ concrete PC- Pre-cast concrete BM- Brick and mortar SC- Sprayed concrete PEHD- High-Density Polyethylene VFRC- Vinyl fiber reinforced concrete
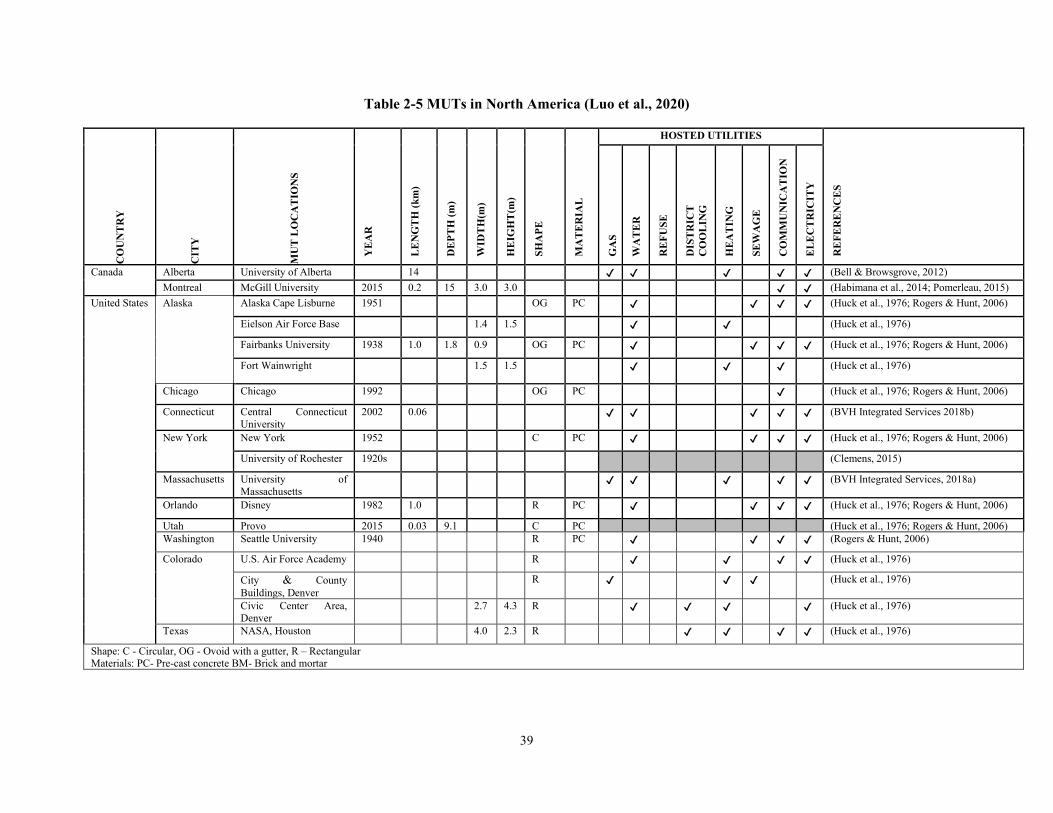
39
Table 2-5 MUTs in North America (Luo et al., 2020) C
OU
NT
RY
CIT
Y
MU
T L
OC
AT
ION
S
YE
AR
LE
NG
TH
(k
m)
DE
PT
H (
m)
WID
TH
(m)
HE
IGH
T(m
)
SH
AP
E
MA
TE
RIA
L
HOSTED UTILITIES
RE
FE
RE
NC
ES
GA
S
WA
TE
R
RE
FU
SE
DIS
TR
ICT
CO
OL
ING
HE
AT
ING
SE
WA
GE
CO
MM
UN
ICA
TIO
N
EL
EC
TR
ICIT
Y
Canada Alberta University of Alberta 14 ✔ ✔ ✔ ✔ ✔ (Bell & Browsgrove, 2012)
Montreal McGill University 2015 0.2 15 3.0 3.0
✔ ✔ (Habimana et al., 2014; Pomerleau, 2015)
United States Alaska Alaska Cape Lisburne 1951 OG PC ✔ ✔ ✔ ✔ (Huck et al., 1976; Rogers & Hunt, 2006)
Eielson Air Force Base 1.4 1.5 ✔ ✔ (Huck et al., 1976)
Fairbanks University 1938 1.0 1.8 0.9 OG PC ✔ ✔ ✔ ✔ (Huck et al., 1976; Rogers & Hunt, 2006)
Fort Wainwright 1.5 1.5 ✔ ✔ ✔ (Huck et al., 1976)
Chicago Chicago 1992 OG PC ✔ (Huck et al., 1976; Rogers & Hunt, 2006)
Connecticut Central Connecticut
University
2002 0.06 ✔ ✔ ✔ ✔ ✔ (BVH Integrated Services 2018b)
New York New York 1952 C PC ✔ ✔ ✔ ✔ (Huck et al., 1976; Rogers & Hunt, 2006)
University of Rochester 1920s (Clemens, 2015)
Massachusetts University of
Massachusetts
✔ ✔ ✔ ✔ ✔ (BVH Integrated Services, 2018a)
Orlando Disney 1982 1.0 R PC ✔ ✔ ✔ ✔ (Huck et al., 1976; Rogers & Hunt, 2006)
Utah Provo 2015 0.03 9.1 C PC (Huck et al., 1976; Rogers & Hunt, 2006)
Washington Seattle University 1940 R PC ✔ ✔ ✔ ✔ (Rogers & Hunt, 2006)
Colorado U.S. Air Force Academy R ✔ ✔ ✔ ✔ (Huck et al., 1976)
City & County
Buildings, Denver
R ✔ ✔ ✔ (Huck et al., 1976)
Civic Center Area,
Denver
2.7 4.3 R ✔ ✔ ✔ ✔ (Huck et al., 1976)
Texas NASA, Houston 4.0 2.3 R ✔ ✔ ✔ ✔ (Huck et al., 1976)
Shape: C - Circular, OG - Ovoid with a gutter, R – Rectangular Materials: PC- Pre-cast concrete BM- Brick and mortar
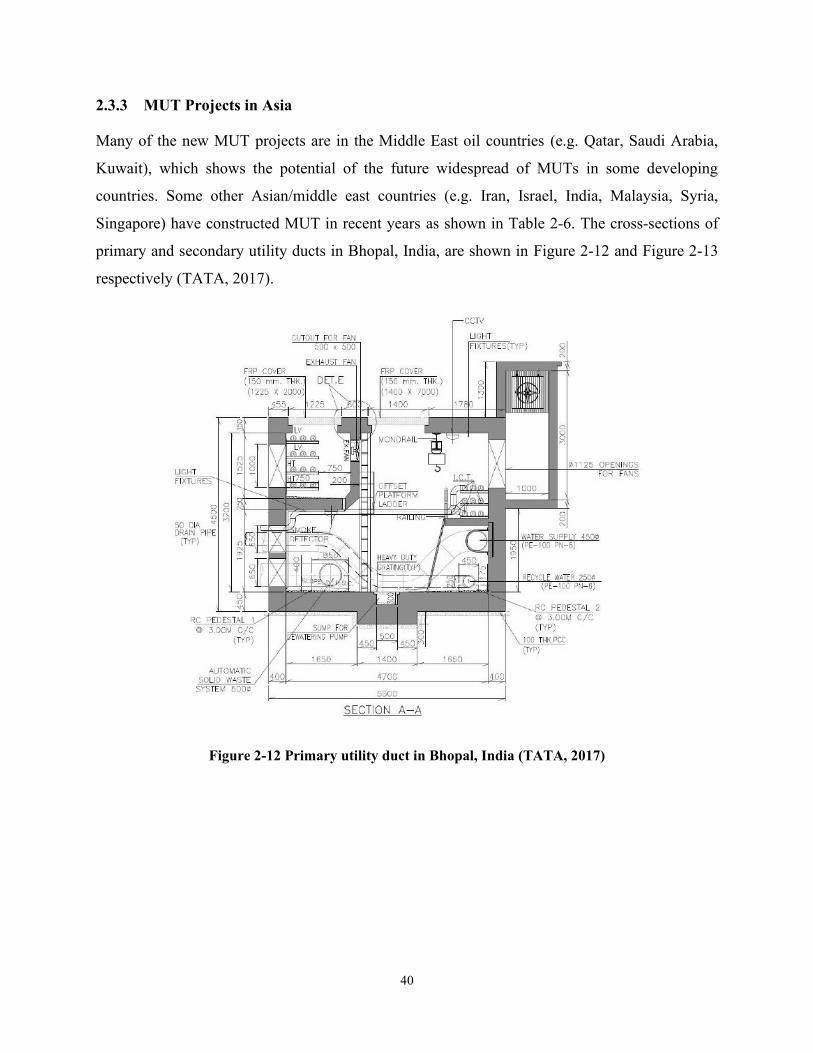
40
2.3.3 MUT Projects in Asia
Many of the new MUT projects are in the Middle East oil countries (e.g. Qatar, Saudi Arabia,
Kuwait), which shows the potential of the future widespread of MUTs in some developing
countries. Some other Asian/middle east countries (e.g. Iran, Israel, India, Malaysia, Syria,
Singapore) have constructed MUT in recent years as shown in Table 2-6. The cross-sections of
primary and secondary utility ducts in Bhopal, India, are shown in Figure 2-12 and Figure 2-13
respectively (TATA, 2017).
Figure 2-12 Primary utility duct in Bhopal, India (TATA, 2017)
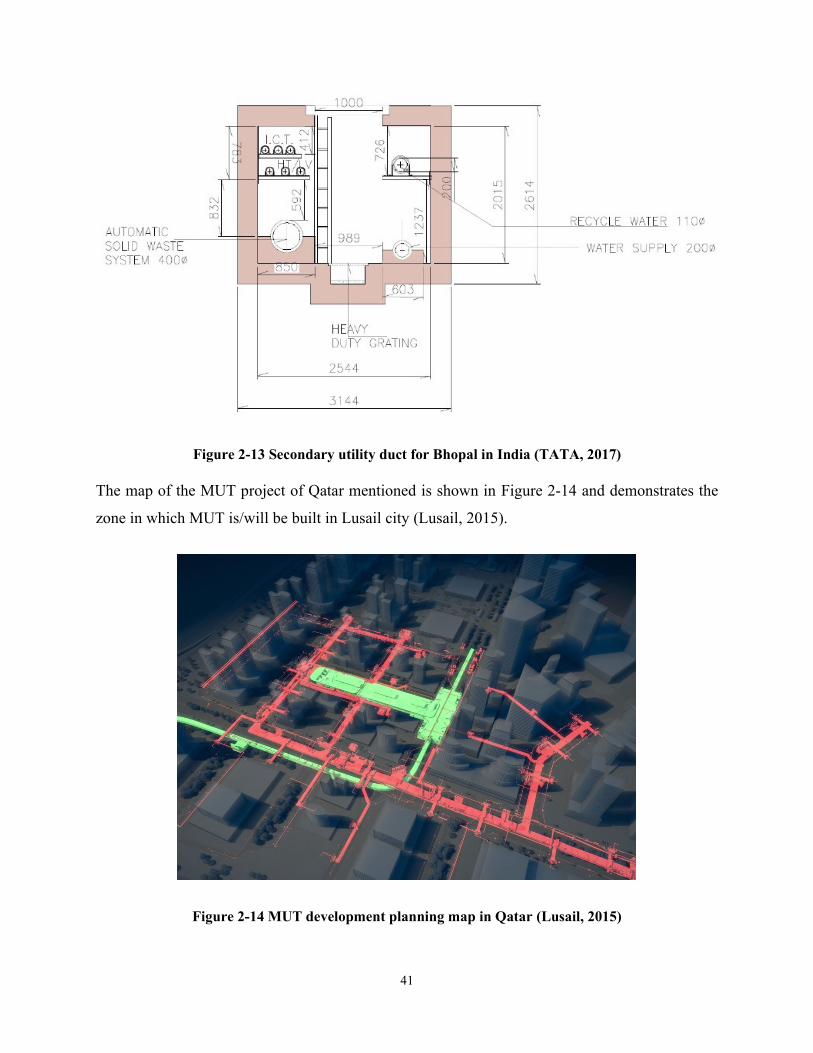
41
Figure 2-13 Secondary utility duct for Bhopal in India (TATA, 2017)
The map of the MUT project of Qatar mentioned is shown in Figure 2-14 and demonstrates the
zone in which MUT is/will be built in Lusail city (Lusail, 2015).
Figure 2-14 MUT development planning map in Qatar (Lusail, 2015)

42
Table 2-6 MUTs in the Middle East and parts of Asia (Luo et al., 2020)
COUNTRY CITY MUT
LOCATIONS
YE
AR
LE
NG
TH
(k
m)
DE
PT
H (
m)
WID
TH
(m)
HE
IGH
T(m
)
SH
AP
E
MA
TE
RIA
L
HOSTED UTILITIES
RE
FE
RE
NC
ES
GA
S
WA
TE
R
RE
FU
SE
DIS
TR
ICT
CO
OL
ING
DIS
TR
ICT
HE
AT
ING
SE
WA
GE
CO
MM
UN
ICA
TIO
N
EL
EC
TR
ICIT
Y
India Bhopal Bhopal 2001 ✔ ✔ ✔ ✔ (TATA, 2017)
Gujarat Gift City 2015 16 11 7.6 6.2 R ✔ ✔ ✔ ✔ ✔ ✔ (Gift Gujarat, 2019; Bently, 2020)
Iran Mashhad Mashhad 2016 5 5 C PC ✔ ✔ ✔ (Financial Tribune, 2015; AKpipe, 2017)
Israel Haifa Haifa 2006 1 5.5 3 3.75 PC ✔ ✔ ✔ ✔ (Rogers & Hunt, 2006; Park &Yun, 2018)
Kuwait
Subah Al-
Salem University
City
2017 7.5 ✔ ✔ ✔ ✔ (Alraimedia, 2017)
Malaysia Putrajaya 2003 15 2 8 5 R CSC ✔ ✔ ✔ ✔ ✔ ✔ (Adnan & Heng, 2003)
Qatar
Education
City, Doha
South Site U.T. 2012 8.8 ✔ ✔ ✔ (STRABAG International GmbH, 2012)
North Site U.T. 2012 6.4 (Griffin, 2015)
Lusail Lusail 2009 15 CSC ✔ ✔ ✔ ✔ (Griffin, 2015)
2014 3 3 ✔ ✔ ✔ ✔ (Noman, 2014)
Singapore New
Downtown Marina Bay 2016 20 2 12 4 R CSC ✔ ✔ ✔ ✔ ✔ ✔ ✔ ✔ (Liu & Loong, 2015)
Saudi
Arabia
Jubail and Yanbu
Jubail and Yanbu
1975 ✔ ✔ ✔ (Al-Ghamdi, 2014)
Makkah King Abdul
Aziz Road 2019 9 ✔ ✔ ✔ ✔ ✔ (COWI, n.d)
Taif Taif 2014 ✔ ✔ ✔ (Al Eqtisadiah, 2014)
Syria Damascus Maruta City 2019 17 ✔ ✔ ✔ (Al-iqtissadiya, 2019)
Shape: C - Circular, R – Rectangular
Materials: CSC- Cast in-situ concrete PC- Pre-cast concrete
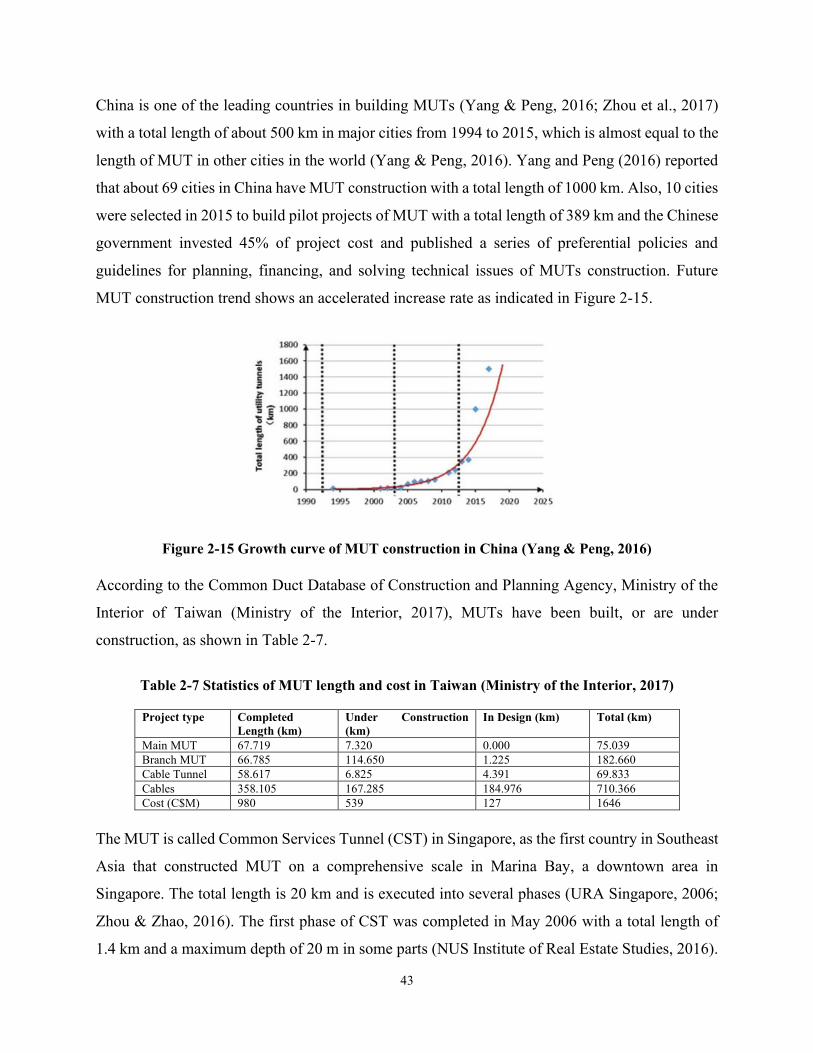
43
China is one of the leading countries in building MUTs (Yang & Peng, 2016; Zhou et al., 2017)
with a total length of about 500 km in major cities from 1994 to 2015, which is almost equal to the
length of MUT in other cities in the world (Yang & Peng, 2016). Yang and Peng (2016) reported
that about 69 cities in China have MUT construction with a total length of 1000 km. Also, 10 cities
were selected in 2015 to build pilot projects of MUT with a total length of 389 km and the Chinese
government invested 45% of project cost and published a series of preferential policies and
guidelines for planning, financing, and solving technical issues of MUTs construction. Future
MUT construction trend shows an accelerated increase rate as indicated in Figure 2-15.
Figure 2-15 Growth curve of MUT construction in China (Yang & Peng, 2016)
According to the Common Duct Database of Construction and Planning Agency, Ministry of the
Interior of Taiwan (Ministry of the Interior, 2017), MUTs have been built, or are under
construction, as shown in Table 2-7.
Table 2-7 Statistics of MUT length and cost in Taiwan (Ministry of the Interior, 2017)
Project type Completed
Length (km)
Under Construction
(km)
In Design (km) Total (km)
Main MUT 67.719 7.320 0.000 75.039
Branch MUT 66.785 114.650 1.225 182.660
Cable Tunnel 58.617 6.825 4.391 69.833
Cables 358.105 167.285 184.976 710.366
Cost (C$M) 980 539 127 1646
The MUT is called Common Services Tunnel (CST) in Singapore, as the first country in Southeast
Asia that constructed MUT on a comprehensive scale in Marina Bay, a downtown area in
Singapore. The total length is 20 km and is executed into several phases (URA Singapore, 2006;
Zhou & Zhao, 2016). The first phase of CST was completed in May 2006 with a total length of
1.4 km and a maximum depth of 20 m in some parts (NUS Institute of Real Estate Studies, 2016).
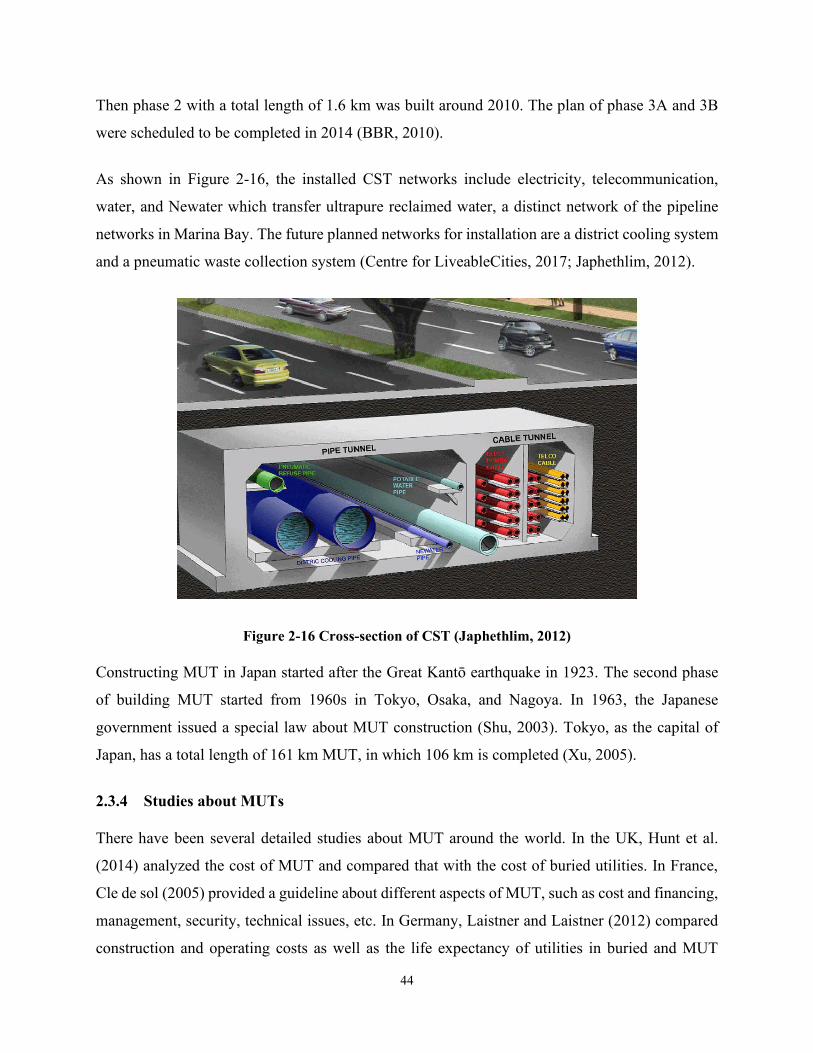
44
Then phase 2 with a total length of 1.6 km was built around 2010. The plan of phase 3A and 3B
were scheduled to be completed in 2014 (BBR, 2010).
As shown in Figure 2-16, the installed CST networks include electricity, telecommunication,
water, and Newater which transfer ultrapure reclaimed water, a distinct network of the pipeline
networks in Marina Bay. The future planned networks for installation are a district cooling system
and a pneumatic waste collection system (Centre for LiveableCities, 2017; Japhethlim, 2012).
Figure 2-16 Cross-section of CST (Japhethlim, 2012)
Constructing MUT in Japan started after the Great Kantō earthquake in 1923. The second phase
of building MUT started from 1960s in Tokyo, Osaka, and Nagoya. In 1963, the Japanese
government issued a special law about MUT construction (Shu, 2003). Tokyo, as the capital of
Japan, has a total length of 161 km MUT, in which 106 km is completed (Xu, 2005).
2.3.4 Studies about MUTs
There have been several detailed studies about MUT around the world. In the UK, Hunt et al.
(2014) analyzed the cost of MUT and compared that with the cost of buried utilities. In France,
Cle de sol (2005) provided a guideline about different aspects of MUT, such as cost and financing,
management, security, technical issues, etc. In Germany, Laistner and Laistner (2012) compared
construction and operating costs as well as the life expectancy of utilities in buried and MUT
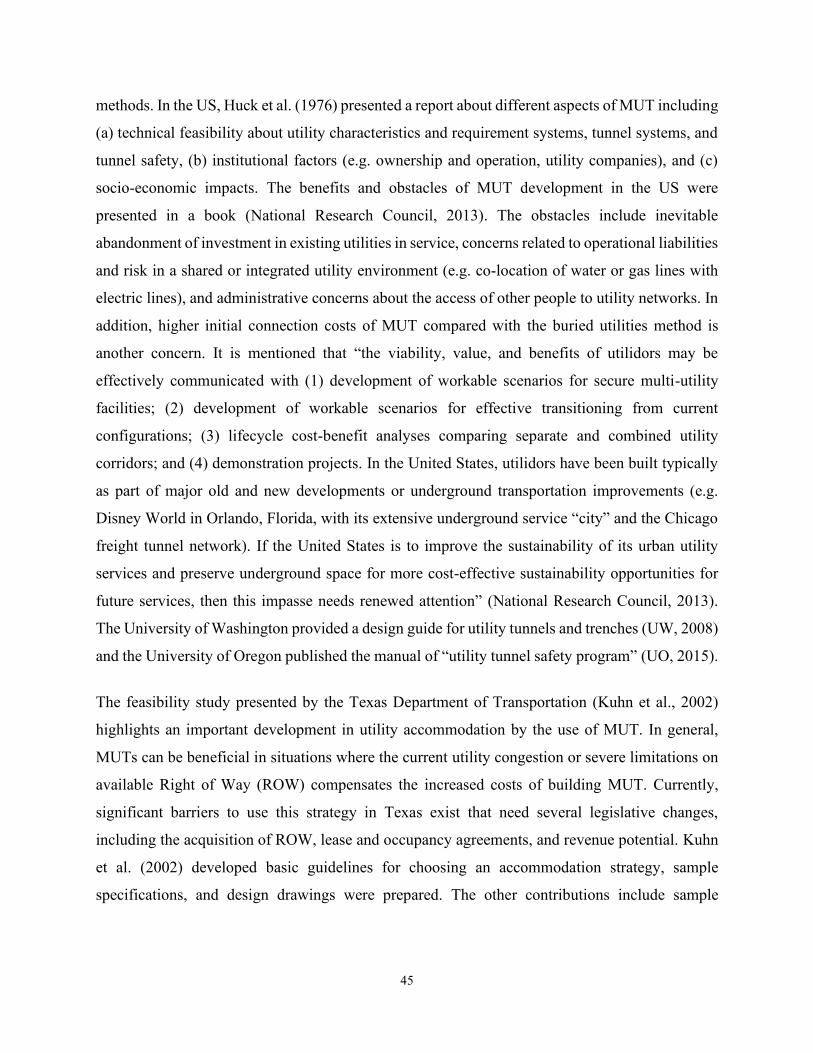
45
methods. In the US, Huck et al. (1976) presented a report about different aspects of MUT including
(a) technical feasibility about utility characteristics and requirement systems, tunnel systems, and
tunnel safety, (b) institutional factors (e.g. ownership and operation, utility companies), and (c)
socio-economic impacts. The benefits and obstacles of MUT development in the US were
presented in a book (National Research Council, 2013). The obstacles include inevitable
abandonment of investment in existing utilities in service, concerns related to operational liabilities
and risk in a shared or integrated utility environment (e.g. co-location of water or gas lines with
electric lines), and administrative concerns about the access of other people to utility networks. In
addition, higher initial connection costs of MUT compared with the buried utilities method is
another concern. It is mentioned that “the viability, value, and benefits of utilidors may be
effectively communicated with (1) development of workable scenarios for secure multi-utility
facilities; (2) development of workable scenarios for effective transitioning from current
configurations; (3) lifecycle cost-benefit analyses comparing separate and combined utility
corridors; and (4) demonstration projects. In the United States, utilidors have been built typically
as part of major old and new developments or underground transportation improvements (e.g.
Disney World in Orlando, Florida, with its extensive underground service “city” and the Chicago
freight tunnel network). If the United States is to improve the sustainability of its urban utility
services and preserve underground space for more cost-effective sustainability opportunities for
future services, then this impasse needs renewed attention” (National Research Council, 2013).
The University of Washington provided a design guide for utility tunnels and trenches (UW, 2008)
and the University of Oregon published the manual of “utility tunnel safety program” (UO, 2015).
The feasibility study presented by the Texas Department of Transportation (Kuhn et al., 2002)
highlights an important development in utility accommodation by the use of MUT. In general,
MUTs can be beneficial in situations where the current utility congestion or severe limitations on
available Right of Way (ROW) compensates the increased costs of building MUT. Currently,
significant barriers to use this strategy in Texas exist that need several legislative changes,
including the acquisition of ROW, lease and occupancy agreements, and revenue potential. Kuhn
et al. (2002) developed basic guidelines for choosing an accommodation strategy, sample
specifications, and design drawings were prepared. The other contributions include sample
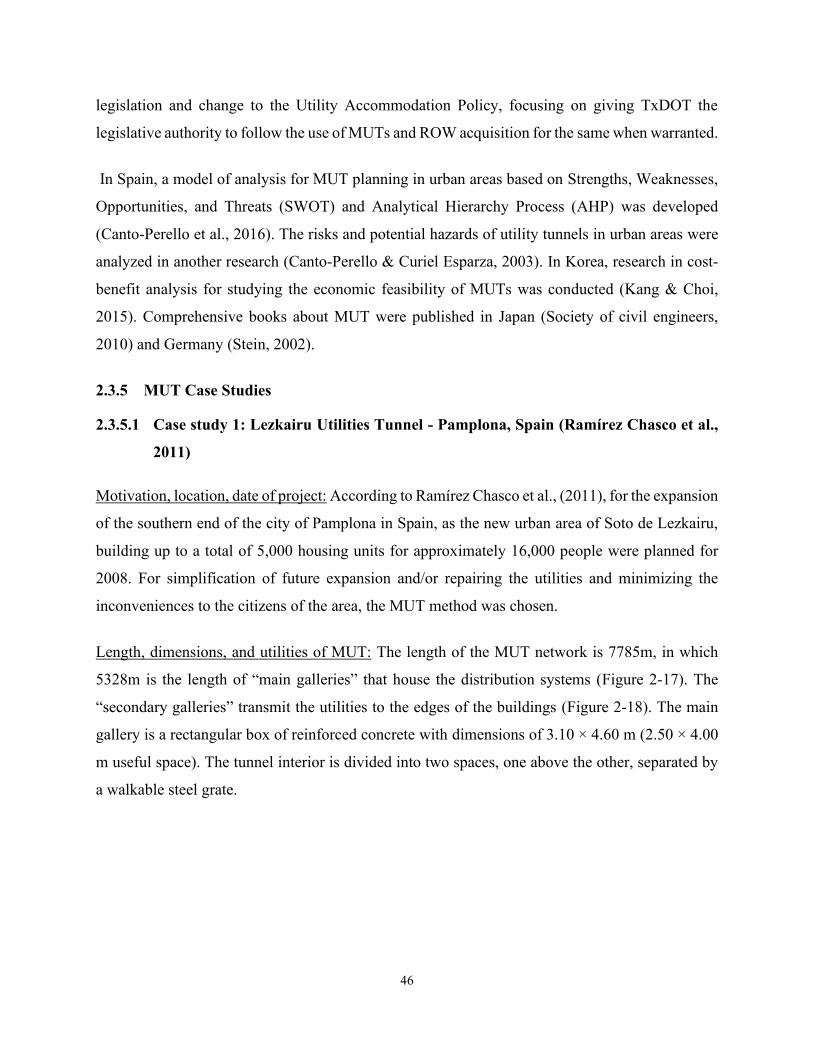
46
legislation and change to the Utility Accommodation Policy, focusing on giving TxDOT the
legislative authority to follow the use of MUTs and ROW acquisition for the same when warranted.
In Spain, a model of analysis for MUT planning in urban areas based on Strengths, Weaknesses,
Opportunities, and Threats (SWOT) and Analytical Hierarchy Process (AHP) was developed
(Canto-Perello et al., 2016). The risks and potential hazards of utility tunnels in urban areas were
analyzed in another research (Canto-Perello & Curiel Esparza, 2003). In Korea, research in cost-
benefit analysis for studying the economic feasibility of MUTs was conducted (Kang & Choi,
2015). Comprehensive books about MUT were published in Japan (Society of civil engineers,
2010) and Germany (Stein, 2002).
2.3.5 MUT Case Studies
2.3.5.1 Case study 1: Lezkairu Utilities Tunnel - Pamplona, Spain (Ramírez Chasco et al.,
2011)
Motivation, location, date of project: According to Ramírez Chasco et al., (2011), for the expansion
of the southern end of the city of Pamplona in Spain, as the new urban area of Soto de Lezkairu,
building up to a total of 5,000 housing units for approximately 16,000 people were planned for
2008. For simplification of future expansion and/or repairing the utilities and minimizing the
inconveniences to the citizens of the area, the MUT method was chosen.
Length, dimensions, and utilities of MUT: The length of the MUT network is 7785m, in which
5328m is the length of “main galleries” that house the distribution systems (Figure 2-17). The
“secondary galleries” transmit the utilities to the edges of the buildings (Figure 2-18). The main
gallery is a rectangular box of reinforced concrete with dimensions of 3.10 × 4.60 m (2.50 × 4.00
m useful space). The tunnel interior is divided into two spaces, one above the other, separated by
a walkable steel grate.
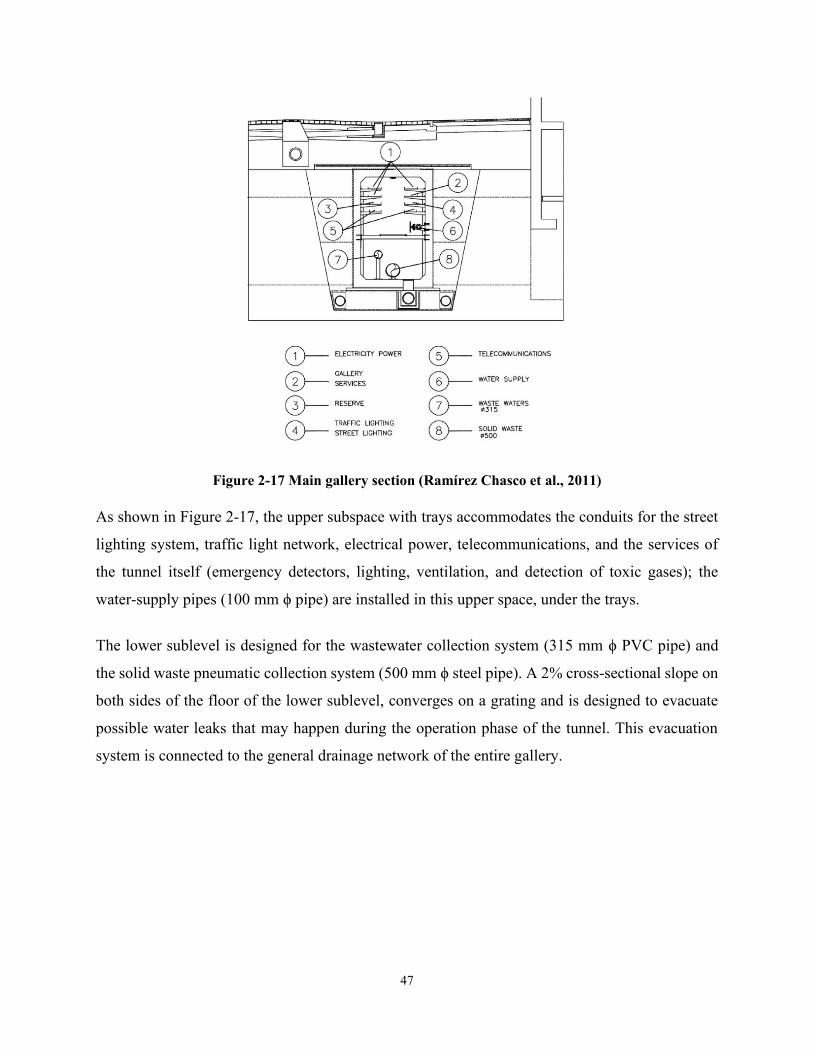
47
Figure 2-17 Main gallery section (Ramírez Chasco et al., 2011)
As shown in Figure 2-17, the upper subspace with trays accommodates the conduits for the street
lighting system, traffic light network, electrical power, telecommunications, and the services of
the tunnel itself (emergency detectors, lighting, ventilation, and detection of toxic gases); the
water-supply pipes (100 mm ϕ pipe) are installed in this upper space, under the trays.
The lower sublevel is designed for the wastewater collection system (315 mm ϕ PVC pipe) and
the solid waste pneumatic collection system (500 mm ϕ steel pipe). A 2% cross-sectional slope on
both sides of the floor of the lower sublevel, converges on a grating and is designed to evacuate
possible water leaks that may happen during the operation phase of the tunnel. This evacuation
system is connected to the general drainage network of the entire gallery.

48
Figure 2-18 Cross-section of the secondary utility gallery that connects from the main gallery to the
individual plots (Ramírez Chasco et al., 2011)
The secondary gallery tunnels are made of 2-m-long prefabricated modules of reinforced concrete
with interior dimensions of 1.50 × 3.00 m. The utilities include a pneumatic solid waste collection
system, in a 500 mm ϕ steel pipe; two trays to hold the fiberglass telephone network and cable TV
network, respectively; a waste-water collection system passing through a 200 mm ϕ PVC pipe;
100 mm ϕ cast-iron pipe of water supply; and, finally, a tray to support all the electric power-track
systems.
Construction method: Cast-in-place reinforced concrete is considered for the main gallery and
prefabricated modules of reinforced concrete for the secondary gallery (Figure 2-19). The average
depth is approximately 6.50 m. To solve the problem of water pressure on the sidewalls and the
bottom of the concrete slab, an underground drainage system was designed for the removal of
water from around the galleries. For the safety of the operation and maintenance performance,
three considerations were taken into account:
- Accessibility for materials and small machinery: only one access was provided, large
enough for the safety and easy entry of personnel and materials. For the personnel exit/entry,
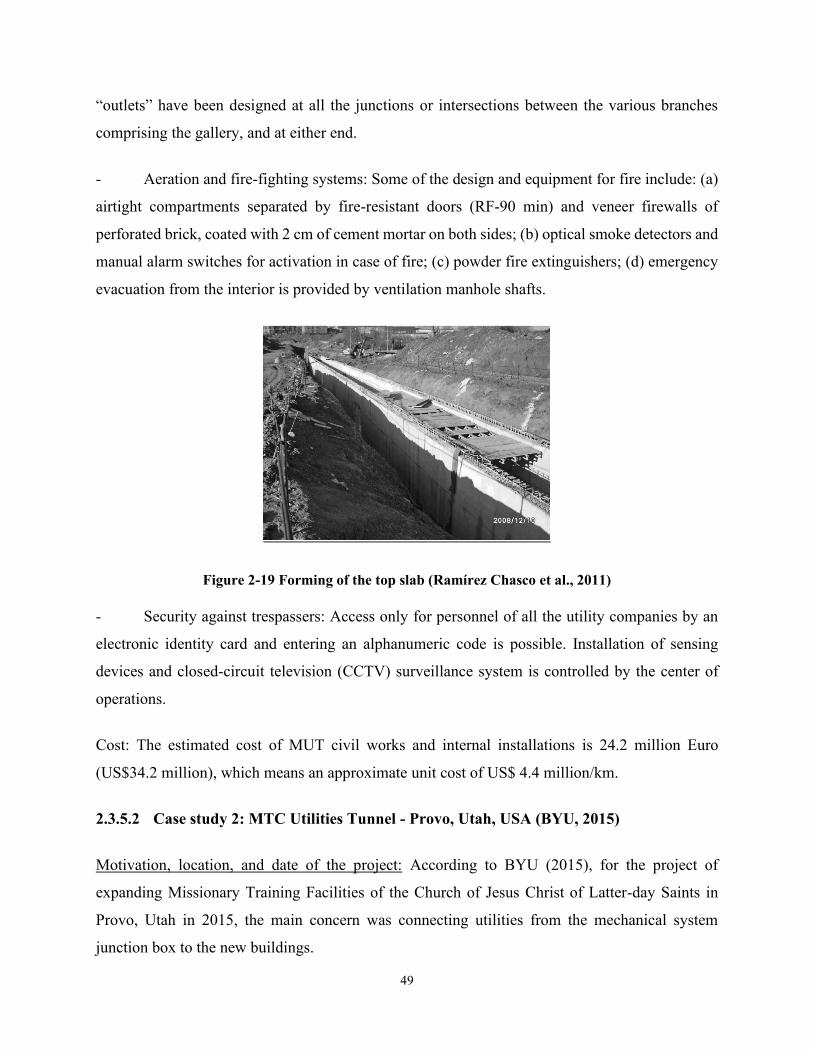
49
“outlets” have been designed at all the junctions or intersections between the various branches
comprising the gallery, and at either end.
- Aeration and fire-fighting systems: Some of the design and equipment for fire include: (a)
airtight compartments separated by fire-resistant doors (RF-90 min) and veneer firewalls of
perforated brick, coated with 2 cm of cement mortar on both sides; (b) optical smoke detectors and
manual alarm switches for activation in case of fire; (c) powder fire extinguishers; (d) emergency
evacuation from the interior is provided by ventilation manhole shafts.
Figure 2-19 Forming of the top slab (Ramírez Chasco et al., 2011)
- Security against trespassers: Access only for personnel of all the utility companies by an
electronic identity card and entering an alphanumeric code is possible. Installation of sensing
devices and closed-circuit television (CCTV) surveillance system is controlled by the center of
operations.
Cost: The estimated cost of MUT civil works and internal installations is 24.2 million Euro
(US$34.2 million), which means an approximate unit cost of US$ 4.4 million/km.
2.3.5.2 Case study 2: MTC Utilities Tunnel - Provo, Utah, USA (BYU, 2015)
Motivation, location, and date of the project: According to BYU (2015), for the project of
expanding Missionary Training Facilities of the Church of Jesus Christ of Latter-day Saints in
Provo, Utah in 2015, the main concern was connecting utilities from the mechanical system
junction box to the new buildings.
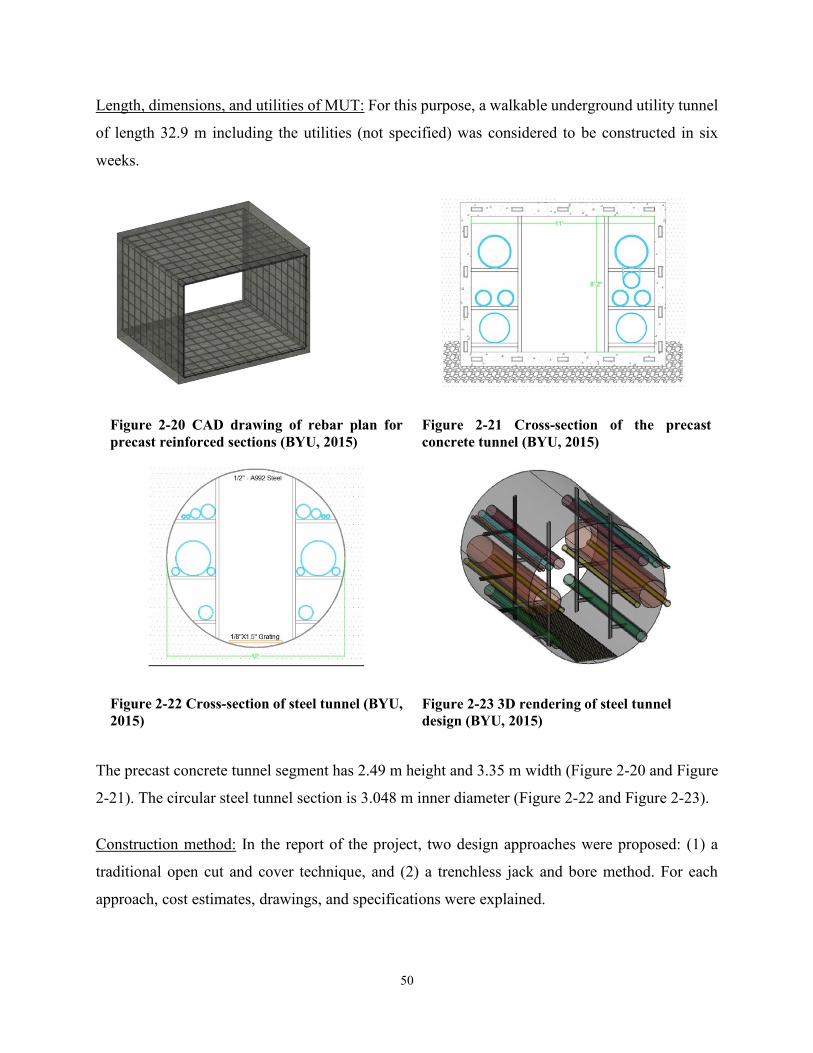
50
Length, dimensions, and utilities of MUT: For this purpose, a walkable underground utility tunnel
of length 32.9 m including the utilities (not specified) was considered to be constructed in six
weeks.
Figure 2-20 CAD drawing of rebar plan for
precast reinforced sections (BYU, 2015)
Figure 2-21 Cross-section of the precast
concrete tunnel (BYU, 2015)
Figure 2-22 Cross-section of steel tunnel (BYU,
2015)
Figure 2-23 3D rendering of steel tunnel
design (BYU, 2015)
The precast concrete tunnel segment has 2.49 m height and 3.35 m width (Figure 2-20 and Figure
2-21). The circular steel tunnel section is 3.048 m inner diameter (Figure 2-22 and Figure 2-23).
Construction method: In the report of the project, two design approaches were proposed: (1) a
traditional open cut and cover technique, and (2) a trenchless jack and bore method. For each
approach, cost estimates, drawings, and specifications were explained.
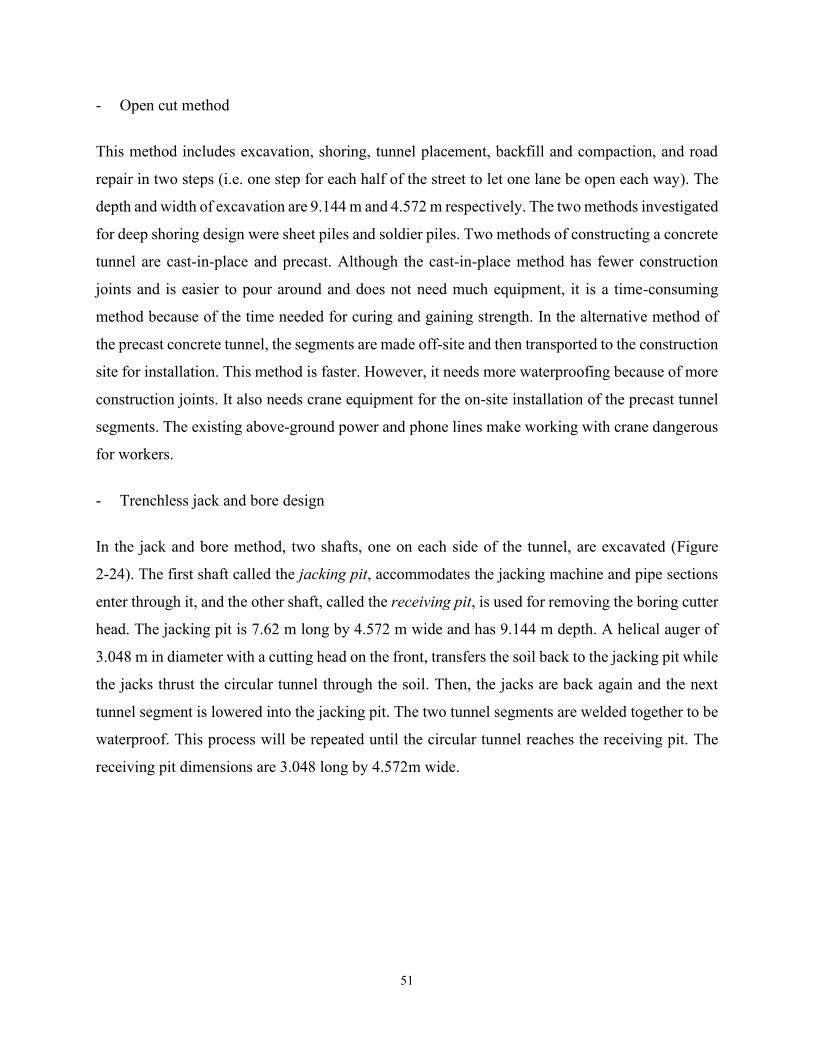
51
- Open cut method
This method includes excavation, shoring, tunnel placement, backfill and compaction, and road
repair in two steps (i.e. one step for each half of the street to let one lane be open each way). The
depth and width of excavation are 9.144 m and 4.572 m respectively. The two methods investigated
for deep shoring design were sheet piles and soldier piles. Two methods of constructing a concrete
tunnel are cast-in-place and precast. Although the cast-in-place method has fewer construction
joints and is easier to pour around and does not need much equipment, it is a time-consuming
method because of the time needed for curing and gaining strength. In the alternative method of
the precast concrete tunnel, the segments are made off-site and then transported to the construction
site for installation. This method is faster. However, it needs more waterproofing because of more
construction joints. It also needs crane equipment for the on-site installation of the precast tunnel
segments. The existing above-ground power and phone lines make working with crane dangerous
for workers.
- Trenchless jack and bore design
In the jack and bore method, two shafts, one on each side of the tunnel, are excavated (Figure
2-24). The first shaft called the jacking pit, accommodates the jacking machine and pipe sections
enter through it, and the other shaft, called the receiving pit, is used for removing the boring cutter
head. The jacking pit is 7.62 m long by 4.572 m wide and has 9.144 m depth. A helical auger of
3.048 m in diameter with a cutting head on the front, transfers the soil back to the jacking pit while
the jacks thrust the circular tunnel through the soil. Then, the jacks are back again and the next
tunnel segment is lowered into the jacking pit. The two tunnel segments are welded together to be
waterproof. This process will be repeated until the circular tunnel reaches the receiving pit. The
receiving pit dimensions are 3.048 long by 4.572m wide.
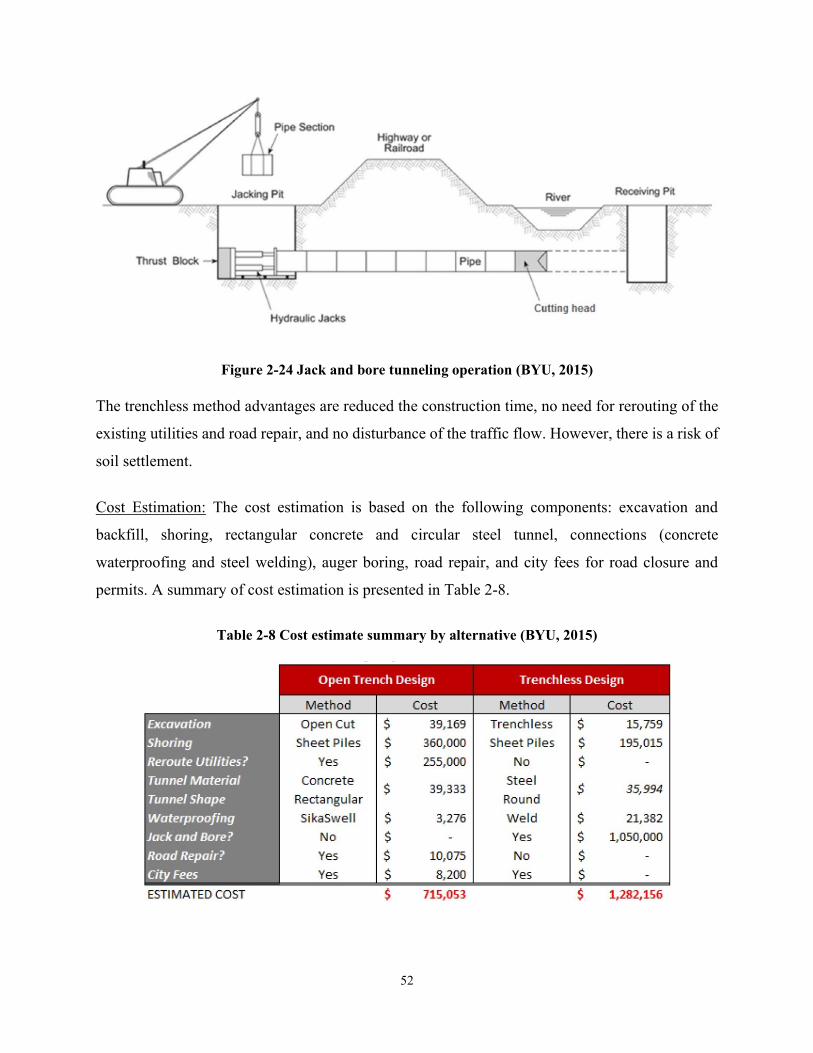
52
Figure 2-24 Jack and bore tunneling operation (BYU, 2015)
The trenchless method advantages are reduced the construction time, no need for rerouting of the
existing utilities and road repair, and no disturbance of the traffic flow. However, there is a risk of
soil settlement.
Cost Estimation: The cost estimation is based on the following components: excavation and
backfill, shoring, rectangular concrete and circular steel tunnel, connections (concrete
waterproofing and steel welding), auger boring, road repair, and city fees for road closure and
permits. A summary of cost estimation is presented in Table 2-8.
Table 2-8 Cost estimate summary by alternative (BYU, 2015)
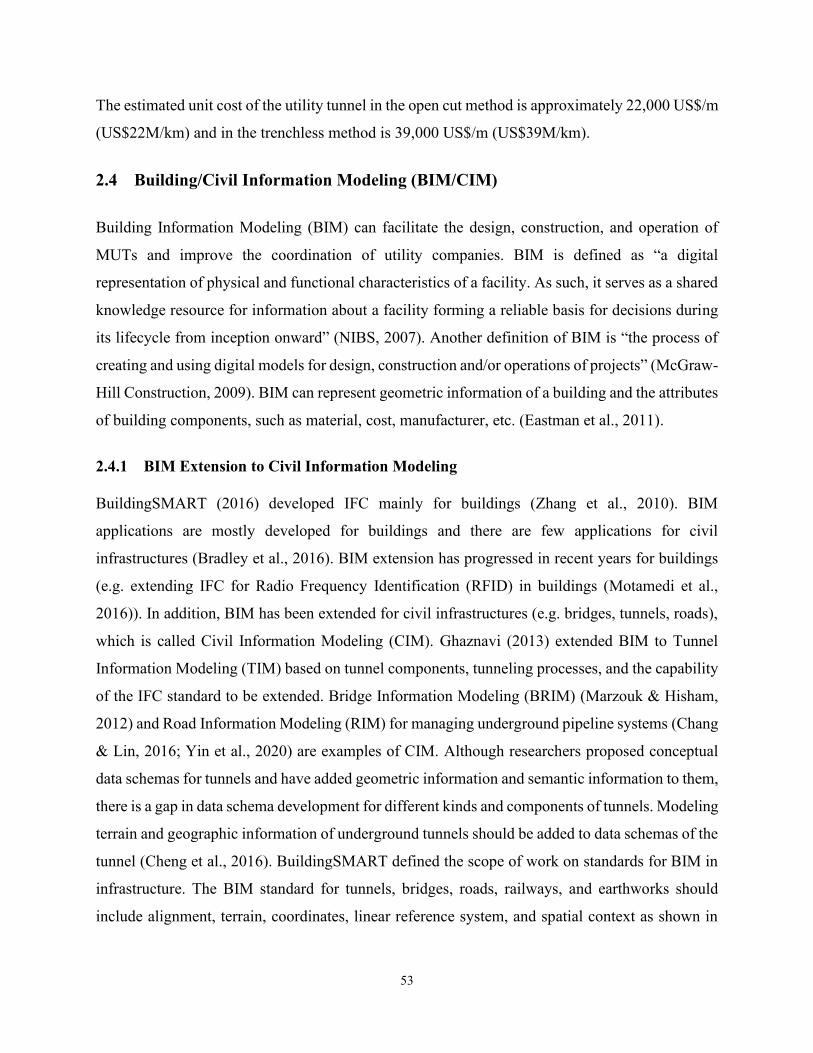
53
The estimated unit cost of the utility tunnel in the open cut method is approximately 22,000 US$/m
(US$22M/km) and in the trenchless method is 39,000 US$/m (US$39M/km).
2.4 Building/Civil Information Modeling (BIM/CIM)
Building Information Modeling (BIM) can facilitate the design, construction, and operation of
MUTs and improve the coordination of utility companies. BIM is defined as “a digital
representation of physical and functional characteristics of a facility. As such, it serves as a shared
knowledge resource for information about a facility forming a reliable basis for decisions during
its lifecycle from inception onward” (NIBS, 2007). Another definition of BIM is “the process of
creating and using digital models for design, construction and/or operations of projects” (McGraw-
Hill Construction, 2009). BIM can represent geometric information of a building and the attributes
of building components, such as material, cost, manufacturer, etc. (Eastman et al., 2011).
2.4.1 BIM Extension to Civil Information Modeling
BuildingSMART (2016) developed IFC mainly for buildings (Zhang et al., 2010). BIM
applications are mostly developed for buildings and there are few applications for civil
infrastructures (Bradley et al., 2016). BIM extension has progressed in recent years for buildings
(e.g. extending IFC for Radio Frequency Identification (RFID) in buildings (Motamedi et al.,
2016)). In addition, BIM has been extended for civil infrastructures (e.g. bridges, tunnels, roads),
which is called Civil Information Modeling (CIM). Ghaznavi (2013) extended BIM to Tunnel
Information Modeling (TIM) based on tunnel components, tunneling processes, and the capability
of the IFC standard to be extended. Bridge Information Modeling (BRIM) (Marzouk & Hisham,
2012) and Road Information Modeling (RIM) for managing underground pipeline systems (Chang
& Lin, 2016; Yin et al., 2020) are examples of CIM. Although researchers proposed conceptual
data schemas for tunnels and have added geometric information and semantic information to them,
there is a gap in data schema development for different kinds and components of tunnels. Modeling
terrain and geographic information of underground tunnels should be added to data schemas of the
tunnel (Cheng et al., 2016). BuildingSMART defined the scope of work on standards for BIM in
infrastructure. The BIM standard for tunnels, bridges, roads, railways, and earthworks should
include alignment, terrain, coordinates, linear reference system, and spatial context as shown in
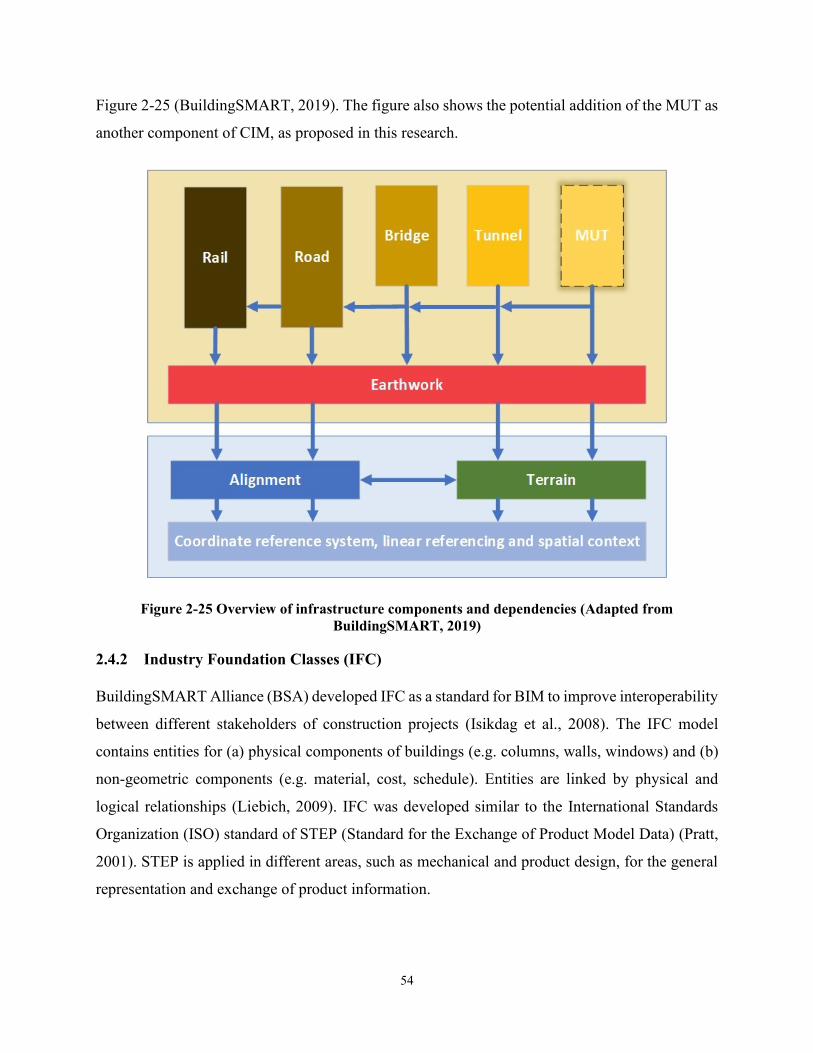
54
Figure 2-25 (BuildingSMART, 2019). The figure also shows the potential addition of the MUT as
another component of CIM, as proposed in this research.
Figure 2-25 Overview of infrastructure components and dependencies (Adapted from
BuildingSMART, 2019)
2.4.2 Industry Foundation Classes (IFC)
BuildingSMART Alliance (BSA) developed IFC as a standard for BIM to improve interoperability
between different stakeholders of construction projects (Isikdag et al., 2008). The IFC model
contains entities for (a) physical components of buildings (e.g. columns, walls, windows) and (b)
non-geometric components (e.g. material, cost, schedule). Entities are linked by physical and
logical relationships (Liebich, 2009). IFC was developed similar to the International Standards
Organization (ISO) standard of STEP (Standard for the Exchange of Product Model Data) (Pratt,
2001). STEP is applied in different areas, such as mechanical and product design, for the general
representation and exchange of product information.
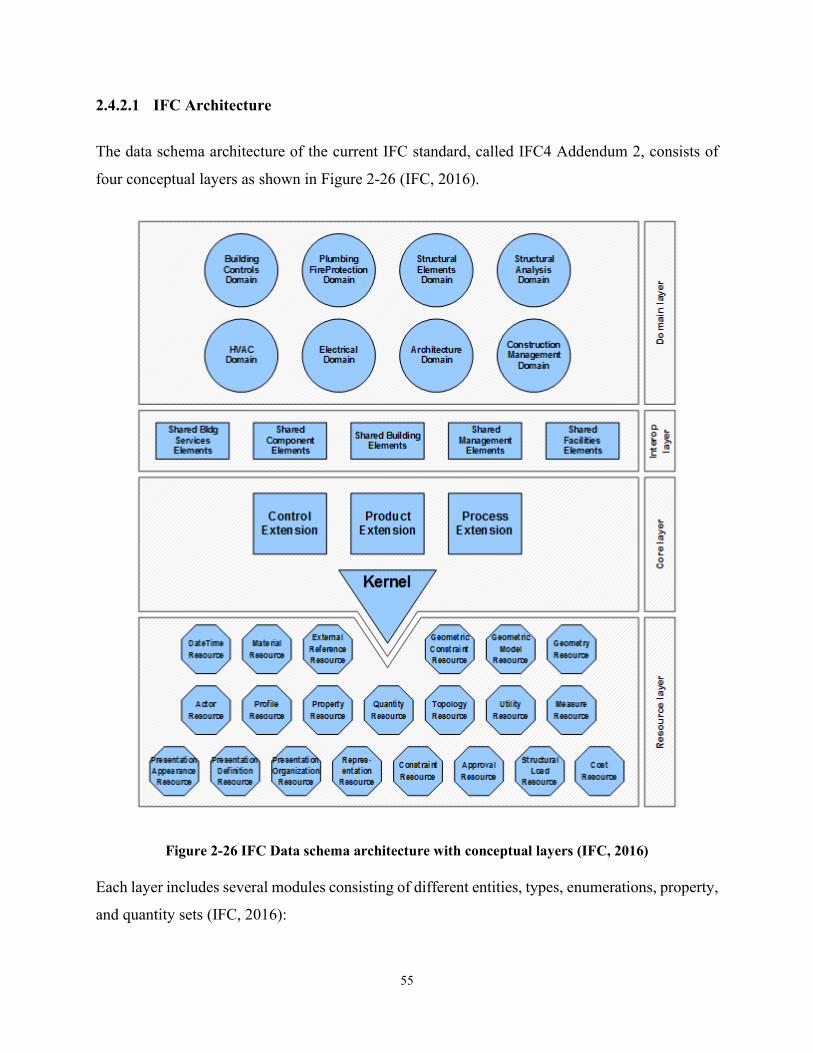
55
2.4.2.1 IFC Architecture
The data schema architecture of the current IFC standard, called IFC4 Addendum 2, consists of
four conceptual layers as shown in Figure 2-26 (IFC, 2016).
Figure 2-26 IFC Data schema architecture with conceptual layers (IFC, 2016)
Each layer includes several modules consisting of different entities, types, enumerations, property,
and quantity sets (IFC, 2016):
56
(a) Domain layer: as the highest layer, it includes entity definitions which are specializations of
products, processes or resources for a certain discipline (e.g. building controls, electrical, structural
elements); (b) Interoperability layer: this layer consists of schemas including entity definitions for
a general product, process or resource specialization, usage between different disciplines for inter-
domain exchange and sharing of construction information. Examples include shared building
services, shared building elements, shared management elements, etc.; (c) Core layer: it includes
the kernel schema and the core extension schema, consisting of the most general definitions; (d)
Resource layer: this layer consists of all individual schemas that include resource definitions (e.g.
material resource, geometric model resource). The hierarchical and modular structure of IFC
enables facilitated maintenance and expansion of the model, and lower-level entities can be used
again in higher-level definitions. This facilitates model implementation in various discipline-
specific software applications (Khemlani, 2004; IFC, 2016). To define new extended entities in
IFC, it is important to consider: the principle of inheritance as the way of referencing the entities
in the same or lower layers, object-oriented concept, and classification rules (Ghaznavi, 2013;
Weise et al., 2000). Several software applications support the IFC standard and data exchange.
IFC should be developed more, as it has limitations for the support of a few use cases in the
AEC/FM industry (Ma et al., 2011; Weise et al., 2008).
2.4.2.2 Extending IFC
In IFC standard, entities are assigned to objects with predefined attributes. The attributes can be
inherited by all relevant entities. The inheritance property of IFC from super-entity facilitates
redefining the content. Therefore, it is necessary to describe entities and their inheritance
relationship within the information model to clarify a holistic view of related entities (Ma et al.,
2011). STEP is an international standard for the computer-interpretable representation and the
exchange of product model data. The information model specification language of STEP is
EXPRESS-G, the visual representation of the EXPRESS, which demonstrates the hierarchal
structure of main classes and sub-classes in the IFC schema. EXPRESS consists of object-oriented,
procedural and database concepts. It describes a mainly static product model completely and
without ambiguity. EXPRESS defines an information domain with entities, i.e. classes of objects
that share common properties and are specified by related attributes and constraints. EXPRESS-G
can illustrate the static components, e.g. entities, attributes, type declarations, and hierarchies of
57
inheritance. However, it cannot visualize functional components, local or global rules, and
algorithms (Arnold & Podehl, 1999). The strength of EXPRESS is being brief and appropriate for
data validation rules in the data specification. Also, an ifcXML specification is generated as an
XML schema (BuildingSmart, 2016). The current IFC by BuildingSMART (2016) is developed
mainly for buildings (Zhang et al., 2010). There have been previous attempts to extend BIM. For
example, BIM extension was proposed for (a) defining RFID system components, their properties,
and their relationships with other building elements (Motamedi, 2013), and (b) defining new
entities for tunnel design and tunneling construction projects (Ghaznavi, 2013).
Consequently, it is necessary to extend the semantics of the available IFC to MUT-specific entities.
For that purpose, the exchange requirements are captured using Model View Definition (MVD)
(Ghaznavi, 2013). MVD is the set of information exchange requirements for the data flow between
business processes at a specific stage of the project using relevant information of the model.
Information Delivery Manual (IDM) can be used to extend the available IFC schema (Wix &
Karlshoej, 2010). However, extending IFC needs at least two years to integrate the proposed
extensions in the next IFC release by BuildingSMART and start the implementation. The other
alternatives are using property sets and proxy elements as external data to link with IFC. Although
these alternative methods are more practical, they need agreements about the definition of
properties and proxies if they are intended to be shared with other software applications (Weise et
al., 2008).
2.4.3 BIM Applications for MUT Lifecycle Management
Although BIM is not fully applicable to MUT, previous studies used BIM for different phases of
the MUT lifecycle, including design, construction, and operation and maintenance.
2.4.3.1 BIM for Design and Construction Phases of MUTs
Hu and Zhang (2019) listed the information requirements for MUT design, operation, and
maintenance based on BIM. They stated the benefits of collaborative MUT design enabled by BIM
tools. They mentioned that the contractor’s involvement in early design stages in the development
of the MUT BIM model can help construction units understand the design concept more clearly
and link with the design unit better. BIM technology enables the construction management
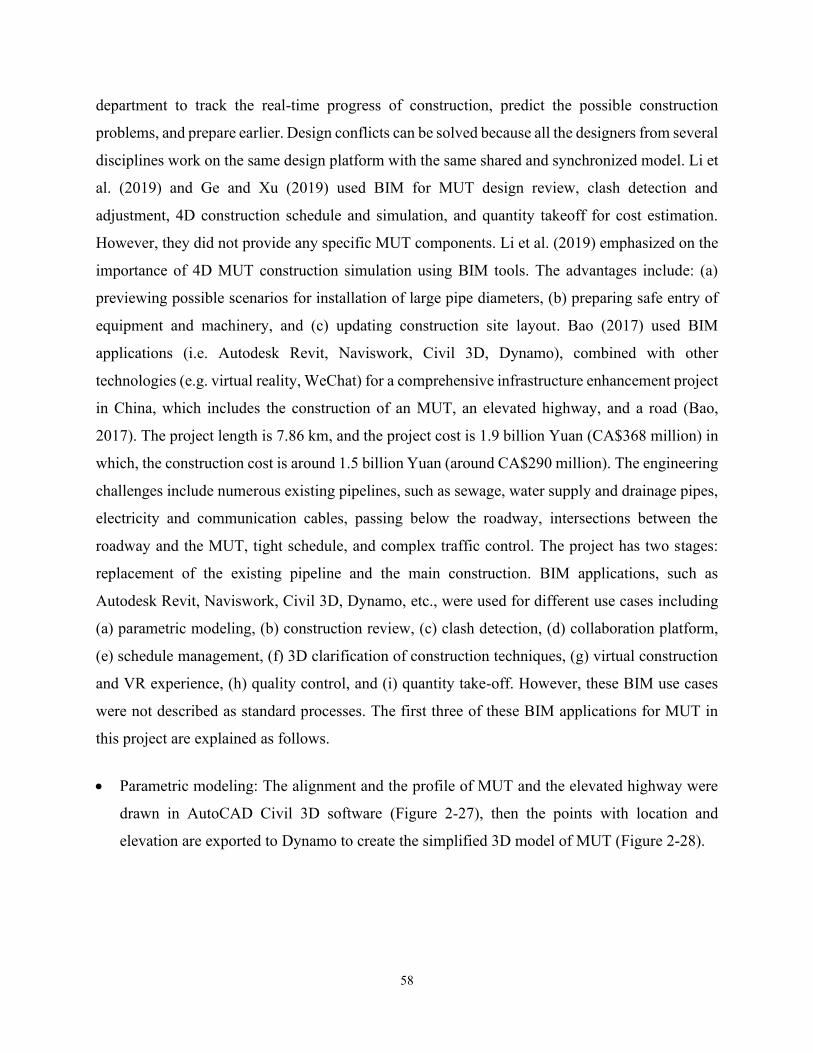
58
department to track the real-time progress of construction, predict the possible construction
problems, and prepare earlier. Design conflicts can be solved because all the designers from several
disciplines work on the same design platform with the same shared and synchronized model. Li et
al. (2019) and Ge and Xu (2019) used BIM for MUT design review, clash detection and
adjustment, 4D construction schedule and simulation, and quantity takeoff for cost estimation.
However, they did not provide any specific MUT components. Li et al. (2019) emphasized on the
importance of 4D MUT construction simulation using BIM tools. The advantages include: (a)
previewing possible scenarios for installation of large pipe diameters, (b) preparing safe entry of
equipment and machinery, and (c) updating construction site layout. Bao (2017) used BIM
applications (i.e. Autodesk Revit, Naviswork, Civil 3D, Dynamo), combined with other
technologies (e.g. virtual reality, WeChat) for a comprehensive infrastructure enhancement project
in China, which includes the construction of an MUT, an elevated highway, and a road (Bao,
2017). The project length is 7.86 km, and the project cost is 1.9 billion Yuan (CA$368 million) in
which, the construction cost is around 1.5 billion Yuan (around CA$290 million). The engineering
challenges include numerous existing pipelines, such as sewage, water supply and drainage pipes,
electricity and communication cables, passing below the roadway, intersections between the
roadway and the MUT, tight schedule, and complex traffic control. The project has two stages:
replacement of the existing pipeline and the main construction. BIM applications, such as
Autodesk Revit, Naviswork, Civil 3D, Dynamo, etc., were used for different use cases including
(a) parametric modeling, (b) construction review, (c) clash detection, (d) collaboration platform,
(e) schedule management, (f) 3D clarification of construction techniques, (g) virtual construction
and VR experience, (h) quality control, and (i) quantity take-off. However, these BIM use cases
were not described as standard processes. The first three of these BIM applications for MUT in
this project are explained as follows.
• Parametric modeling: The alignment and the profile of MUT and the elevated highway were
drawn in AutoCAD Civil 3D software (Figure 2-27), then the points with location and
elevation are exported to Dynamo to create the simplified 3D model of MUT (Figure 2-28).
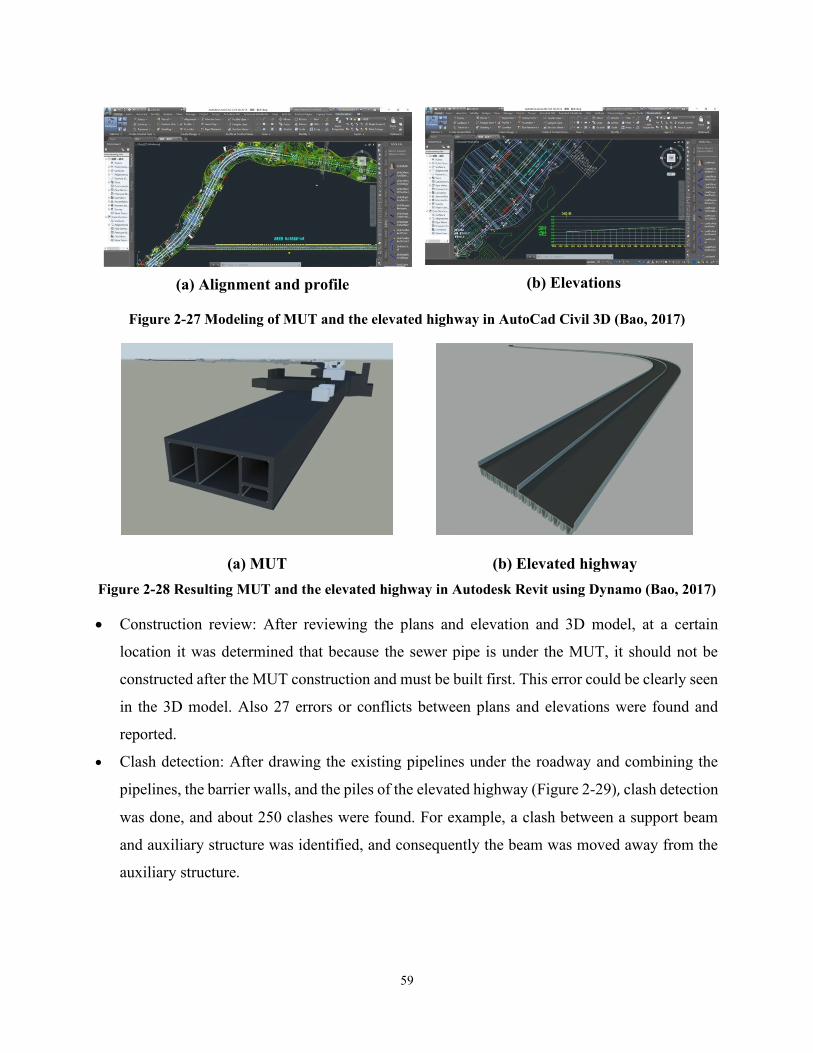
59
(a) Alignment and profile (b) Elevations
Figure 2-27 Modeling of MUT and the elevated highway in AutoCad Civil 3D (Bao, 2017)
(a) MUT
(b) Elevated highway
Figure 2-28 Resulting MUT and the elevated highway in Autodesk Revit using Dynamo (Bao, 2017)
• Construction review: After reviewing the plans and elevation and 3D model, at a certain
location it was determined that because the sewer pipe is under the MUT, it should not be
constructed after the MUT construction and must be built first. This error could be clearly seen
in the 3D model. Also 27 errors or conflicts between plans and elevations were found and
reported.
• Clash detection: After drawing the existing pipelines under the roadway and combining the
pipelines, the barrier walls, and the piles of the elevated highway (Figure 2-29), clash detection
was done, and about 250 clashes were found. For example, a clash between a support beam
and auxiliary structure was identified, and consequently the beam was moved away from the
auxiliary structure.
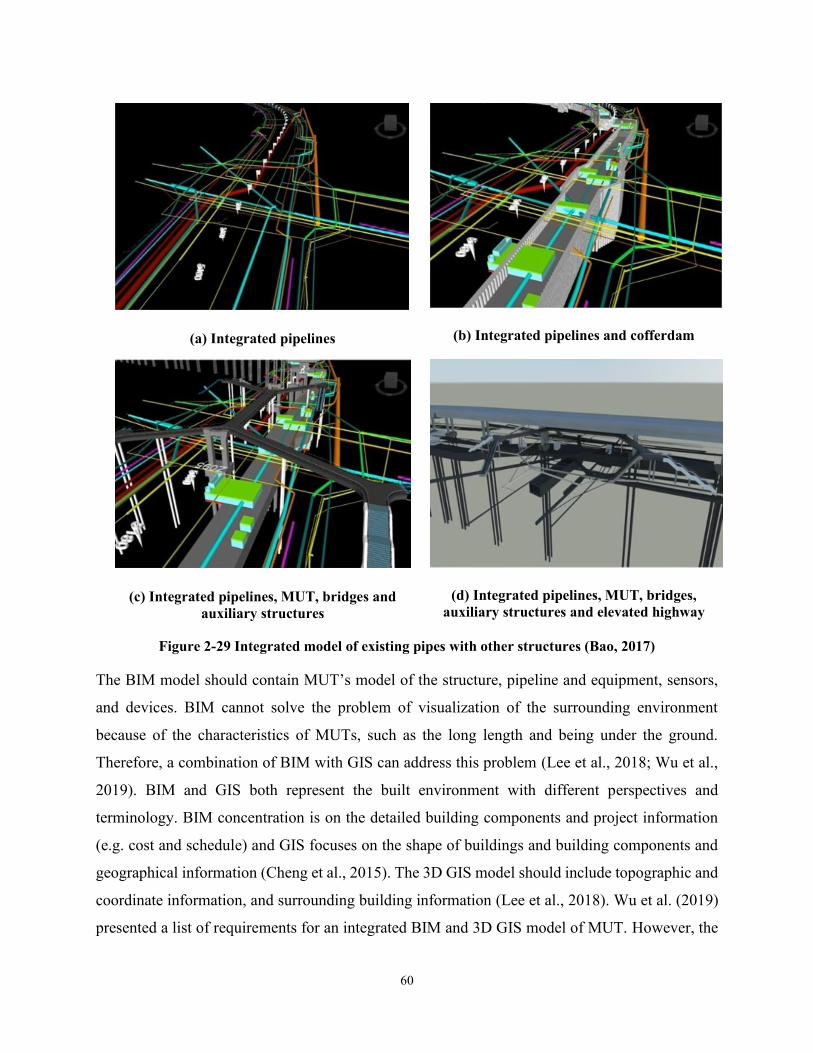
60
(a) Integrated pipelines
(b) Integrated pipelines and cofferdam
(c) Integrated pipelines, MUT, bridges and
auxiliary structures
(d) Integrated pipelines, MUT, bridges,
auxiliary structures and elevated highway
Figure 2-29 Integrated model of existing pipes with other structures (Bao, 2017)
The BIM model should contain MUT’s model of the structure, pipeline and equipment, sensors,
and devices. BIM cannot solve the problem of visualization of the surrounding environment
because of the characteristics of MUTs, such as the long length and being under the ground.
Therefore, a combination of BIM with GIS can address this problem (Lee et al., 2018; Wu et al.,
2019). BIM and GIS both represent the built environment with different perspectives and
terminology. BIM concentration is on the detailed building components and project information
(e.g. cost and schedule) and GIS focuses on the shape of buildings and building components and
geographical information (Cheng et al., 2015). The 3D GIS model should include topographic and
coordinate information, and surrounding building information (Lee et al., 2018). Wu et al. (2019)
presented a list of requirements for an integrated BIM and 3D GIS model of MUT. However, the
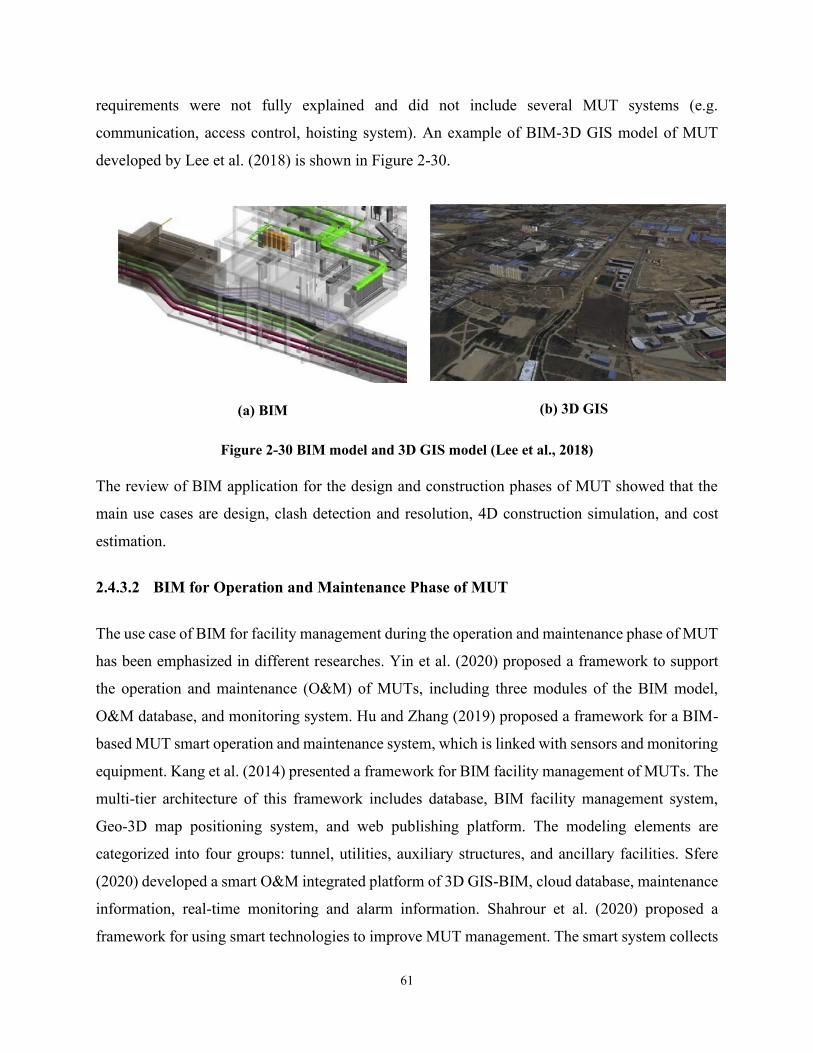
61
requirements were not fully explained and did not include several MUT systems (e.g.
communication, access control, hoisting system). An example of BIM-3D GIS model of MUT
developed by Lee et al. (2018) is shown in Figure 2-30.
(a) BIM
(b) 3D GIS
Figure 2-30 BIM model and 3D GIS model (Lee et al., 2018)
The review of BIM application for the design and construction phases of MUT showed that the
main use cases are design, clash detection and resolution, 4D construction simulation, and cost
estimation.
2.4.3.2 BIM for Operation and Maintenance Phase of MUT
The use case of BIM for facility management during the operation and maintenance phase of MUT
has been emphasized in different researches. Yin et al. (2020) proposed a framework to support
the operation and maintenance (O&M) of MUTs, including three modules of the BIM model,
O&M database, and monitoring system. Hu and Zhang (2019) proposed a framework for a BIM-
based MUT smart operation and maintenance system, which is linked with sensors and monitoring
equipment. Kang et al. (2014) presented a framework for BIM facility management of MUTs. The
multi-tier architecture of this framework includes database, BIM facility management system,
Geo-3D map positioning system, and web publishing platform. The modeling elements are
categorized into four groups: tunnel, utilities, auxiliary structures, and ancillary facilities. Sfere
(2020) developed a smart O&M integrated platform of 3D GIS-BIM, cloud database, maintenance
information, real-time monitoring and alarm information. Shahrour et al. (2020) proposed a
framework for using smart technologies to improve MUT management. The smart system collects

62
data about the tunnel and the accommodated utilities, operations, inspection, and maintenance
data.
Lee et al. (2018) presented an integrated BIM and 3D GIS web-based maintenance management
system to provide the visualized real-time monitor data (e.g. temperature, humidity, carbon dioxide
concentration, smoke sensory data) and to support management decisions of MUT. Maintenance
management data include complete equipment maintenance plans, equipment and sensor lists,
employee information, product data, supplier information, etc. The data sources of this MUT are
presented in Table 2-9.
Table 2-9 An example of MUT model data elements and data sources (Lee et al., 2018)
Model elements Data sources
Topographical surface and information (GIS) National open map database
Surrounding buildings Unmanned Aerial Vehicle (UAV)-Based Oblique
Photogrammetry
Utility tunnel model (BIM) Design and construction plans
Sensors Sensors installation plan
All the BIM and 3D GIS, maintenance management, and monitoring data are integrated into a
database. The proposed prototype system of Lee et al. (2018) contains three layers of data, data
linking and processing, and application as shown in Figure 2-31. For data linking and processing,
different techniques have been applied, e.g. exporting 3D data files via FBX and GIS files via
CityGML using Global Unique ID (GUID) and Universal Unique ID (UUID) in IFC format, using
coding systems of Construction Operations Building Information Exchange (COBie) or
OmniClass Construction Classification System (OmniClass or OCCS) to identify a device
(component) with a unique ID, and adding the ID to the BIM element attributes to enable data
linking. The GUID in the IFC format includes letters and numbers. For using in database, the
GUID format can be converted to a digital ID, which includes only numbers and is called Element
ID. In addition to BIM and 3D GIS programs, a web-based maintenance management system
written in Hypertext Markup Language (HTML) and JavaScript is used to link the database.
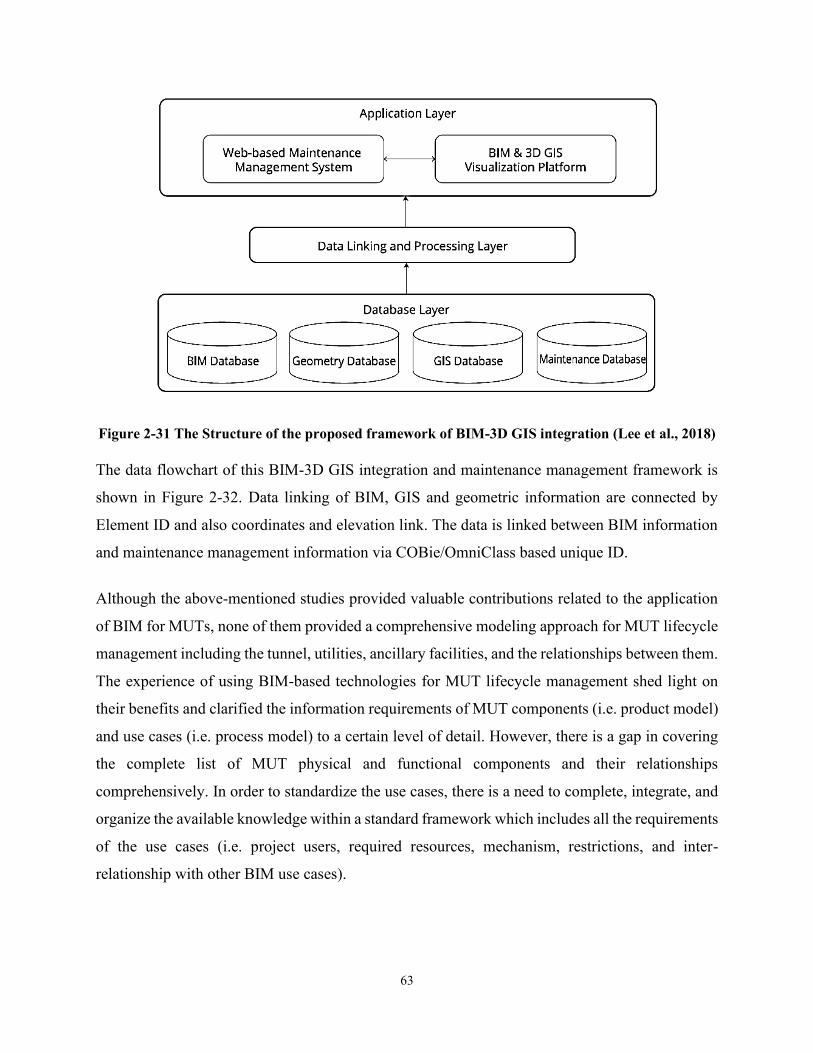
63
Figure 2-31 The Structure of the proposed framework of BIM-3D GIS integration (Lee et al., 2018)
The data flowchart of this BIM-3D GIS integration and maintenance management framework is
shown in Figure 2-32. Data linking of BIM, GIS and geometric information are connected by
Element ID and also coordinates and elevation link. The data is linked between BIM information
and maintenance management information via COBie/OmniClass based unique ID.
Although the above-mentioned studies provided valuable contributions related to the application
of BIM for MUTs, none of them provided a comprehensive modeling approach for MUT lifecycle
management including the tunnel, utilities, ancillary facilities, and the relationships between them.
The experience of using BIM-based technologies for MUT lifecycle management shed light on
their benefits and clarified the information requirements of MUT components (i.e. product model)
and use cases (i.e. process model) to a certain level of detail. However, there is a gap in covering
the complete list of MUT physical and functional components and their relationships
comprehensively. In order to standardize the use cases, there is a need to complete, integrate, and
organize the available knowledge within a standard framework which includes all the requirements
of the use cases (i.e. project users, required resources, mechanism, restrictions, and inter-
relationship with other BIM use cases).
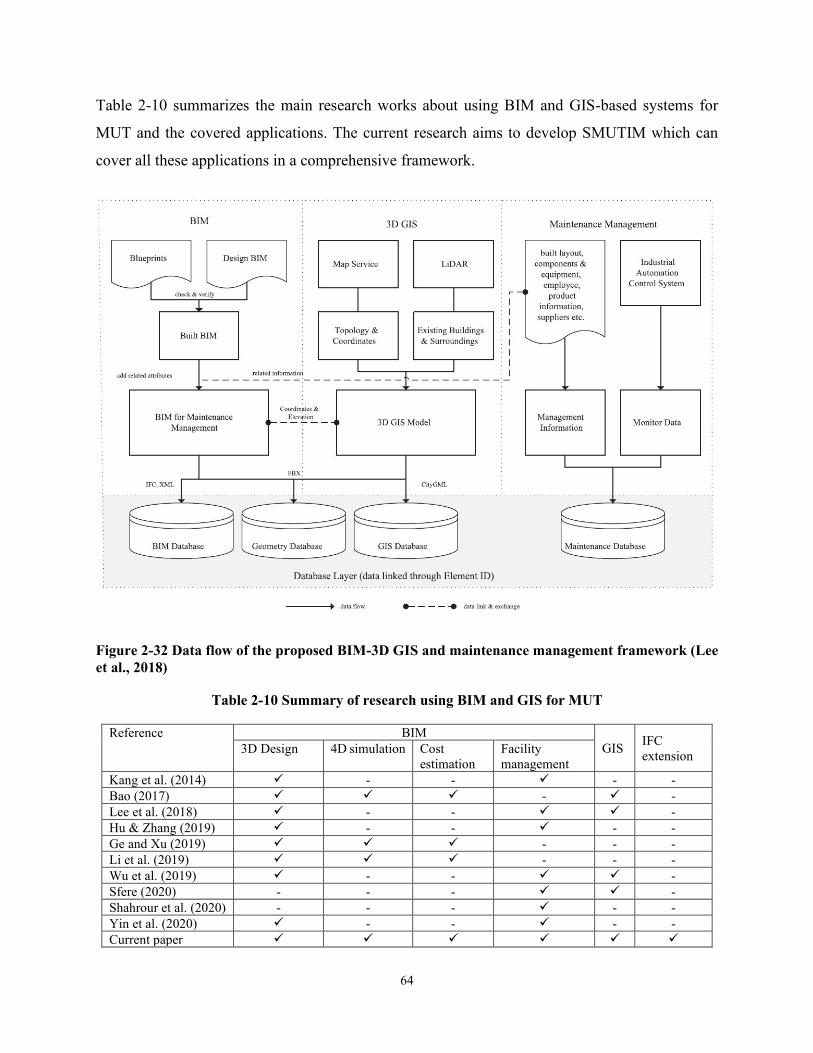
64
Table 2-10 summarizes the main research works about using BIM and GIS-based systems for
MUT and the covered applications. The current research aims to develop SMUTIM which can
cover all these applications in a comprehensive framework.
Figure 2-32 Data flow of the proposed BIM-3D GIS and maintenance management framework (Lee
et al., 2018)
Table 2-10 Summary of research using BIM and GIS for MUT
Reference BIM
GIS IFC
extension 3D Design 4D simulation Cost
estimation
Facility
management
Kang et al. (2014) ✓ - - ✓ - -
Bao (2017) ✓ ✓ ✓ - ✓ -
Lee et al. (2018) ✓ - - ✓ ✓ -
Hu & Zhang (2019) ✓ - - ✓ - -
Ge and Xu (2019) ✓ ✓ ✓ - - -
Li et al. (2019) ✓ ✓ ✓ - - -
Wu et al. (2019) ✓ - - ✓ ✓ -
Sfere (2020) - - - ✓ ✓ -
Shahrour et al. (2020) - - - ✓ - -
Yin et al. (2020) ✓ - - ✓ - -
Current paper ✓ ✓ ✓ ✓ ✓ ✓
65
2.5 Summary and Conclusions
This chapter provided a comprehensive critical review of all the domains of this research with
respect to MUTs. A list of the main related research works with their covered domain(s) is
presented in Table 2-11. A general review of MUTs including classification, construction methods,
benefits, and disadvantages, provides an understanding of the nature, necessity and challenges of
MUTs. With respect to financial feasibility and analysis, different aspects of economy, financing,
and cost-sharing of MUTs were explained in detail. Despite previous researches about economical
assessment of MUT and buried utilities, there is a gap in considering more factors influencing
LCC and the breakeven point. Fairness of cost allocation for MUT projects is a challenging issue
and should be improved based on risk and benefit factors. Afterward, MUT projects and studies
around the world were discussed. Several examples and case studies were reviewed in detail to
provide a general understanding of MUT and different countries. The results showed that based
on the context, the benefits and barriers, physical specifications, cost and financing, and
technology usage of MUTs can change significantly. Technology can be used to maximize the
benefits and minimize MUT disadvantages. One of the new technologies in this field is BIM. Using
BIM combined with other applications (e.g. 3D GIS, databases, sensors, web applications) to
support real-time data of MUT operation, can facilitate design, construction, and operation. This
chapter reviewed BIM extension to CIM. IFC, as a standard data model of buildings with
hierarchal structure, has the capability to be extended to MUTs. The IFC architecture and extension
methods were reviewed. The current use cases of BIM for MUT lifecycle management were
investigated in design, construction, and operation and maintenance phases, and the limitations
and future potential developments were discussed. Although the available BIM software
applications can be used to model information of MUT, they should be extended to MUT. IFC
extension is to accommodate MUT-specific requirements in BIM. There is a gap in covering the
complete list of MUT physical and functional components in a standard way. In order to identify
the use cases attributes, there is a need to integrate, complete, and organize the available knowledge
within a comprehensive framework which includes all the requirements of the use cases (i.e.
project users, required resources, mechanism, restrictions, and inter-relationship with other BIM
use cases).
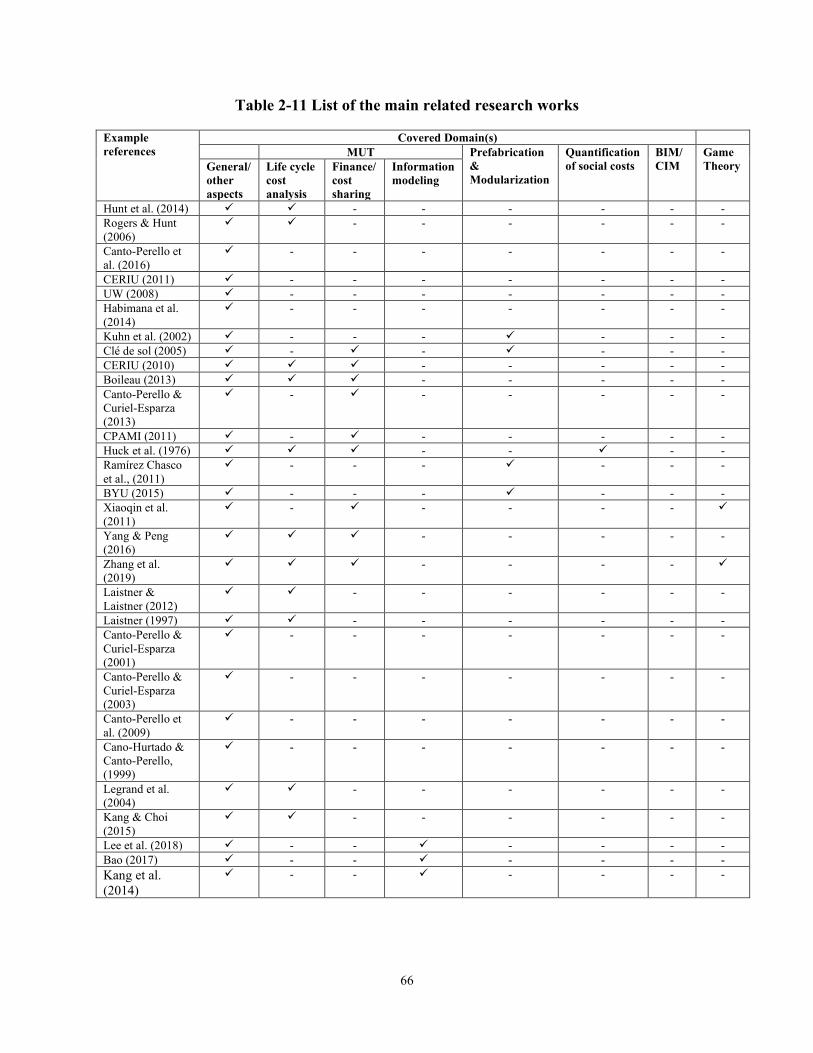
66
Table 2-11 List of the main related research works
Example
references
Covered Domain(s)
MUT Prefabrication
&
Modularization
Quantification
of social costs
BIM/
CIM
Game
Theory General/
other
aspects
Life cycle
cost
analysis
Finance/
cost
sharing
Information
modeling
Hunt et al. (2014) ✓ ✓ - - - - - -
Rogers & Hunt
(2006)
✓ ✓ - - - - - -
Canto-Perello et
al. (2016)
✓ - - - - - - -
CERIU (2011) ✓ - - - - - - -
UW (2008) ✓ - - - - - - -
Habimana et al.
(2014)
✓ - - - - - - -
Kuhn et al. (2002) ✓ - - - ✓ - - -
Clé de sol (2005) ✓ - ✓ - ✓ - - -
CERIU (2010) ✓ ✓ ✓ - - - - -
Boileau (2013) ✓ ✓ ✓ - - - - -
Canto-Perello &
Curiel-Esparza
(2013)
✓ - ✓ - - - - -
CPAMI (2011) ✓ - ✓ - - - - -
Huck et al. (1976) ✓ ✓ ✓ - - ✓ - -
Ramírez Chasco
et al., (2011)
✓ - - - ✓ - - -
BYU (2015) ✓ - - - ✓ - - -
Xiaoqin et al.
(2011)
✓ - ✓ - - - - ✓
Yang & Peng
(2016)
✓ ✓ ✓ - - - - -
Zhang et al.
(2019)
✓ ✓ ✓ - - - - ✓
Laistner &
Laistner (2012)
✓ ✓ - - - - - -
Laistner (1997) ✓ ✓ - - - - - -
Canto-Perello &
Curiel-Esparza
(2001)
✓ - - - - - - -
Canto-Perello &
Curiel-Esparza
(2003)
✓ - - - - - - -
Canto-Perello et
al. (2009)
✓ - - - - - - -
Cano-Hurtado &
Canto-Perello,
(1999)
✓ - - - - - - -
Legrand et al.
(2004)
✓ ✓ - - - - - -
Kang & Choi
(2015)
✓ ✓ - - - - - -
Lee et al. (2018) ✓ - - ✓ - - - -
Bao (2017) ✓ - - ✓ - - - -
Kang et al.
(2014)
✓ - - ✓ - - - -
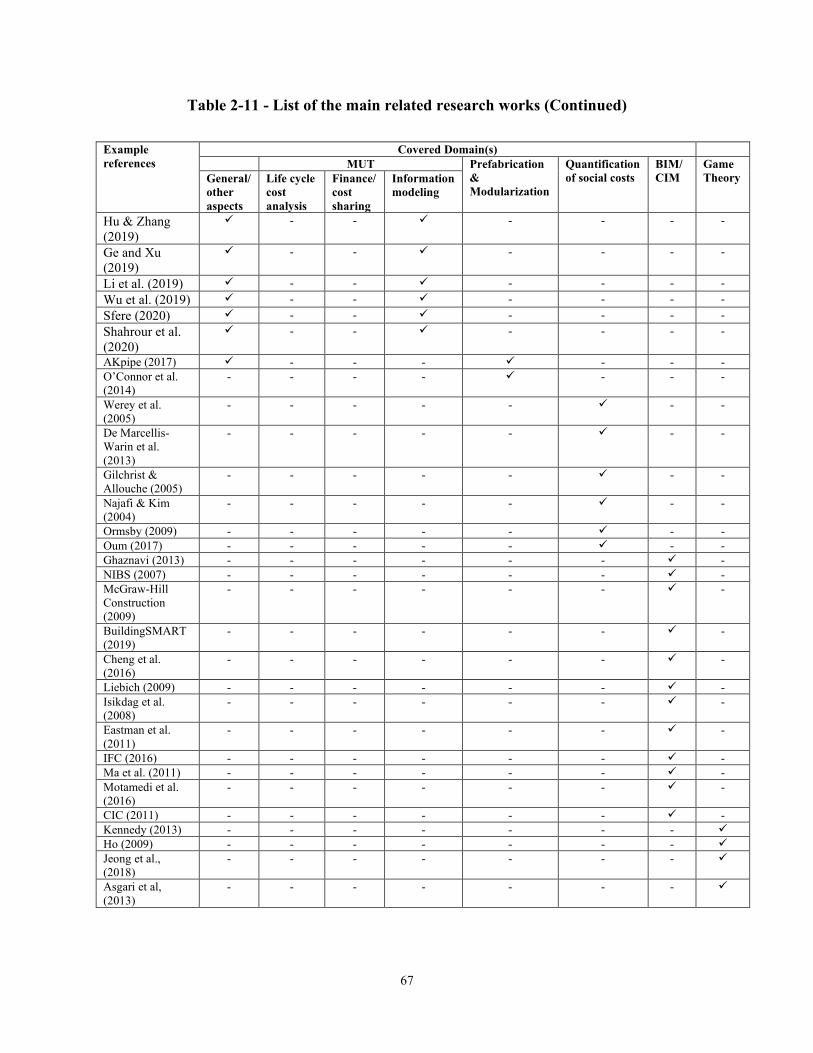
67
Table 2-11 - List of the main related research works (Continued)
Example
references
Covered Domain(s)
MUT Prefabrication
&
Modularization
Quantification
of social costs
BIM/
CIM
Game
Theory General/
other
aspects
Life cycle
cost
analysis
Finance/
cost
sharing
Information
modeling
Hu & Zhang
(2019)
✓ - - ✓ - - - -
Ge and Xu
(2019)
✓ - - ✓ - - - -
Li et al. (2019) ✓ - - ✓ - - - -
Wu et al. (2019) ✓ - - ✓ - - - -
Sfere (2020) ✓ - - ✓ - - - -
Shahrour et al.
(2020)
✓ - - ✓ - - - -
AKpipe (2017) ✓ - - - ✓ - - -
O’Connor et al.
(2014) - - - - ✓ - - -
Werey et al.
(2005) - - - - - ✓ - -
De Marcellis-
Warin et al.
(2013)
- - - - - ✓ - -
Gilchrist &
Allouche (2005) - - - - - ✓ - -
Najafi & Kim
(2004)
- - - - - ✓ - -
Ormsby (2009) - - - - - ✓ - -
Oum (2017) - - - - - ✓ - -
Ghaznavi (2013) - - - - - - ✓ -
NIBS (2007) - - - - - - ✓ -
McGraw-Hill
Construction
(2009)
- - - - - - ✓ -
BuildingSMART
(2019)
- - - - - - ✓ -
Cheng et al.
(2016) - - - - - - ✓ -
Liebich (2009) - - - - - - ✓ -
Isikdag et al.
(2008)
- - - - - - ✓ -
Eastman et al.
(2011)
- - - - - - ✓ -
IFC (2016) - - - - - - ✓ -
Ma et al. (2011) - - - - - - ✓ -
Motamedi et al.
(2016)
- - - - - - ✓ -
CIC (2011) - - - - - - ✓ -
Kennedy (2013) - - - - - - - ✓
Ho (2009) - - - - - - - ✓
Jeong et al.,
(2018)
- - - - - - - ✓
Asgari et al,
(2013)
- - - - - - - ✓
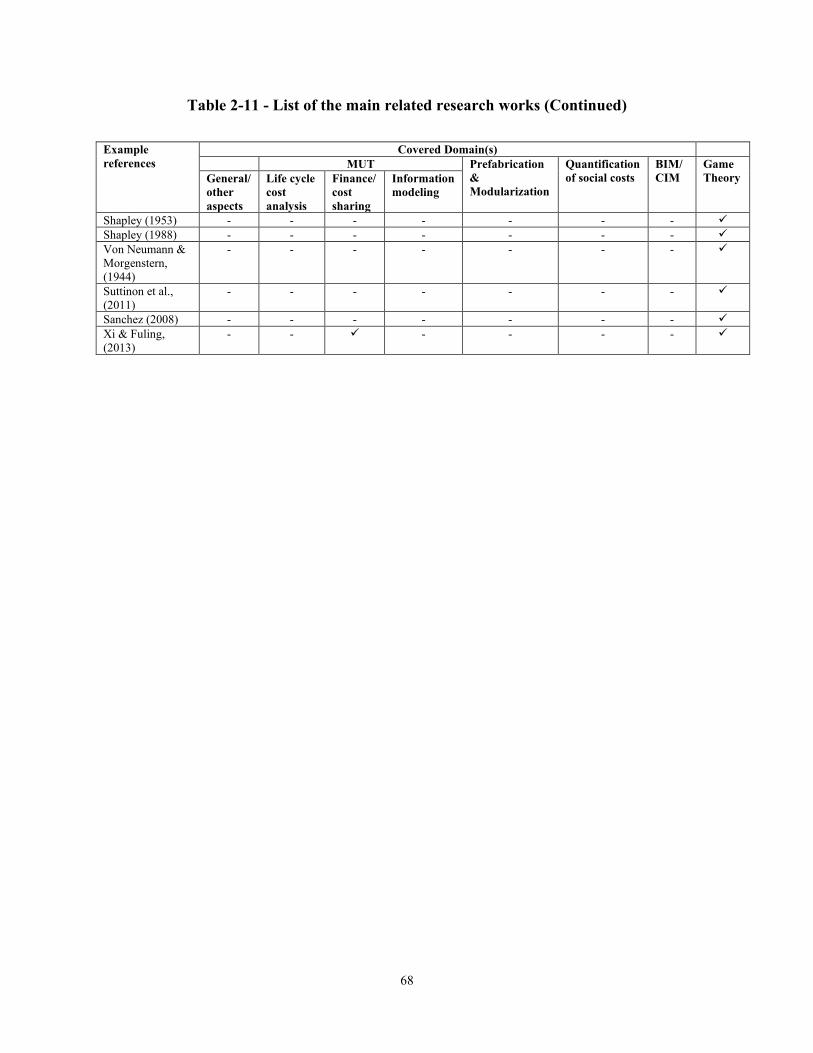
68
Table 2-11 - List of the main related research works (Continued)
Example
references
Covered Domain(s)
MUT Prefabrication
&
Modularization
Quantification
of social costs
BIM/
CIM
Game
Theory General/
other
aspects
Life cycle
cost
analysis
Finance/
cost
sharing
Information
modeling
Shapley (1953) - - - - - - - ✓
Shapley (1988) - - - - - - - ✓
Von Neumann &
Morgenstern,
(1944)
- - - - - - - ✓
Suttinon et al.,
(2011) - - - - - - - ✓
Sanchez (2008) - - - - - - - ✓
Xi & Fuling,
(2013)
- - ✓ - - - - ✓
69
CHAPTER 3. OVERVIEW OF THE RESEARCH APPROACH
3.1 Introduction
As discussed in Section 1.2 and Chapter 2, MUTs are not extensively used because of complicated
(a) lifecycle economical assessment and justification, (b) fair cost-sharing, and (c) coordination of
utility companies. To address these problems and achieve the research objectives mentioned in
Section 1.3, the proposed research approach is developed in three phases:
Phase 1 - MUT lifecycle economy assessment: In this phase, the first objective of this research
about development of a model for LCC assessment of MUT and buried utilities by considering the
influencing factors is achieved. Section 4.2.1 extends this phase in depth.
Phase 2 – Lifecycle cost-sharing of MUT: The second objective of this research regarding
development of a fair model of MUT cost-sharing that considers balancing risks and benefits
among utility companies is achieved in this phase. This phase is elaborated in Section 4.2.2.
Phase 3 – BIM extension to MUT: The third objective of this research about development of a
comprehensive framework of smart MUT information requirements, linking SMUTIM with GIS
and databases, identifying use cases, and extending IFC, is achieved in this phase. Chapter 5 aims
to pusure this objective.
3.2 Overview of the Proposed Approach
Figure 3-1 shows the structure of the proposed research approach in three phases. Each phase is
introduced in this chapter.
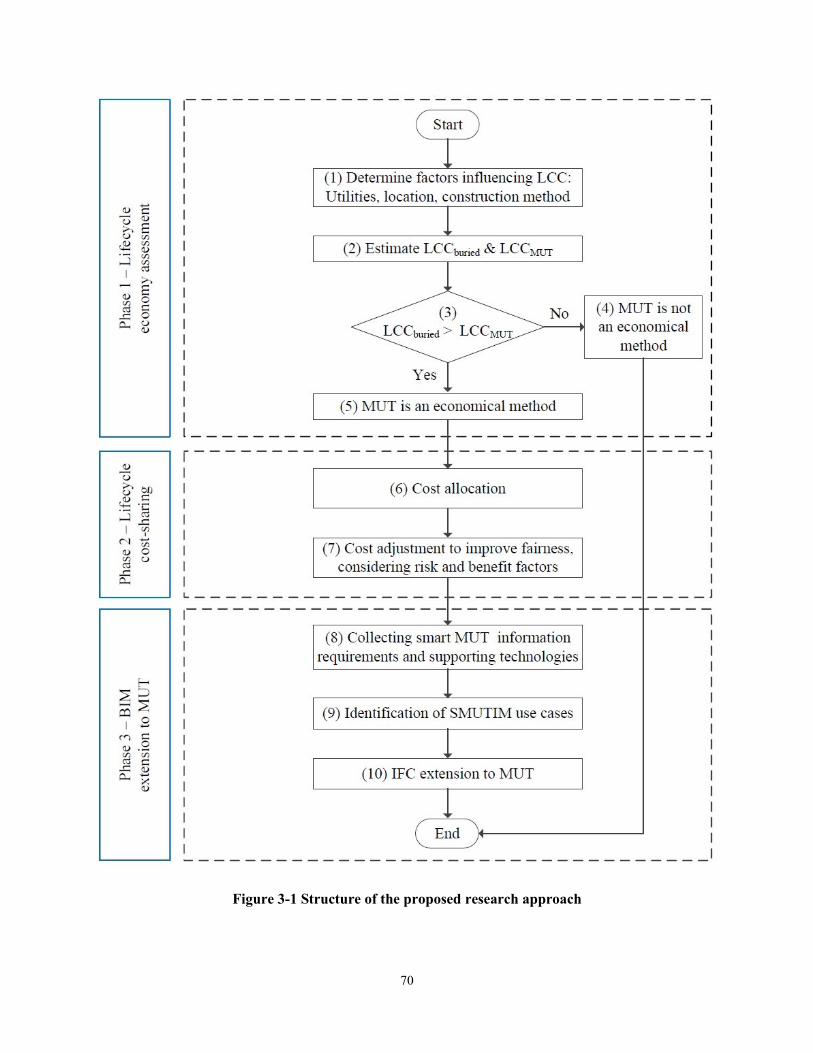
70
Figure 3-1 Structure of the proposed research approach
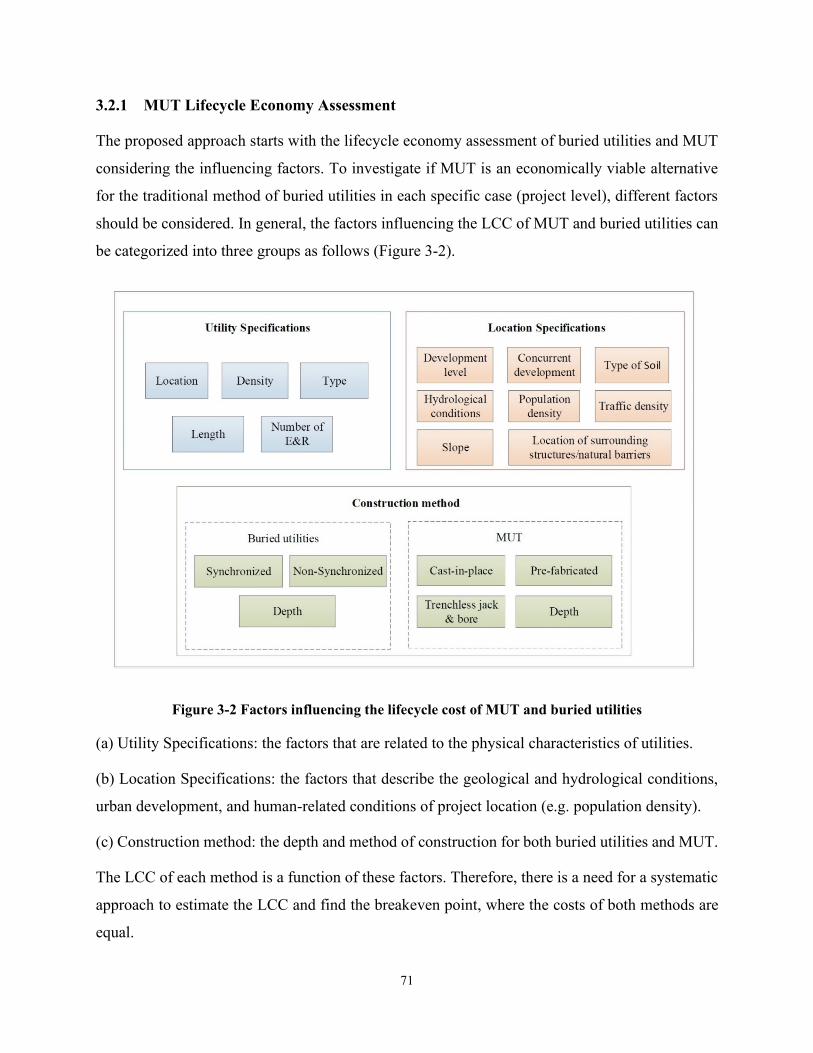
71
3.2.1 MUT Lifecycle Economy Assessment
The proposed approach starts with the lifecycle economy assessment of buried utilities and MUT
considering the influencing factors. To investigate if MUT is an economically viable alternative
for the traditional method of buried utilities in each specific case (project level), different factors
should be considered. In general, the factors influencing the LCC of MUT and buried utilities can
be categorized into three groups as follows (Figure 3-2).
Figure 3-2 Factors influencing the lifecycle cost of MUT and buried utilities
(a) Utility Specifications: the factors that are related to the physical characteristics of utilities.
(b) Location Specifications: the factors that describe the geological and hydrological conditions,
urban development, and human-related conditions of project location (e.g. population density).
(c) Construction method: the depth and method of construction for both buried utilities and MUT.
The LCC of each method is a function of these factors. Therefore, there is a need for a systematic
approach to estimate the LCC and find the breakeven point, where the costs of both methods are
equal.
72
In this phase, the LCC is estimated for both methods. The influence of each factor on LCC can be
different and should be evaluated. MUT is the economic method when the estimated LCC of MUT
is lower than that of the buried utilities. The details of this method are given Section 4.2.1.
3.2.2 Lifecycle Cost-sharing of MUTs
After deciding on an MUT project, the next challenge is financing and cost-sharing of the project
(Canto-Perello & Curiel-Esparza, 2013). MUT should be more economical for each utility
company as well (organization level) and the MUT benefits should be distributed fairly, to
convince utility companies to participate in the MUT project. This research proposes a cost-sharing
approach, and fairness is provided by mathematical methods. As shown in Figure 3-1 the first step
in the cost-sharing of MUT projects is cost allocation. As explained in Section 2.2.4.2, two
methods of MUT cost allocation have been proposed: the PBC method (CPAMI., 2011; Xiaoqin
et al, 2011; Zhang et al., 2019) and the PUVO method (Xiaoqin et al, 2011; Zhang et al., 2019).
This research proposes using the PBC method for the design and construction phases, based on the
logic that the burden of the design and construction costs for each company participating in the
MUT should have the same ratio as in the case of buried utilities. It is also proposed to use the
PUVO method for the operation phase of MUT because the proportion of the occupied volume of
MUT during the operation phase should determine the ratio of usage cost. It is assumed that the
specific costs of each utility company will be paid directly by that company, and only the common
costs of MUT should be shared. Although the proportion of costs in the PBC and PUVO methods
are the main factors for allocation of MUT cost to utility companies, there are other factors to be
considered for cost-sharing to satisfy (a) balance of risk, and (b) benefits: balanced benefit-cost
ratio, and balance in contributed benefit and gained benefit.
(a) Risk Factor. Accommodation of certain utilities together imposes safety risks on the MUT (see
Section 2.2.4.3). For example, the proximity of gas pipes and electrical wires in the MUT increases
the risk of fire. In addition to the insurance cost for safety issues, an extra cost is needed for the
safer design of the MUT and the installation and operation of safety devices (e.g. fire detectors
and sprinklers). A fair cost-sharing method should allocate the costs of risk management to the
utility companies that are responsible for the risks (i.e. proportional allocation of the cost of risk
management and responsibility of risk).
73
(b) Benefit factors:
• Balanced Benefit-Cost Ratio (BCR): As explained in Section 2.1.3, the benefits of MUTs are
obtained during the operation phase. However, utility companies may not benefit from MUT
with the same BCR. Therefore, for the sake of fairness, it is important to calculate the BCR for
each utility company and balance BCR among the utility companies. It means companies that
benefit more should pay more for the MUT and vice versa.
• Balanced contributed and gained benefit: The benefit that each utility company contributes to
the project by participation in MUT and avoiding buried utilities is called contributed benefit
(ConB) and can be determined using Shapley value in cooperative game theory (see Section
2.2.3.2). However, there is no guarantee that the gained benefit (GB) of a company is close to its
contributed benefit. For the sake of fairness, ConB and GB should be balanced, and their
difference should be less than a threshold.
The public entities (e.g. municipality) are usually the main beneficiary of MUT projects because
of their social responsibility and the significant benefits of MUTs for the society. Therefore,
they may consider some incentives for the other utility companies to increase their benefits and
encourage them to participate in MUT projects.
3.2.3 BIM Extension to MUT
This research proposes the development of an integrated BIM and 3D GIS framework of SMUTIM
that includes three main steps: (a) MUT lifecycle information requirements definition, (b)
identification of SMUTIM use cases, and (c) extending IFC to accommodate SMUTIM. The
proposed framework is based on the analysis of the literature review, expert opinions, and the
resources about MUT and utilities information requirements.
3.2.3.1 MUT lifecycle Information Requirements
BIM and other technologies (e.g. GIS, sensors, databases) can support different types of MUT
lifecycle information (i.e. geometric and non-geometric). The information requirements are
categorized into five groups: (a) managerial, (b) surrounding environment, (c) tunnel structure, (d)
utilities, and (e) ancillary facilities. Each information group includes sub-categories as follows.
74
(a) Managerial information: The managerial information sub-categories include economic
assessment, risk management, financing and cost-sharing, ownership and management issues,
permission setting, and employee information.
(b) Surrounding environment information: This information group covers geotechnical
information, hydrological information, the terrain model and above-ground structures, traffic
density, underground structures and buried utilities, and population and buildings
functionality.
(c) Tunnel structure information: This information group is about different parts of a tunnel
structure including tunnel main structure and foundation, foundation pits, and auxiliary
structures (i.e. access, node, lateral tunnel, and waterproofing and drainage structures).
(d) Utilities information: The utilities are categorized into two groups of pipes (i.e. drinking water,
sewer, and gas) and cables (i.e. electrical and telecommunication).
(e) Ancillary facilities information: The continuous operation of the MUT is supported by the
ancillary facilities. These systems include sensory (i.e. structural health monitoring (SHM),
access control and geo-localization, and environmental monitoring systems), HVAC, drainage,
lighting, power supply, security monitoring and alarm, fire extinguishing, hoisting, and
communication systems.
The relationships between the information groups are defined and explained by four categories of
relationship: (1) subsumption, (2) partonomy, and (3) supporting (i.e. monitoring, controlling,
serving).
3.2.3.2 SMUTIM Use Cases
Four main use cases of SMUTIM (i.e. 3D design, 4D construction simulation, cost estimation,
facility management) are identified. To describe a SMUTIM use case, the following attributes
should be specified:
- Project phase: In what phase(s) of the project the use case can be applied?
- Project users: Who are the project stakeholders involved in the use case?
- Required resources: What resources are required to fulfill the use case?
- Mechanism: How the project users use the resources to perform the use case?
- Restrictions: Under which limitations is the SMUTIM use case implemented?
75
- Output: What are the results of the use case?
- Interrelation with other use cases: Is there any other use case output used as an input for this
use case, or vice versa?
A case study is used to demonstrate the applicability of the identified use cases.
3.2.3.3 IFC Extension to MUT
Organizing MUT information requirements is a basis for extending IFC to MUT. For this purpose,
it is needed to develop MVD, to identify the reusable IFC entities, properties, and relationships
and define new ones. This research focuses on the extension of IFC for the physical and spatial
components of MUT and a partial implementation of IFC for MUT. The proposed MVD
categorizes the MUT physical components into three main groups of tunnel structures, utilities,
and ancillary facilities. Each main group includes subcategories.
The new IFC entities for the physical components are presented and some of the reusable entities,
properties, and relationships are explained as examples. Partial implementation of the proposed
SMUTIM IFC extension is presented in a STEP-based platform.
3.3 Summary
This chapter presented the research approach which has three phases: (a) MUT lifecycle economy
assessment, (b) lifecycle cost-sharing of MUT, and (c) BIM extension to MUT. Chapter 4 is
allocated to the phases (a) and (b) and Chapter 5 explains the phase (c). To realize the proposed
methodology, each of the abovementioned phases will be conducted as follows.
(a) MUT lifecycle economy assessment: This phase includes formulating and evaluating of LCC
of buried utilities and MUT by considering the influencing factors: utility specifications, location
specification, and construction method, and finding LCC and the breakeven point.
(b) Lifecycle cost-sharing of MUT: The process of lifecycle cost-sharing includes the selection of
MUT cost allocation method, cost adjustment using risk and benefit factors, and game theory.
(c) BIM extension to MUT: This process includes three main steps: (a) MUT lifecycle information
requirements definition, (b) identification of SMUTIM use cases, and (c) extending IFC to
accommodate SMUTIM.
76
CHAPTER 4. LIFECYCLE COST ASSESSMENT AND COST-SHARING
OF MUT
4.1 Introduction
As explained in Section 2.1.3, although MUTs have numerous benefits, they are not widely used
because of the high initial construction cost, the need for high level of safety and security, and
coordination between utility companies (see Section 2.1.4). As discussed in Section 2.2.1, despite
the high initial investment needed, direct operational and social cost savings can make LCC of
MUTs less than conventional buried utilities. As explained in Section 3.2.1, to investigate if MUT
is an economically viable alternative for the traditional method of buried utilities in a specific
project, different factors should be considered related to the specifications of utilities, the location
of the project, and the construction method. The LCC of each method is a function of these factors.
Therefore, there is a need for a systematic approach to estimate the LCC and find a breakeven
point, where the cost of both methods is equal. MUT is the economic method when the estimated
design and construction costs of MUT is lower than the breakeven point. After deciding on an
MUT project, the next challenge is financing and cost-sharing of the project (Canto-Perello and
Curiel-Esparza, 2013). MUT should be more economical for each utility company compared with
the buried utility option (organization level) and the MUT benefits should be distributed fairly, to
convince utility companies to participate in the MUT project (see Section 3.2.2).
This chapter aims to achieve the first two objectives of this research in Section 1.3. A
comprehensive approach for MUT and buried utilities LCC analysis that considers factors of
utility specifications, location conditions, and construction methods is developed at project level.
The result reveals the conditions that MUT project is an economical method. At the organization
level, this chapter proposes an MUT cost-sharing model to ensure that MUT is the economical
method for the utility companies and that all the utility companies benefit from MUT fairly.
4.2 Proposed Method
The proposed method considers the MUT economy at the project level as well as the cost-sharing
between stakeholders. Figure 4-1 shows the proposed model of economy assessment and cost-
sharing of MUT.
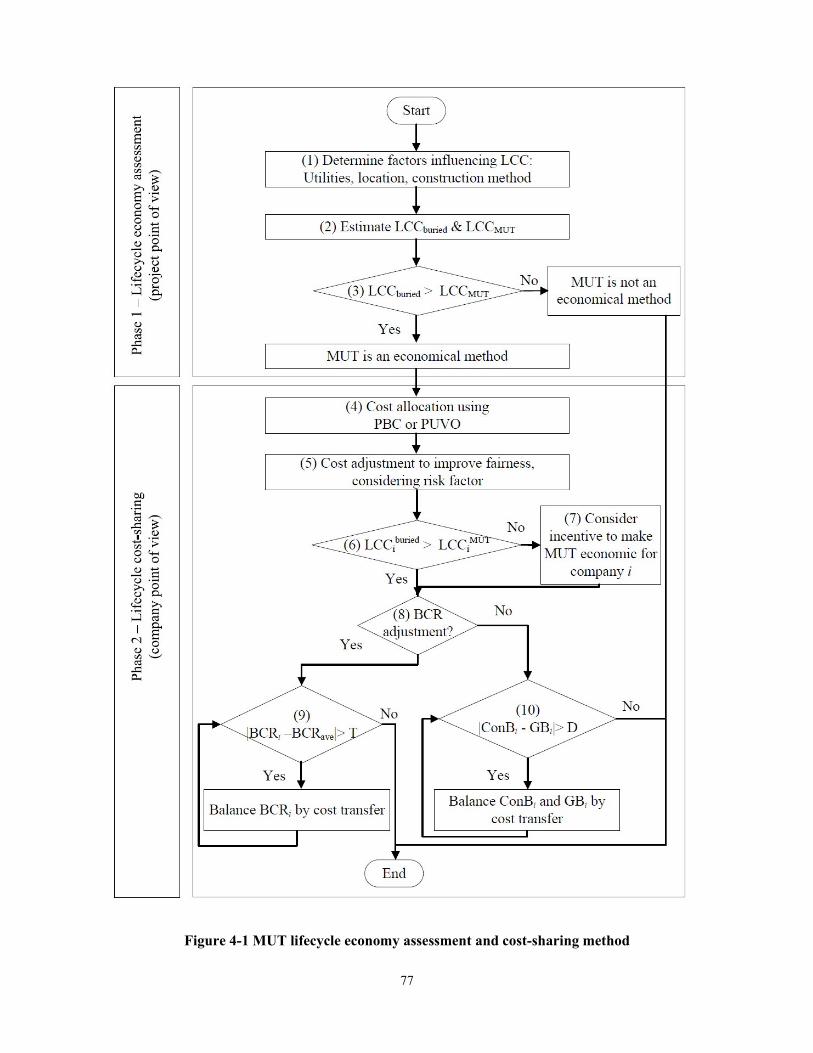
77
Figure 4-1 MUT lifecycle economy assessment and cost-sharing method

78
4.2.1 Phase 1: Lifecycle Economy Assessment of MUTs
In the first phase, lifecycle economy assessment determines if the MUT project is an economical
method or not. This phase has the following steps.
Step 1. The factors that influence the LCC of MUT and buried utilities should be determined.
These factors can be categorized into three groups: (a) utility specifications: the factors that are
related to physical characteristics of utilities, (b) location conditions: the factors that describe the
geological conditions, urban development, and human-related conditions of project location, and
(c) the method of construction and maintenance and relevant attributes for both buried utilities and
MUT. These factors are categorized based on relevance to these groups and linked with MUT or
buried utilities as shown in Table 4-1.
Table 4-1 Factors influencing the lifecycle cost of MUT and buried utilities
Factors Buried utilities MUT
Utility factors Location of utilities ✓ -
Density of utilities ✓ ✓
Type ✓ ✓
Length ✓ ✓
Number of E&R ✓ -
Location factors Development level ✓ ✓
Concurrent development projects ✓ ✓
Type of soil ✓ ✓
Hydrological conditions ✓ ✓
Population density ✓ ✓
Traffic density ✓ ✓
Slope ✓ ✓
Location of surrounding
structures/natural barriers
✓ ✓
Construction/maintenance
factors
Depth ✓ ✓
Synchronization ✓ -
Tunnel building method - ✓
(1) Utility specifications
(a) Location of utilities: The location of existing utilities or planned future buried utilities are
needed to estimate the cost of excavation, installation, and reinstatement.
(b) Density of utilities: The locations with a high number of utilities in a limited space (i.e. high
density of utilities) give the chance of co-located and synchronized construction of buried utilities
79
or their accommodation in the same MUT. Therefore, some construction and maintenance costs
can be shared (e.g. the costs for construction equipment and labor, traffic control, and other social
costs) resulting in a smaller unit cost. However, higher density of utilities can lead to larger
dimensions of the tunnel or MUT compartments that add extra construction cost.
(c) Type: Type of utilities can be defined by specifications, such as diameter, material (Hunt et
al., 2014), and lifespan. Larger diameters are more costly and need a larger volume of excavation,
resulting in higher cost. The cost of utilities is also directly related to the material. Selecting the
utility material depends on many factors, such as the needed protection, technical requirements,
needed capacity, availability of material, etc. The age of existing utilities and life expectancy of
future utilities are critical factors in economic analysis.
(d) Length: This factor represents the relation between the length of utility/MUT with the unit
cost. For each project, there are two types of costs: fixed and variable costs. The fixed costs do not
depend on the size of project, such as overhead costs including insurance, taxes, office rent, office
supplies, accounting, etc. The variable costs depend on the size of project. By increasing the size
of the project, only the variable costs will be added and the fixed costs do not change. Therefore,
the unit cost decreases because of the economy of scale. Utilities/MUTs can vary significantly in
length. Therefore, the size of the project affects the unit cost considerably. Large utilities/MUT
projects are potentially more economical than small ones.
(e) Number of Excavation and Reinstatement (E&R): In order to access buried utilities for
maintenance and repair, excavation and reinstatements (E&Rs) are needed during the lifecycle,
which will increase the lifecycle cost of buried utilities.
(2) Location Conditions
(a) Development level: As explained in Section 2, the costs of buried utilities increase from
undeveloped areas to suburban and urban areas because of the extra costs that urban areas impose
on the projects, such as decommissioning and bypass cost of existing utilities, traffic control,
buying underground space, social costs, etc.
(b) Concurrent development projects: Synchronizing the construction and maintenance of
buried utilities or MUT with other planned underground development projects at the same location
(e.g. metro, shopping centers, pedestrian corridors) can save the costs by sharing the resources.
80
(c) Type of soil: The type of soil influences directly the cost. For example, excavation of hard
rocks can be more expensive than clay. Also, the stabilization of weak soils (e.g. clay) imposes
extra costs.
(d) Hydrological conditions: Underground water or the existence of rivers and lakes in the route
of utilities or MUT can add extra costs. Examples of extra cost can be for dewatering of
construction site, waterproofing of utilities/MUT, deviation of utilities/MUT route to avoid water,
utility towers/bridge over the water, etc.
(e) Population density: Population of an area can impact the LCC of MUT and buried utilities. In
city areas with high-rise buildings, a single branching secondary MUT can provide utilities to more
users than in suburban areas. Therefore, the cost per user will be reduced. MUT reduces the social
costs by decreasing repeated excavations to access buried utilities during the lifecycle. Therefore,
in high population density areas, MUT can be more beneficial from the social cost point of view.
(f) Traffic density: For the utility companies, the cost of traffic control and detour roads adds
extra costs to construction and maintenance of buried utilities, especially in areas with high traffic
density. Also, the added travel time because of traffic congestion and/or longer travel distance in
detour roads imposes extra costs to the passengers (social costs).
(g) Slope: Land slope can impose or save the cost of buried utilities and MUTs. Lack of slope can
be costly when there is a need for slope (e.g. gravity sewer). Therefore, to provide the needed
slope, the excavation and installation will be deeper gradually, which adds to the cost. In cases that
there is more than needed slope, special design and construction technics (e.g. soil filling and
vertical/slopped MUT) may be required to address the issues.
(h) Locations of surrounding structures/natural barriers: The existing surrounding structures
(e.g. metro) or natural barriers (e.g. rivers) can impose costly restrictions on the location of future
buried utilities/MUT. To overcome the restrictions, deep excavation and protective structures can
be considered, which imposes an extra cost. However, deep excavation may save some costs by
avoiding existing utilities using trenchless methods.
(3) Construction/maintenance methods
(a) Depth: The depth of buried utilities or MUT affects the cost. Deeper excavation is more
expensive usually, unless in special situations.
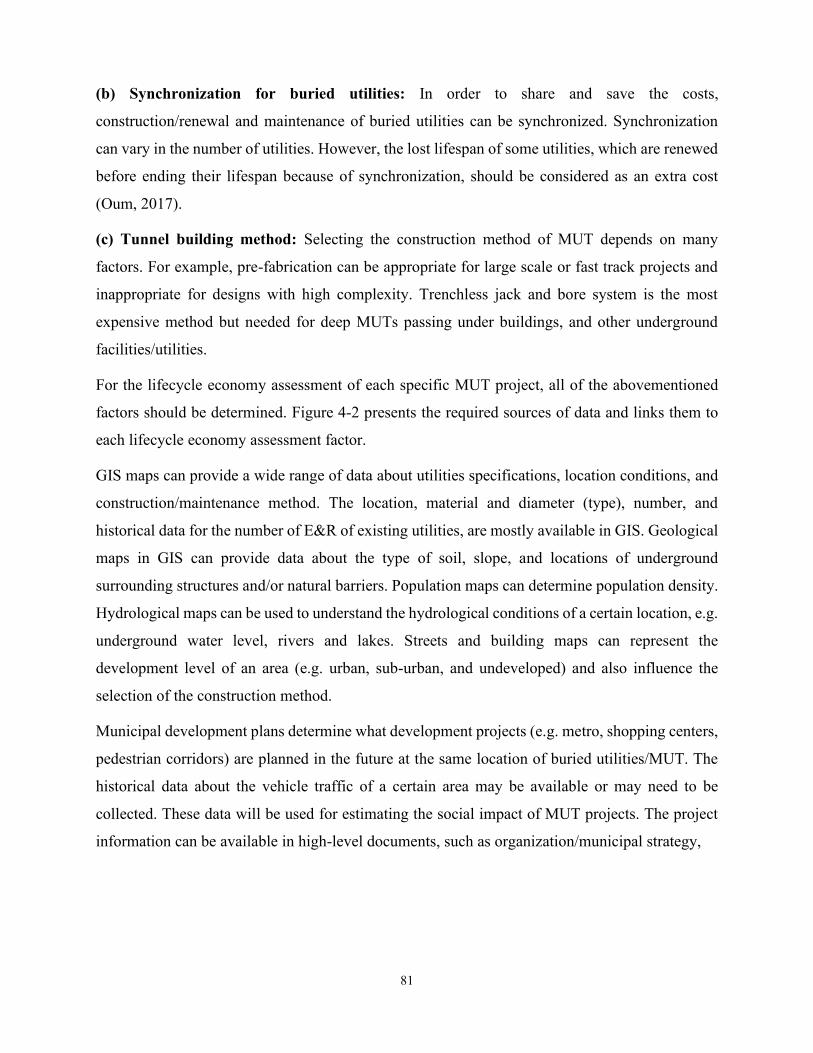
81
(b) Synchronization for buried utilities: In order to share and save the costs,
construction/renewal and maintenance of buried utilities can be synchronized. Synchronization
can vary in the number of utilities. However, the lost lifespan of some utilities, which are renewed
before ending their lifespan because of synchronization, should be considered as an extra cost
(Oum, 2017).
(c) Tunnel building method: Selecting the construction method of MUT depends on many
factors. For example, pre-fabrication can be appropriate for large scale or fast track projects and
inappropriate for designs with high complexity. Trenchless jack and bore system is the most
expensive method but needed for deep MUTs passing under buildings, and other underground
facilities/utilities.
For the lifecycle economy assessment of each specific MUT project, all of the abovementioned
factors should be determined. Figure 4-2 presents the required sources of data and links them to
each lifecycle economy assessment factor.
GIS maps can provide a wide range of data about utilities specifications, location conditions, and
construction/maintenance method. The location, material and diameter (type), number, and
historical data for the number of E&R of existing utilities, are mostly available in GIS. Geological
maps in GIS can provide data about the type of soil, slope, and locations of underground
surrounding structures and/or natural barriers. Population maps can determine population density.
Hydrological maps can be used to understand the hydrological conditions of a certain location, e.g.
underground water level, rivers and lakes. Streets and building maps can represent the
development level of an area (e.g. urban, sub-urban, and undeveloped) and also influence the
selection of the construction method.
Municipal development plans determine what development projects (e.g. metro, shopping centers,
pedestrian corridors) are planned in the future at the same location of buried utilities/MUT. The
historical data about the vehicle traffic of a certain area may be available or may need to be
collected. These data will be used for estimating the social impact of MUT projects. The project
information can be available in high-level documents, such as organization/municipal strategy,
82
InputSources of data
GISExisting utilities maps (1, 3)
Geological maps (2.3, 2.7, 2.8)
Population maps (2.5)
Hydrological maps (2.4, 3)
Streets and buildings maps (2.1, 3)
(1) Utility specification
(1.1) Type
(1.3) Number
(1.2) Length
(1.4) Number of E&R
(2) Location specification
(2.1) Development level(2.2) Development projects
Municipal development plans
(2.2)
(2.4) Hydrological conditions
Factors
(4) LCC estimates
(2.5) Population density
(2.3) Type of Soil
(2.6) Traffic
Traffic historical data (2.6)
(3) Construction specification
RS Means (4)
(3.1) Synchronization for buried utilities (3.2) Tunnel building method
(3.1.1) Synchronized
(3.1.2) Non-Synchronized
(3.2.1) Cast-in-place
(3.2.2) Pre-fabricated
(3.2.3) Trenchless jack & bore
(4.1) Lifecycle construction and
renewal cost of buried utilities
(4.2) Lifecycle maintenance cost
of buried utilities
(4.4) Lifecycle maintenance cost
of MUT
Contractors quotes (4)
Suppliers quotes (4)
Discount rate (4)
Output
Project information
Scope, time, and cost limitations (3)
(2.7) Slope
Expert judgement (4)
(4.3) Design and construction of
MUT
MUT construction cost at
breakeven point
Lifecycle economy assessment of
MUT and buried utilities
(1.5) Coordinates of utilities
(2.8) Coordinates of surrounding structures/natural barriers
Figure 4-2 Data requirements of the proposed MUT lifecycle economy assessment model
organization budget, project charter, etc. These documents reflect any limitation for the budget,
schedule, and scope of a buried utilities/MUT project and influence the construction specification.
As a reference and standard of construction cost data, RS Means is used by construction
professionals for creating budgets, project cost estimation, validating with internal cost data, and
planning for facilities maintenance (RSMeans, 2019). This source of data is very useful for LCC
estimation of buried utilities and MUT. Price quotations can be requested from qualified
contractors for the construction and maintenance services that they provide. Also, price quotations
from the material, labor, and equipment suppliers can be useful for LCC estimation. For the unique
and/or complicated cases that cost estimation cannot be accurate by cost databases and quotations,
expert judgment can be beneficial. By providing the required data sources to the experts, they can
83
consider the complexity of the situation and use similar past cases (if available) to judge for cost
estimation. The discount rate is dependent on the economic conditions and is used to calculate the
Future Value (FV) and Present Value (PV).
Step 2. The Lifecycle costs of buried utilities (LCCburied) and MUT (LCCMUT) should be estimated.
LCC is the total cost of design, construction, and maintenance during the lifespan of MUT or the
utilities. Although the social cost is not borne by the utility companies, it can be added to LCC
since public entities (e.g. municipalities) are responsible for social costs. To evaluate the lifecycle
economy of MUT versus buried utilities, the LCC of each method, must be estimated. The Present
Value (PV) of LCC of buried utilities (LCCburied) can be calculated by the total PV of design,
construction, and operational (maintenance and repair) costs of all utilities as shown in Equation
(4-1):
𝐿𝐶𝐶𝑏𝑢𝑟𝑖𝑒𝑑 = 𝑑𝑒𝑠𝑖𝑔𝑛 & 𝑐𝑜𝑛𝑠𝑡𝑟𝑢𝑐𝑡𝑖𝑜𝑛 𝑐𝑜𝑠𝑡 (𝐶𝐵𝑇𝑜𝑡𝑎𝑙) + 𝑜𝑝𝑒𝑟𝑎𝑡𝑖𝑜𝑛 𝑐𝑜𝑠𝑡 (𝑂𝐶𝐵𝑇𝑜𝑡𝑎𝑙)
= ∑ ∑ ∑(𝐶𝐵𝑖𝑗
𝑡 + 𝑆𝑐𝑖𝑗𝑡 )
(1 + 𝑟)𝑡
𝑘
𝑡=1
𝑚
𝑗=1
𝑛
𝑖=1
+ ∑ ∑ ∑(𝑂𝐶𝐵𝑖𝑗
𝑡 + 𝑆𝑚𝑖𝑗𝑡 )
(1 + 𝑟)𝑡
𝑘
𝑡=1
𝑚
𝑗=1
𝑛
𝑖=1
(4-1)
The Present Value (PV) of LCC of MUT (LCCMUT) can be similarly calculated by the total PV of
design and construction cost (CMTotal), and operational (maintenance and repair) costs of MUT
(OCMTotal) as presented in Equation (4-2):
𝐿𝐶𝐶𝑀𝑈𝑇 = 𝑑𝑒𝑠𝑖𝑔𝑛 and 𝑐𝑜𝑛𝑠𝑡𝑟𝑢𝑐𝑡𝑖𝑜𝑛 𝑐𝑜𝑠𝑡 (𝐶𝑀𝑇𝑜𝑡𝑎𝑙) + 𝑜𝑝𝑒𝑟𝑎𝑡𝑖𝑜𝑛 𝑐𝑜𝑠𝑡 (𝑂𝐶𝑀𝑇𝑜𝑡𝑎𝑙)
= 𝐶𝑀𝑇𝑜𝑡𝑎𝑙 + ∑𝑂𝐶𝑀𝑀𝑈𝑇
𝑡
(1 + 𝑟)𝑡
𝑘
𝑡=1
(4-2)
For LCCburied, the social costs (e.g. traffic delay cost) are added because of the need for excavation
and road closure and/or detours. The variables included in Equations (4-1) and (4-2) are described
as follows.
i: utility type
n: total number of utility types
j: specific segment of the same utility type
m: total number of segments of the same utility type
t: year
84
𝐶𝐵𝑖𝑗𝑡 : design, construction, and renewal costs of buried utility type i, specific pipe/cable j at year
t.
𝑆𝑐𝑖𝑗𝑡 : Social Cost for construction/renewal of buried utility type i, specific pipe/cable j at year t.
r: discount rate
𝐶𝑀𝑇𝑜𝑡𝑎𝑙: design and construction costs of MUT.
𝑂𝐶𝐵𝑖𝑗𝑡 : operation (maintenance and repair) cost of buried utility type i, specific pipe/cable j at year
t
𝑆𝑚𝑖𝑗𝑡 : Social cost for maintenance and repair of buried utility type i, specific pipe/cable j at year t
k: MUT lifecycle in years
𝑂𝐶𝑀𝑀𝑈𝑇𝑡 : Maintenance and repair cost of MUT at year t
It should be considered that many factors related to utility, location and construction method
influence the estimation of LCC in Equations (4-1) and (4-2) (Oum, 2017).
Step 3. To determine if MUT is an economical alternative for buried utilities, LCCMUT must be
less than LCCburied. Another form of economical evaluation is calculating the payback period of
MUT and comparing the CMTotal at breakeven point (LCCburied = LCCMUT) with the estimated
CMTotal. Since the high initial construction cost of MUT is usually the main barrier, it is important
to calculate the payback period. In this step, a comparison between LCCburied and LCCMUT is used
to determine the economic feasibility of MUT projects. If LCCburied is more than LCCMUT, then
MUT is an economical method from the project point of view. The further calculation is needed
to share MUT cost (steps 4 and 5), make sure MUT is economic for all utility companies (steps 6
and 7), and finally balance benefits (steps 8 to 10). If LCCburied is less than LCCMUT, then the MUT
project is not justified economically and may be ignored. In some cases, other considerations, such
as political, legal, environmental, and limited underground space, may justify MUT projects.
4.2.2 Phase 2: Lifecycle Cost-sharing of MUTs
Step 4. As explained in Section 2.2.4.2, there are two methods for MUT cost allocation: the PBC
method (CPAMI., 2011; Xiaoqin et al, 2011; Zhang et al., 2019) and the PUVO method (Xiaoqin
et al, 2011; Zhang et al., 2019). This research proposes using the PBC method for the design and
construction phases, based on the logic that the burden of the design and construction costs for
each company participating in the MUT should be the same ratio, as in the case of buried utilities.
85
It is assumed that the specific costs of each utility company (e.g. costs of materials, installation of
the utilities inside the MUT, maintenance of utilities, etc.) will be paid directly by each utility
company. Only the common costs of MUT, including building and maintenance of the tunnel and
shared services, will be shared between utility companies. The design and construction cost part
of the MUT for utility company i (CMi) based on the PBC method can be calculated by Equation
(4-3).
𝐶𝑀𝑖 = 𝐶𝐼𝑀𝑖 +𝐶𝐵𝑖
∑ 𝐶𝐵𝑖𝑛𝑖=1
× 𝐶𝑀𝑇𝑜𝑡𝑎𝑙 𝑠ℎ𝑎𝑟𝑒𝑑 (4-3)
where CIMi is the specific cost of installation of company i in MUT, CMTotal shared represents the
total shared design and construction cost of MUT tunnel structure and equipment, and CBi
indicates the design and construction cost of utility company i in the buried method. It is also
proposed to use the PUVO method for the operation phase of MUT, because the proportion of the
occupied volume of MUT during the operation phase should determine the ratio of usage cost. The
total operational cost part of the MUT for utility company i (OCMi) based on the PUVO method
can be calculated by Equation (4-4):
𝑂𝐶𝑀𝑖 = 𝑆𝑂𝐶𝑀𝑖 +𝑂𝑉𝑖
∑ 𝑂𝑉𝑖𝑛𝑖=1
× 𝑂𝐶𝑀𝑇𝑜𝑡𝑎𝑙 𝑠ℎ𝑎𝑟𝑒𝑑 (4-4)
where SOCMi is the specific operational cost of company i, which excludes the MUT shared
operational cost, OCMTotal shared indicates the total shared operational cost of MUT, and OVi is
the occupied volume of utility company i in the MUT. The lifecycle cost of MUT for company i
(𝐿𝐶𝐶𝑖𝑀𝑈𝑇) is the sum of costs of design and construction phase, and the operation phase, as shown
in Equation (4-5).
𝐿𝐶𝐶𝑖𝑀𝑈𝑇 = 𝐶𝑀𝑖 + 𝑂𝐶𝑀𝑖 (4-5)
Step 5. The proximity of some utilities (e.g. gas and electricity) increases safety risks inside the
MUT. It is necessary to distribute the cost of risk management among the utility companies fairly.
For this purpose, the total cost for the management of risk k in phase p (CRkp) should be
redistributed among utility companies using the risk indicator of company i (γi) such that ∑ 𝛾𝑖𝑛𝑖=1 =
86
1. The cost of management of risk k for utility company i in phase p of the project (CRikp) can be
calculated using Equation (4-6) (see Table 2-3):
𝐶𝑅𝑖𝑘𝑝 = 𝛾𝑖 𝐶𝑅𝑘𝑝 (4-6)
Step 6. After risk adjustment, it is necessary to verify that MUT is an economical method for each
individual utility company. MUT is economical for company i if the lifecycle cost of buried
utilities for company i (𝐿𝐶𝐶𝑖𝑏𝑢𝑟𝑖𝑒𝑑) is greater than the lifecycle cost of MUT for company i
(𝐿𝐶𝐶𝑖𝑀𝑈𝑇). Otherwise, the utility company i may refuse to participate in the MUT project due to
lack of economic benefit. In case MUT is not economical for a utility company, the management
of project should grant incentives to make MUT beneficial (step 7).
Step 7. Incentives can make MUT beneficial for the utility company i. Incentives can be in
different forms, such as tax exemption, subsidy, etc. and usually is granted from the municipality,
which is the main beneficiary of MUT.
Step 8. After making sure all the MUT participants gain benefit from the MUT project, the gained
benefit must be distributed fairly among utility companies. The project needs to choose one of the
two logics for fairness of gained benefit distribution in this step:
(a) balanced Benefit-Cost Ratio (BCR) is selected if there is no need to encourage any utility
company to participate in MUT, then the logic that higher cost (𝐿𝐶𝐶𝑖𝑀𝑈𝑇) should result in
higher benefit for each company is followed (steps 9).
(b) balanced contributed and gained benefit is selected to encourage a utility company, which
has a high contribution, but a low benefit, to participate in MUT (steps 10).
Step 9. This step ensures that the utility companies have a balanced BCRi. The gained lifecycle
benefit of a company (GBi) by participating in an MUT project can be calculated using the
estimated difference of LCC of buried utilities and MUT plus any possible incentive for company
i (INCi) (Equation (4-7)). GBi must be positive to make MUT economical for company i.
𝐺𝐵𝑖 = 𝐿𝐶𝐶𝑖𝑏𝑢𝑟𝑖𝑒𝑑 − 𝐿𝐶𝐶𝑖
𝑀𝑈𝑇 + 𝐼𝑁𝐶𝑖 (4-7)

87
The MUT benefit-cost ratio for utility company i (BCRi) is calculated by dividing GBi by 𝐿𝐶𝐶𝑖𝑀𝑈𝑇
after risk adjustments using Equation (4-8).
𝐵𝐶𝑅𝑖 =𝐺𝐵𝑖
𝐿𝐶𝐶𝑖𝑀𝑈𝑇 (4-8)
To ensure a balanced BCRi, the variance of BCRi from the average MUT benefit-cost ratio (BCRave)
has to be less or equal to an agreed-upon threshold T (Equation (4-9)).
|𝐵𝐶𝑅𝑖 − 𝐵𝐶𝑅𝑎𝑣𝑒| ≤ 𝑇 (4-9)
In case this condition cannot be satisfied, there are two scenarios as shown in Figure 4-3:
(a) Scenario 1
(b) Scenario 2
Figure 4-3 BCR Balancing based on the threshold T and cost transfer
Scenario (1): for companies with BCRi < BCRave – T, a portion of the cost (CTi to j) of the company
with the lowest BCRi is transferred to the company with the highest BCRj in order to satisfy
Equation (4-9).
CTi to j can be calculated by Equation (4-10). This process can be iterative and for all other
companies until Equation (4-9) is satisfied.
𝐶𝑇𝑖 𝑡𝑜 𝑗 = 𝐿𝐶𝐶𝑖𝑀𝑈𝑇 −
𝐺𝐵𝑖
𝐵𝐶𝑅𝑎𝑣𝑒 − 𝑇 (4-10)
88
The scenario (2) applies to companies that satisfy the condition BCRi > BCRave + T. A portion of
the cost of the company with the lowest BCRj (CTj to i) is transferred to the company with the
highest BCRi to satisfy Equation (4-9). The amount of CTj to i can be calculated using Equation (4-
11). This process can be iterative and applied to all other companies until Equation (4-9) is
satisfied.
𝐶𝑇𝑗 𝑡𝑜 𝑖 =𝐺𝐵𝑖
𝐵𝐶𝑅𝑎𝑣𝑒 + 𝑇− 𝐿𝐶𝐶𝑖
𝑀𝑈𝑇 (4-11)
If both scenarios appear at the same time, the company with a larger variance of BCRi from BCRave
will transfer the cost first. If the variance is equal in both scenarios, scenario (1) will be used.
CTi to j or CTj to i is deducted from 𝐿𝐶𝐶𝑀𝑈𝑇𝑖 during lifecycle of MUT.
Step 10. The benefit that each utility company i contributes to the project by participation in MUT
and avoiding buried utilities, is called contributed benefit of company i (ConBi) and can be
determined using Shapley value in cooperative game theory. However, there is no guarantee that
the gained benefit of a company (GBi) is close to its contributed benefit. For the sake of fairness,
the difference of the contributed and gained benefits should be less than a threshold D (Equation
(4-12)).
|𝐶𝑜𝑛𝐵𝑖 − 𝐺𝐵𝑖| ≤ 𝐷 (4-12)
If the difference is more than the threshold D, defined by the project organization, the contributed
and gained benefits should be balanced by transferring a part of the cost. The amount of cost
transfer equals to the exceeding amount from threshold D. The amount of cost transfer 𝐶𝑖 𝑡𝑜 𝑗𝑇 equals
to the exceeding amount of benefit difference from threshold D and can be calculated by Equation
(4-13). Cost transfer is from the company with the highest (ConBi – GBi) to the lowest (ConBj –
GBj). This process can be iterative and applied to all other companies until Equation (4-12) is
satisfied, similar to BCR adjustment.
𝐶𝑖 𝑡𝑜 𝑗𝑇 = |𝐶𝑜𝑛𝐵𝑖 − 𝐺𝐵𝑖| − 𝐷 (4-13)
Either an MUT project chooses BCR balancing method or benefit balancing method, the amount
of cost transfer should respect the MUT being economic for each utility company.

89
4.3 Case Study
The case study is considering MUT lifecycle economy assessment and cost-sharing for a segment
of Ottawa Street (between Peel Street and De Montagne Street) in Montreal with the length of 250
m. The proposed method is implemented as follows.
4.3.1 Phase 1: Lifecycle Economy Assessment
Step 1. LCC influencing factors: the factors are categorized in three groups of utility, location,
and construction method and must be determined for the specific location of the project. Figure
4-4 shows the GIS map of Ottawa Street with the buried utilities in ArcGIS. Table 4-2 shows the
gathered data about this case study. Some data were not available, such as the attributes of
telecommunication cables.
Figure 4-4 Buried utilities in Ottawa Street in ArcGIS
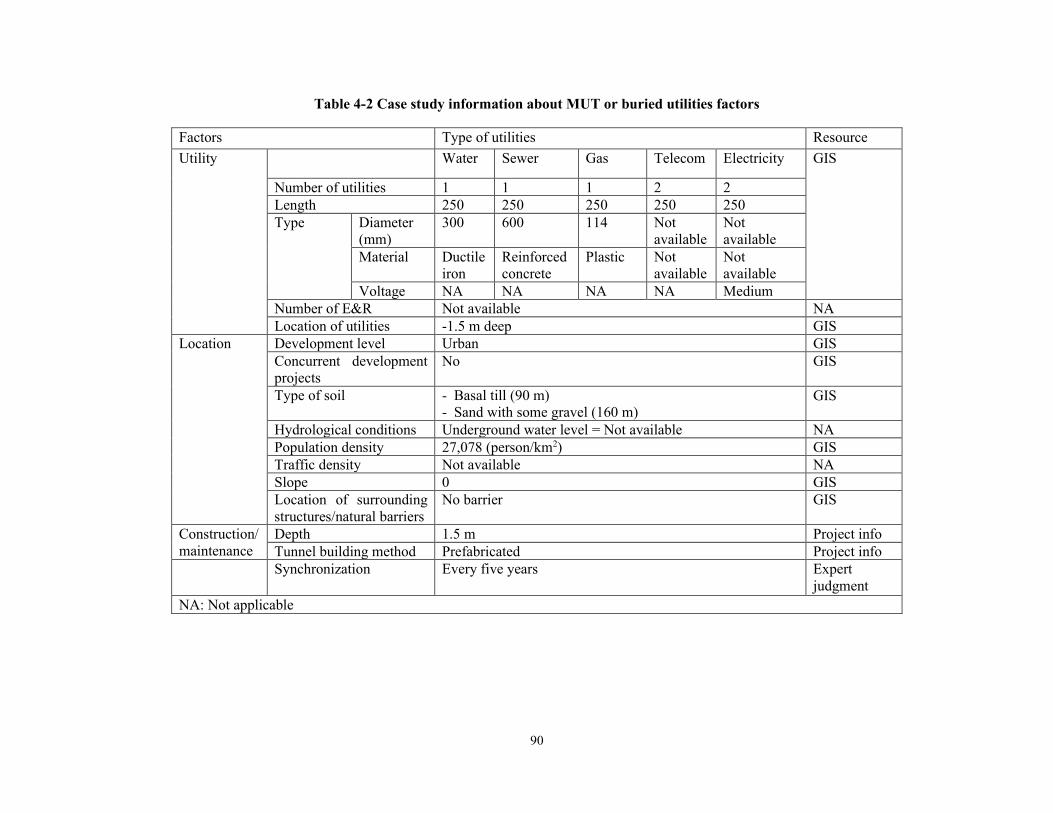
90
Table 4-2 Case study information about MUT or buried utilities factors
Factors Type of utilities Resource
Utility Water Sewer Gas Telecom Electricity GIS
Number of utilities 1 1 1 2 2
Length 250 250 250 250 250
Type Diameter
(mm)
300 600 114 Not
available
Not
available
Material Ductile
iron
Reinforced
concrete
Plastic Not
available
Not
available
Voltage NA NA NA NA Medium
Number of E&R Not available NA
Location of utilities -1.5 m deep GIS
Location Development level Urban GIS
Concurrent development
projects
No GIS
Type of soil - Basal till (90 m)
- Sand with some gravel (160 m) GIS
Hydrological conditions Underground water level = Not available NA
Population density 27,078 (person/km2) GIS
Traffic density Not available NA
Slope 0 GIS
Location of surrounding
structures/natural barriers
No barrier GIS
Construction/
maintenance
Depth 1.5 m Project info
Tunnel building method Prefabricated Project info
Synchronization Every five years Expert
judgment
NA: Not applicable
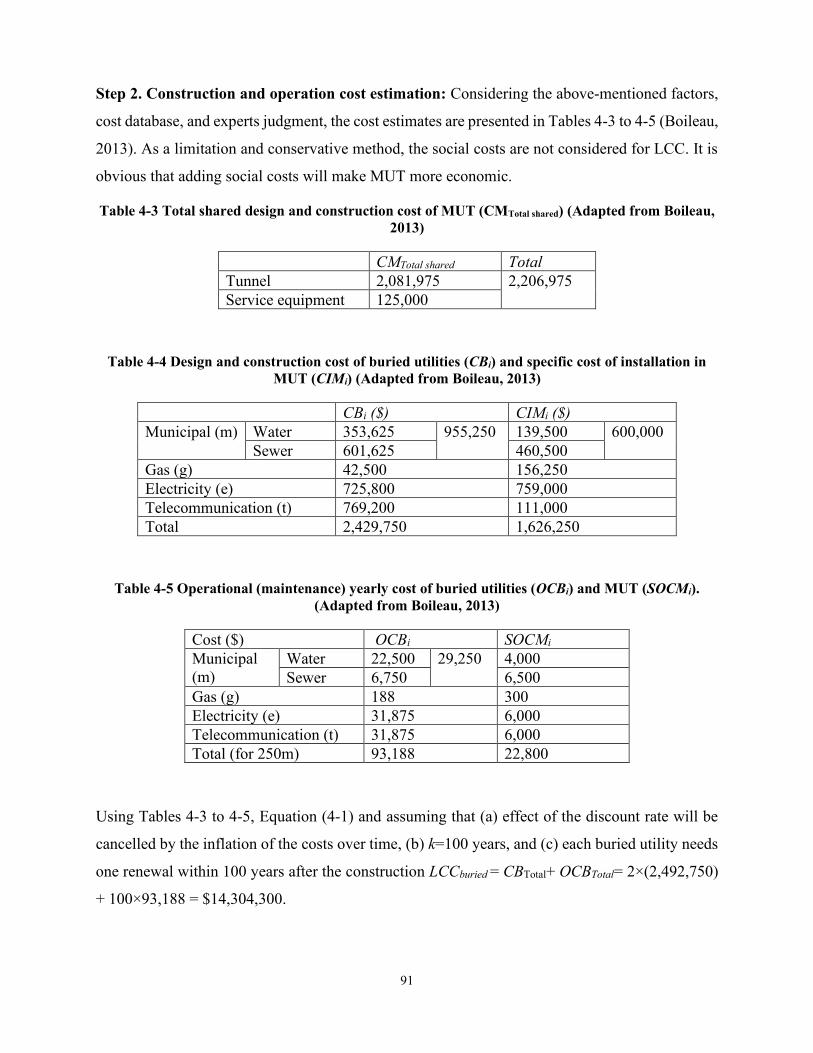
91
Step 2. Construction and operation cost estimation: Considering the above-mentioned factors,
cost database, and experts judgment, the cost estimates are presented in Tables 4-3 to 4-5 (Boileau,
2013). As a limitation and conservative method, the social costs are not considered for LCC. It is
obvious that adding social costs will make MUT more economic.
Table 4-3 Total shared design and construction cost of MUT (CMTotal shared) (Adapted from Boileau,
2013)
CMTotal shared Total
Tunnel 2,081,975 2,206,975
Service equipment 125,000
Table 4-4 Design and construction cost of buried utilities (CBi) and specific cost of installation in
MUT (CIMi) (Adapted from Boileau, 2013)
CBi ($) CIMi ($)
Municipal (m) Water 353,625 955,250 139,500 600,000
Sewer 601,625 460,500
Gas (g) 42,500 156,250
Electricity (e) 725,800 759,000
Telecommunication (t) 769,200 111,000
Total 2,429,750 1,626,250
Table 4-5 Operational (maintenance) yearly cost of buried utilities (OCBi) and MUT (SOCMi).
(Adapted from Boileau, 2013)
Cost ($) OCBi SOCMi
Municipal
(m)
Water 22,500 29,250 4,000
Sewer 6,750 6,500
Gas (g) 188 300
Electricity (e) 31,875 6,000
Telecommunication (t) 31,875 6,000
Total (for 250m) 93,188 22,800
Using Tables 4-3 to 4-5, Equation (4-1) and assuming that (a) effect of the discount rate will be
cancelled by the inflation of the costs over time, (b) k=100 years, and (c) each buried utility needs
one renewal within 100 years after the construction LCCburied = CBTotal+ OCBTotal= 2×(2,492,750)
+ 100×93,188 = $14,304,300.
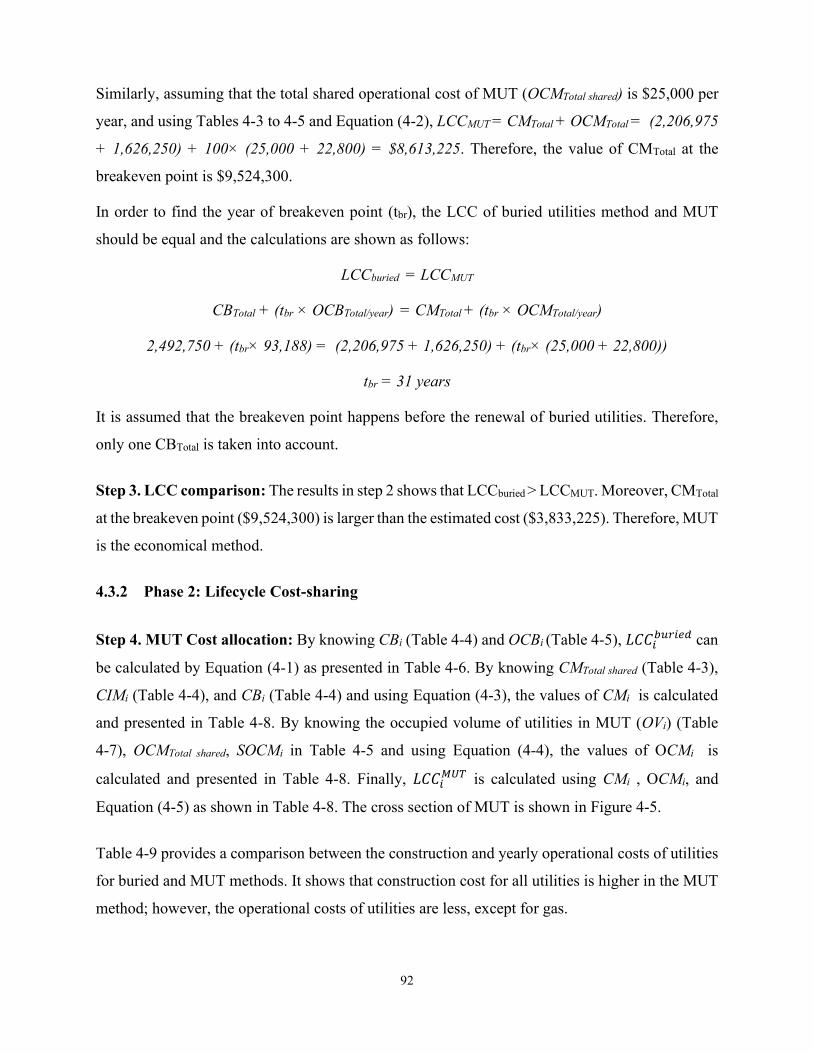
92
Similarly, assuming that the total shared operational cost of MUT (OCMTotal shared) is $25,000 per
year, and using Tables 4-3 to 4-5 and Equation (4-2), LCCMUT = CMTotal + OCMTotal = (2,206,975
+ 1,626,250) + 100× (25,000 + 22,800) = $8,613,225. Therefore, the value of CMTotal at the
breakeven point is $9,524,300.
In order to find the year of breakeven point (tbr), the LCC of buried utilities method and MUT
should be equal and the calculations are shown as follows:
LCCburied = LCCMUT
CBTotal + (tbr × OCBTotal/year) = CMTotal + (tbr × OCMTotal/year)
2,492,750 + (tbr× 93,188) = (2,206,975 + 1,626,250) + (tbr× (25,000 + 22,800))
tbr = 31 years
It is assumed that the breakeven point happens before the renewal of buried utilities. Therefore,
only one CBTotal is taken into account.
Step 3. LCC comparison: The results in step 2 shows that LCCburied > LCCMUT. Moreover, CMTotal
at the breakeven point ($9,524,300) is larger than the estimated cost ($3,833,225). Therefore, MUT
is the economical method.
4.3.2 Phase 2: Lifecycle Cost-sharing
Step 4. MUT Cost allocation: By knowing CBi (Table 4-4) and OCBi (Table 4-5), 𝐿𝐶𝐶𝑖𝑏𝑢𝑟𝑖𝑒𝑑 can
be calculated by Equation (4-1) as presented in Table 4-6. By knowing CMTotal shared (Table 4-3),
CIMi (Table 4-4), and CBi (Table 4-4) and using Equation (4-3), the values of CMi is calculated
and presented in Table 4-8. By knowing the occupied volume of utilities in MUT (OVi) (Table
4-7), OCMTotal shared, SOCMi in Table 4-5 and using Equation (4-4), the values of OCMi is
calculated and presented in Table 4-8. Finally, 𝐿𝐶𝐶𝑖𝑀𝑈𝑇 is calculated using CMi , OCMi, and
Equation (4-5) as shown in Table 4-8. The cross section of MUT is shown in Figure 4-5.
Table 4-9 provides a comparison between the construction and yearly operational costs of utilities
for buried and MUT methods. It shows that construction cost for all utilities is higher in the MUT
method; however, the operational costs of utilities are less, except for gas.
93
Figure 4-5 Cross-section of MUT (adapted from drawings provided by City of Montreal)
Table 4-6 Lifecycle cost of buried utilities
Cost ($) CBi OCBi 𝐿𝐶𝐶𝑖𝑏𝑢𝑟𝑖𝑒𝑑
Municipal 955,250 29,250 4,835,500
Gas 42,500 188 103,800
Electricity 725,800 31,875 4,639,100
Telecom 769,200 31,875 4,725,900
Total 2,429,750 93,188 14,304,300
Table 4-7 Occupied volume of utilities in MUT
Description Width (m) Height (m) Section area
(m2)
Occupied
volume (m3)
Occupation
(%)
Municipal Water 0.5 0.6 0.3 75 6%
Sewer 1.2 1.2 1.44 360 27%
Gas 0.8 0.5 0.4 100 7.5%
Electricity 1 1.83 1.83 457.5 34.5%
Telecommunication 0.9 1.5 1.35 337.5 25
Total 5.32 1330 100%
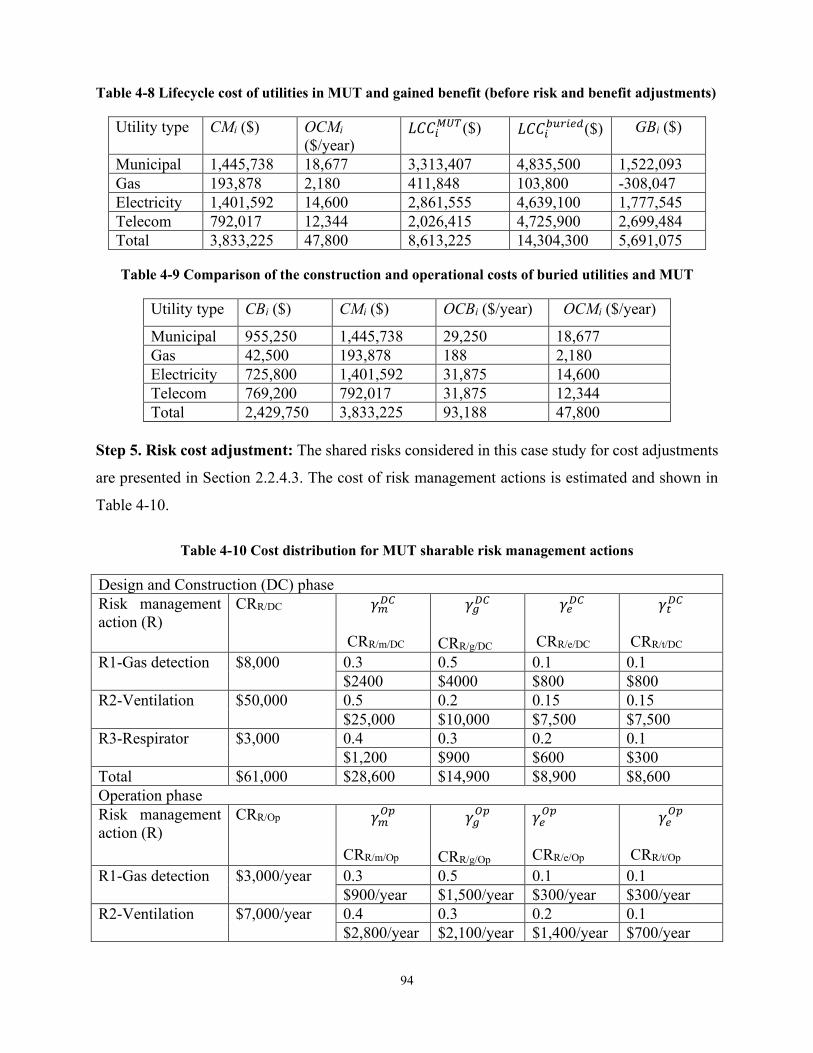
94
Table 4-8 Lifecycle cost of utilities in MUT and gained benefit (before risk and benefit adjustments)
Utility type CMi ($) OCMi
($/year) 𝐿𝐶𝐶𝑖
𝑀𝑈𝑇($) 𝐿𝐶𝐶𝑖𝑏𝑢𝑟𝑖𝑒𝑑($) GBi ($)
Municipal 1,445,738 18,677 3,313,407 4,835,500 1,522,093
Gas 193,878 2,180 411,848 103,800 -308,047
Electricity 1,401,592 14,600 2,861,555 4,639,100 1,777,545
Telecom 792,017 12,344 2,026,415 4,725,900 2,699,484
Total 3,833,225 47,800 8,613,225 14,304,300 5,691,075
Table 4-9 Comparison of the construction and operational costs of buried utilities and MUT
Utility type CBi ($) CMi ($) OCBi ($/year) OCMi ($/year)
Municipal 955,250 1,445,738 29,250 18,677
Gas 42,500 193,878 188 2,180
Electricity 725,800 1,401,592 31,875 14,600
Telecom 769,200 792,017 31,875 12,344
Total 2,429,750 3,833,225 93,188 47,800
Step 5. Risk cost adjustment: The shared risks considered in this case study for cost adjustments
are presented in Section 2.2.4.3. The cost of risk management actions is estimated and shown in
Table 4-10.
Table 4-10 Cost distribution for MUT sharable risk management actions
Design and Construction (DC) phase
Risk management
action (R)
CRR/DC 𝛾𝑚𝐷𝐶
CRR/m/DC
𝛾𝑔𝐷𝐶
CRR/g/DC
𝛾𝑒𝐷𝐶
CRR/e/DC
𝛾𝑡𝐷𝐶
CRR/t/DC
R1-Gas detection $8,000 0.3 0.5 0.1 0.1
$2400 $4000 $800 $800
R2-Ventilation $50,000 0.5 0.2 0.15 0.15
$25,000 $10,000 $7,500 $7,500
R3-Respirator $3,000 0.4 0.3 0.2 0.1
$1,200 $900 $600 $300
Total $61,000 $28,600 $14,900 $8,900 $8,600
Operation phase
Risk management
action (R)
CRR/Op 𝛾𝑚𝑂𝑝
CRR/m/Op
𝛾𝑔𝑂𝑝
CRR/g/Op
𝛾𝑒𝑂𝑝
CRR/e/Op
𝛾𝑒𝑂𝑝
CRR/t/Op
R1-Gas detection $3,000/year 0.3 0.5 0.1 0.1
$900/year $1,500/year $300/year $300/year
R2-Ventilation $7,000/year 0.4 0.3 0.2 0.1
$2,800/year $2,100/year $1,400/year $700/year
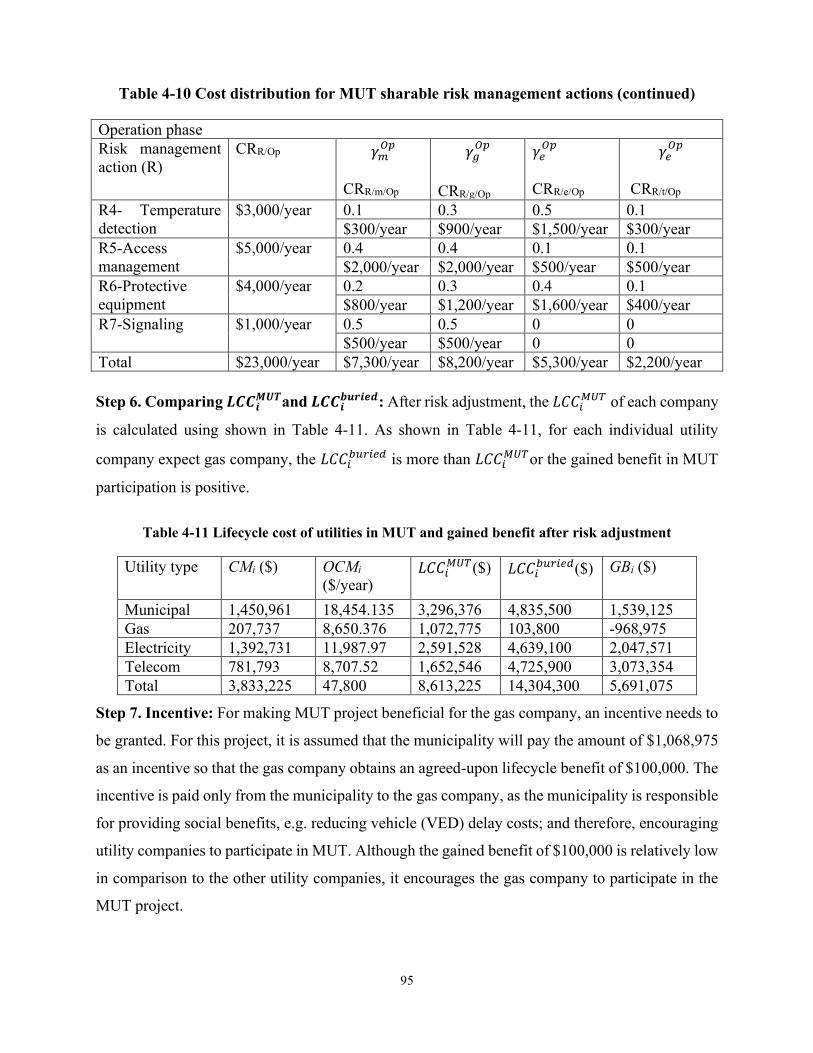
95
Table 4-10 Cost distribution for MUT sharable risk management actions (continued)
Operation phase
Risk management
action (R)
CRR/Op 𝛾𝑚𝑂𝑝
CRR/m/Op
𝛾𝑔𝑂𝑝
CRR/g/Op
𝛾𝑒𝑂𝑝
CRR/e/Op
𝛾𝑒𝑂𝑝
CRR/t/Op
R4- Temperature
detection
$3,000/year 0.1 0.3 0.5 0.1
$300/year $900/year $1,500/year $300/year
R5-Access
management
$5,000/year 0.4 0.4 0.1 0.1
$2,000/year $2,000/year $500/year $500/year
R6-Protective
equipment
$4,000/year 0.2 0.3 0.4 0.1
$800/year $1,200/year $1,600/year $400/year
R7-Signaling $1,000/year 0.5 0.5 0 0
$500/year $500/year 0 0
Total $23,000/year $7,300/year $8,200/year $5,300/year $2,200/year
Step 6. Comparing 𝑳𝑪𝑪𝒊𝑴𝑼𝑻and 𝑳𝑪𝑪𝒊
𝒃𝒖𝒓𝒊𝒆𝒅: After risk adjustment, the 𝐿𝐶𝐶𝑖𝑀𝑈𝑇 of each company
is calculated using shown in Table 4-11. As shown in Table 4-11, for each individual utility
company expect gas company, the 𝐿𝐶𝐶𝑖𝑏𝑢𝑟𝑖𝑒𝑑 is more than 𝐿𝐶𝐶𝑖
𝑀𝑈𝑇or the gained benefit in MUT
participation is positive.
Table 4-11 Lifecycle cost of utilities in MUT and gained benefit after risk adjustment
Utility type CMi ($) OCMi
($/year) 𝐿𝐶𝐶𝑖
𝑀𝑈𝑇($) 𝐿𝐶𝐶𝑖𝑏𝑢𝑟𝑖𝑒𝑑($) GBi ($)
Municipal 1,450,961 18,454.135 3,296,376 4,835,500 1,539,125
Gas 207,737 8,650.376 1,072,775 103,800 -968,975
Electricity 1,392,731 11,987.97 2,591,528 4,639,100 2,047,571
Telecom 781,793 8,707.52 1,652,546 4,725,900 3,073,354
Total 3,833,225 47,800 8,613,225 14,304,300 5,691,075
Step 7. Incentive: For making MUT project beneficial for the gas company, an incentive needs to
be granted. For this project, it is assumed that the municipality will pay the amount of $1,068,975
as an incentive so that the gas company obtains an agreed-upon lifecycle benefit of $100,000. The
incentive is paid only from the municipality to the gas company, as the municipality is responsible
for providing social benefits, e.g. reducing vehicle (VED) delay costs; and therefore, encouraging
utility companies to participate in MUT. Although the gained benefit of $100,000 is relatively low
in comparison to the other utility companies, it encourages the gas company to participate in the
MUT project.
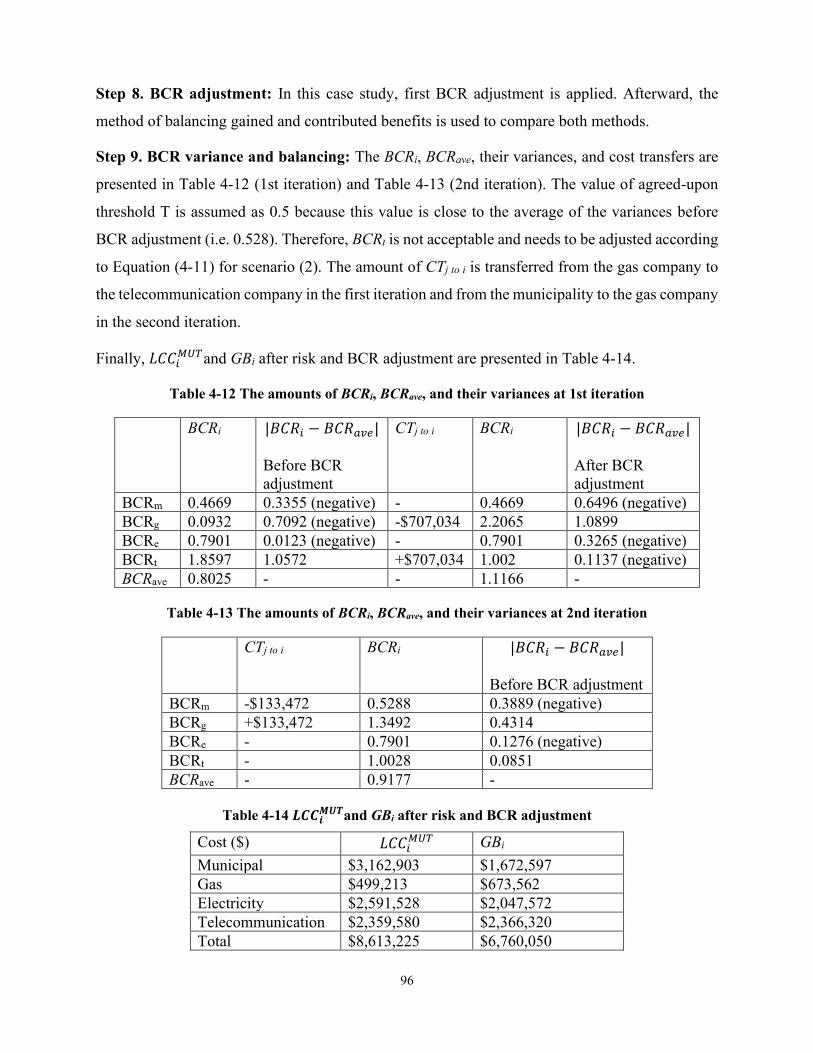
96
Step 8. BCR adjustment: In this case study, first BCR adjustment is applied. Afterward, the
method of balancing gained and contributed benefits is used to compare both methods.
Step 9. BCR variance and balancing: The BCRi, BCRave, their variances, and cost transfers are
presented in Table 4-12 (1st iteration) and Table 4-13 (2nd iteration). The value of agreed-upon
threshold T is assumed as 0.5 because this value is close to the average of the variances before
BCR adjustment (i.e. 0.528). Therefore, BCRt is not acceptable and needs to be adjusted according
to Equation (4-11) for scenario (2). The amount of CTj to i is transferred from the gas company to
the telecommunication company in the first iteration and from the municipality to the gas company
in the second iteration.
Finally, 𝐿𝐶𝐶𝑖𝑀𝑈𝑇and GBi after risk and BCR adjustment are presented in Table 4-14.
Table 4-12 The amounts of BCRi, BCRave, and their variances at 1st iteration
BCRi |𝐵𝐶𝑅𝑖 − 𝐵𝐶𝑅𝑎𝑣𝑒|
Before BCR
adjustment
CTj to i BCRi |𝐵𝐶𝑅𝑖 − 𝐵𝐶𝑅𝑎𝑣𝑒|
After BCR
adjustment
BCRm 0.4669 0.3355 (negative) - 0.4669 0.6496 (negative)
BCRg 0.0932 0.7092 (negative) -$707,034 2.2065 1.0899
BCRe 0.7901 0.0123 (negative) - 0.7901 0.3265 (negative)
BCRt 1.8597 1.0572 +$707,034 1.002 0.1137 (negative)
BCRave 0.8025 - - 1.1166 -
Table 4-13 The amounts of BCRi, BCRave, and their variances at 2nd iteration
CTj to i BCRi |𝐵𝐶𝑅𝑖 − 𝐵𝐶𝑅𝑎𝑣𝑒|
Before BCR adjustment
BCRm -$133,472 0.5288 0.3889 (negative)
BCRg +$133,472 1.3492 0.4314
BCRe - 0.7901 0.1276 (negative)
BCRt - 1.0028 0.0851
BCRave - 0.9177 -
Table 4-14 𝑳𝑪𝑪𝒊𝑴𝑼𝑻and GBi after risk and BCR adjustment
Cost ($) 𝐿𝐶𝐶𝑖𝑀𝑈𝑇 GBi
Municipal $3,162,903 $1,672,597
Gas $499,213 $673,562
Electricity $2,591,528 $2,047,572
Telecommunication $2,359,580 $2,366,320
Total $8,613,225 $6,760,050
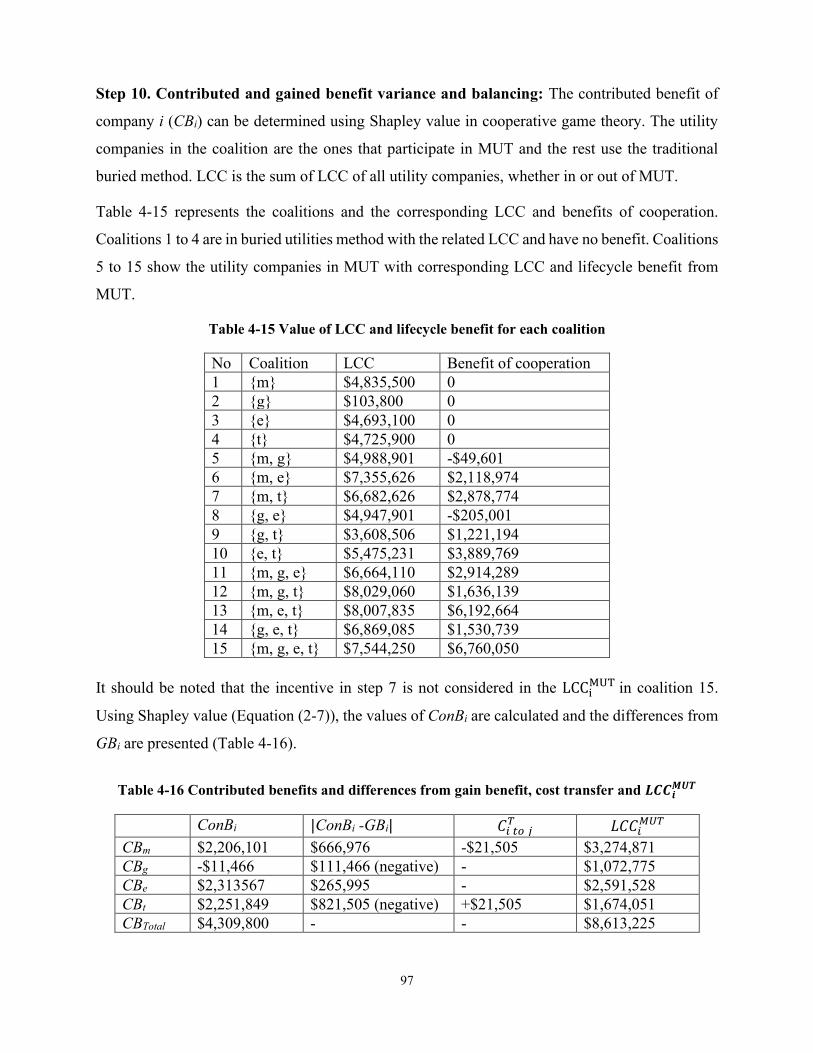
97
Step 10. Contributed and gained benefit variance and balancing: The contributed benefit of
company i (CBi) can be determined using Shapley value in cooperative game theory. The utility
companies in the coalition are the ones that participate in MUT and the rest use the traditional
buried method. LCC is the sum of LCC of all utility companies, whether in or out of MUT.
Table 4-15 represents the coalitions and the corresponding LCC and benefits of cooperation.
Coalitions 1 to 4 are in buried utilities method with the related LCC and have no benefit. Coalitions
5 to 15 show the utility companies in MUT with corresponding LCC and lifecycle benefit from
MUT.
Table 4-15 Value of LCC and lifecycle benefit for each coalition
No Coalition LCC Benefit of cooperation
1 {m} $4,835,500 0
2 {g} $103,800 0
3 {e} $4,693,100 0
4 {t} $4,725,900 0
5 {m, g} $4,988,901 -$49,601
6 {m, e} $7,355,626 $2,118,974
7 {m, t} $6,682,626 $2,878,774
8 {g, e} $4,947,901 -$205,001
9 {g, t} $3,608,506 $1,221,194
10 {e, t} $5,475,231 $3,889,769
11 {m, g, e} $6,664,110 $2,914,289
12 {m, g, t} $8,029,060 $1,636,139
13 {m, e, t} $8,007,835 $6,192,664
14 {g, e, t} $6,869,085 $1,530,739
15 {m, g, e, t} $7,544,250 $6,760,050
It should be noted that the incentive in step 7 is not considered in the LCCiMUT in coalition 15.
Using Shapley value (Equation (2-7)), the values of ConBi are calculated and the differences from
GBi are presented (Table 4-16).
Table 4-16 Contributed benefits and differences from gain benefit, cost transfer and 𝑳𝑪𝑪𝒊𝑴𝑼𝑻
ConBi |ConBi -GBi| 𝐶𝑖 𝑡𝑜 𝑗𝑇 𝐿𝐶𝐶𝑖
𝑀𝑈𝑇
CBm $2,206,101 $666,976 -$21,505 $3,274,871
CBg -$11,466 $111,466 (negative) - $1,072,775
CBe $2,313567 $265,995 - $2,591,528
CBt $2,251,849 $821,505 (negative) +$21,505 $1,674,051
CBTotal $4,309,800 - - $8,613,225
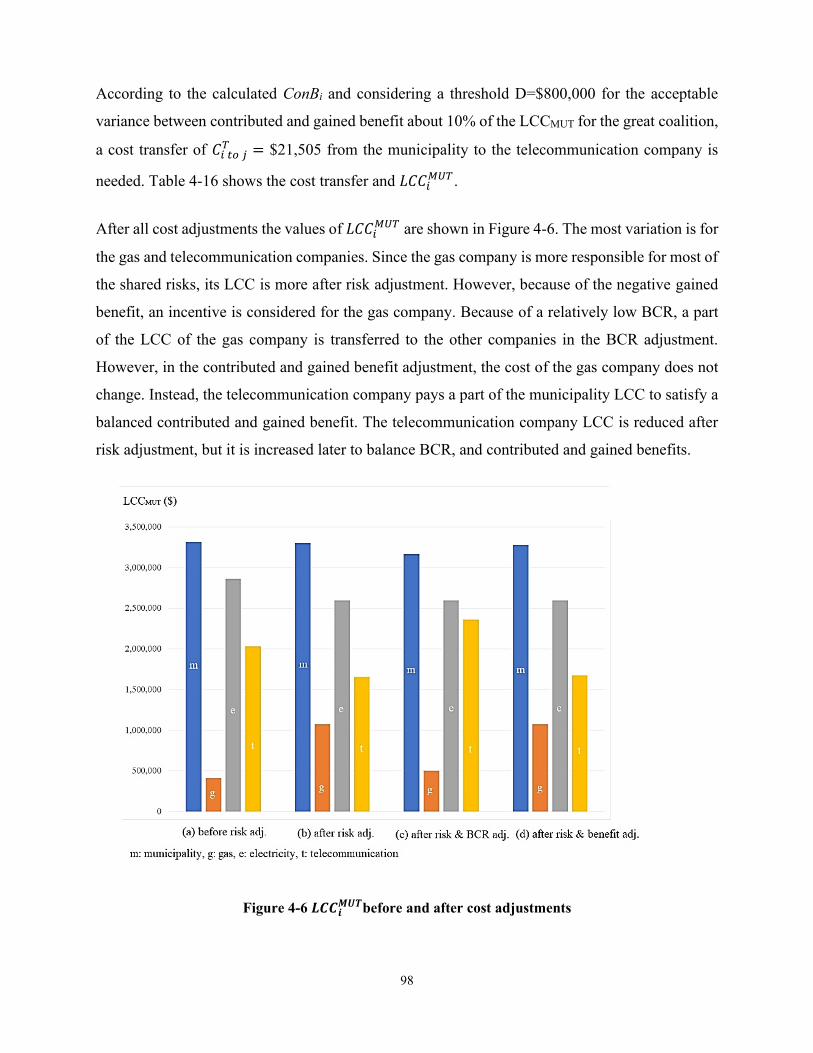
98
According to the calculated ConBi and considering a threshold D=$800,000 for the acceptable
variance between contributed and gained benefit about 10% of the LCCMUT for the great coalition,
a cost transfer of 𝐶𝑖 𝑡𝑜 𝑗𝑇 = $21,505 from the municipality to the telecommunication company is
needed. Table 4-16 shows the cost transfer and 𝐿𝐶𝐶𝑖𝑀𝑈𝑇.
After all cost adjustments the values of 𝐿𝐶𝐶𝑖𝑀𝑈𝑇 are shown in Figure 4-6. The most variation is for
the gas and telecommunication companies. Since the gas company is more responsible for most of
the shared risks, its LCC is more after risk adjustment. However, because of the negative gained
benefit, an incentive is considered for the gas company. Because of a relatively low BCR, a part
of the LCC of the gas company is transferred to the other companies in the BCR adjustment.
However, in the contributed and gained benefit adjustment, the cost of the gas company does not
change. Instead, the telecommunication company pays a part of the municipality LCC to satisfy a
balanced contributed and gained benefit. The telecommunication company LCC is reduced after
risk adjustment, but it is increased later to balance BCR, and contributed and gained benefits.
Figure 4-6 𝑳𝑪𝑪𝒊𝑴𝑼𝑻before and after cost adjustments
99
4.4 Summary and Conclusions
This chapter proposed a comprehensive and systematic model for MUT and buried utilities LCC
analysis by considering the factors of utility specifications, location conditions, and
construction/maintenance methods. The output of this model estimates the lifecycle cost of MUT
and buried utilities. The proposed model can justify whether an MUT project is an economic
alternative method for buried utilities. In addition, an MUT cost-sharing method is proposed to
ensure the decisionmakers of utility companies that MUT is the economic method for their
company and also the benefits and costs of MUT are distributed fairly among the utility companies.
The fairness is defined based on three principals: (a) balance of risk, (b) balanced benefit-cost
ratio, and (c) balance in contributed benefit and gained benefit. It can be concluded that (a) the
influence of factors on the LCC of MUT and buried utilities can differ significantly case by case,
(b) the LCC of MUT must be less than buried utilities for the project and also for each individual
utility company to justify MUT, (c) PBC and PUVO methods of cost-sharing are necessary, but
not enough for a fair cost-sharing, (d) risk adjustment provides fairness by proportionally
allocating the cost of risk management and responsibility of risk to the utility companies, (e) BCR
adjustment aims to improve fairness by balancing BCR of utility company based on the logic that
higher cost should result in higher benefit for a company, but with balanced BCR, and (f) balancing
contributed and gained benefit encourages utility companies with high contributed but low gained
benefit to participate in MUT. The limitations include lack of data availability for some factors
(e.g. E&R, underground water level, traffic density).
100
CHAPTER 5. SMART MUT INFORMATION MODELING FOR
LIFECYCLE MANAGEMENT
5.1 Introduction
As discussed in Section 1.2, complicated coordination of utility companies is a barrier for
promoting of MUT projects. In Section 2.4, it is explained that Building Information Modeling
(BIM) can facilitate the design, construction, and operation of MUTs and improve the coordination
of utility companies. However, BIM is mainly developed for buildings and has been extended to
some civil structures (e.g. bridges, tunnels). Using BIM for MUTs is in its infancy and should be
standardized. Also, BIM cannot satisfy all the MUT information requirements because: (1) MUTs
are linear underground structures interacting with the surrounding environment (e.g. streets,
buildings, underground structures); and (2) BIM tools are not able to process the huge amount of
real-time data for MUT operation (e.g. sensors for safety monitoring, access control detectors,
security cameras). Luo et al. (2019) stated that by using sensors that support the operation and
maintenance phase of a smart MUT, the MUT risks can be controlled. Therefore, BIM should be
linked with other tools, including Geographic Information Systems (GIS), externally linked data,
and user interfaces (Lee et al., 2018). Extending BIM and integrating it with other technologies
can be done based on specific use-cases for the design, construction, and facility management of
MUTs. This extension can benefit from available resources related to MUT components and the
information requirements (Kang et al., 2014; Bao, 2017; Lee et al., 2018; Hu & Zhang, 2019; Ge
& Xu, 2019; Li et al., 2019; Wu et al., 2019; Sfere, 2020; Shahrour et al., 2020, Yin et al., 2020).
However, the available resources only concentrate on one or some aspects of MUTs.
This chapter aims to achieve the third objective of this research in Section 1.3. For this purpose,
all aspects of MUTs including overall management, design, construction, and operation
information of the MUT and its surrounding environment are covered. This chapter proposes an
integrated framework for SMUTIM and linking with GIS and databases. The framework focuses
on gathering information requirements for lifecycle management, analyzing BIM use cases of
SMUTIM, and extending the Industry Foundation Classes (IFC) to SMUTIM. The smart concept
in SMUTIM emphasizes applying new technologies that work together (e.g. Internet of Things
101
(IoT)) for the collection of huge amounts of monitoring MUT sensory data during the operation
phase. In addition, these technologies can improve the functions of ancillary facilities (e.g.
security, Heating, Ventilation, and Air Conditioning (HVAC), and communication systems).
SMUTIM can improve the design, construction, and facility management of MUTs by facilitating
the coordination and collaborative decision-making through sharing information among the MUT
stakeholders. A case study is used to demonstrate the applicability of the proposed framework.
5.1 Proposed Framework for Smart MUT Information Modeling
The proposed framework of integrating BIM and 3D GIS for SMUTIM includes three main steps:
(a) MUT information requirements definition, (b) identification of SMUTIM use cases, and (c)
extending IFC to accommodate SMUTIM. Figure 5-1 shows the research methodology.
The proposed framework is based on the analysis of the literature review, expert opinions, and the
resources about MUT information requirements. There are standards about the information
requirements for tunnel modeling (HB 138 Model Basis, 2012; Ghaznavi, 2013). Some utility
information standards include Pipeline Open Data Standard (PODS) as a data model of pipelines
(PODS, 2017), Common Information Model (CIM)/Distribution Management (IEC61968) for
electricity distribution networks (IEC, 2003; Wang et al., 2003), and Fiber Network Data Model
(FNDM) for telecommunication networks (FNDM, 2015).
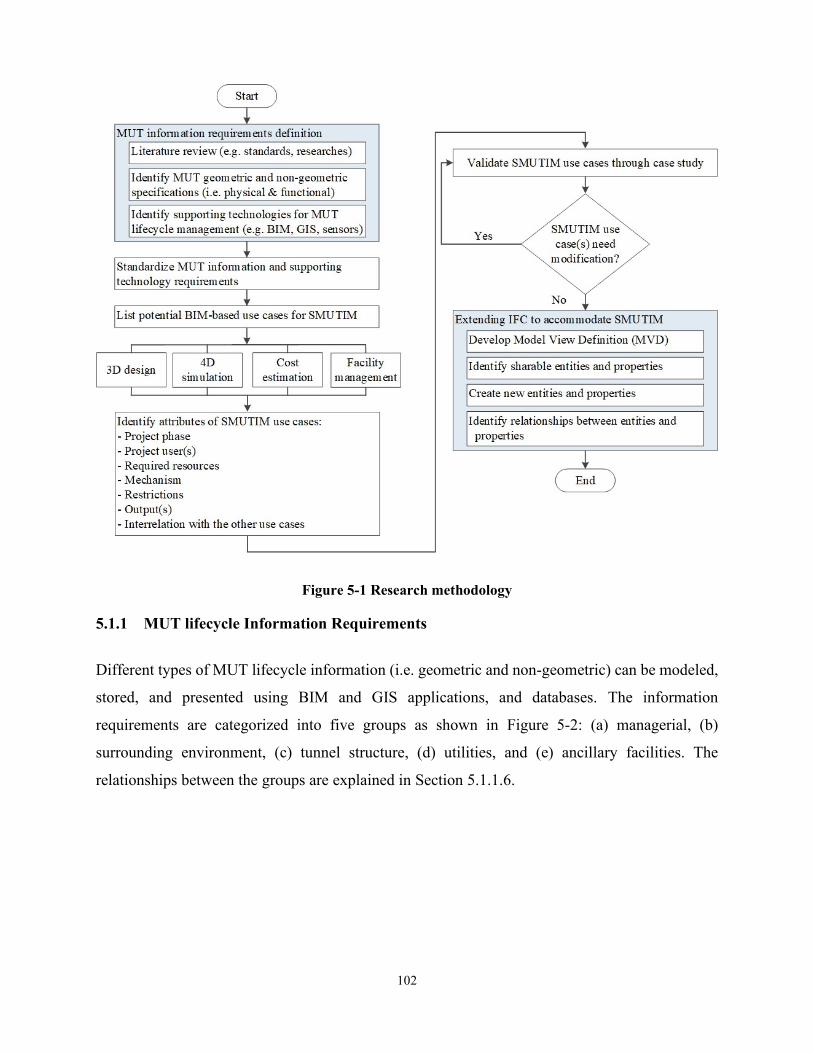
102
Figure 5-1 Research methodology
5.1.1 MUT lifecycle Information Requirements
Different types of MUT lifecycle information (i.e. geometric and non-geometric) can be modeled,
stored, and presented using BIM and GIS applications, and databases. The information
requirements are categorized into five groups as shown in Figure 5-2: (a) managerial, (b)
surrounding environment, (c) tunnel structure, (d) utilities, and (e) ancillary facilities. The
relationships between the groups are explained in Section 5.1.1.6.
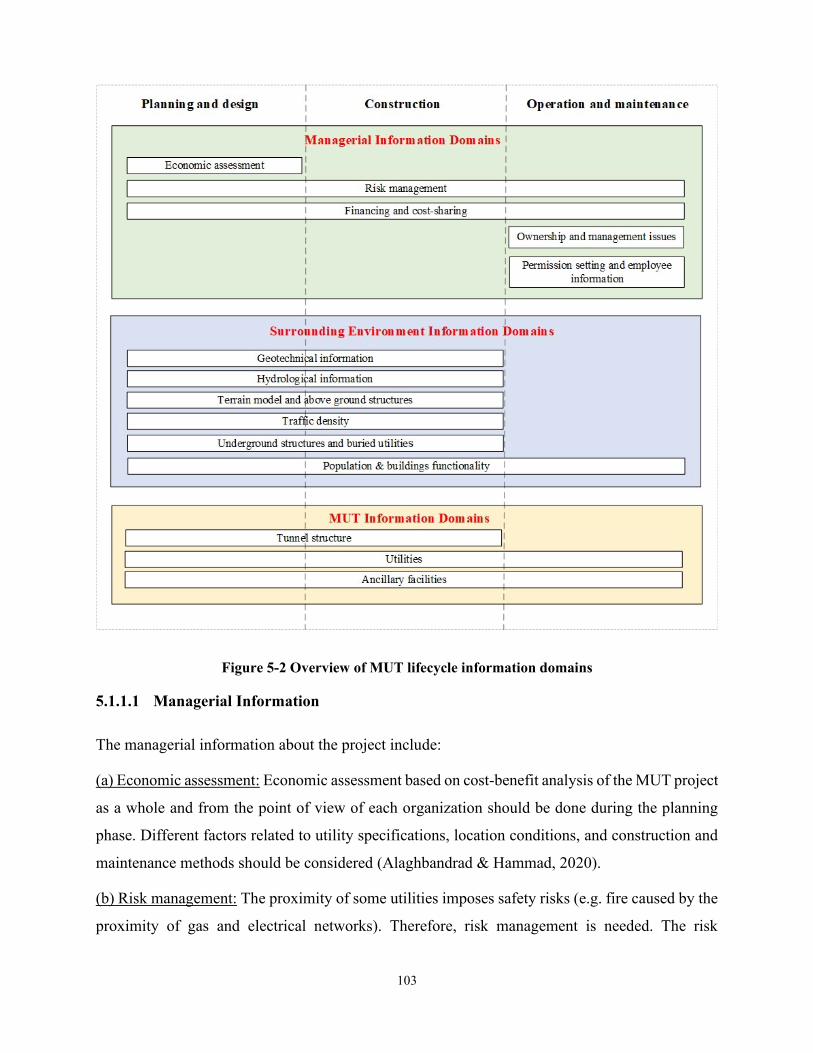
103
Figure 5-2 Overview of MUT lifecycle information domains
5.1.1.1 Managerial Information
The managerial information about the project include:
(a) Economic assessment: Economic assessment based on cost-benefit analysis of the MUT project
as a whole and from the point of view of each organization should be done during the planning
phase. Different factors related to utility specifications, location conditions, and construction and
maintenance methods should be considered (Alaghbandrad & Hammad, 2020).
(b) Risk management: The proximity of some utilities imposes safety risks (e.g. fire caused by the
proximity of gas and electrical networks). Therefore, risk management is needed. The risk
104
management process includes risk management planning, risk identification, risk qualitative and
quantitative analysis, risk response planning and implementation, and risk monitoring (Project
Management Institute, 2017). The arrangements for distributing the cost of risk management
among utility companies are another aspect of managerial information.
(c) Financing and cost-sharing: The lifecycle financial sources of MUT (e.g. bank loan, utility
companies, government, and municipality) and cost-sharing model should be determined.
Different methods for cost-sharing have been proposed including (a) The proportion of buried cost
(PBC) method, in which the utility companies share the costs with the same proportions they used
to pay in the traditional buried utilities method (CPAMI, 2011; Xiaoqin et al., 2011; Zhang, et al.,
2019), (b) The proportion of utility volume occupancy (PUVO) method, in which utility companies
are responsible for costs according to their occupied volume in the MUT. A combination of the
two previous methods is also proposed (Zhang et al., 2019; Xiaoqin et al., 2011); (c) benefit ratio:
sharing cost based on the ratio of each utility company lifecycle benefit (Zhang et al., 2019).
Alaghbandrad and Hammad (2020) proposed an MUT cost-sharing framework that considers a
combination of PBC and PUVO methods and factors of risk and benefit.
The long-term economic perspective for MUT and cooperation between several public and private
MUT stakeholders make Public-Private Partnership (PPP) a practical form of contract for these
projects and it was adopted in China and France (Yang & Peng, 2016; Clé de Sol, 2005). In PPP
projects, the main goal is to assign the risk to the sector that can better control it (European
Commission, 2003).
(d) Ownership and management issues: During the operation phase, the ownership of a single
entity or co-ownership by utility companies and/or rental arrangements, the constitution, members,
and power of the organization that manages MUT are the main issues that should be planned in
advance. One model of MUT project organization is “municipal governance” (Clé de Sol, 2005).
In this model, the municipality is the owner and manager of the MUT, and the participant utility
companies pay a rental fee.
(e) Permission setting and employee information: During the operation phase of MUT, the
permission setting should determine the authority of the utility companies and their employees.
These permissions specify permitted access areas, allowed personnel and equipment, prohibited
actions, working hours, instructions for emergencies, and instructions to using ancillary facilities
105
(e.g. communication, electricity, lighting, ventilation, and access control and geo-localization
systems).
5.1.1.2 Surrounding Environment Information
Surrounding environment information is useful for deciding the location of MUT, design
considerations, traffic control and detour, the slope of the terrain, etc. These factors also affect
project costs. GIS as “a computer system for entering, storing, querying, analyzing and displaying
geographic data” (Lee et al., 2018), can support the presentation of the surrounding environment
of an MUT. The information about the surrounding environment includes geometric information
(i.e. location, dimensions) and non-geometric information. The main information groups include:
(a) geotechnical information: information about the types and characteristics of soils and rocks
(e.g. hardness, cohesion, stabilization) in the project should be provided. Based on the geotechnical
conditions, some techniques (e.g. bursting the rock, stabilization of weak soils (e.g. clay)) may be
needed; (b) hydrological information: underground water and other water sources (i.e. river,
lake) should be considered for waterproofing, draining, deviation of MUT route to avoid water,
utility towers/bridge over the water, etc. In a project in China, cofferdams were constructed at the
intersections of rivers and MUT to pump out water from the working areas (Bao, 2017); (c) the
terrain model and above-ground structures: the elevation of the earth's surface, the surrounding
above-ground structures, and natural barriers are presented by the terrain model and influence
MUT project. For example, lack of enough terrain slope for a gravity sewer can be compensated
by deeper MUT. More than enough slope needs special design and construction techniques (e.g.
soil filling and vertical/slopped MUT); (d) traffic density: traffic control and detour roads should
be considered during the project. The traffic control costs should be added to the project costs. The
traffic congestion and/or longer travel distance in detour roads impose added travel time and costs
to the vehicles’ passengers (social costs); (e) underground structures and buried utilities: the
existing underground structures (e.g. metro, tunnels, underground pedestrian corridors,
underground buildings) and buried utilities are available in GIS. Design and construction
considerations should be taken to avoid the clash of MUT with these structures and utilities. Deep
excavation can be a solution to this issue. CityGML is an open standardized data model and
exchange format for 3D objects and features of cities and landscapes (CityGML, 2018) that can
be integrated with SMUTIM; and (f) population and buildings functionality (e.g. residential,
106
commercial, educational): the number and needed capacity of utility users depends on the
development level of MUT location (i.e. undeveloped, suburban and urban area) (Hunt et al.,
2014).
5.1.1.3 Tunnel Structure
The physical/spatial components of the tunnel structure, and their general and specific information
requirements are presented in Table 5-1. Figure 5-9 shows an example of the tunnel structure used
in the case study. As the general requirements are well-known and common among all structures,
they are only listed in Table 5-1 and more details about specific information requirements of
structural elements are provided as follows.
The tunnel structure is divided into different parts:
- Tunnel main structure and foundation: The principal tunnel of MUT connects to nearby
buildings through lateral mini-tunnels and has access for workers and materials. The high-level
distribution of MUTs in a district can be shown on a map as a network. Specific considerations
for designing the tunnel are needed to withstand the loads (e.g. soil, vehicles, above-ground
structures). The compartments in the MUT structure divide the internal space of the tunnel and
can improve safety by physically separating the utilities. The foundation takes the same specific
requirements of the main structure.
- Foundation pits: These are temporary pits for building the foundation and structure of MUT.
They need support structures (e.g. steel sheet piles) and should provide space for labor and
machinery access during construction.
The auxiliary structures are integrated with the MUT structure and include:
- Access structures: These structures connect the main tunnel structure to the outdoor
environment and include material input port, human access port, and ventilation manhole.
- Node structure: The intersections of the main tunnels have special design requirements. There
should be enough space for human movement within the node structure of the tunnel which is
usually crowded with utilities in two directions. Respecting safety buffers of utilities is more
complicated in the intersections.
- Lateral tunnel structure: The connections of the main tunnel structure and utilities to the
adjacent buildings needs the same special design requirements of node structures.
107
- Waterproofing and drainage structure: There are special design requirements to drain the
water inside the tunnel to the outside (i.e. drainage) and to avoid water penetration to the tunnel
(e.g. coating, joint waterproofing). The waterproofing locations, coating technical
requirements, and drainage capacity need special design considerations.
All the tunnel structural components need indication signs (e.g. safety warning, instructions,
indicating authorized personnel, navigation) (Wu et al., 2019).
5.1.1.4 Utilities
The utilities are categorized into two general groups of pipes and cables. The details about each
group are given in Tables 5-2 and 5-3 and explained in this section. The pipes and cables are
supported by hangers or shelves. They have labels and signs attached to them.
5.1.1.4.1 Pipes
There are three main types of pipes, namely drinking water, sewer, and gas pipes. The general and
specific information requirements for the pipes are listed in Table 5-2. The general information
requirements cover the common features of all types of pipelines (e.g. location, size, material and
coating, capacity, maintenance history). The specific information requirements are:
- Drinking water:
• Water pipeline network: The network supplies the drinking water for the surrounding
buildings and the street hydrants. The hydraulic specifications of the system are an important
part of the design (Duzinkiewicz & Ciminski, 2006; National Research Council, 2006).
• Water monitoring system (ancillary system): The real-time information of flow rate, pressure,
quality, leakage, and contamination should be measured and recorded. Waterborne
contaminants (e.g. lead, arsenic, bacteria and viruses) can be harmful to the health (Water
Quality Association, 2020) and should be detected continuously.
- Sewer:
• Sewer pipeline network: There are sanitary sewers to collect municipal sewage and storm
sewers to convey surface runoff. These systems can be separated, partially separated (i.e.
sanitary sewers convey some drainage), or combined (City of Toronto, 2009). The sewers
can be designed as gravity-based or under pressure (Water security agency, 2012).
108
• Sewer monitoring system (ancillary system): The sewer gases can be poisonous and corrosive
(e.g. methane and hydrogen sulfide are flammable). They should be detected and the leakage
history should be recorded. Other measurements (e.g. flow rate, quality) should also be
recorded. The hydraulic specifications should be determined at the design stage.
- Gas:
• Gas pipeline network: The network supplies the gas for the surrounding buildings. The
network (e.g. pipes, valves, regulators) is designed based on the required capacity.
• Gas monitoring system (ancillary system): Some features of the gas distribution pipeline in
MUT including gas flow rate, density, pressure, and temperature should be measured and
recorded. Gas leakage should be monitored (Herrán-González et al., 2009). The types of
sensors should be determined for this system.
5.1.1.4.2 Cables
There are two types of cable in MUT: electrical and telecommunication cables. The general and
specific information requirements for the cables are listed in
Table 5-3. The general information requirements cover the common features of all types of cables
(e.g. location, size, material and coating, capacity, maintenance history).
- Electrical cables:
• Electrical cable network: The specific information requirements for electrical cables include:
the model of the system (i.e. line model, distribution model, voltages regulator model,
distribution feeder model), the capacity of cables (i.e. voltage), and the type of monitoring
data (e.g. cable temperature, frequency).
• Electrical monitoring system (ancillary system): The monitoring data for the network includes
cable temperature, tension, current, frequency, switch status, and consumption.
- Telecommunication cables:
• Telecommunication cable network: For telecommunication cables, the type of cables (e.g.
fiber optic, copper), the supported network (e.g. TV, phone, Internet), as well as the protocols
and codes about the system components (e.g. color code, labeling protocol) should be
specified.
109
• Telecommunication monitoring system (ancillary system): The network should be monitored
for potential hazards (e.g. cable temperature, water ingress,) and regular conditions (e.g.
switch status, outages).
5.1.1.5 Ancillary Facilities
The ancillary facilities are required for the continuous operation of the MUT. In addition to
ancillary systems used for monitoring the utilities as explained in Section 5.1.1.4, other ancillary
systems monitor safety, security, environmental and structural health, and provide the required
services of MUT (i.e. power, access control and geo-localization, fire extinguishing, HVAC,
drainage, communication, hoisting, lighting). The group of facilities that are mainly for detection
using sensors is called sensory systems. All the ancillary facilities need supports or hanger and
indication signs. The ancillary facilities are presented in Table 5-4. The general information
requirements are common between all facilities. The specific requirements are explained as
follows.
- Sensory systems:
(1) Structural health monitoring (SHM) system: Optical fiber sensors are installed to monitor
structure deformation and displacement (i.e. vertical and horizontal displacement due to
adjacent excavations) (Nakano et al., 2011). The hydrostatic leveling system can be used to
detect the vertical settlement of the tunnel because of excavation in the surrounding
environment (Yin, 2013).
(2) Access control and geo-localization systems: The access control system and geo-localization
system have different functionalities:
(a) Access control system: The physical access doors can be equipped with the traditional
key locks, magnetic/smart access card readers, code/barcode locks, fingerprint readers,
or facial recognition systems. The access procedures and history, and the information of
authorized maintenance staff to access the MUT should be defined and recorded in the
system.
(b) Geo-localization system: This system can be used to track the location of authorized staff
or unauthorized intrusions in the MUT.
(3) Environmental monitoring system: Different parameters should be monitored in real-time
to control the environmental health of MUT. The acceptable range of temperature and
110
humidity should be defined and measured. Air quality monitoring includes measurement of
CO, CO2, Methane, etc. (Xtralis, 2018), and detection of smoke, fire, and any air
contamination (e.g. dust, microbiologic gases). Overflow and water infiltration can be a
result of pipeline leakage (i.e. water and sewer pipes) or structural water penetration from
cracks, joints, or defected drainage system.
- HVAC system: The HVAC system can be used to circulate, filter, and adjust the air temperature
inside the MUT. The system specifications include: ducting network, heating and cooling
system, air pump, and air filter and register vent specifications. The airflow rate, temperature,
and ventilation mode (indoor circulation/fresh air) should be monitored.
- Drainage system: The drainage system evacuates any water leaked from utilities or infiltrated
into the structure from external sources. The drainage can be by gravity or using water pumps.
The capacity of the drainage system should be specified, and the water flow rate should be
monitored.
- Lighting system: The lighting system is supported by the power supply system to provide the
required light of the tunnel interior. This system is composed of cables, switches, ducts and
conduits, and sensors. The distribution model of the system and other attributes (e.g. voltage,
type of lights and sensors) should be determined. The sensors can adjust the light according to
the requirements.
- Power supply system: The purpose of the MUT power supply system is to provide electricity
to ancillary facilities and the tunnel (e.g. lighting system, power outlets). Therefore, in addition
to the specifications of the power system (e.g. voltage, line model), the location and
specifications of the ancillary systems should be determined.
- Security monitoring and alarm system: The goal of the security system is to detect the
intrusion of unauthorized people, who may be able to deceive the access control system, to
MUT with different purposes (theft, vandalism, attack).
- Fire extinguishing system: In case a fire is detected, the alarm and the fire extinguishing
system are activated. The water supply system supports sprinklers to extinguish the fire and the
ventilation system is activated to evacuate smoke and heat. In sensitive locations where the
water of a fire sprinkler is dangerous, fire suppression systems are designed to extinguish a fire.
In locations that personnel work, clean agent or inert gas suppression systems should be used
to avoid health risks. In locations where there are few or no personnel, CO2 fire suppression
systems are used (Koorsen, 2017).
111
- Hoisting system: The hoisting system supports carrying heavy loads inside the MUT via rails.
The system specifications and functional information (i.e. load capacity and spatial coverage)
should be defined.
- Communication system: The communication system enables staff inside and outside the MUT
to talk using wired/wireless technologies. The specifications and locations of equipment (i.e.
industrial telephone, access point, cables, and the wireless system) should be designed for MUT
needs. The authorization levels of communication should be defined.
5.1.1.6 Relationships Between MUT Lifecycle Information Groups
Sections 5.1.1.1 to 5.1.1.5 categorized MUT lifecycle information requirements in five groups of
the managerial, surrounding environment, tunnel structure, utilities, and ancillary facilities. As
these information groups are related to each other, their relationships should be clarified. The
relationships among the concepts can be subsumption, partonomy (El-Gohary & El-Diraby, 2010),
and supporting. A subsumption relation connects the general concept and a sub-concept (i.e. is-a
relationship). For example, the HVAC system is an ancillary facility. A partonomy relation
represents a part-of relationship between the concept and its parts with patronymic hierarchies (is-
part-of relationship). For example, the node and lateral tunnel structures are parts of the tunnel
structure. There are four types of supporting relationships: (1) Monitoring (i.e. is-monitored-by):
the conditions of a physical/spatial component which is monitored by an ancillary facility. For
example, the tunnel main structure is monitored by the SHM system and the environmental
monitoring system; (2) Controlling (i.e. is-controlled-by relationship): a controlling ancillary
facility receives a signal from a monitoring system. Then the actuators convert the signal to a
mechanical motion. For example, the switches of the access control system send signals to the
actuators to open the door for the authorized personnel. In case of fire, the environmental
monitoring system sends a signal to the HVAC system actuators to evacuate smoke and to
sprinklers to release water; (3) Informative (i.e. provide-information-for relationship): The
relationships between the managerial or surrounding environment information and the tunnel
structures, utilities, and ancillary facilities are informative and are used to support decision-
making. For example, employee information can support the access control system by providing
the information of authorized staff to access MUT; (4) Serving (i.e. is-served-by relationship): A
system is served by another system or utility network to accomplish its tasks. For example, the
HVAC system is served by the power supply system for its electricity need.
112
The relationships are shown in Figure 5-3 and explained as follows. To clarify, each relationship
is coded with a number (e.g. R1 means relationship number 1) and type (i.e. subsumption (S),
partonomy (P), supporting monitoring (SM), supporting controlling (SC), supporting informative
(SI), and supportive serving (SS)).
- The node, lateral tunnel, access, and tunnel main structure are (a) served by the lighting (R1-
SS) and hoisting systems (R2-SS), (b) monitored by SHM system (R3-SM), environmental
monitoring system (R4-SM), and security monitoring and alarm system (R5-SM), and (c)
monitored for personnel positioning (i.e. geo-localization) and controlled for personnel access
(i.e. access control) by the access control and geo-localization system (R6-SM & SC).
- The power supply system is served by the electrical cable network for the required electricity
(R7-SS). Then, the power supply system supplies electricity to the other ancillary facilities (i.e.
serving relationship) (R8-SS).
- The access control and geo-localization system provides information about the ingress/egress
and location tracking of personnel for the security monitoring and alarm system (R9-SI).
- The access control and geo-localization system is served by the communication system at the
ports of entry for the communication of personnel (R10-SS). The communication system is
served by the telecommunication utility network for the required infrastructure (R11-SS).
- In case that the environmental monitoring system detects a fire, an alarm is sent to the fire
extinguishing system to control the fire (R12-SC). The fire extinguishing system is served by
the HVAC system to evacuate smoke and heat in case of fire, and fire extinguishing gases (e.g.
CO2) after the fire (R13-SS). The fire extinguishing system is served by the water utility
network for supplying the water of sprinklers (R14-SS). Also, the drainage system serves the
fire extinguishing system to evacuate the water from sprinklers (R15-SS).
- If the environmental monitoring system detects that MUT temperature, humidity, or air quality
are not acceptable, an alarm is sent to the HVAC system to control the environment (R16-SC).
Also, in the case of water penetration and overflow in MUT, the environmental monitoring
system sends an alarm to the drainage system to evacuate the water (R17-SC).
- The utility networks should be monitored by the monitoring systems (R18-SM to R22-SM). In
case that the gas monitoring system detects a gas leakage, it should be controlled by the HVAC
system (R23-SC). If water leakage is detected by the water or sewer monitoring systems, the
drainage system should control by water evacuation (R24-SC and R25-SC). If the sewer
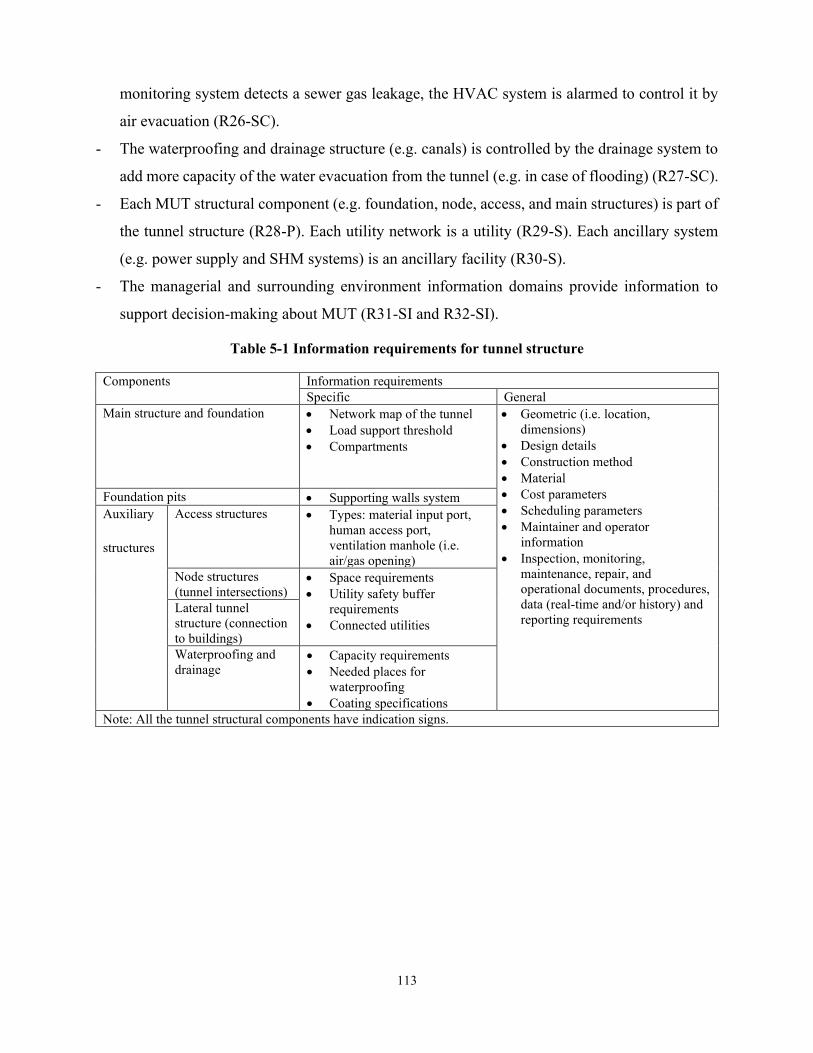
113
monitoring system detects a sewer gas leakage, the HVAC system is alarmed to control it by
air evacuation (R26-SC).
- The waterproofing and drainage structure (e.g. canals) is controlled by the drainage system to
add more capacity of the water evacuation from the tunnel (e.g. in case of flooding) (R27-SC).
- Each MUT structural component (e.g. foundation, node, access, and main structures) is part of
the tunnel structure (R28-P). Each utility network is a utility (R29-S). Each ancillary system
(e.g. power supply and SHM systems) is an ancillary facility (R30-S).
- The managerial and surrounding environment information domains provide information to
support decision-making about MUT (R31-SI and R32-SI).
Table 5-1 Information requirements for tunnel structure
Components Information requirements
Specific General
Main structure and foundation
• Network map of the tunnel
• Load support threshold
• Compartments
• Geometric (i.e. location,
dimensions)
• Design details
• Construction method
• Material
• Cost parameters
• Scheduling parameters
• Maintainer and operator
information
• Inspection, monitoring,
maintenance, repair, and
operational documents, procedures,
data (real-time and/or history) and
reporting requirements
Foundation pits • Supporting walls system
Auxiliary
structures
Access structures • Types: material input port,
human access port,
ventilation manhole (i.e.
air/gas opening)
Node structures
(tunnel intersections) • Space requirements
• Utility safety buffer
requirements
• Connected utilities
Lateral tunnel
structure (connection
to buildings)
Waterproofing and
drainage • Capacity requirements
• Needed places for
waterproofing
• Coating specifications
Note: All the tunnel structural components have indication signs.
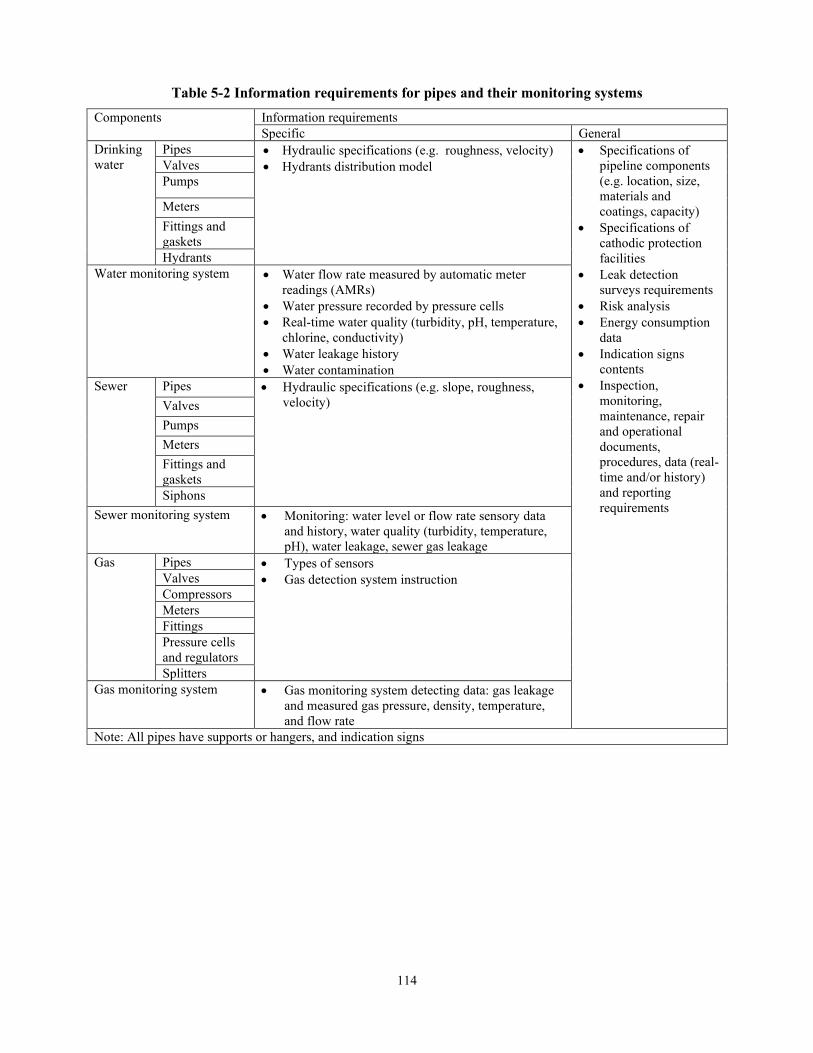
114
Table 5-2 Information requirements for pipes and their monitoring systems
Components Information requirements
Specific General
Drinking
water
Pipes • Hydraulic specifications (e.g. roughness, velocity)
• Hydrants distribution model
• Specifications of
pipeline components
(e.g. location, size,
materials and
coatings, capacity)
• Specifications of
cathodic protection
facilities
• Leak detection
surveys requirements
• Risk analysis
• Energy consumption
data
• Indication signs
contents
• Inspection,
monitoring,
maintenance, repair
and operational
documents,
procedures, data (real-
time and/or history)
and reporting
requirements
Valves
Pumps
Meters
Fittings and
gaskets
Hydrants
Water monitoring system • Water flow rate measured by automatic meter
readings (AMRs)
• Water pressure recorded by pressure cells
• Real-time water quality (turbidity, pH, temperature,
chlorine, conductivity)
• Water leakage history
• Water contamination
Sewer Pipes • Hydraulic specifications (e.g. slope, roughness,
velocity) Valves
Pumps
Meters
Fittings and
gaskets
Siphons
Sewer monitoring system • Monitoring: water level or flow rate sensory data
and history, water quality (turbidity, temperature,
pH), water leakage, sewer gas leakage
Gas Pipes • Types of sensors
• Gas detection system instruction Valves
Compressors
Meters
Fittings
Pressure cells
and regulators
Splitters
Gas monitoring system • Gas monitoring system detecting data: gas leakage
and measured gas pressure, density, temperature,
and flow rate
Note: All pipes have supports or hangers, and indication signs
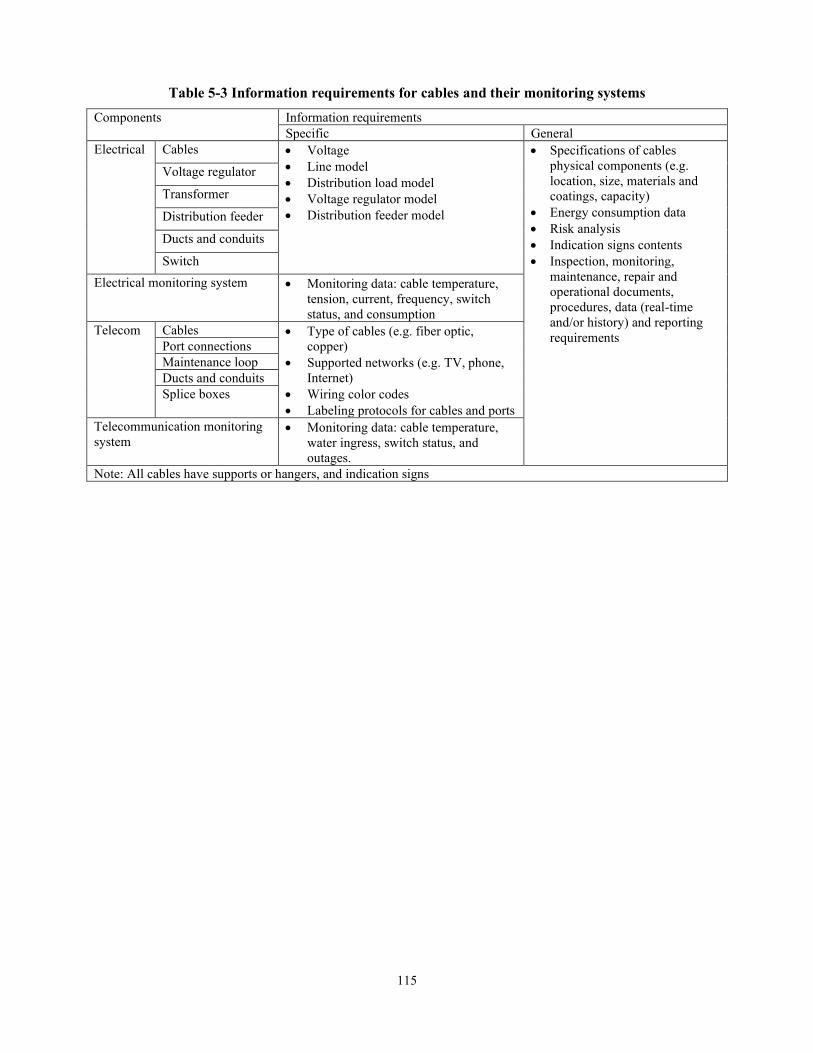
115
Table 5-3 Information requirements for cables and their monitoring systems
Components Information requirements
Specific General
Electrical Cables • Voltage
• Line model
• Distribution load model
• Voltage regulator model
• Distribution feeder model
• Specifications of cables
physical components (e.g.
location, size, materials and
coatings, capacity)
• Energy consumption data
• Risk analysis
• Indication signs contents
• Inspection, monitoring,
maintenance, repair and
operational documents,
procedures, data (real-time
and/or history) and reporting
requirements
Voltage regulator
Transformer
Distribution feeder
Ducts and conduits
Switch
Electrical monitoring system • Monitoring data: cable temperature,
tension, current, frequency, switch
status, and consumption
Telecom Cables • Type of cables (e.g. fiber optic,
copper)
• Supported networks (e.g. TV, phone,
Internet)
• Wiring color codes
• Labeling protocols for cables and ports
Port connections
Maintenance loop
Ducts and conduits
Splice boxes
Telecommunication monitoring
system • Monitoring data: cable temperature,
water ingress, switch status, and
outages.
Note: All cables have supports or hangers, and indication signs

116
Table 5-4 Information requirements for MUT ancillary facilities
Components Information requirements
Specific General
Main sensory
systems
Structural health monitoring (SHM)
system • Structure deformation and displacement
monitoring by optical fiber sensors
• Specifications of physical
components (e.g. location, size,
materials, capacity)
• System technical documents (i.e.
manuals, guides, photos, videos)
• Energy consumption data
• Indication signs contents
• Inspection, monitoring, maintenance,
repair, and operational documents,
procedures, data (real-time and/or
history) and reporting requirements
Access control and geo-localization
control system
• Tunnel access history (ingress/egress time and
location, the identity of users)
• Staff members information (identity, contact,
hierarchy, and authorized area in the tunnel)
• Human presence tracking data (real-time and
history)
Environmental monitoring system • Sensors types and specifications
• Temperature data
• Humidity data
• Air quality (oxygen, smoke, fire, air
contamination) data
• Overflow/water infiltration detection data
• Alarm specifications and locations
HVAC system Temperature and airspeed setting
control • Ducting network specifications
• Heating and cooling system specifications
• Airflow rate data
• Temperature data
• Air pump specifications
• Ventilation mode (indoor circulation, fresh air)
• Air filter and register vent specifications
Air pumps
Air ducts
Air filters
Heating system
Cooling system
Register vents
Drainage system Pipes • Water pump Specifications
• Pipes and/or canals specifications
• Drainage capacity
• Water flow rate real-time data
Canals
Drainage grates
Water pumps
Lighting system Cables • Distribution model
• Type of lights
• Type of sensors
• Voltage
Switches
Ducts and conduits
Sensors

117
Table 5-4 Information requirements for MUT ancillary facilities (Continued)
Components Information requirements
Specific General
Power supply system Cables • Voltage
• Line model
• Supporting ancillary facilities
• Power outlets locations and specifications
• Specifications of physical components
(e.g. location, size, materials,
capacity)
• System technical documents (i.e.
manuals, guides, photos, videos)
• Energy consumption data
• Indication signs contents
• Inspection, monitoring, maintenance,
repair, and operational documents,
procedures, data (real-time and/or
history) and reporting requirements
Switches
Ducts and conduits
Power outlets
Security monitoring and
alarm system
Security cameras • Security cameras specifications and locations
• Alarm specifications and locations
• Sensors specifications and locations
Alarm
Sensors
Fire extinguishing
system
Sprinkler • CO2 or clean agent/inert fire suppression system
• Sprinkler specifications and locations
• Water supply system specifications
• Ventilation specifications
Water supply system
Pipes
Valves
CO2 or clean agent/inert
gas cylinder
Hoisting system Engine • Load capacity
• Type (e.g. hydraulic, chain, cable)
• Spatial coverage
• Engine and mechanical equipment specifications
Mechanical equipment
Rail
Communication system Industrial telephone • Specifications and locations of industrial telephone,
access points, cables, and wireless system
• Authorization level
Access point
Cables
Wireless system
Note: All the ancillary facilities have supports or hangers, and indication signs
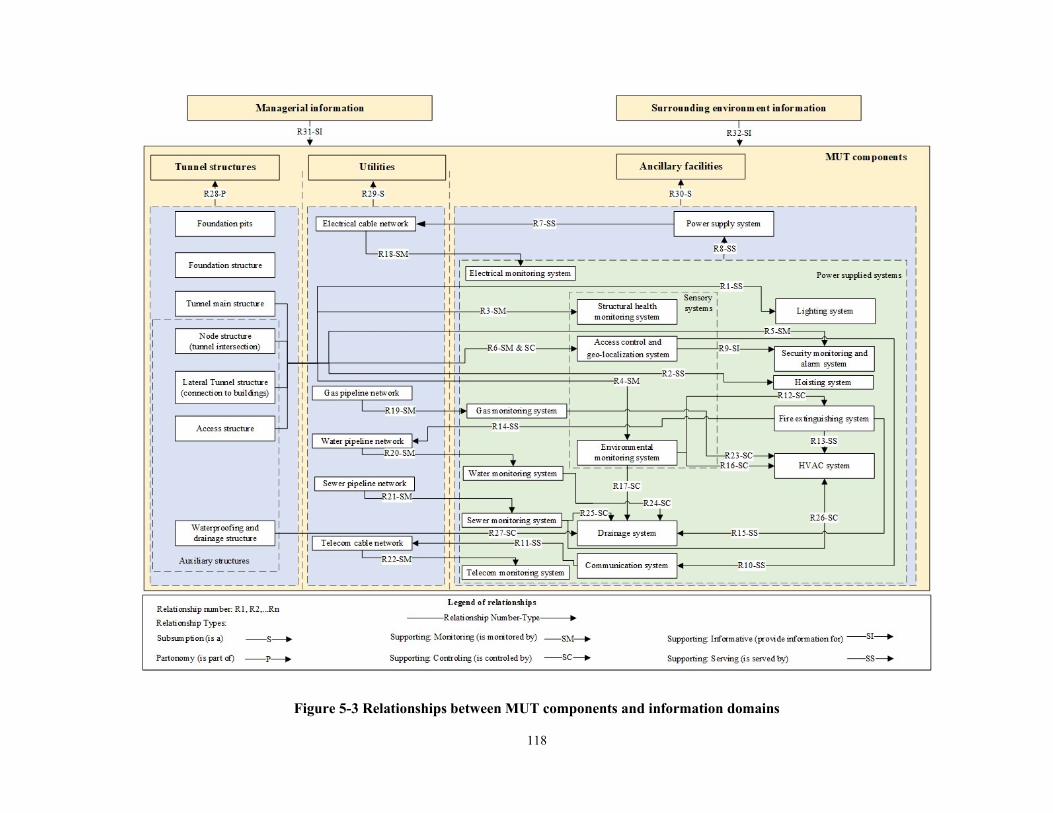
118
Figure 5-3 Relationships between MUT components and information domains
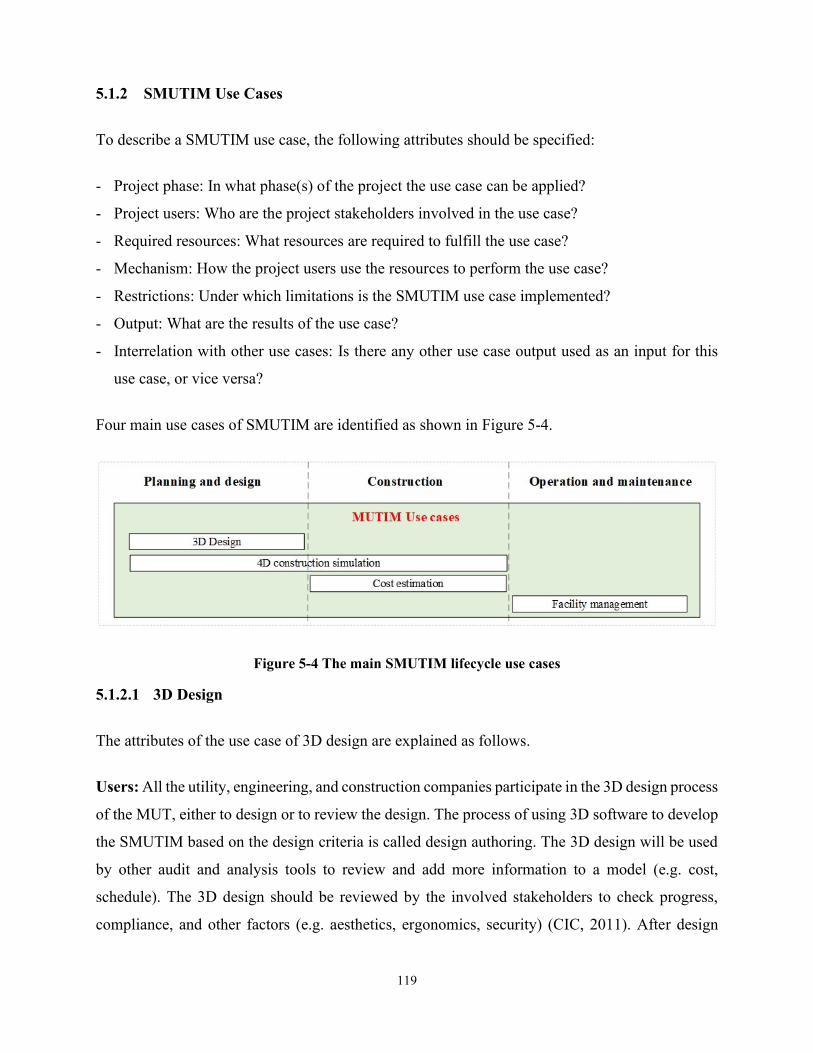
119
5.1.2 SMUTIM Use Cases
To describe a SMUTIM use case, the following attributes should be specified:
- Project phase: In what phase(s) of the project the use case can be applied?
- Project users: Who are the project stakeholders involved in the use case?
- Required resources: What resources are required to fulfill the use case?
- Mechanism: How the project users use the resources to perform the use case?
- Restrictions: Under which limitations is the SMUTIM use case implemented?
- Output: What are the results of the use case?
- Interrelation with other use cases: Is there any other use case output used as an input for this
use case, or vice versa?
Four main use cases of SMUTIM are identified as shown in Figure 5-4.
Figure 5-4 The main SMUTIM lifecycle use cases
5.1.2.1 3D Design
The attributes of the use case of 3D design are explained as follows.
Users: All the utility, engineering, and construction companies participate in the 3D design process
of the MUT, either to design or to review the design. The process of using 3D software to develop
the SMUTIM based on the design criteria is called design authoring. The 3D design will be used
by other audit and analysis tools to review and add more information to a model (e.g. cost,
schedule). The 3D design should be reviewed by the involved stakeholders to check progress,
compliance, and other factors (e.g. aesthetics, ergonomics, security) (CIC, 2011). After design
120
models from all stakeholders are integrated, any physical clash between the MUT components
should be detected and resolved using clash detection software (CIC, 2011; Indiana University,
2015).
Resources: To design an MUT, engineering and utility companies need design software with clash
detection functionality and skilled personnel. To review the design, and clash detection and
resolution, an integrated information model of MUT combined with GIS is required. The
standards, codes, and regulations regarding the MUT, ancillary systems, and utilities for design,
construction, operation, and safety are needed. In addition to the software, interactive review
space, and hardware with the capability of processing large model files are required (CIC, 2011).
Mechanism: The design authoring, review, and clash detection and resolution process includes
the following activities:
• Design authoring: The civil engineering company designs the MUT structure and the other
engineering companies design the ancillary facilities within the MUT structure. The utility
companies design their own utility networks. The design process should consider a pre-defined
layout of ancillary facilities and utilities inside the MUT to avoid conflicts. At the final stage,
all the designed models should in combined to create a single integrated SMUTIM which can
be added to the surrounding environment GIS 3D map (i.e. terrain model including streets,
buildings).
• Safety review: After a primary design is completed, it should be checked for compliance with
safety codes and concerns. For example, to improve safety by reducing the risk of fires and
explosions, safety buffers should be provided for certain utilities (e.g. gas pipes and electrical
cables). In addition, environmental monitoring, fire extinguishing, and HVAC systems should
be designed according to the standards.
• Constructability review: The designed MUT, ancillary facilities, and utilities should be
checked for constructability. The construction method (e.g. cast-in-place or modular concrete
elements) should be decided based on the project conditions and reflected in the design. The
access structures and main tunnel structure should be large enough to allow the movement of
humans, equipment, and utilities during construction. The required clearance between utilities
121
for the installation phase should be provided. If the gravity sewer system is part of MUT, the
needed slope should be designed.
• Clash detection and resolution: The integrated SMUTIM should be imported to the clash
detection program (e.g. Navisworks) for detecting the clashes. The clashes can be the result of
the collision of components or not respecting the safety buffers (i.e. soft clashes). The
identified clashes are documented in a report and reviewed in a meeting with the committee.
The solutions should consider safety and constructability.
• Operation and Maintenance (O&M) review: Access to utilities inside the MUT for
maintenance activities during the operation phase should be provided with enough space for
the movement of personnel and equipment (CIC, 2011). Ergonomic design considerations for
the comfort of the labor movement inside the MUT are the other aspects of the review.
Restrictions: The restrictions of 3D design use case include: (1) restrictions from utility users (e.g.
physical limitations for MUT lateral connections to buildings, technical limitations for connecting
utilities to buildings), (2) legal restrictions (e.g. liability of users), (3) geographic restrictions, and
(4) the limited space of MUTs for installation and maintenance activities as the main limitation of
clash resolution.
Output: The output is the integrated SMUTIM.
Interrelation(s): The designed SMUTIM supports all other use cases (i.e. construction simulation,
cost estimation, and facility management).
5.1.2.2 4D Construction Simulation
The time dimension can be added to the SMUTIM to integrate the construction schedule of MUT
with the model elements. The construction process of MUT is simulated using an appropriate
software application.
Users: The construction company is the main user of 4D construction simulation. The utility
companies will benefit from this process if they are involved in the installation of their own utility
networks in the MUT.
Resources: The team of construction coordinators should have the SMUTIM. The required human
resources, equipment, and schedule of the MUT construction method are needed.
122
Mechanism:
• Importing SMUTIM and GIS model: The SMUTIM and GIS model of the project location
should be imported and combined in the construction simulation software.
• Adding equipment and human resources: The required equipment (e.g. trucks, excavators,
cranes), and human resources should be added to the simulation.
• Link schedule: The construction schedule should be linked with the construction elements (i.e.
MUT components, and equipment).
• Construction simulation and coordination: Simulation software is used to check
constructability and safety requirements.
Restrictions: The main restrictions to consider in the 4D construction simulation of MUT include:
• Safety requirements: Different safety requirements can be better managed by visualization in
the 4D construction simulation. The safe distance between (a) labors and equipment with pits
to avoid falling in pits, (b) equipment with labors and other equipment (i.e. work zones) to avoid
collisions, and (c) equipment and surrounding environment to avoid collisions with surrounding
structures (e.g. buildings, traffic signs), are the main safety concerns that can be better
controlled by the simulation process.
• Traffic requirements: Certain traffic restrictions should be considered in construction
simulation. These restrictions include (a) allowed durations and areas of partial street closures,
(b) allowed detour roads, (c) maximum street capacity (i.e. dimensions, pavement bearing load),
and (d) allowed working hours.
Output: The output includes the simulation of the construction process.
Interrelations: The SMUTIM and GIS model are inputs of the 4D construction simulation. This
process affects the cost estimation process by affecting the usage of some project resources (e.g.
human resources, machinery, and equipment).
5.1.2.3 Cost Estimation
Construction cost estimation of MUT projects can benefit from SMUTIM by automated quantity
takeoff, which reflects the effects of changes, additions, and modifications on the cost. Cost data
can be added to the 4D SMUTIM to track the budget during the construction phase (CIC, 2011).
123
Users: The MUT project stakeholders involved in the process of cost estimation include all the
utility and construction companies.
Resources: The required resources include model-based cost estimating software, design model
with enough level of detail, and cost data (e.g. MasterFormat, Uniformat data, RSMeans).
According to CIC (2011), cost estimation is based on the ability to extract quantities from the
model for the needed estimating level (e.g. rough order of magnitude).
Mechanism: The cost estimation includes the following steps.
• Quantity take-off: The SMUTIM can represent a certain Level of Development (LOD)
depending on the stage of the project. DDC (2012) defined five LODs. Higher LOD results in
more accurate cost estimation.
• Adding cost data: The cost of each MUT component should be added to the cost estimation
software. There are cost databases (e.g. RSMeans in the construction industry) that help
professionals in cost estimation and creating budgets. Other ways for estimating the costs of
MUT components are price quotations from the suppliers and the contractors, and expert
judgment.
• Construction cost estimation: By having the MUT components quantities and their costs, cost
estimation can be automated using specialized software. Those processes can save the time of
cost estimators and increase accuracy.
Restrictions: The restrictions of cost estimation are: (1) LOD: the accuracy of cost estimation
depends on the LOD and increases as more design details are available; (2) cost data: availability
of cost databases, price quotations, and accuracy of expert judgments; (3) location conditions:
concurrent development projects to be synchronized, type of soil, hydrological conditions, slope,
and locations of surrounding structures/natural barriers.
Output: The output is the estimated construction cost of MUT for utility companies and the
society (i.e. social cost).
Interrelation(s): The design process provides the SMUTIM, which can be used for quantity take-
off. The 4D construction simulation gives the schedule of activities, which influences construction
costs estimation.
124
5.1.2.4 Facility Management
SMUTIM capability in storing lifecycle information of MUT components is valuable for facility
management. However, the SMUTIM cannot store a large volume of data (e.g. real-time
monitoring sensory data) and should be linked with other external databases to improve facility
management. For example, Theiler and Smarsly (2018) emphasized on linking sensory data of the
SHM system with external databases.
Users: The operators of MUT (i.e. utility companies) are the main users of the facility management
process.
Resources: The required resources include (a) an up-to-date SMUTIM, (b) 3D GIS model of MUT
surrounding environment, (c) facility management systems (e.g. sensory monitoring systems,
security systems), and (d) facility managers able to work with BIM-based systems.
Mechanism: The mechanism of SMUTIM based facility management can be clarified by defining
the application of SMUTIM, and how SMUTIM can be linked with facility management systems.
The required information includes:
• MUT component static information: The static information about MUT components (e.g.
location, technical specifications, materials, manuals, vendors information) can be stored in the
SMUTIM.
• Inspection, maintenance, and repair history: The information about inspection, maintenance,
and repair of MUT structure, utilities, and ancillary systems should be stored in BIM software
or the linked database systems. The history is updated during the operation period and can assist
in facility management.
• Real-time monitoring data: The monitoring data is too huge to be stored in SMUTIM
software. These data can be stored in separate databases and represented in user interfaces
designed for facility management.
Restrictions: The restrictions of a SMUTIM facility management system include (1) managing
the huge volume of data: although database systems can host a large amount of data, designing
systems for the analysis and representation of information is challenging, (2) quality control: some
information can be added manually to the SMUTIM (e.g. inspection, maintenance, and repair
125
history). However, the quality of this information should follow standardized information
requirements.
Output: The output includes all information and data in the operation and maintenance phase of
MUT.
Interrelation(s): The facility management system receives the updated SMUTIM from the 3D
design process to link information to the MUT components.
5.1.3 IFC Extension to Accommodate SMUTIM
After organizing MUT information requirements as explained in Section 5.1.1, the following steps
are needed to extend IFC to MUT: development of MVD, new IFC entities, properties, and
relationships. The focus of this research is to extend IFC for the physical and spatial components
of MUT. Therefore, this research presents a partial implementation of IFC for MUT and further
IFC extension efforts are needed to cover non-physical components and software implementation,
testing, and certification. Some IFC entities, especially for utilities and systems, are reusable for
MUT (e.g. IfcSensorTypeEnum, IfcPipeSegment, IfcCableSegment) and some only need to add
sub-classes for meeting MUT requirements.
5.1.3.1 Model View Definition
The information requirements are captured using Model View Definition (MVD) (Ghaznavi,
2013). MVD is the set of information exchange requirements for the data flow between business
processes at a specific stage of the project using relevant information of the model. Information
Delivery Manual (IDM) can be used to extend the available IFC schema by extending available
entities or creating new entities (Wix and Karlshoej, 2010). The requirements for MUT lifecycle
information modeling are organized in MVD for future IFC extension as shown in Figure 5-5. The
physical components are the newly defined physical element of an MUT (i.e. tunnel structure,
utilities, and ancillary facilities). These physical components are divided into more detailed
elements. For example, auxiliary structures include lateral tunnel structure, node structure,
waterproofing and drainage; and access structure is divided into material port, human access port,
and ventilation manhole.
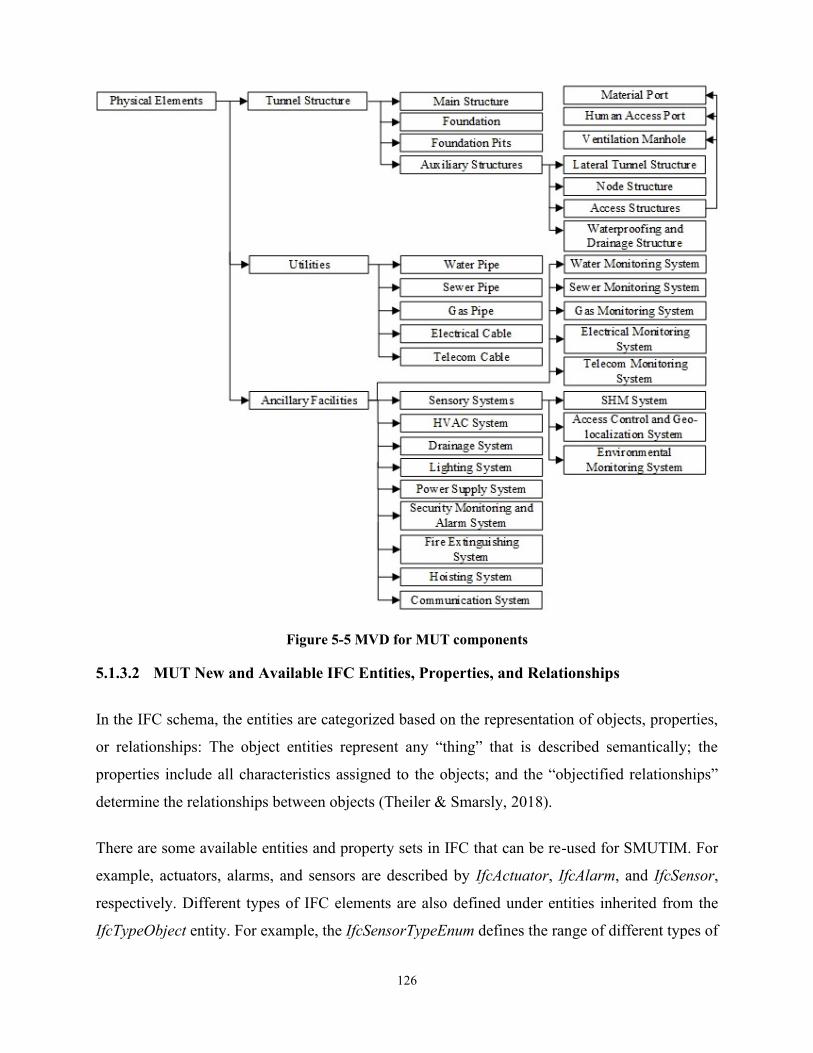
126
Figure 5-5 MVD for MUT components
5.1.3.2 MUT New and Available IFC Entities, Properties, and Relationships
In the IFC schema, the entities are categorized based on the representation of objects, properties,
or relationships: The object entities represent any “thing” that is described semantically; the
properties include all characteristics assigned to the objects; and the “objectified relationships”
determine the relationships between objects (Theiler & Smarsly, 2018).
There are some available entities and property sets in IFC that can be re-used for SMUTIM. For
example, actuators, alarms, and sensors are described by IfcActuator, IfcAlarm, and IfcSensor,
respectively. Different types of IFC elements are also defined under entities inherited from the
IfcTypeObject entity. For example, the IfcSensorTypeEnum defines the range of different types of
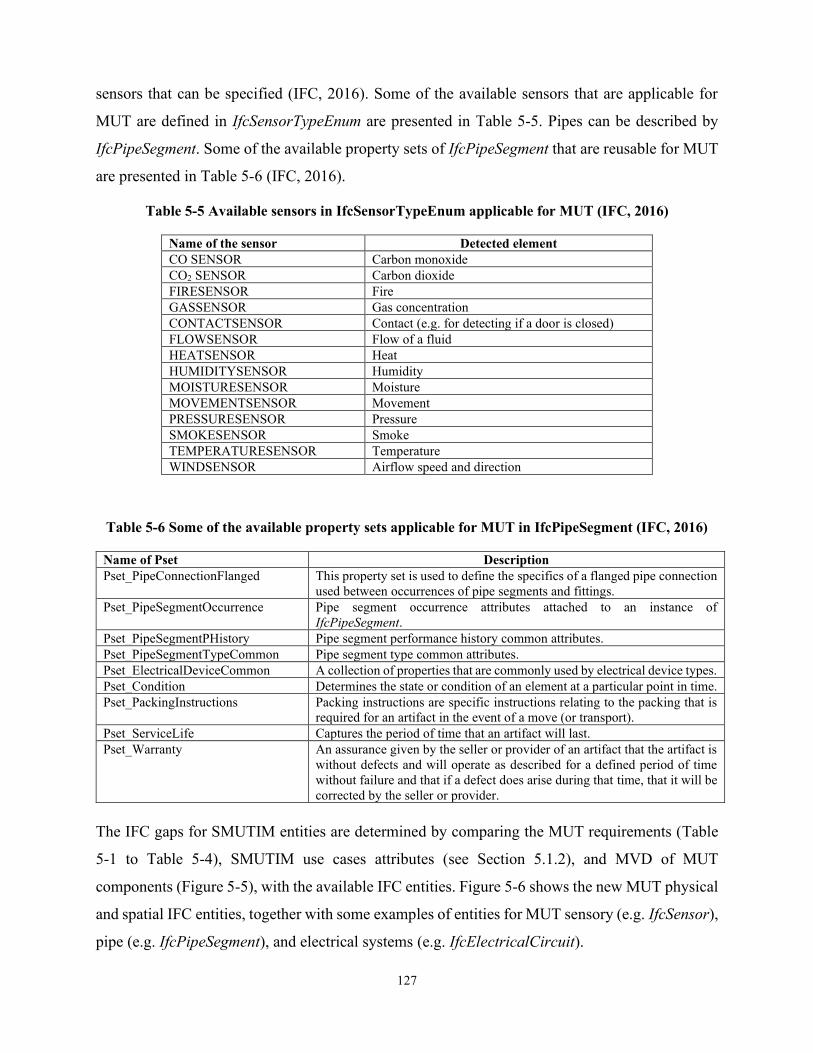
127
sensors that can be specified (IFC, 2016). Some of the available sensors that are applicable for
MUT are defined in IfcSensorTypeEnum are presented in Table 5-5. Pipes can be described by
IfcPipeSegment. Some of the available property sets of IfcPipeSegment that are reusable for MUT
are presented in Table 5-6 (IFC, 2016).
Table 5-5 Available sensors in IfcSensorTypeEnum applicable for MUT (IFC, 2016)
Name of the sensor Detected element
CO SENSOR Carbon monoxide
CO2 SENSOR Carbon dioxide
FIRESENSOR Fire
GASSENSOR Gas concentration
CONTACTSENSOR Contact (e.g. for detecting if a door is closed)
FLOWSENSOR Flow of a fluid
HEATSENSOR Heat
HUMIDITYSENSOR Humidity
MOISTURESENSOR Moisture
MOVEMENTSENSOR Movement
PRESSURESENSOR Pressure
SMOKESENSOR Smoke
TEMPERATURESENSOR Temperature
WINDSENSOR Airflow speed and direction
Table 5-6 Some of the available property sets applicable for MUT in IfcPipeSegment (IFC, 2016)
Name of Pset Description
Pset_PipeConnectionFlanged This property set is used to define the specifics of a flanged pipe connection
used between occurrences of pipe segments and fittings.
Pset_PipeSegmentOccurrence Pipe segment occurrence attributes attached to an instance of
IfcPipeSegment.
Pset_PipeSegmentPHistory Pipe segment performance history common attributes.
Pset_PipeSegmentTypeCommon Pipe segment type common attributes.
Pset_ElectricalDeviceCommon A collection of properties that are commonly used by electrical device types.
Pset_Condition Determines the state or condition of an element at a particular point in time.
Pset_PackingInstructions Packing instructions are specific instructions relating to the packing that is
required for an artifact in the event of a move (or transport).
Pset_ServiceLife Captures the period of time that an artifact will last.
Pset_Warranty An assurance given by the seller or provider of an artifact that the artifact is
without defects and will operate as described for a defined period of time
without failure and that if a defect does arise during that time, that it will be
corrected by the seller or provider.
The IFC gaps for SMUTIM entities are determined by comparing the MUT requirements (Table
5-1 to Table 5-4), SMUTIM use cases attributes (see Section 5.1.2), and MVD of MUT
components (Figure 5-5), with the available IFC entities. Figure 5-6 shows the new MUT physical
and spatial IFC entities, together with some examples of entities for MUT sensory (e.g. IfcSensor),
pipe (e.g. IfcPipeSegment), and electrical systems (e.g. IfcElectricalCircuit).
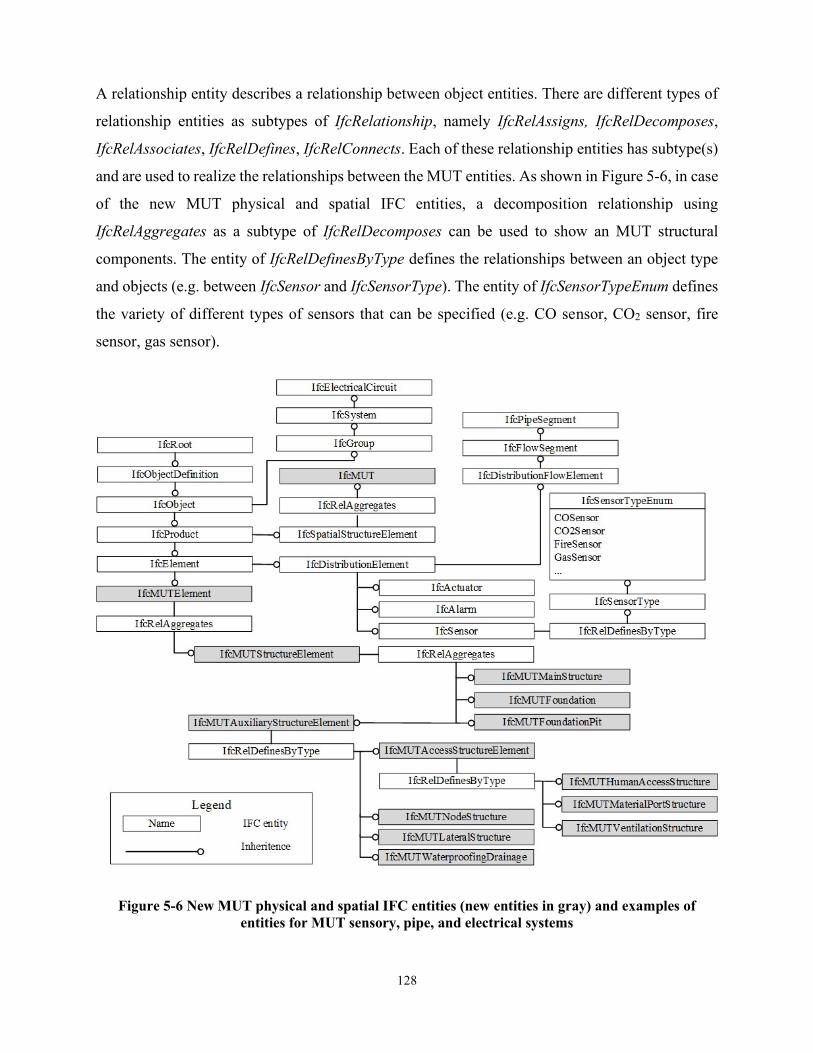
128
A relationship entity describes a relationship between object entities. There are different types of
relationship entities as subtypes of IfcRelationship, namely IfcRelAssigns, IfcRelDecomposes,
IfcRelAssociates, IfcRelDefines, IfcRelConnects. Each of these relationship entities has subtype(s)
and are used to realize the relationships between the MUT entities. As shown in Figure 5-6, in case
of the new MUT physical and spatial IFC entities, a decomposition relationship using
IfcRelAggregates as a subtype of IfcRelDecomposes can be used to show an MUT structural
components. The entity of IfcRelDefinesByType defines the relationships between an object type
and objects (e.g. between IfcSensor and IfcSensorType). The entity of IfcSensorTypeEnum defines
the variety of different types of sensors that can be specified (e.g. CO sensor, CO2 sensor, fire
sensor, gas sensor).
Figure 5-6 New MUT physical and spatial IFC entities (new entities in gray) and examples of
entities for MUT sensory, pipe, and electrical systems
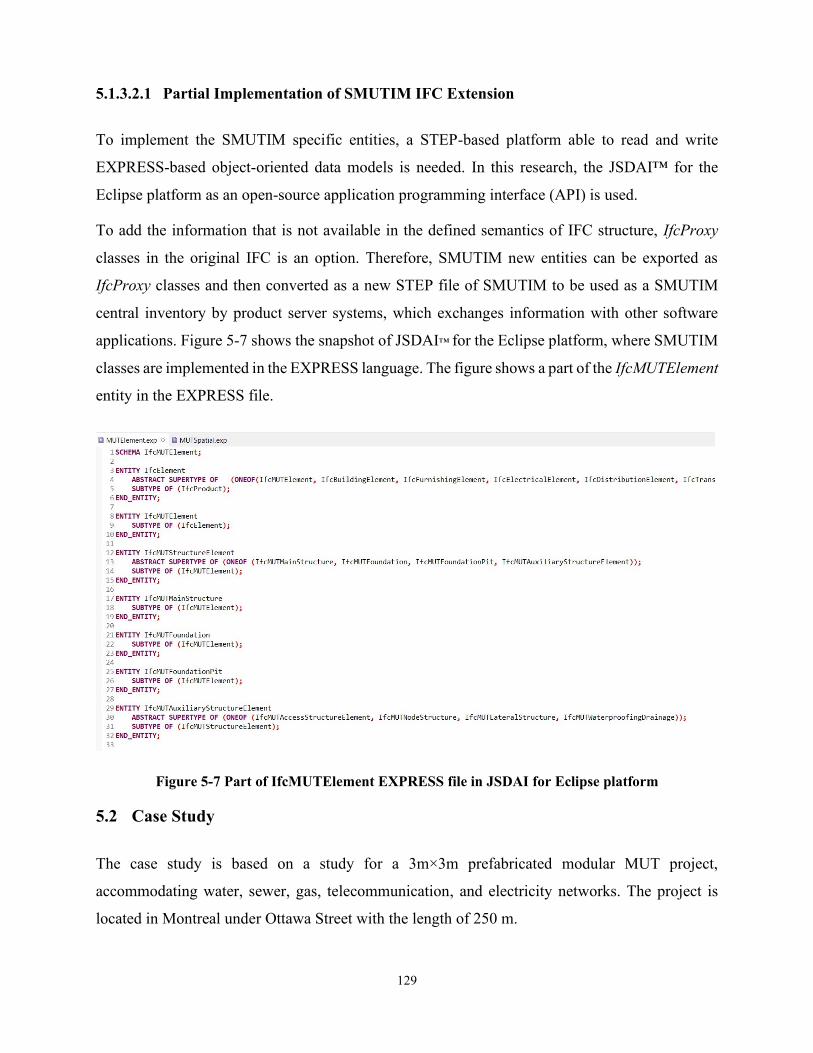
129
5.1.3.2.1 Partial Implementation of SMUTIM IFC Extension
To implement the SMUTIM specific entities, a STEP-based platform able to read and write
EXPRESS-based object-oriented data models is needed. In this research, the JSDAI™ for the
Eclipse platform as an open-source application programming interface (API) is used.
To add the information that is not available in the defined semantics of IFC structure, IfcProxy
classes in the original IFC is an option. Therefore, SMUTIM new entities can be exported as
IfcProxy classes and then converted as a new STEP file of SMUTIM to be used as a SMUTIM
central inventory by product server systems, which exchanges information with other software
applications. Figure 5-7 shows the snapshot of JSDAI™ for the Eclipse platform, where SMUTIM
classes are implemented in the EXPRESS language. The figure shows a part of the IfcMUTElement
entity in the EXPRESS file.
Figure 5-7 Part of IfcMUTElement EXPRESS file in JSDAI for Eclipse platform
5.2 Case Study
The case study is based on a study for a 3m×3m prefabricated modular MUT project,
accommodating water, sewer, gas, telecommunication, and electricity networks. The project is
located in Montreal under Ottawa Street with the length of 250 m.
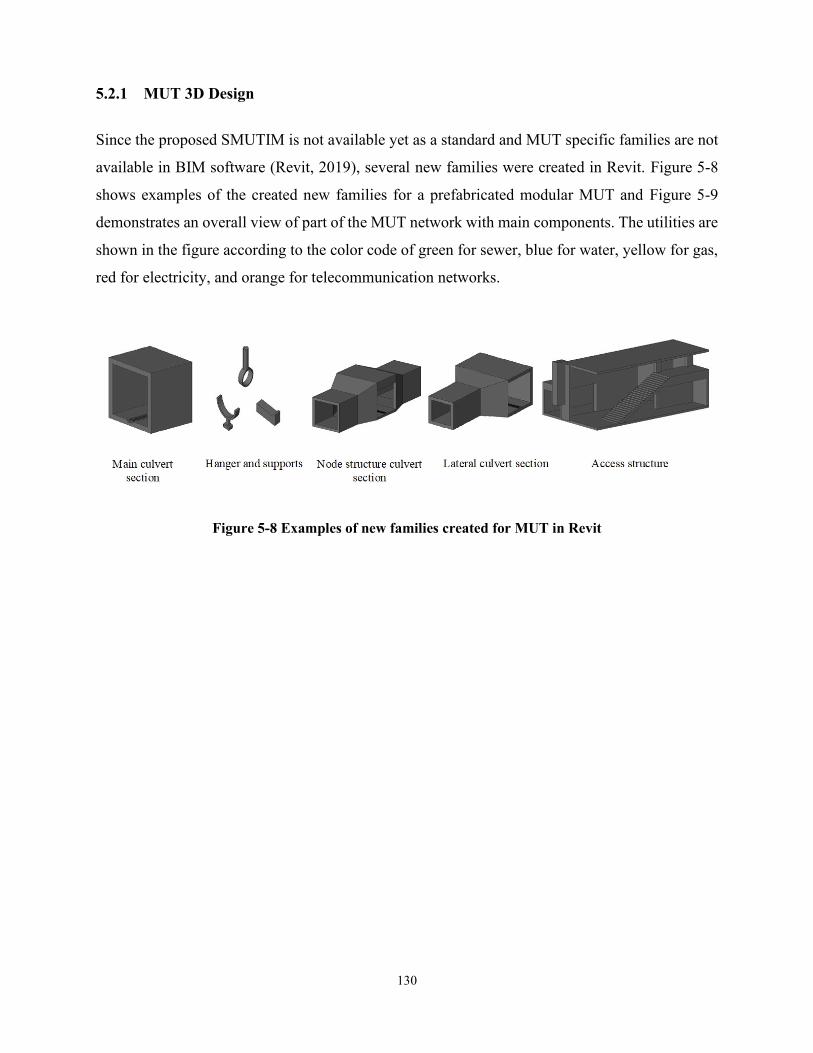
130
5.2.1 MUT 3D Design
Since the proposed SMUTIM is not available yet as a standard and MUT specific families are not
available in BIM software (Revit, 2019), several new families were created in Revit. Figure 5-8
shows examples of the created new families for a prefabricated modular MUT and Figure 5-9
demonstrates an overall view of part of the MUT network with main components. The utilities are
shown in the figure according to the color code of green for sewer, blue for water, yellow for gas,
red for electricity, and orange for telecommunication networks.
Figure 5-8 Examples of new families created for MUT in Revit
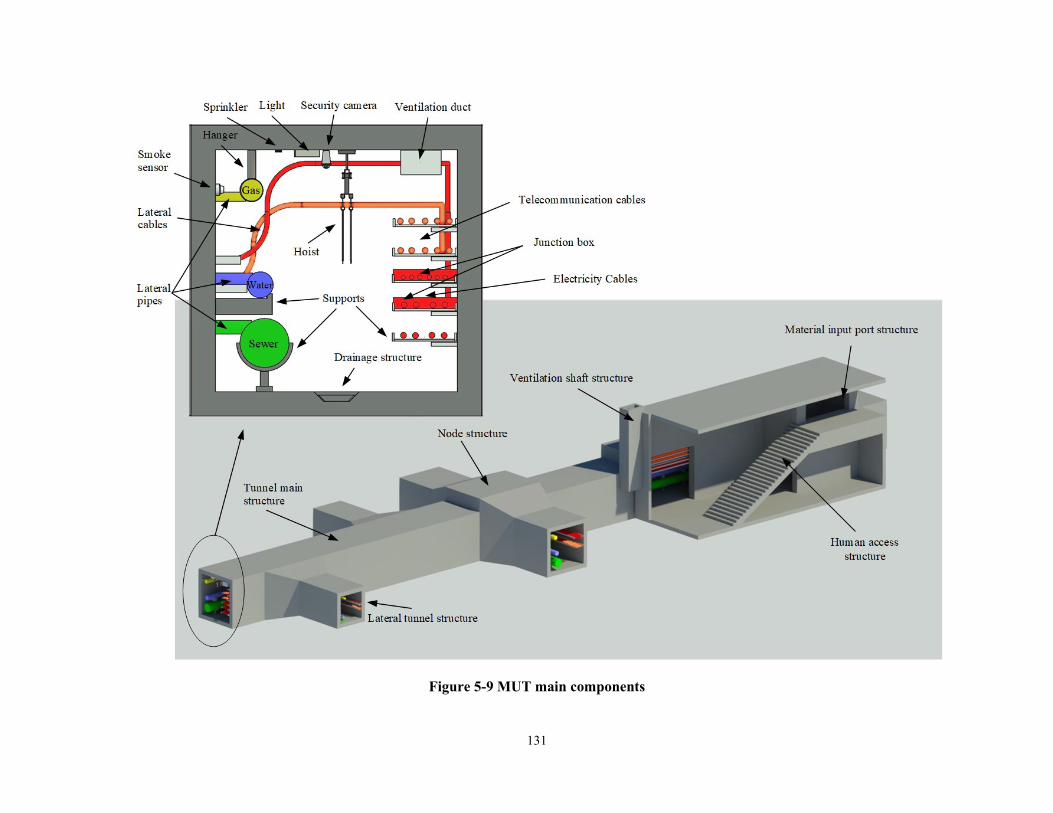
131
Figure 5-9 MUT main components
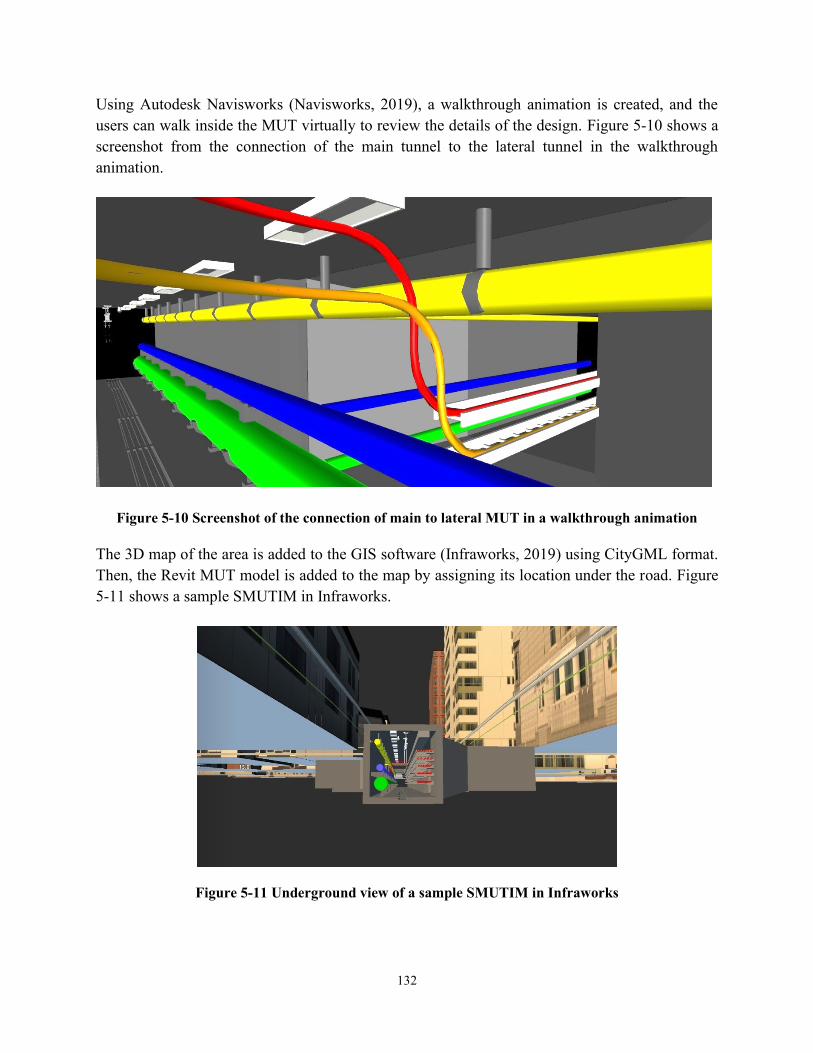
132
Using Autodesk Navisworks (Navisworks, 2019), a walkthrough animation is created, and the
users can walk inside the MUT virtually to review the details of the design. Figure 5-10 shows a
screenshot from the connection of the main tunnel to the lateral tunnel in the walkthrough
animation.
Figure 5-10 Screenshot of the connection of main to lateral MUT in a walkthrough animation
The 3D map of the area is added to the GIS software (Infraworks, 2019) using CityGML format.
Then, the Revit MUT model is added to the map by assigning its location under the road. Figure
5-11 shows a sample SMUTIM in Infraworks.
Figure 5-11 Underground view of a sample SMUTIM in Infraworks
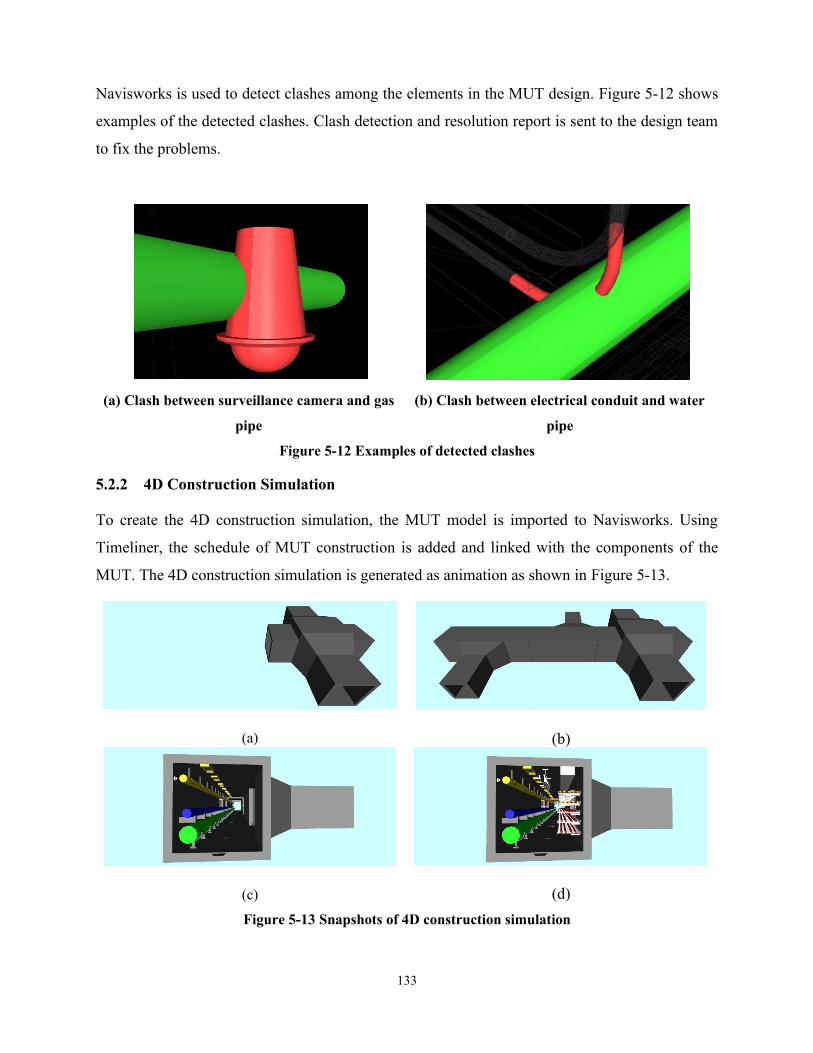
133
Navisworks is used to detect clashes among the elements in the MUT design. Figure 5-12 shows
examples of the detected clashes. Clash detection and resolution report is sent to the design team
to fix the problems.
(a) Clash between surveillance camera and gas
pipe
(b) Clash between electrical conduit and water
pipe
Figure 5-12 Examples of detected clashes
5.2.2 4D Construction Simulation
To create the 4D construction simulation, the MUT model is imported to Navisworks. Using
Timeliner, the schedule of MUT construction is added and linked with the components of the
MUT. The 4D construction simulation is generated as animation as shown in Figure 5-13.
(a)
(b)
(c)
(d)
Figure 5-13 Snapshots of 4D construction simulation
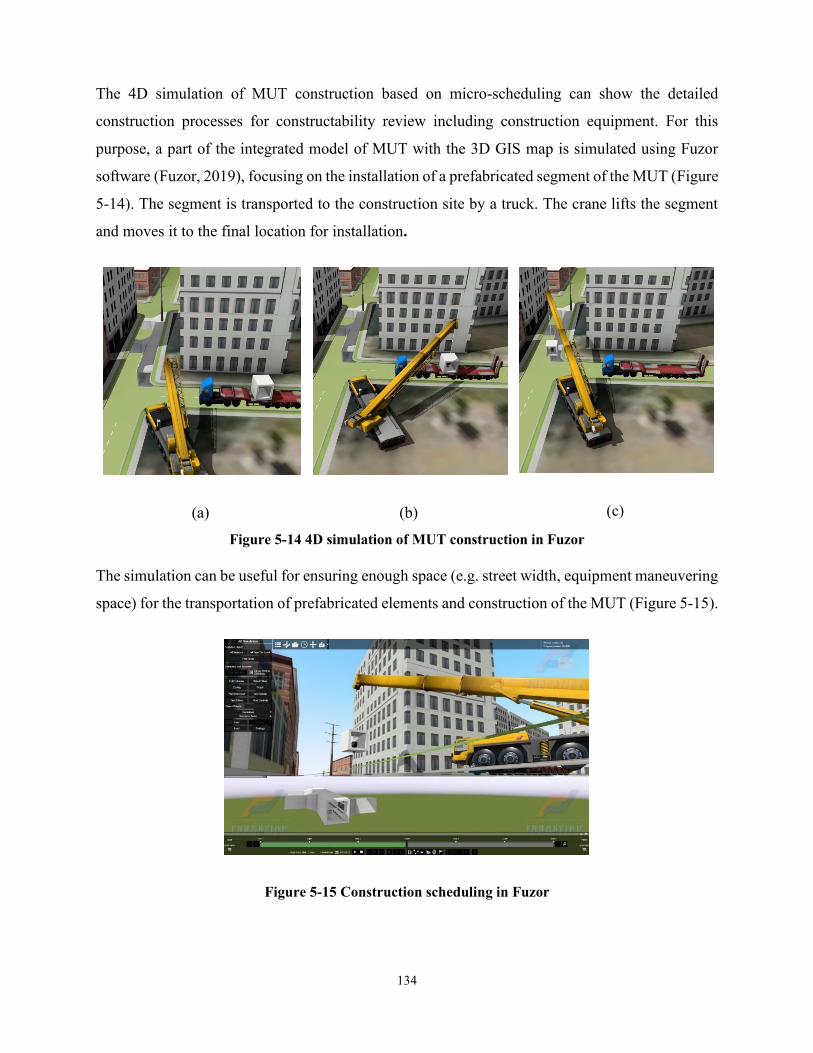
134
The 4D simulation of MUT construction based on micro-scheduling can show the detailed
construction processes for constructability review including construction equipment. For this
purpose, a part of the integrated model of MUT with the 3D GIS map is simulated using Fuzor
software (Fuzor, 2019), focusing on the installation of a prefabricated segment of the MUT (Figure
5-14). The segment is transported to the construction site by a truck. The crane lifts the segment
and moves it to the final location for installation.
(a)
(b)
(c)
Figure 5-14 4D simulation of MUT construction in Fuzor
The simulation can be useful for ensuring enough space (e.g. street width, equipment maneuvering
space) for the transportation of prefabricated elements and construction of the MUT (Figure 5-15).
Figure 5-15 Construction scheduling in Fuzor
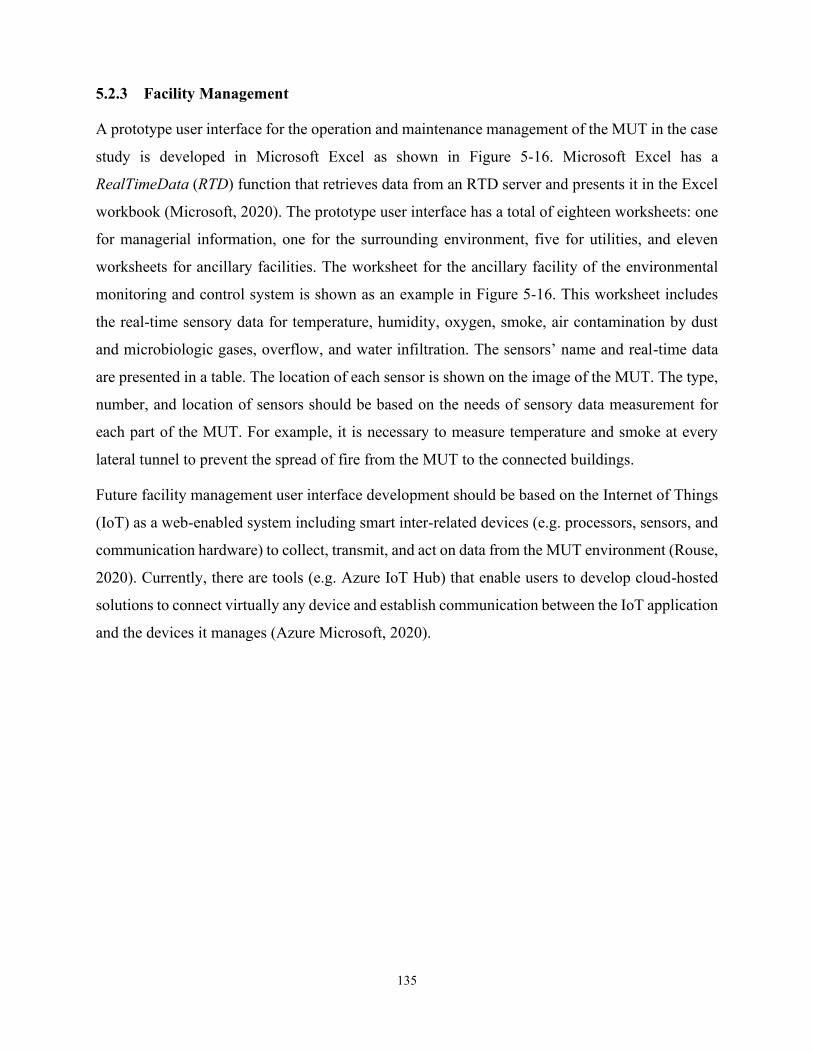
135
5.2.3 Facility Management
A prototype user interface for the operation and maintenance management of the MUT in the case
study is developed in Microsoft Excel as shown in Figure 5-16. Microsoft Excel has a
RealTimeData (RTD) function that retrieves data from an RTD server and presents it in the Excel
workbook (Microsoft, 2020). The prototype user interface has a total of eighteen worksheets: one
for managerial information, one for the surrounding environment, five for utilities, and eleven
worksheets for ancillary facilities. The worksheet for the ancillary facility of the environmental
monitoring and control system is shown as an example in Figure 5-16. This worksheet includes
the real-time sensory data for temperature, humidity, oxygen, smoke, air contamination by dust
and microbiologic gases, overflow, and water infiltration. The sensors’ name and real-time data
are presented in a table. The location of each sensor is shown on the image of the MUT. The type,
number, and location of sensors should be based on the needs of sensory data measurement for
each part of the MUT. For example, it is necessary to measure temperature and smoke at every
lateral tunnel to prevent the spread of fire from the MUT to the connected buildings.
Future facility management user interface development should be based on the Internet of Things
(IoT) as a web-enabled system including smart inter-related devices (e.g. processors, sensors, and
communication hardware) to collect, transmit, and act on data from the MUT environment (Rouse,
2020). Currently, there are tools (e.g. Azure IoT Hub) that enable users to develop cloud-hosted
solutions to connect virtually any device and establish communication between the IoT application
and the devices it manages (Azure Microsoft, 2020).
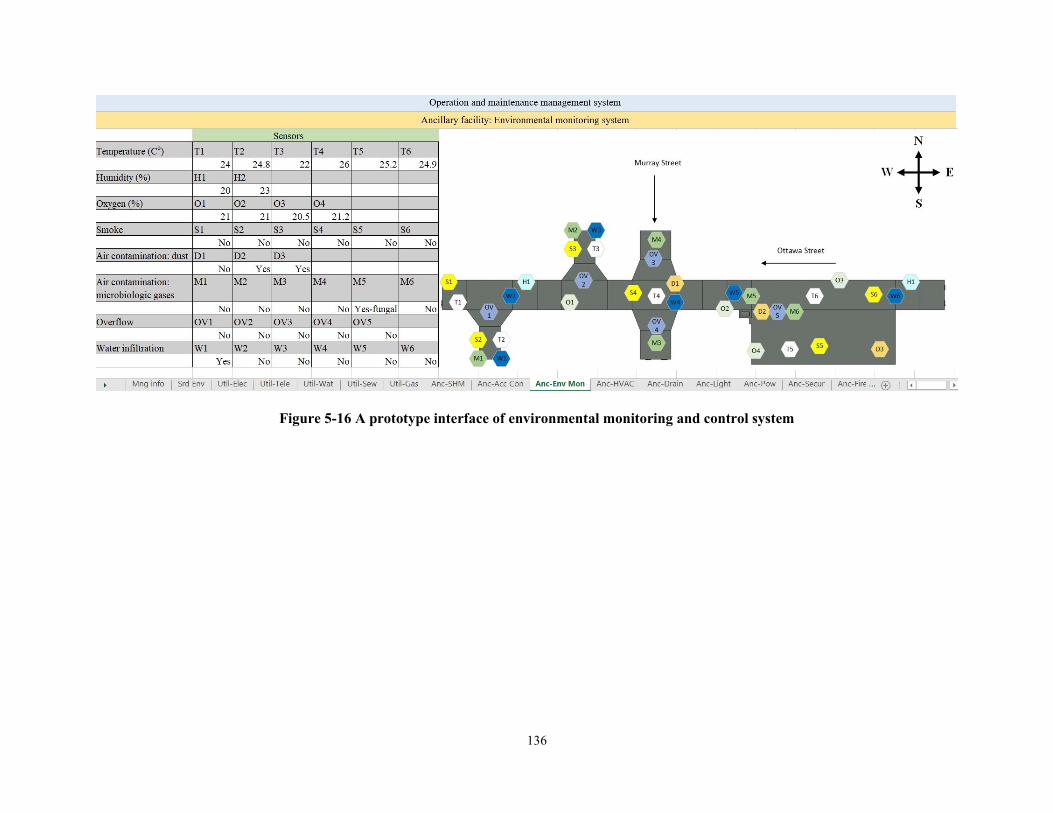
136
Figure 5-16 A prototype interface of environmental monitoring and control system
137
5.3 Summary and Conclusions
This chapter proposed a comprehensive framework for defining SMUTIM requirements, which
are categorized into five groups: (a) managerial, (b) surrounding environment, (c) tunnel structural
components, (d) utilities, and (e) ancillary facilities. The relationships between the information
groups are defined. This research extended the main BIM use cases applicable for MUT (i.e.
design, cost estimation, 4D construction simulation, and facility management) to SMUTIM. In
addition, a partial IFC extension to MUT is proposed. A case study is used to demonstrate the
applicability of the proposed framework. The results show that the proposed framework can
facilitate the design, construction, operation, and coordination of utility companies.
The contributions of this chapter are: (1) Categorizing and integrating MUT physical and
functional components and their relationships systematically; (2) Completing, integrating, and
organizing the available knowledge about SMUTIM use cases within the framework; (3) Using
the case study to show the capabilities and gaps of current BIM applications, GIS, databases, and
facility management tools for MUT lifecycle management; and (4) Partially extending IFC to
MUT by proposing MVD, new entities and relationships, and taking advantage of reusable IFC
entities, properties, and relationships. Future work should focus on fully extending IFC for
SMUTIM and extensively implementing and testing the proposed smart MUT information
framework. Also, future facility management user interface development should be based on IoT
as a web-enabled system.
138
CHAPTER 6. SUMMARY, CONSTRIBUTIONS AND FUTURE WORKS
6.1 Summary of Research
This thesis presented a comprehensive review of the related literature, the current research gaps,
the overview of the proposed approach, a detailed explanation of the proposed methods, and case
studies to show the applicability of the proposed methods.
The particular focus of the this research was on (a) improving MUT lifecycle economy assessment
by developing a comprehensive and systematic model for MUT and buried utilities LCC analysis
which considers factors of utility specifications, location conditions, and construction methods;
(b) improving lifecycle cost-sharing of MUTs by developing an MUT cost-sharing model to ensure
the decision-makers of utility companies that MUT is the economic method for their company and
that all the utility companies benefit from MUT fairly; and (c) improving coordination of utility
companies through a comprehensive framework for defining SMUTIM requirements, use cases,
and partial IFC extension.
6.2 Research Contributions and Conclusions
The research contributions to the body of knowledge are:
(1) Developing a comprehensive and systematic model for MUT and buried utilities LCC analysis
by considering the factors of utility specifications, location conditions, and
construction/maintenance methods. The output of this model estimates the LCC of MUT and
buried utilities. The proposed model can justify whether an MUT project is an economic
alternative method for buried utilities. It can be concluded that:
• The influence of factors on the LCC of MUT and buried utilities can differ significantly
case by case;
• The LCC of MUT must be less than that of buried utilities for the project and also for
each individual utility company to justify MUT.
(2) Developing an MUT cost-sharing method to ensure the decision-makers of utility companies
that MUT is the economical method for their company and also the benefits and costs of MUT
are distributed fairly among the utility companies. The fairness is defined based on three
139
principals: (a) balance of risk, (b) balanced benefit-cost ratio, and (c) balance in contributed
benefit and gained benefit. It can be concluded that:
• PBC and PUVO methods of cost-sharing are necessary, but not enough for a fair cost-
sharing;
• Risk adjustment provides fairness by proportionally allocating the cost of risk management
and responsibility of risk to the utility companies;
• BCR adjustment aims to improve fairness by balancing BCR of utility company based on
the logic that higher cost should result in higher benefit for a company, but with balanced
BCR;
• Balancing contributed and gained benefit encourages utility companies with high
contributed benefit but low gained benefit to participate in MUT.
(3) Categorizing and integrating smart MUT physical and functional components and their
relationships in a systematic way. Regarding this contribution the following conclusions can be
drawn:
• The proposed SMUTIM framework comprehensively categorized information
requirements into five groups: (a) managerial, (b) surrounding environment, (c) tunnel
structural components, (d) utilities, and (e) ancillary facilities.
• The relationships between the information groups are defined as: subsumption, partonomy,
and supporting relationships (i.e. monitoring, controlling, informative, serving).
(4) Completing, integrating, and organizing the available knowledge about SMUTIM use cases
within a framework. Then, using the case study to show the capabilities and gaps of current BIM
applications, GIS, databases, and facility management tools for MUT lifecycle management. The
following conclusion is achieved from this contribution:
• The description of SMUTIM use cases requirements (i.e. 3D design, cost estimation, 4D
construction simulation, and facility management) is improved by proposing their
comprehensive attributes in this research including: project phase, project users, required
resources, mechanism, restrictions, output, and interrelation with other use cases.
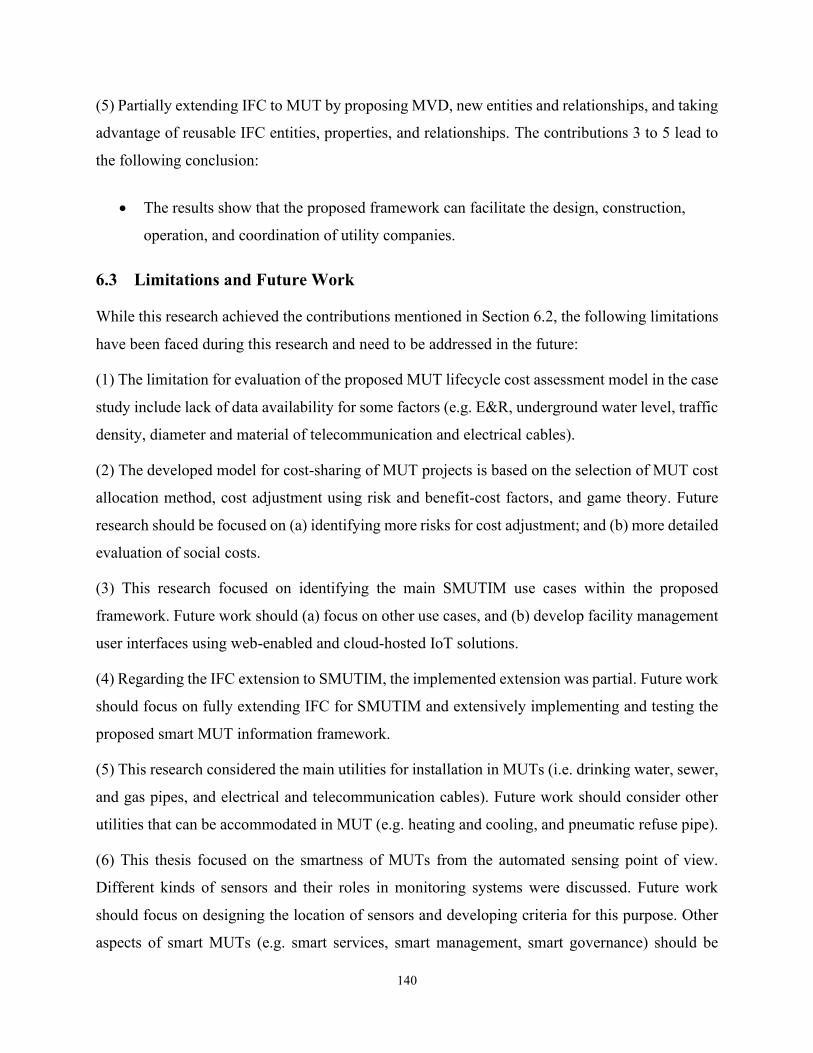
140
(5) Partially extending IFC to MUT by proposing MVD, new entities and relationships, and taking
advantage of reusable IFC entities, properties, and relationships. The contributions 3 to 5 lead to
the following conclusion:
• The results show that the proposed framework can facilitate the design, construction,
operation, and coordination of utility companies.
6.3 Limitations and Future Work
While this research achieved the contributions mentioned in Section 6.2, the following limitations
have been faced during this research and need to be addressed in the future:
(1) The limitation for evaluation of the proposed MUT lifecycle cost assessment model in the case
study include lack of data availability for some factors (e.g. E&R, underground water level, traffic
density, diameter and material of telecommunication and electrical cables).
(2) The developed model for cost-sharing of MUT projects is based on the selection of MUT cost
allocation method, cost adjustment using risk and benefit-cost factors, and game theory. Future
research should be focused on (a) identifying more risks for cost adjustment; and (b) more detailed
evaluation of social costs.
(3) This research focused on identifying the main SMUTIM use cases within the proposed
framework. Future work should (a) focus on other use cases, and (b) develop facility management
user interfaces using web-enabled and cloud-hosted IoT solutions.
(4) Regarding the IFC extension to SMUTIM, the implemented extension was partial. Future work
should focus on fully extending IFC for SMUTIM and extensively implementing and testing the
proposed smart MUT information framework.
(5) This research considered the main utilities for installation in MUTs (i.e. drinking water, sewer,
and gas pipes, and electrical and telecommunication cables). Future work should consider other
utilities that can be accommodated in MUT (e.g. heating and cooling, and pneumatic refuse pipe).
(6) This thesis focused on the smartness of MUTs from the automated sensing point of view.
Different kinds of sensors and their roles in monitoring systems were discussed. Future work
should focus on designing the location of sensors and developing criteria for this purpose. Other
aspects of smart MUTs (e.g. smart services, smart management, smart governance) should be
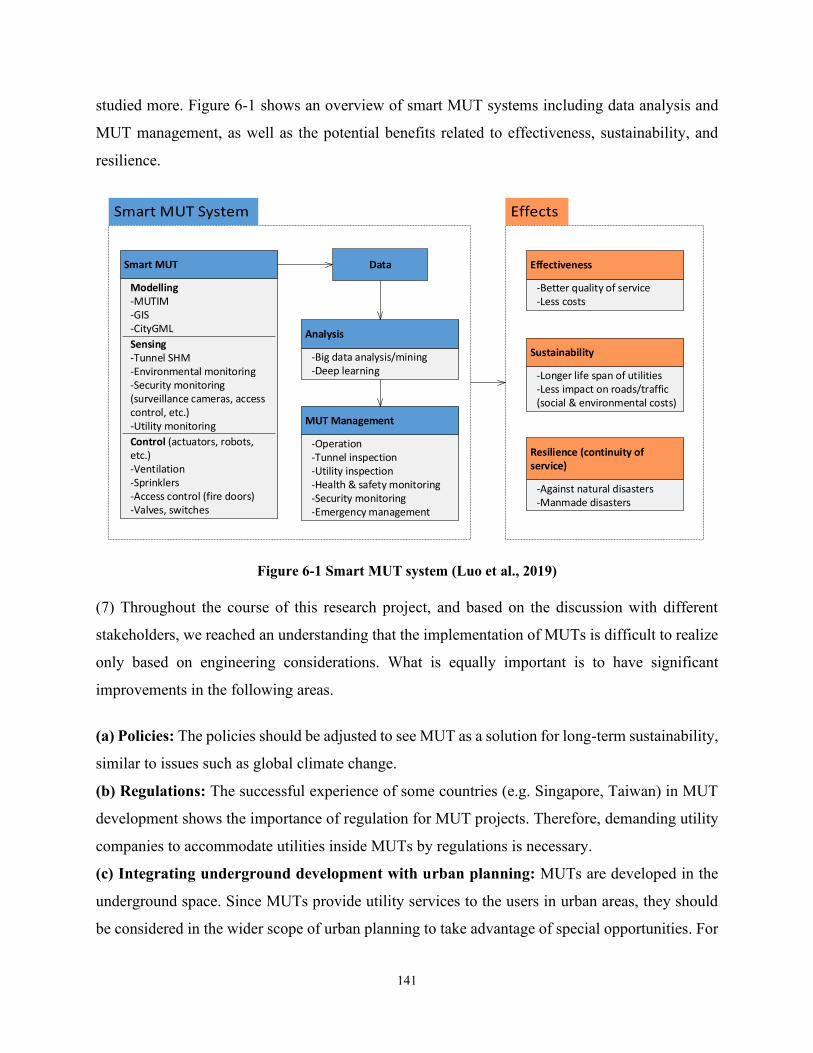
141
studied more. Figure 6-1 shows an overview of smart MUT systems including data analysis and
MUT management, as well as the potential benefits related to effectiveness, sustainability, and
resilience.
Analysis
-Big data analysis/mining-Deep learning
Smart MUT
Modelling-MUTIM-GIS-CityGML
Sensing-Tunnel SHM-Environmental monitoring-Security monitoring (surveillance cameras, access control, etc.)-Utility monitoring
Control (actuators, robots, etc.)-Ventilation-Sprinklers-Access control (fire doors)-Valves, switches
MUT Management
-Operation-Tunnel inspection-Utility inspection-Health & safety monitoring-Security monitoring-Emergency management
Effectiveness
-Better quality of service-Less costs
Data
Sustainability
-Longer life span of utilities-Less impact on roads/traffic (social & environmental costs)
Resilience (continuity of service)
-Against natural disasters-Manmade disasters
Figure 6-1 Smart MUT system (Luo et al., 2019)
(7) Throughout the course of this research project, and based on the discussion with different
stakeholders, we reached an understanding that the implementation of MUTs is difficult to realize
only based on engineering considerations. What is equally important is to have significant
improvements in the following areas.
(a) Policies: The policies should be adjusted to see MUT as a solution for long-term sustainability,
similar to issues such as global climate change.
(b) Regulations: The successful experience of some countries (e.g. Singapore, Taiwan) in MUT
development shows the importance of regulation for MUT projects. Therefore, demanding utility
companies to accommodate utilities inside MUTs by regulations is necessary.
(c) Integrating underground development with urban planning: MUTs are developed in the
underground space. Since MUTs provide utility services to the users in urban areas, they should
be considered in the wider scope of urban planning to take advantage of special opportunities. For

142
example, extending the metro network can be seen as an opportunity for synchronized
development of MUT. The development of MUTs should be integrated with urban planning to
avoid any conflict and to ensure efficient results.
(d) Updating the norms related to fees imposed by municipalities on utility companies:
The current fees imposed by municipalities on utility companies (e.g. renting fees for cable
companies to use ducts) are considerably low and do not consider the social costs caused by
repetitive excavations. However, the cost-savings from MUTs and the social cost reduction should
be considered; and the fees for renting space in the MUT should reflect these savings and the social
costs. The cost-sharing model proposed in this thesis can be extended in the future to consider this
aspect. It should be noted also that a part of the social cost will be ultimately transferred from the
utility companies to the end-users. Another scenario will be to have the cost of MUT fully bared
by the municipality and then transfer the social cost part directly to the end-users through
additional municipal taxes. These different scenarios should be analyzed in the future considering
the concept of willingness to pay.
143
REFERENCES
Adnan, S. M., & Heng, T. K. (2003). Common utility tunnel for utility services at Putrajaya, new
administrative centre of Malaysia. Water Science and Technology: Water Supply, 3(1–2),
29–34. https://doi.org/10.2166/ws.2003.0082
AKpipe (2017). Glass fiber reinforced plastics (GRP) Pipe. (Aria Kavan Trading and Production
group, Mashhad, Iran.) Retrieved August 28, 2017, from
www.akpipe.com/news/default.asp?nk=12&maincatid=4
Alaghbandrad, A., & Hammad, A. (2020). Framework for Multi-purpose Utility Tunnel Lifecycle
Cost Assessment and Cost-sharing. Tunnelling and underground space technology, Volume
104, 103528.
Al Eqtisadiah. (2014). The start of the implementation of the second phase of service tunnel lines
in the history of Taif. Al Eqtisadiah Newpaper.
http://www.aleqt.com/2014/10/19/article_897383.html
Al-Ghamdi, Q. (2014). (Services tunnel) and local experiences: From the axioms of development—
Makkah Newspaper. Makkah Newspaper. https://makkahnewspaper.com/article/28944
Al-iqtissadiya. (2019). According to the highest standards and specifications 80 percent of the
Marota City infrastructure is ready and the work is underway to complete it—Economic.
Alraimedia. https://iqtissadiya.com/ بالمئة-80-والمواصفات-المعايير-أرقى-وفق /
Alraimedia. (2017). Tunnels Arteries and veins transport services to “Shaddiya.” Alraimedia.
https://www.alraimedia.com/Home/Details?id=d796a3c2-4cb5-447e-9569-605ad5cff593
Arnold, F. & Podehl, G. (1999). Best of both worlds - a mapping from EXPRESS-G to UML.
Lecture Notes in Computer Science, 1618, 49–63.
Asgari, S., Afshar, A. & Madani, K. (2013). Cooperative game theoretic framework for joint
resource management in construction. Journal of Construction Engineering and
Management, 140(3), 04013066.
Azure Microsoft (2020). Azure IoT Hub. (Microsoft) Retrieved 07 05, 2020, from Microsoft
Azure: https://azure.microsoft.com/en-us/services/iot-hub/
Bao, S. (2017). BIM Implementation in the Construction of a Complex Intersection of Utility
Tunnels. Retrieved July 24, 2018, from
https://autodeskuniversity.smarteventscloud.com/connect/sessionDetail.ww?SESSION_I
D=122402
BBR (2010). BBR wins second contract worth S$139.6m to build Proposed Common Services
Tunnel Phase 3B at Marina Bay. BBR Holdings Ltd. Retrieved March 18, 2019, from
https://bbr.listedcompany.com/newsroom/20100507_172317_KJ5_644A2DEAF312A94
048257718002E72EA.1.pdf
Bell, J. & Browsgrove, R. (2012). MYTH: The Education building used to have rooftop gardens.
The Gateway.
https://www.ualberta.ca/newtrail/spring2012/features/campusmythsrevealed
Bently (2020). Integration of Urban Infrastructure through Utility Tunnel. Retrieved September 8,
2020 from https://www.bentley.com/en/project-profiles/gujarat-international-finance-tec-
city_integration-of-urban-infrastructure-through-utility-tunnel
Boileau, S. A. (2013). Analyse techno économique de la galerie multiréseaux (GMR) (Economic
technical analysis of the multi-network gallery). Retrieved Dec 2, 2019, from
https://ceriu.qc.ca/system/files/f1_3_serge_a_boileau.pdf
144
Bradley, A., Li, H., Lark, R., & Dunn, S. (2016). BIM for infrastructure: An overall review and
constructor perspective. Automation in Construction, 71, 139-152.
BuildingSMART (2016). IFC4 Addendum 2. Retrieved March 18, 2019, from
www.buildingsmart-tech.org/specifications/ifc-releases/ifc4-add2
BuildingSMART (2019). BuildingSMART for Infrastructure. Retrieved March 18, 2019, from
http://www.buildingsmart-tech.org/infrastructure/projects
BVH Integrated Services, P. (2018a). University of Massachusetts Boston.
http://www.bvhis.com/university-of-massachusetts-boston.html
BVH Integrated Services, P. (2018b). Utility Tunnel, Central Connecticut State University.
http://www.bvhis.com/utility-tunnel%2C-central-connecticut-state-university.html
BYU (2015). MTC Utility Tunnel Design Final Report. Brigham Young University (BYU), Byron
& Associates, Andrew Luna, Andy Kirby. Retrieved June 21, 2018, from
http://cecapstone.groups.et.byu.net/sites/default/files/2015Capstone/Reports/Team5.pdf
Cano-Hurtado, J. J. & Canto-Perello, J. (1999). Sustainable Development of Urban Underground
Space for Utilities. Tunnelling and Underground Space Technology, 14(3), 335-340.
Canto-Perello, J. & Curiel Esparza, J. (2003). Risks and potential hazards in utility tunnels for
urban areas. Proceedings of the Institution of Civil Engineers-Municipal Engineer, 156 (1),
51-56.
Canto-Perello, J., Curiel Esparza, J. & Calvo, V. (2009). Analysing utility tunnels and highway
network coordination dilemma. Tunnelling and Underground Space Technology, 24(2),
185-189.
Canto-Perello, J., Curiel Esparza, J. & Calvo, V. (2016). Strategic decision support system for
utility tunnels planning applying AWOT method. Tunnelling and Underground Space
Technology, 55, 146-152.
Canto-Perello, J. & Curiel-Esparza, J. (2001). Human factors engineering in utility tunnel design.
Tunnelling and Underground Space Technology, 16(1), 211-215.
Canto-Perello, J. & Curiel-Esparza, J. (2013). Assessing governance issues of urban utility tunnels.
Tunnelling and Underground Space Technology, 33, 82-87.
Centre for Liveable Cities (2017). Urban System Studies – Working with Markets: Harnessing
Market Forces and Private Sector for Development. Retrieved July 24, 2018, from
www.clc.gov.sg/docs/default-source/urban-systems-studies/working-with-market
CERIU (2009). Report of the technical mission on multi-network galleries in France and the Czech
republic. Montreal: Centre d'expertise et de recherche en infrastructures urbaines (CERIU).
CERIU (2010). Guide pour l'évaluation des coûts socio-économiques des travaux de
renouvellement des conduites d'eau potable et d'égout. Montréal: Gouvernement du
Quénec, MAMROT.
CERIU (2011). Appréciation des risques en galerie multiréseaux (Risk assessment in multi-
network gallery). Montreal, Canada: CERIU. Retrieved Dec 01, 2019, from
https://www.ceriu.qc.ca/bibliotheque/rapport-appreciation-risques-galerie-multireseaux
Chang, J. R., & Lin, H. S. (2016). Underground pipeline management based on road information
modeling to assist in road management. Journal of Performance of Constructed Facilities,
30(1), C4014001.
Cheng, J. C., Deng, Y., & Anumba, C. (2015). Mapping BIM schema and 3D GIS schema semi-
automatically utilizing linguistic and text mining techniques. Journal of Information
Technology in Construction (ITcon), 20(14), 193-212.
145
Cheng, J. C., Lu, Q. & Deng, Y. (2016). Analytical review and evaluation of civil information
modeling. Automation in Construction, 67, 31-47.
Chmelar, R., & Sila, L. (2006). Geotechnical monitoring of centrum utility tunnels under
vodičkova street – selected pieces of knowledge. Tunel (Vol. 15). Retrieved from
https://www.ita-aites.cz/files/tunel/2006/2/tunel-0602-8.pdf
CIC (2011). BIM Project Execution Planning Guide – Version 2.1. Computer Integrated
Construction (CIC) Research Program. University Park, PA, USA.: The Pennsylvania State
University. Retrieved 03 18, 2019, from http://bim.psu.edu
City of Toronto (2009). Design criteria for sewers and watermains. Toronto: Toronto.
CityGML (2018). CityGML. Retrieved July 04, 2018, from https://www.citygml.org/about/
Clé de Sol (2005). Guide practique des galeries multireseaux. Voiron Cedex: Éditions
Techni.Cités.
Clemens, C. (2015). “University of Rochester’s Tunnel System – Rochester, NY.” 2015.
https://exploringupstate.com/university-rochesters-tunnel-system-rochester-ny/.
COWI. (n.d) King Abdul Aziz Road, Saudi Arabia. Urban Development in the Holy City of Mecca.
Retrieved April 16, 2020 from https://www.cowi.com/solutions/infrastructure/king-abdul-
aziz-road-mecca-saudi-arabia
CPAMI (2011). Regulations on Cost Allotment of Common Duct Construction and Management.
Construction and Planning Agency Ministry of the Interior (CPAMI), Taiwan. Retrieved
January 10, 2018, from www.cpami.gov.tw/public-information/laws-regulations/10-
public-works/10777-regulations-on-cost-allotment-of-common-duct-construction-and-
management.html
DDC (2012). BIM Guidelines. New York City Department of Design+Construction (DDC).
Retrieved 04 21, 2015, from
http://www.nyc.gov/html/ddc/downloads/pdf/DDC_BIM_Guidelines.pdf
De Marcellis-Warin, N., Peigner, I., Mouchikhine, V. & Mahfouf, M. (2013). Évaluation des coûts
socio-économiques reliés aux bris d'infrastructures souterraines au Québec. Montréal.
Montréal: CIRANO.
Duzinkiewicz, K., & Ciminski, A. (2006). Drinking water distribution system modelling-an
approach to skeletonization. IFAC Proceedings Volumes, 39(14), 244-249.
Eastman, C. M., Teicholz, P., Sacks, R. & Liston, K. (2011). BIM handbook: a guide to building
information modeling for owners, managers, designers, engineers and contractors.
Hoboken, NJ, Wiley.
El-Gohary, N. M., & El-Diraby, T. E. (2010). Domain ontology for processes in infrastructure and
construction. Journal of Construction Engineering and Management, 136(7), 730-744.
European Commission (2003). Indoor Air Pollution: New EU Research Reveals Higher Risks than
Previously Thought. Brussels: Press Release Database.
Ferguson, I. (1995). Dust and Noise on the Construction Process. Crown Publishing Group.
Financial Tribune, 2015. Utility Tunnel Becomes Operational in Mashhad. Retrieved July 10,
2020, from https://financialtribune.com/articles/energy/24009/utility-tunnelbecomes-
operational-in-mashhad.
FNDM (2015). Fiber Network Data Model (FNDM). (A. f. Telecommunications, Producer)
Retrieved August 10, 2017, from
http://solutions.arcgis.com/telecommunications/help/fiber-data-model/get-
started/DataDictionary/DataDictionary.htm
146
Fuzor. (2019). 4D VR Navigation. Retrieved December 9, 2019 from
https://www.kalloctech.com/vr_4D.jsp
Gagnon, M., Gaudreault, V. & Overton, D. (2008). Age of public infrastructure: A provincial
perspective. Ottawa: Statistics Canada.
Ge, F., & Xu, X. (2019). Research report on the Utility Tunnel Engineering based on BIM
technology. Journal of Physics: Conference Series, 1176(4), 042028. Retrieved February
5, 2020 from https://iopscience.iop.org/article/10.1088/1742-6596/1176/4/042028/pdf
Ghaznavi, M. (2013). Developing an Information Modeling Framework for Tunnel Construction
Projects. Master Thesis, University of Alberta, Canada.
Gibbons, R. (1992). Game Theory for Applied Economists. Princeton, NJ: Princeton University
Press.
Gift Gujarat (2019). Utility Tunnel in GIFT City. Retrieved September 8, 2020 from
http://www.giftgujarat.in/utility-tunnel
Gilchrist, A. & Allouche, E. N. (2005). Quantification of social costs associated with construction
projects: state-of-the-art review. Tunnelling and Underground Space Technology , 20(1),
89–104.
Gimeno, C. P. (2019). Multi Utility Tunnels in Barcelona—Management Model of Ronda’s Utility
Tunnels. 25th Edition CONGRES INFRA 2019.
Griffin, J. (2015). Lusail City CP1- Utility Tunnel. Qatar. Retrieved from
https://www.irinatech.com/media/198324/Lusail-City-CP1-Utility-Tunnel.pdf
Haas, C. T., O’Connor, J. T., Tucker, R. L., Eickmann, J. A. & Fagerlund, W. R. (2000).
Prefabrication and preassembly trends and effects on the construction workforce. Center
for Construction Industry Studies, Univ. of Texasm, Austin, TX.
Habimana, J., Kramer, G., & Revey, G. (2014). McGill North East Utility Tunnel-Design and
Construction Considerations for a Drill and Blast Tunnel Excavation under Highly
Sensitive Equipment, Tunnelling in A Resource Driven World Conference, Vancouver,
Canada.
HB 138 Model Basis (2012). Requirements for basic data and models. Norway: The Public Roads
Administration, National road administration handbook.
Herrán-González, A., De La Cruz, J. M., De Andrés-Toro, B., & Risco-Martín, J. L. (2009).
Modeling and simulation of a gas distribution pipeline network. Applied Mathematical
Modelling, 33(3), 1584-1600.
Ho, P. S. (2009). Government policy on PPP financial issues: Bid compensation and financial
renegotiation. New Delhi: Policy, Finance & Management for Public-private Partnerships
Willey-Blackwell.
Hompetaselaar.nl. (n.d.). ILT Mahlerlaan, Zuidas | Hompe en Taselaar. Hompetaselaar.Nl.
Retrieved March 6, 2019, from http://www.hompetaselaar.nl/projecten/ilt-mahlerlaan-
zuidas
Hu, C., & Zhang, S. (2019). Study on BIM Technology Application in the Whole Life Cycle of
the Utility Tunnel. International Symposium for Intelligent Transportation and Smart City
(pp. 277-285). Singapore: Springer.
Huck, P. J., Iyengar, M. N., Makeig, K. S., Chipps, J., & American Public Works Association,
(1976). Combined Utility/Transportation Tunnel Systems-Economic, Technical and
147
Institutional Feasibility (No. DOT-TSC-OST-75-50). U.S. Department Of Transportation,
Office Of The Secretary.
Hunt, D. V. L., Jefferson, I., Drinkwater, N. K., & Rogers, C. D. F. (2012). Sustainable Utility
Placement for University Campuses. GeoCongress 2012, Table 1, 4309–4318.
https://doi.org/10.1061/9780784412121.443
Hunt, D., Nash, D. & Rogers, C. (2014). Sustainable utility placement via Multi-Utility Tunnels.
Tunnelling and Underground Space Technology, 39, 15-26.
Hunt, D. & Rogers, C. (2005). Barriers to sustainable infrastructure in urban regeneration.
Proceedings of the Institution of Civil Engineers, Engineering Sustainability, 2(158), pp.
67-81.
Hunt, D. & Rogers, C. (2006). Sustainable Utility Infrastructure via Multi-Utility Tunnels. 1st
International Construction Specialty Conference. Calgary, Canada.
IEC (2003). Common Information Model (CIM)/Distribution Management. (International
Electrotechnical Commision (IEC), Producer). Retrieved August 28, 2017, from
www.iec.ch/smartgrid/standards
IFC (2016). Industry Foundation Classes Release 4 Addendum 2 (IFC4 Add2). (BuildingSmart,
Producer) Retrieved March 11, 2019, from www.buildingsmart-
tech.org/ifc/IFC4/Add2/html/
IMF (2004). Public-Private Partnerships. Retrieved February 12, 2019, from
https://www.imf.org/external/np/fad/2004/pifp/eng/031204.pdf
Indiana University (2015). BIM Guidelines and Standards for Architects, Engineers, and
Contractors. Retrieved August 28, 2017, from www.indiana.edu/~uao/iubim.htm
Investopedia (2017). Retrived September 7, 2017 from
<http://www.investopedia.com/terms/c/commitmentfee.asp>
Infraworks. (2019). Autodesk Infraworks. Retrieved from Autodesk Infraworks:
https://www.autodesk.com/products/infraworks/overview
Isikdag, U., Underwood, J. & Aouad, G. (2008). An investigation into the applicability of building
information models in geospatial environment in support of site selection and fire response
management processes. Advanced Engineering Informatics, 22(4).
International Tunnelling, and Underground Space, & Association (ITUSA), n.d. Mined Utility
Tunnels. 272–282 Retrieved April 15, 2020, from https://tunnel.ita-
aites.org/media/k2/attachments/public/cz-mined.pdf
ITA (2010). Electrical and Communication Cables. International Tunneling and Underground
Space Association (ITA). Retrieved December 03, 2016, from http://www.ita-
aites.org/index.php?id=196
Japhethlim (2012). Common Service Tunnels & District Cooling- Singapore Marina Bay City.
Retrieved October 31, 2018, from
http://blog.japhethlim.com/index.php/2012/05/03/common-service-tunnels-singapore-
marina-bay-city/
Jeong, H., Ha, S. & Kim, H. (2018). Flood protection cost allocation using cooperative game
theory for adapting infrastructure to climate change. Journal of Water Resources Planning
and Management. 144(4), 04018010.
Jung, Y. & Sinha, K. (2007). Evaluation of trenchless technology methods for municipal
infrastructure systems. 13(2), 144–156.
148
Kang, S., Tseng, Y., & Moh, R. (2014). BIM Facility Management on Utility tunnel. The 4th
International Conference on Utility Management & Safety. Beijing, CHINA. Retrieved 03
24, 2020, from Community & Construction Professional's Development Center:
http://www.uti.hk/media/attachments/4th_ICUMAS_-
_BIM_Facility_Management_on_Utility_tunnel.pdf
Kang, Y. K. & Choi, I. C. (2015). Economic Feasibility of Common Utility Tunnel based on Cost-
Benefit Analysis. Journal of the Korean Society of Safety, 30(5), 29-36.
Kennedy, G. M. (2013). Can game theory be used to address PPP renegotiations?: a retrospective
study of the of the Metronet-London Underground PPP (Doctoral dissertation). Portugal:
Universidade Católica Portuguesa.
Khemlani, L. (2004). The IFC building model: A look under the hood. AECbytes. Retrieved
November 1, 2018, from http://home.fa.utl.pt/~franc/2007/mapoio/projdig/Ifcmodel.pdf
Kolektory Praha, (2019). Retrieved August 14, 2020 from Kolektory:
https://www.kolektory.cz/en/about-us/
Koorsen, (2017). What is a CO2 fire suppression system and how does it work? Koorsen Fire &
Security, Retrieved July 22, 2020, from https://blog.koorsen.com/what-is-a-co2-fire-
suppression-system-and-how-does-it-work
Kuhn, B., Jasek, D., Brydia, R., Parham, A., Ullman, B. & Blaschke, B. (2002). Utility corridor
structures and other utility accommodation alternatives in TXDOT right of way. Texas
Department of Transportation. Texas Transportation Institute. Retrieved October 31, 2018,
from
http://citeseerx.ist.psu.edu/viewdoc/download?doi=10.1.1.194.5748&rep=rep1&type=pdf
Laistner, A. (1997). Utility Tunnels long-term investment or short-term expense? The new
economic feasibility of an old idea. 15th International No Dig Conference. Taipei.
Laistner, A. & Laistner, H. (2012). Utility Tunnels–Proven Sustainability Above and Below
Ground. Proceedings REAL CORP 2012, (pp. 14-16). Schwechat, Austria.
Lee, P. C., Wang, Y., Lo, T. P. & Long, D. (2018). An integrated system framework of building
information modelling and geographical information system for utility tunnel maintenance
management. Tunnelling and Underground Space Technology, 79, 263-273.
Legrand, L., Blanpain, O. & Buyle-Bodin, F. (2004). Promoting the urban utilities tunnel technique
using a decision making approach. Tunnelling and Underground Space Technology, 19(1),
79-83.
Li, Y., Yang, J., Shen, X., & Ma, Y. (2019). Application Research on Construction Management
of Urban Underground Utility Tunnel Based on BIM. IOP Conference Series: Earth and
Environmental Science, 295(4), 042133. Retrieved February 2, 2020 from
https://iopscience.iop.org/article/10.1088/1755-1315/295/4/042133/pdf
Liebich, T. (2009). IFC 2x edition 3: Model implementation guide. Version 2.0, AEC3 Ltd.
Retrieved November 1, 2018, from www.buildingsmart-tech.org
Liu, F. T. & Loong, L. H. (2015). Thirty years hundred stories: Engineering accomplishments in
Singapore as told by the NTI pioneer engineering class of 85. Singapore: Nanyang
Technological University: ISEAS Publishing.
Luo, Y., Alaghbandrad, A., Genger, T. K., & A., H. (2019). Smart Multi-purpose Utility Tunnels.
In A. Awasthi (Ed.), Sustainable City Logistics Planning: Methods and Applications (Vol.
3). Montreal, Quebec, Canada: Nova publishers. Retrieved February 6, 2020 from
https://novapublishers.com/shop/sustainable-city-logistics-planning-methods-and-
applications-volume-3/
149
Luo, Y., Alaghbandrad, A., Genger, T. K., & Hammad, A. (2020). History and recent
developments of multi-purpose utility tunnels. Tunnelling and Underground Space
Technology, Volume 103, 103511.
Lusail (2015). Lusail City. Retrieved January 29, 2019, from http://www.lusail.com/the-
project/infrastructure-of-the-future/infrastructure/
Ma, Z., Wei, Z., Song, W. & Lou, Z. (2011). Application and extension of the IFC standard in
construction cost estimating for tendering in China. Automation in Construction, 20(2),
196-204.
Mäkinen, S. & Pakkala, P. (2015). Experiences from PPP Road Projects in Finland. Second
International Conference on Public-Private Partnerships, (pp. 66-80). Austin, Texas.
Manuilova, A., Dormuth, D. W. & Vanier, D. J. (2009). A Case Study of Use and External
Components of Social Costs that are Related to Municipal Infrastructure Rehabilitation.
National Research Council Canada (NRCC).
Marzouk, M. M. & Hisham, M. (2012). Bridge information modeling in sustainable bridge
management. International Conference on Sustainable Design and Construction (ICSDC)
2011, (pp. 457-466).
McGraw-Hill Construction (2009). McGraw-Hill Construction SmartMarket report, The Business
Value of BIM: Getting Building Information Modeling to the Bottom Line.
McKim, R. (1997). Bidding strategies for conventional and trenchless technologies considering
social costs. Canadian Journal of Civil Engineering, 5(24), 819-827.
Microsoft. (2017). PPMT function. Retrived September 7, 2017 from
<https://support.office.com/en-us/article/PPMT-function-c370d9e3-7749-4ca4-beea-
b06c6ac95e1b>
Microsoft (2020). How to set up and use the RTD function in Excel. Retrieved from
Microsoft.com: https://docs.microsoft.com/en-us/office/troubleshoot/excel/set-up-
realtimedata-function
Ministry of the Interior (2017). Common Duct Database. Construction and Planning Agency
Ministry of the Interior (CPAMI), Taiwan. Retrieved January 31, 2019, from
http://duct.cpami.gov.tw/pubWeb2/Duct/P1_0.aspx
Motamedi, A. (2013). Improving facilities lifecycle management using rfid localization and bim-
based visual analytics. Montreal, Canada: PhD thesis, Concordia University.
Motamedi, A.; Soltani, M.; Setayeshgar, S.; Hammad, A. (2016). Extending IFC to incorporate
information of RFID tags attached to building elements. Advanced Engineering
Informatics, Volume 30, pp. 39–53.
Myerson, R. B. (1991). Game Theory: Analysis of Conflict. Cambridge, Massachusetts: Harvard
University Press.
Myerson, R. B. (1997). Game Theory: Analysis of Conflict. Cambridge: Harvard University Press.
Najafi, M. & Kim, K. O. (2004). Life-Cycle-Cost Comparison of Trenchless and Conventional
Open-Cut Pipeline Construction Projects. Pipeline Division Specialty Congress 2004. San
Diego.
Nakano, M., Torigoe, T., & Kawano, M. (2011). Structure monitor system by using optical fiber
sensor and watching camera in utility tunnel in urban area. 22nd Congress of the
International Commission for Optics: Light for the Development of the World. Puebla.
doi:10.1117/12.899600
National Research Council (2006). Drinking water distribution systems: assessing and reducing
risks. Washington, D.C.: The National Academies Press.
150
National Research Council (2013). Underground engineering for sustainable urban development.
Washington, DC, USA: National Academies Press.
Navisworks (2019). Autodesk Navisworks. Retrieved December 9, 2019 from
https://www.autodesk.ca/en/products/navisworks/overview?plc=NAVSIM&term=1-
YEAR&support=ADVANCED&quantity=1
NIBS (2007). National building information modeling standard- version 1.0 – part 1: Overview,
principles and methodologies. . National Institute of Building Sciences (NIBS), US.
NUS Institute of Real Estate Studies (2016). Developing the Business and Financial District in
Marina Bay. National University of Singapore (NUS). Retrieved January 29, 2019, from
http://www.ires.nus.edu.sg/research/Case_Centre_Synopsis.aspx?vID=Marina_Bay
Noman, M. (2014). Photo and video. The completion of the service tunnels works at Al-Wasil
project. Retrieved April 15, 2020 from https://al-sharq.com/article/26/02/2014/ -بالصور
الوسيل-بمشروع-الخدمات-أنفاق-أعمال-إنتهاء-الفيديوو
O’Connor, J. T., O’Brien, W. J. & Choi, J. O. (2014). Critical success factors and enablers for
optimum and maximum industrial modularization. Journal of Construction Engineering
and Management, 140(6).
Ormsby, C. (2009). A framework for estimating the total cost of buried municipal infrastructure
renewal projects. Montreal: M.S. Thesis, Department of Civil Engineering and Applied
Mechanics, McGill University.
Osborne, M. J. & Rubinstein, A. (1994). A Course in Game Theory. Massachusetts: MIT Press.
Oum, N. (2017). Modeling Socio-economic Impacts of Municipal Infrastructure Works. Montreal,
Canada: PhD thesis, Concordia University.
Park, K.J., & Yun, K.Y. (2018). Development of optimal cross-section design methods for bored
utility tunnels: Case study of overseas typical cross-sections and design criteria. Journal of
the Korean Space Science Society, 20(6), 1073–1090.
https://doi.org/10.9711/KTAJ.2018.20.6.1073
PODS (2017). Pipeline Open Data Standard (PODS). Retrieved October 10, 2017, from
https://www.pods.org/pods-model/what-is-the-pods-pipeline-data-model/
Pokorný, V. (2017). Analysis of the collector network in Prague. CZECH TECHNICAL
UNIVERSITY IN PRAGUE. Retrieved from
https://dspace.cvut.cz/bitstream/handle/10467/68670/F1-BP-2017-Pokorny-Vladimir-F1-
BP-Pokorny-Vladimir-Analyza kolektorove site v Praze.pdf?sequence=1
Pomerleau (2015). McGill University Tunnel Construction. Retrieved from
https://pomerleau.ca/en/projects/24/mcgill-university-tunnel-construction
Pratt, M. J. (2001). Introduction to ISO 10303—the STEP standard for product data exchange.
Journal of Computing and Information Science in Engineering, 1(1), 102-103.
Ramírez Chasco, F. D., Meneses, A. S. & Cobo, E. P. (2011). Lezkairu Utilities Tunnel. Practice
Periodical on Structural Design and Construction, 16(2), 73-81.
Revit (2019). Autodesk Revit. Retrieved December 9, 2019 from
https://www.autodesk.ca/en/products/revit/overview?plc=RVT&term=1-
YEAR&support=ADVANCED&quantity=1
Rogers, C. & Hunt, D. (2006). Sustainable utility infrastructure via multi-utility tunnels. 1st
International Construction Specialty Conference, Calgary.
Rouse, M. (2020). Internet of Things Agenda. (I. Agenda, Producer) Retrieved from Internet of
Things (IoT): https://internetofthingsagenda.techtarget.com/definition/Internet-of-Things-
IoT
151
RSMeans. (2019). RS Means. Retrieved Dec 01, 2019, from www.rsmeans.com/
Project Management Institute (2017). A Guide to the Project Management Body of Knowledge
(PMBOK-Guide). Pennsylvania, USA: Project Management Institute Inc.
Samsami, R. & Tavakolan, M. (2016). A Game Theoretic Model for Subcontractors’ Partnership
in Construction: Win-Win Game. Construction Research Congress 2016 (pp. 597-606).
San Juan, Peurto Rico: American Society of Civil Engineers.
Sanchez, L. R. (2008). Application of Game Modeling to good tunneling practice. Boulder:
University of Colorado at Boulder.
Sfere (2020). Utility tunnel-Smart operation and maintenance integrated management platform for
comprehensive utility tunnel. Retrieved February 25, 2020 from http://www.sfere-
elecnova.com/index.php?m=Article&a=show&id=178&site=
Shahrour, I., Bian, H., Xie, X., & Zhang, Z. (2020). Use of Smart Technology to Improve
Management of Utility Tunnels. Applied Sciences, 10(2), 722.
Shang, L. & Aziz, A. A. (2018). The USA PPP Payment Mechanisms: A Comparison to the
Canadian PPP Systems. Construction Research Congress 2018 (pp. 129-138). New
Orleans, Louisiana: American Society of Civil Engineers.
Shapley, L. S. (1953). A value for n-Person games. Contributions to the theory of games, H. W.
Kuhn, and A. W. Tucker. Princeton, NJ: Princeton.
Shapley, L. S. (1988). A value for n-person games, The Shapley value. Princeton, NJ: Princeton
University Press.
Shu, Y. (2003). Multi-utility tunnels in Japan. Chinese Civil Air Defence, 148, 40-41.
Sochurek, J. (2006). Utility Subways in Prague. Tunel, 51–54. Retrieved from https://www.ita-
aites.cz/files/tunel/2006/1/tunel-0601-12.pdf
Society of civil engineers (2010). City Lifeline Handbook. Japan: [In Japanese].
STRABAG International GmbH. (2012) North and South Site Utility Tunnel (NSUT-SSUT),
Qatar. Retrieved January 13, 2020, from
https://bim5d.strabag.com/databases/internet/_public/content30.nsf/web30?Openagent&i
d=52E7F51360869EA6C12580F8005B89A1
Stein, D. (2002). The Walk-in Duct. Germany: Ernsat & Sohn [In German].
Stein, D., Stein, R., (2004). Utility Tunnels. Retrieved July 10, 2020, from
https://www.unitracc.com/technical/books/rehabilitation-and-maintenance-of-drains-
andsewers/rehabilitation/replacement-en/utility-tunnel-en
Sterling, R., Admiraal, H., Bobylev, N., Parker, H., Godard, J.-P., Vähäaho, I., Rogers, C.D.F.,
Shi, X., Hanamura, T. (2012). Sustainability issues for underground space in urban areas.
Proceedings of the Institution of Civil Engineers - Urban Design and Planning, 165(4),
241-254.
Suttinon, P., Bhatti, A. M. & Nasu, S. (2011). Option games in water infrastructure investment.
Journal of Water Resources Planning and Management,, 138(3), 268-276.
Taselaar F.M. Hompe C.A.M. Van Liere. J.W. (2004). Amsterdam bundles cables and pipes
south axis in tunnel. 26–27. Retrieved April 15, 2020 from
http://www.hompetaselaar.nl/sites/default/files/public/publicaties/01-08-
2004landwaternr8.pdf
TATA (2017). Concept Plan: Bhopal smart city development corporation limited. India: TATA
consulting engineers limited, project development and management consultant for area
based.
152
Tatum, C. B., Vanegas, J. A. & Williams, J. M. (1987). Constructability improvement using
prefabrication, preassembly, and modularization. Austin, TX, USA: Univ. of Texas,
Construction Industry Institute.
Theiler, M., & Smarsly, K. (2018). IFC Monitor–An IFC schema extension for modeling structural
health monitoring systems. Advanced Engineering Informatics, 37, 54-65.
UO (2015). Utility Tunnel Safety Program. USA: University of Oregon (UO). Retrieved March
18, 2019, from
https://safety.uoregon.edu/sites/safety1.uoregon.edu/files/utility_tunnel_safety_program_
2015.pdf
URA Singapore (2006). Singapore URA Annual Report 2005-2006. Urban Development
Authority (URA). Retrieved 01 30, 2019, from https://www.ura.gov.sg/-
/media/Corporate/Resources/Publications/Annual-Reports/PDFs/AnnualReport_2005-
2006.pdf
UW (2008). Design Guide, Utility Tunnels and Trenches. USA: University of Washington (UW)-
Campus Engineering. Retrieved October 31, 2018, from
https://facilities.uw.edu/files/media/fsdg-02-u-utility-tunnels-trenches.pdf
Von Neumann, J. & Morgenstern, O. (1944). Theory of games and economic behavior. Princeton,
NJ: Princeton University Press.
Wang, X., Schulz, N. N. & Neumann, S. (2003). CIM extensions to electrical distribution and CIM
XML for the IEEE radial test feeders. IEEE transactions on Power Systems, 18(3), 1021-
1028.
Wang, T., Tan, L., Xie, S., & Ma, B. (2018). Development and applications of common utility
tunnels in China. Tunnelling and Underground Space Technology, 76, 92–106.
https://doi.org/10.1016/j.tust.2018.03.006
Water Quality Association (2020). Common Waterborne Contaminants. Retrieved 20 04, 2020,
from WQA: https://www.wqa.org/learn-about-water/common-contaminants
Water security agency (2012). Sewage works design standard. Regina, Saskatchewan, Canada:
Water security agency.
Weise, M., Katranuschkov, P. & Scherer, R. (2000). A proposed extension of the IFC project
model for structural systems. Product and process modeling in building and construction:
proceedings of the third European Conference on Product and Process Modeling in the
Building and Related Industries (pp. 229-238). Rotterdam, Netherlands: A.A. Balkema
Publications.
Weise, M., Liebich, T. & Wix, J. (2008). Integrating use case definitions for IFC developments.
Ework and Ebusiness in Architecture, Engineering and Construction, Proceedings of 7th
European Conference on Product and Process Modelling. Sophia Antipolis.
Werey, C., Torterotot, J. P., Sousa e Silva, D., König, A., Peirera, A. & Montginoul, M. (2005).
Socio-economic impacts of rehabilitation strategies. CARE-S-Computer Aided
REhabilitation of Sewer Networks.
Wix, J. & Karlshoej, J. (2010). Information delivery manual: Guide to components and
development methods. Retrieved November 10, 2017, from
http://iug.buildingsmart.org/idms/development/IDMC_004_1_2.pdf
Wu, C., Li, X., & Chiu, C. (2019). Investigation of BIM and GIS Information Exchange Standards
for Urban Utility Tunnel Construction. 2nd Eurasian Conference on Educational
Innovation 2019, (pp. 439-442). Singapore.
153
Xi, W. & Fuling, Z. (2013). Research of Charge Strategy for Urban Municipal Utility Tunnel
Based on Game Theory Analysis. Chinese Journal of Underground Space and Engineering,
9(1), 197-203.
Xiaoqin, G., Wangzhen, W. & Shuailong, Z. (2011). The Incentive Mechanism for Financing of
the Municipal Utility Tunnel Construction. Chinese Journal of Underground Space and
Engineering, 7(4), 633-637.
Xtralis (2018). Protecting Underground Utility Tunnels from Invisible Dangers. Retrieved
November 5, 2018, from https://xtralis.com/file.cfm?id=647
Xu, Y. (2005). Research in Hibiya multi-utility tunnel in Japan. Shanghai Quality, 2, 55-56.
Yang, C. & Peng, F. L. (2016). Discussion on the development of underground utility tunnels in
China. Procedia Engineering, 165, 540-548.
Yin, X., Liu, H., Chen, Y., Wang, Y., & Al-Hussein, M. (2020). A BIM-based framework for
operation and maintenance of utility tunnels. 103252. Tunnelling and Underground Space
Technology, 97, 103252.
Yin, Z. (2013). Application of Hydrostatic Leveling System in Metro Monitoring for Construction
Deep Excavation Above Shield Tunnel. Applied Mechanics and Materials, 333-335, 1509-
1513.
Zhang, Y., Moghani, E., AbouRizk, S. M. & Fernando, S. (2010). 3D CAD Modeling and
visualization of the tunnel construction process in a distributed simulation environment.
Proc., 2010 Winter Simulation Conference, Piscataway (pp. 3189-3200). New Jersey:
IEEE, Inc.
Zhang, Z., Ren, J., Xiao, K., Lin, Z., Xu, J., Wang, W., & Pei, C. (2019). Cost Allocation
Mechanism Design for Urban Utility Tunnel Construction Based on Cooperative Game
and Resource Dependence Theory. Energies, 12(17), 3309.
Zhou, X., Pan, H. & Shen, Y. (2017). China’s Underground Comprehensive Utility Tunnel Project
of PPP Mode Risk Identification. International Conference on Construction and Real Estate
Management (ICCREM) 2017 (pp. 318-327). Guangzhou, China: American Society of
Civil Engineers.
Zhou, Y. & Zhao, J. (2016). Advances and Challenges in Underground Space Use in Singapore.
Geotechnical Engineering Journal of the SEAGS & AGSSEA, 47(3), 85-95.
Ziv, N., Kindinis, A., Simon, J., & Gobin, C. (2019). Application of systems engineering for
development of multifunctional metro systems: Case study on the fifth metro line of the
Lyon metro, France. Underground Space. https://doi.org/10.1016/j.undsp.2019.09.001

154
APPENDICES
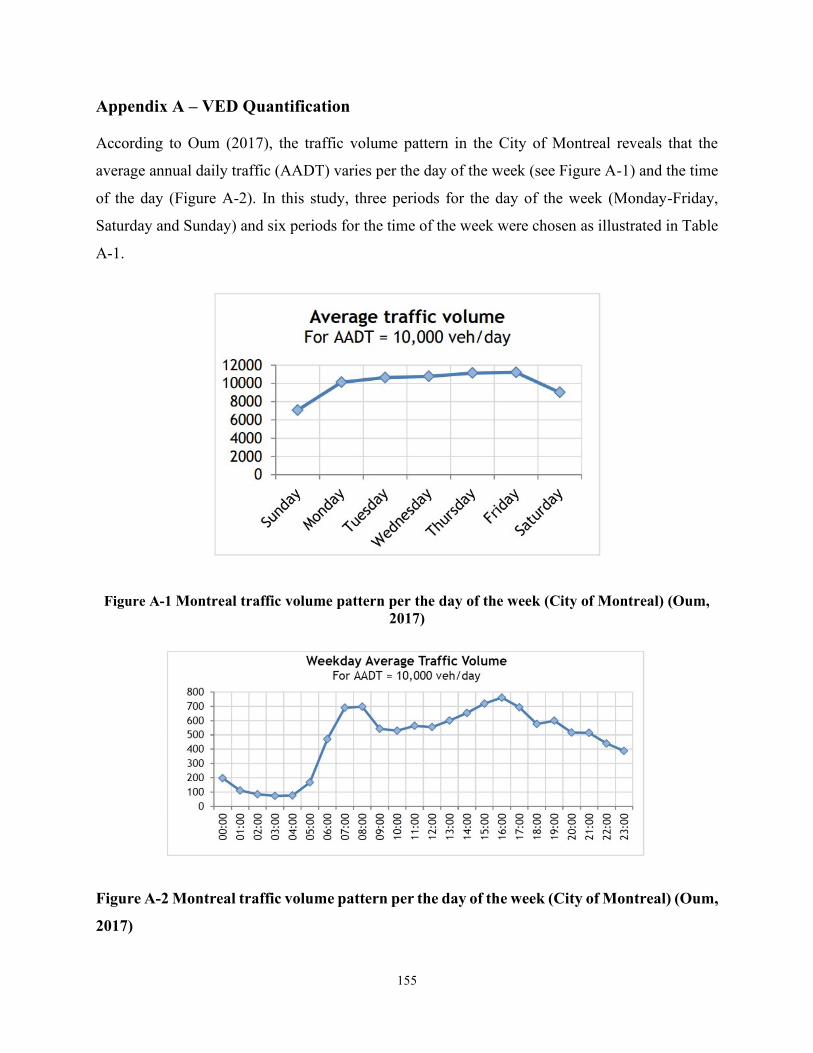
155
Appendix A – VED Quantification
According to Oum (2017), the traffic volume pattern in the City of Montreal reveals that the
average annual daily traffic (AADT) varies per the day of the week (see Figure A-1) and the time
of the day (Figure A-2). In this study, three periods for the day of the week (Monday-Friday,
Saturday and Sunday) and six periods for the time of the week were chosen as illustrated in Table
A-1.
Figure A-1 Montreal traffic volume pattern per the day of the week (City of Montreal) (Oum,
2017)
Figure A-2 Montreal traffic volume pattern per the day of the week (City of Montreal) (Oum,
2017)
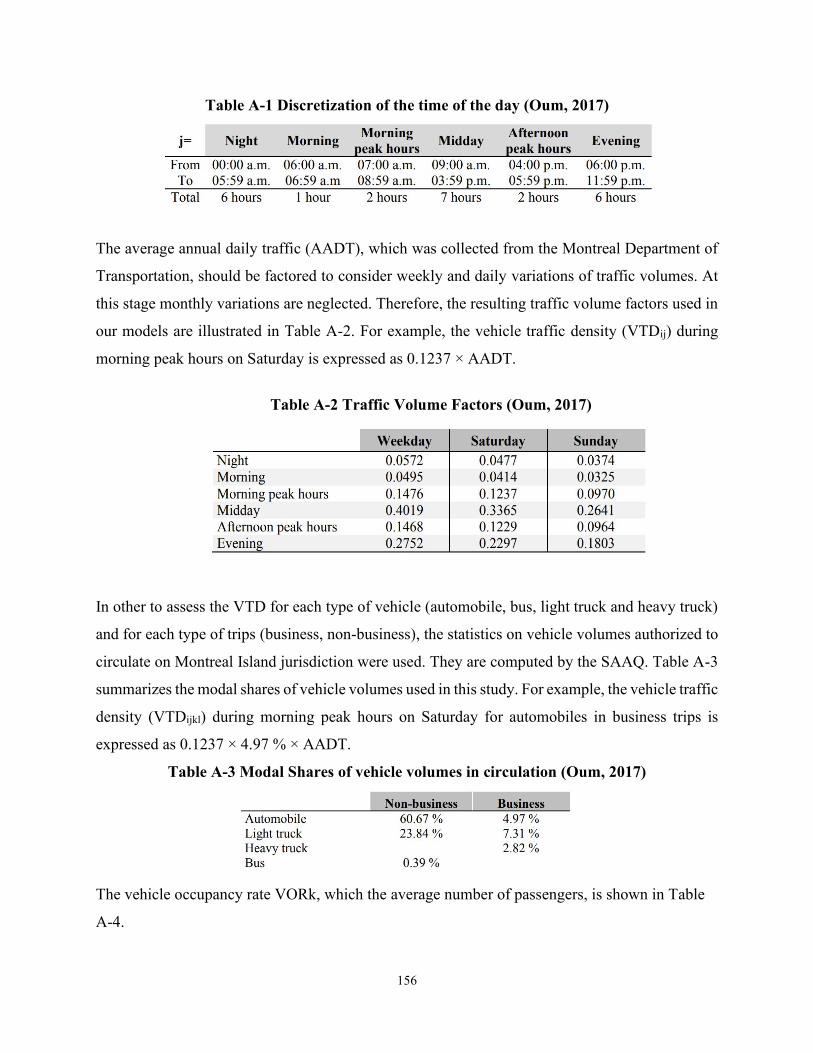
156
Table A-1 Discretization of the time of the day (Oum, 2017)
The average annual daily traffic (AADT), which was collected from the Montreal Department of
Transportation, should be factored to consider weekly and daily variations of traffic volumes. At
this stage monthly variations are neglected. Therefore, the resulting traffic volume factors used in
our models are illustrated in Table A-2. For example, the vehicle traffic density (VTDij) during
morning peak hours on Saturday is expressed as 0.1237 × AADT.
Table A-2 Traffic Volume Factors (Oum, 2017)
In other to assess the VTD for each type of vehicle (automobile, bus, light truck and heavy truck)
and for each type of trips (business, non-business), the statistics on vehicle volumes authorized to
circulate on Montreal Island jurisdiction were used. They are computed by the SAAQ. Table A-3
summarizes the modal shares of vehicle volumes used in this study. For example, the vehicle traffic
density (VTDijkl) during morning peak hours on Saturday for automobiles in business trips is
expressed as 0.1237 × 4.97 % × AADT.
Table A-3 Modal Shares of vehicle volumes in circulation (Oum, 2017)
The vehicle occupancy rate VORk, which the average number of passengers, is shown in Table
A-4.
157
Table A-4 Average vehicle occupancy rate (Oum, 2017)
For calculating increased travel time (∆Tij) in hours by considering Delay time because of
congestion in the road (speed reduction) and/or increased time of travel because of detour road
(increased travel distance), the following equation is used:
∆T= 𝐿
𝑉
L: traveling distance
V: speed
158
Appendix B – PPP Cost-sharing
According to Clé de Sol (2005), one of the models for utility tunnels cost sharing is Public, Private,
Partnership (PPP). The model is represented as an Excel file including 20 sheets. The sheet of ‘Bank’
presents five types of important elements about financial flows:
(1) Financial requirements of manager-operator during the construction period;
(2) Financial requirements of manager-operator during the operation period;
(3) Determining the entrance fees for operators of gallery;
(4) Total debt and financing charges for the municipality;
(5) The working capital (BFR) required during the construction period.
This document explains the flowcharts of the bank-related calculations (Figures B-1 to B-5), presents
the equations, and variables.
Flowchart explanation:
Remarks:
- To start the process, first the value of t equals 1 for the first year and is increased for next years.
- All the calculations are based on the values Base Year (BY). To find the inflation-adjusted
values, a calculated value with BY amounts should be multiplied at Inflation Index (IINDX) by
this formula: GIINDXCY = (1 + GIR)(CY−BY), by knowing General Inflation Rate (IR), Current
Year (CY), and Base Year (BY). Or CIINDXCY = (1 + CIR)(CY−BY) by knowing Construction
Inflation Rate (IR), Current Year (CY), and Base Year (BY).
1. Loop 1
In loop 1 (Figure B-2), to calculate the Construction Cost of Gallery for year t (CCGt), if t is greater
than Duration of Construction (DC), then the CCGt for that year will be zero. In other words, after
construction, there is no construction cost. If the selected year t is less than or equal to the DC, then
159
CCGt can be calculated based on Equation (B-1) and assumed values of Total Construction Costs of
Gallery (TCCG) and Breakdown of construction costs for year t (BCCt).
𝐶𝐶𝐺𝑡 = 𝑇𝐶𝐶𝐺 × 𝐵𝐶𝐶𝑡 (B-1)
Total Initial Investments of gallery for year t (TIIt) includes construction and non-construction costs. To
calculate TIIt with Equation (B-2), the values of Initial investment except construction of gallery for year
t (IIECt), e.g. cost of study, land acquisition, etc., are assumed for first year, and the value of CCGt is
transferred from Equation (B-1).
𝑇𝐼𝐼𝑡 = 𝐶𝐶𝐺𝑡 + 𝐼𝐼𝐸𝐶𝐶𝑡 (B-2)
To calculate the Total Financing of Gallery for year t (TFGt), the value of TIIt should be transferred
from Equation (B-2) and the value of working capital for year t (BFRt) as an external input (cash flow
or difference of resources and costs for each year), is needed for Equation (B-3).
TFGt = TIIt + BFRFt (B-3)
The next important cost is Entrance Fee of Occupants Except Municipality for year t (EFOEMt). The
value of EFOEMt equals zero if the year t is during the construction. For the years after construction,
Equation (B-4) calculates EFOEMt by multiplying the Future Value (FV) of Entrance Fee of All
Occupants (EFAO), which is EFAO
∑BCCt
(1+DR)tDCt=1
using Discount Rate (DR), Duration of Construction (DC), and
Construction Costs in % for year t (BCCt), at BCCt and Distribution of Entrance Fee for Occupants
Except Municipality in % (DEFOEM).
𝐸𝐹𝑂𝐸𝑀𝑡 =𝐸𝐹𝐴𝑂
∑𝐵𝐶𝐶𝑡
(1+𝐷𝑅)𝑡𝐷𝐶𝑡=1
× 𝐵𝐶𝐶𝑡 × 𝐷𝐸𝐹𝑂𝐸𝑀 (B-4)
To calculate Total to be Financed by Municipality for year t (TFMt), the sum of Entrance Fee of
Occupants Except Municipality for year t (EFOEMt) (Equation (B-4)) and Contribution of the Manager
of the Gallery in the form of capital for year t (COMGt) (an external input), should be subtracted from
the value of Total Financing of Gallery for year t (TFGt) (Equation (B-3)).
160
𝑇𝐹𝑀𝑡 = 𝑇𝐹𝐺𝑡 – (𝐸𝐹𝑂𝐸𝑀𝑡 + 𝐶𝑂𝑀𝐺𝑡) (B-5)
Capitalized Interest of Basic and Margin rates for year t (CIBMt) is the amount of interest on the Debt
Balance at the Beginning of Year t (DBBYt) (Equation (B-12)) plus half of Total to be Financed by
Municipality for year t (TFMt) (Equation (B-5)). The half represents an average of TFMt during year t.
The Debt Balance at the Beginning of Year 1 (DBBY1) is zero and for the next years will be calculated
in the previous year as shown in (Equation (B-12)). The interest rate is sum of Base Rate (BR) and
Margin (MRGN) rate as assumed for the project.
If the year t is in Duration of Construction (DC) or 1<t<DC, it is required to refer to Loop 1-1 to calculate
CIBMt (CIBM2,…, CIBMDC).
𝐶𝐼𝐵𝑀𝑡 = (𝐷𝐵𝐵𝑌𝑡 + 𝑇𝐹𝑀𝑡
2) × (𝐵𝑅 + 𝑀𝑅𝐺𝑁) (B-6)
Theoretical Amount of Borrowing to Calculate Bank Commissions (TABCBC) is calculated with
Equation (B-7). To find this value, sum of Total to be Financed by Municipality for year t (TFMt)
(Equation (B-5)) and Capitalized Interest of Basic and Margin rates for year t (CIBMt) (Equation (B-
6)) for all years of Duration of Construction (DC), is multiplied at one plus the sum of rates of
Commission of Engagement (COE) and Commission of Arrangement (COA) as assumed in the project.
𝑇𝐴𝐵𝐶𝐵𝐶 = ( ∑ 𝑇𝐹𝑀𝑡𝐷𝐶𝑡=1 + ∑ 𝐶𝐼𝐵𝑀𝑡
𝐷𝐶𝑡=1 ) × (1 + (𝐶𝑂𝐸 + 𝐶𝑂𝐴)) (B-7)
To Calculate Amount of Commission of Engagement for year t (ACOEt) using Equation (B-8), the value
of TABCBC from Equation (B-7) should be subtracted from Total to be Financed by Municipality for
year t (TFMt) (Equation (B-5)) and the result should be multiplied at the rate for Commission of
Engagement (COE). Investopedia (2017) described ACOEt or Commitment Fee as a fee that a lender
charges borrower to compensate for lender’s commitment to lend or providing access to a potential loan.
The Commitment Fee is charged on the unused portion of the loans since the fund is on hold aside for
the borrower and still cannot charge interest for its use. For this reason, (TABCBC – ∑ TFMttt=1 )
represents the unused portion of the loan, which is for after year t.
𝐴𝐶𝑂𝐸𝑡 = (𝑇𝐴𝐵𝐶𝐵𝐶 – ∑ 𝑇𝐹𝑀𝑡𝑡𝑡=1 ) × 𝐶𝑂𝐸 (B-8)
161
where:
ACOEt: Amount of Commission of Engagement for year t
COE: Commission of Engagement rate
Amount of Commission of Arrangement (ACOA) is only for the service of loan arrangement and is
charged only at the first year. To calculate it using Equation (B-9), the value of TABCBC from Equation
(B-7) should be multiplied at the rate of Commission of Arrangement (COA) as an assumption.
ACOAt = TABCBC × COA (only for t=1) (B-9)
where:
ACOA: Amount of Commission of Arrangement
COA: Commission of Arrangement rate
To calculate Amount of Borrowing to Finance Initial Costs (ABFIC) by Equation (B-10), the following
total amount for all Duration of construction (DC) should be added: Total to be Financed by
Municipality for year t (TFMt) (Equation (B-5)), Capitalized Interest of Basic and Margin rates for year
t (CIBMt) (Equation (B-6)), Amount of Commission of Engagement for year t (ACOEt) (Equation (B-
8)), and Amount of Commission of Arrangement (ACOAt) (Equation (B-9)).
𝐴𝐵𝐹𝐼𝐶 = ∑ (𝑇𝐹𝑀𝑡𝐷𝐶𝑡=1 + 𝐶𝐼𝐵𝑀𝑡 + 𝐴𝐶𝑂𝐸𝑡 + 𝐴𝐶𝑂𝐴𝑡) (B-10)
As shown in Equation (B-14), Debt Installment for year t (DIt) includes two portions: (a) Interest
Charges for year t (ICt) (Equation (B-13)) as the interest portion of the installment, and (b) Principal
Reimbursement for year t (PRt) (Equation (B-11)) as the principal portion. To find PRt of the loan, the
Excel function of PPMT (Principal Payment) is used. This function is used only when the DIt is constant
and periodic, with a constant interest rate (Microsoft, 2017). Since the loan reimbursement starts after
construction, the value of PRt is zero during construction. The inputs are as following.
PRt = PPMT (BR+MRGN,PNt,DL-DC,ABFIC,PD) (B-11)
162
where:
PRt: Principal Reimbursement for year t
PNt: Period Number for loan payment of year t
DL: Duration of Loan
PD: Payment due at (0: the end of the period, 1: the beginning of the period)
ABFIC: Amount of Borrowing to Finance Initial Costs (ABFIC) (Equation (B-10))
Debt Balance at the Beginning of Year 1 (DBBY1) is zero, to find it for the year t, the following amounts
from previous year (year t-1) are added to the Debt Balance at the Beginning Year t-1 (DBBYt-1): TFMt-
1 (Equation (B-5)), CIBMt-1 (Equation (B-6)), ACOEt-1 (Equation (B-8)), ACOAt-1 (Equation (B-9));
And the PRt-1 (Equation (B-11)) is reduced.
DBBYt = DBBYt-1 + TFMt-1 + CIBMt-1 + ACOEt-1 + ACOAt-1 - PRt-1 (B-12)
To calculate Interest Charges (ICt) (Equation (B-13)), the value of Debt Balance at the Beginning of
Year t (DBBYt) from Equation (B-12) is multiplied at (BR+ MRGN) rate.
ICt = DBBYt × (BR+ MRGN) (B-13)
Debt Installment for year t (DIt) is sum of Interest Charges for year t (ICt) (Equation (B-13)) and
Principal Reimbursement for year t (PRt) (Equation (B-11)).
DIt = ICt + PRt (B-14)
2. Loop 1-1
As demonstrated in Figure B-3, considering Duration of Construction (DC), after calculation of
TFM1,…, TFMDC (Equation (B-5)), and CIBM1 (Equation (B-6)), the values of CIBM2,…,CIBMDC
cannot be found since they need DBBY2,…,DBBYDC, which is dependent on ACOE1,…,ACOEDC and
ACOA1. ACOEt and ACOA1 are dependent on the value of TABCBC, which is dependent on the values
of CIBM2,…, CIBMDC. These dependencies make a loop inside loop 1, called loop 1-1 as shown in
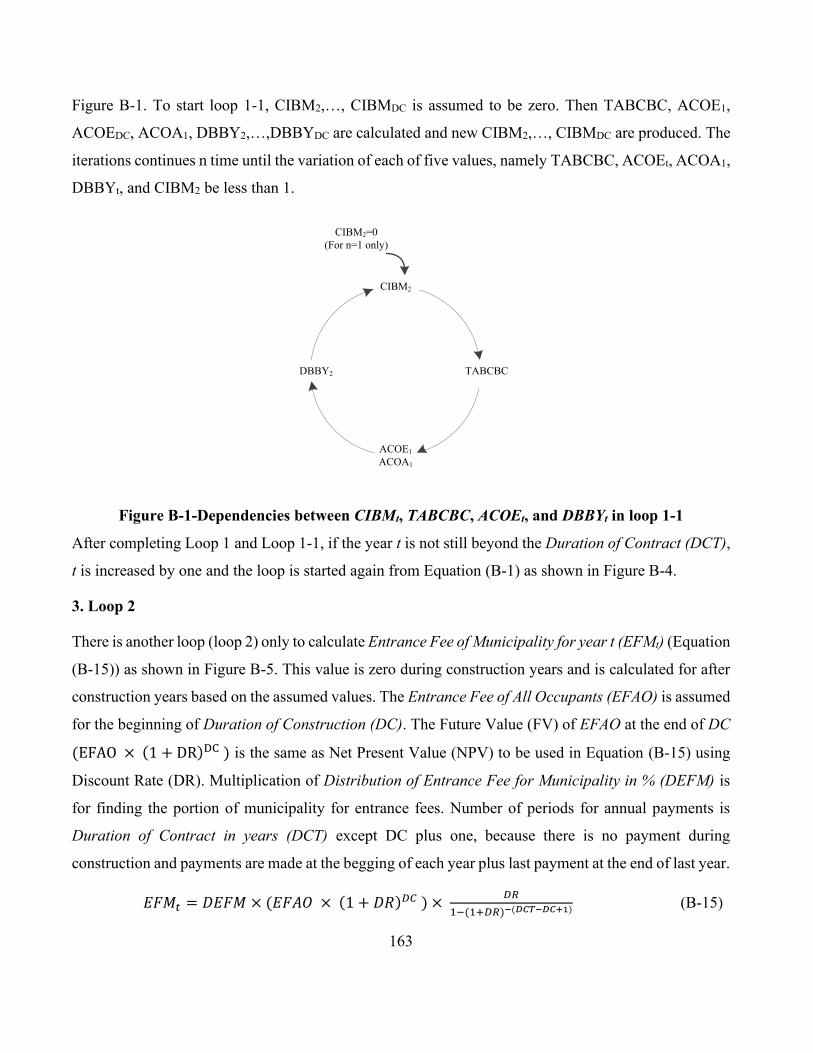
163
Figure B-1. To start loop 1-1, CIBM2,…, CIBMDC is assumed to be zero. Then TABCBC, ACOE1,
ACOEDC, ACOA1, DBBY2,…,DBBYDC are calculated and new CIBM2,…, CIBMDC are produced. The
iterations continues n time until the variation of each of five values, namely TABCBC, ACOEt, ACOA1,
DBBYt, and CIBM2 be less than 1.
DBBY2
ACOE1
ACOA1
TABCBC
CIBM2
CIBM2=0
(For n=1 only)
Figure B-1-Dependencies between CIBMt, TABCBC, ACOEt, and DBBYt in loop 1-1
After completing Loop 1 and Loop 1-1, if the year t is not still beyond the Duration of Contract (DCT),
t is increased by one and the loop is started again from Equation (B-1) as shown in Figure B-4.
3. Loop 2
There is another loop (loop 2) only to calculate Entrance Fee of Municipality for year t (EFMt) (Equation
(B-15)) as shown in Figure B-5. This value is zero during construction years and is calculated for after
construction years based on the assumed values. The Entrance Fee of All Occupants (EFAO) is assumed
for the beginning of Duration of Construction (DC). The Future Value (FV) of EFAO at the end of DC
(EFAO × (1 + DR)DC ) is the same as Net Present Value (NPV) to be used in Equation (B-15) using
Discount Rate (DR). Multiplication of Distribution of Entrance Fee for Municipality in % (DEFM) is
for finding the portion of municipality for entrance fees. Number of periods for annual payments is
Duration of Contract in years (DCT) except DC plus one, because there is no payment during
construction and payments are made at the begging of each year plus last payment at the end of last year.
𝐸𝐹𝑀𝑡 = 𝐷𝐸𝐹𝑀 × (𝐸𝐹𝐴𝑂 × (1 + 𝐷𝑅)𝐷𝐶 ) × 𝐷𝑅
1−(1+𝐷𝑅)−(𝐷𝐶𝑇−𝐷𝐶+1) (B-15)
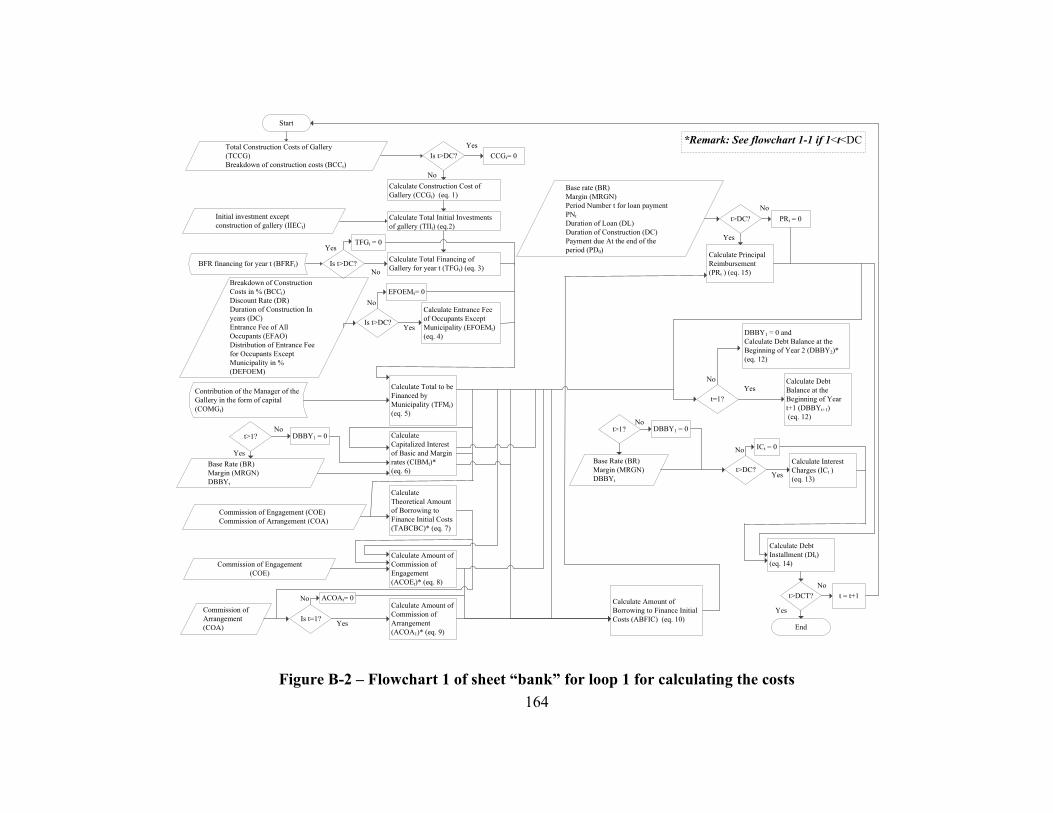
164
Total Construction Costs of Gallery
(TCCG)
Breakdown of construction costs (BCCt)
Calculate Construction Cost of
Gallery (CCGt) (eq. 1)
Initial investment except
construction of gallery (IIECt)
Start
Calculate Total Initial Investments
of gallery (TIIt) (eq.2)
BFR financing for year t (BFRFt)Calculate Total Financing of
Gallery for year t (TFGt) (eq. 3)
Calculate Entrance Fee
of Occupants Except
Municipality (EFOEMt)
(eq. 4)
Breakdown of Construction
Costs in % (BCCt)
Discount Rate (DR)
Duration of Construction In
years (DC)
Entrance Fee of All
Occupants (EFAO)
Distribution of Entrance Fee
for Occupants Except
Municipality in %
(DEFOEM)
Contribution of the Manager of the
Gallery in the form of capital
(COMGt)
Calculate Total to be
Financed by
Municipality (TFMt)
(eq. 5)
Base rate (BR)
Margin (MRGN)
Period Number t for loan payment
PNt
Duration of Loan (DL)
Duration of Construction (DC)
Payment due At the end of the
period (PD0)Calculate Principal
Reimbursement
(PRt ) (eq. 15)
Calculate Debt
Balance at the
Beginning of Year
t+1 (DBBYt+1)
(eq. 12)
Calculate Interest
Charges (ICt )
(eq. 13)
Base Rate (BR)
Margin (MRGN)
DBBYt
Calculate Debt
Installment (DIt)
(eq. 14)
Calculate
Capitalized Interest
of Basic and Margin
rates (CIBMt)*
(eq. 6)Base Rate (BR)
Margin (MRGN)
DBBYt
Calculate
Theoretical Amount
of Borrowing to
Finance Initial Costs
(TABCBC)* (eq. 7)
Commission of Engagement (COE)
Commission of Arrangement (COA)
Calculate Amount of
Commission of
Engagement
(ACOEt)* (eq. 8)
Commission of Engagement
(COE)
Commission of
Arrangement
(COA)
Calculate Amount of
Commission of
Arrangement
(ACOA1)* (eq. 9)End
Calculate Amount of
Borrowing to Finance Initial
Costs (ABFIC) (eq. 10)
t>DC?
Yes
PRt = 0
No
t=1?
Yes
No
DBBY1 = 0 and
Calculate Debt Balance at the
Beginning of Year 2 (DBBY2)*
(eq. 12)
t>DC?Yes
No ICt = 0
Is t=1?Yes
No ACOAt= 0
Is t>DC?Yes
No
EFOEMt= 0
Is t>DC?
Yes
No
CCGt= 0
Is t>DC?
Yes
No
TFGt = 0
t>1?
Yes
DBBY1 = 0No t>1? DBBY1 = 0
No
t>DCT?
Yes
t = t+1
No
*Remark: See flowchart 1-1 if 1<t<DC
Figure B-2 – Flowchart 1 of sheet “bank” for loop 1 for calculating the costs
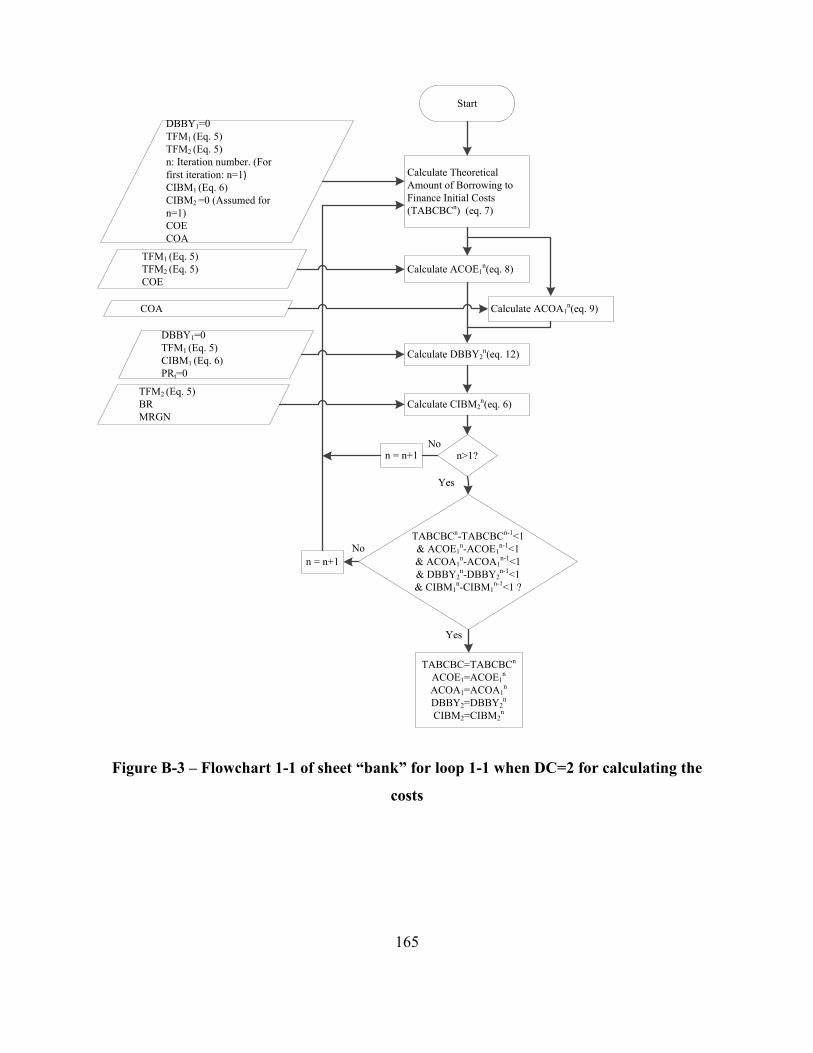
165
DBBY1=0
TFM1 (Eq. 5)
TFM2 (Eq. 5)
n: Iteration number. (For
first iteration: n=1)CIBM1 (Eq. 6)
CIBM2 =0 (Assumed for
n=1)
COE
COA
Start
Calculate Theoretical
Amount of Borrowing to
Finance Initial Costs
(TABCBCn) (eq. 7)
Calculate ACOE1n(eq. 8)
Calculate DBBY2n(eq. 12)
Calculate ACOA1n(eq. 9)
TFM1 (Eq. 5)
TFM2 (Eq. 5)
COE
COA
Calculate CIBM2n(eq. 6)
n>1?
No
n = n+1
TABCBCn-TABCBCn-1<1
& ACOE1n-ACOE1
n-1<1
& ACOA1n-ACOA1
n-1<1
& DBBY2n-DBBY2
n-1<1
& CIBM1n-CIBM1
n-1<1 ?
n = n+1
TABCBC=TABCBCn
ACOE1=ACOE1n
ACOA1=ACOA1n
DBBY2=DBBY2n
CIBM2=CIBM2n
No
Yes
Yes
DBBY1=0
TFM1 (Eq. 5)
CIBM1 (Eq. 6)
PRt=0
TFM2 (Eq. 5)
BR
MRGN
Figure B-3 – Flowchart 1-1 of sheet “bank” for loop 1-1 when DC=2 for calculating the
costs
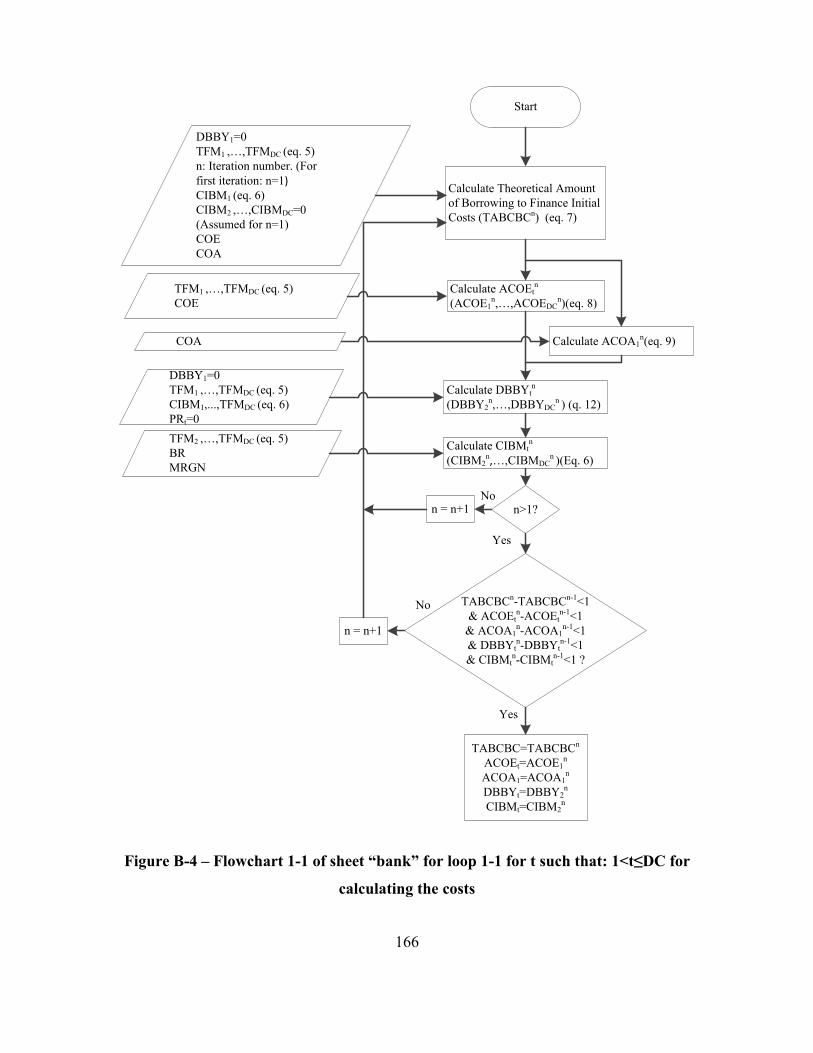
166
DBBY1=0
TFM1 ,…,TFMDC (eq. 5)
n: Iteration number. (For
first iteration: n=1)CIBM1 (eq. 6)
CIBM2 ,…,CIBMDC=0
(Assumed for n=1)
COE
COA
Start
Calculate Theoretical Amount
of Borrowing to Finance Initial
Costs (TABCBCn) (eq. 7)
Calculate ACOEtn
(ACOE1n,…,ACOEDC
n)(eq. 8)
Calculate DBBYtn
(DBBY2n,…,DBBYDC
n ) (q. 12)
Calculate ACOA1n(eq. 9)
TFM1 ,…,TFMDC (eq. 5)
COE
COA
Calculate CIBMtn
(CIBM2n,…,CIBMDC
n )(Eq. 6)
n>1?
No
n = n+1
TABCBCn-TABCBCn-1<1
& ACOEtn-ACOEt
n-1<1
& ACOA1n-ACOA1
n-1<1
& DBBYtn-DBBYt
n-1<1
& CIBMtn-CIBMt
n-1<1 ?
n = n+1
TABCBC=TABCBCn
ACOEt=ACOE1n
ACOA1=ACOA1n
DBBYt=DBBY2n
CIBMt=CIBM2n
No
Yes
Yes
DBBY1=0
TFM1 ,…,TFMDC (eq. 5)
CIBM1,...,TFMDC (eq. 6)
PRt=0
TFM2 ,…,TFMDC (eq. 5)
BR
MRGN
Figure B-4 – Flowchart 1-1 of sheet “bank” for loop 1-1 for t such that: 1<t≤DC for
calculating the costs

167
Figure B-5 – Flowchart of sheet “bank” for loop 2 for calculating the costs