Embed Size (px)
Citation preview
1
Active Transportation Program’s Benefit-Cost Tool
Economic Analysis BranchApril 20, 2015

2
2015 Active Transportation Program
- Guidelines adopted by the California Transportation Commission in March
- The ATP Guidelines describe the policy, standards, criteria and procedures for the development, adoption and management of the Active Transportation Program
- Under Section 18 of the Guidelines, Scoring Criteria – Cost Effectiveness (pg. 14)
- “Caltrans has developed a first generation benefit/cost model for infrastructure and non-infrastructure active transportation projects in order to improve information available to decision makers at the state and MPO level. Applicants must use the benefit/cost model for active transportation projects developed by Caltrans when responding to this criterion (a link to the model is posted on the Commission’s website under Programs/ATP). Applicants are encouraged to provide feedback on instructions, ease of use, inputs, etc. This input will be useful in determining future revisions of the model.”

3
Active Transportation Benefits
Non-Infrastructure Benefits
Infrastructure Benefits
Factors involved in converting people to become active transportation users
Bicycle Infrastructure
Benefits
Pedestrian Infrastructur
e BenefitsPromotional Effort
Perception
Duration Age
Mobility
Health
Safety Recreation
al
ACTIVE TRANSPORTATIONPROJECT BENEFITS
Gas and Emissio
ns
ATP B/C Tool Overview

4
Instructions
5
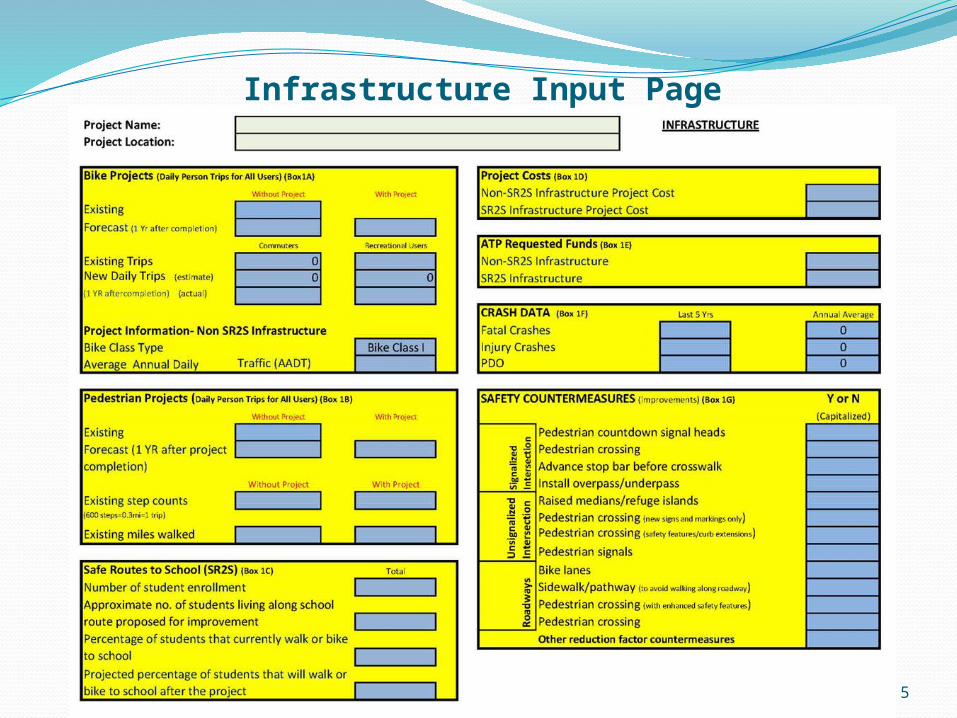
Infrastructure Input Page

6
Project Name: NON-INFRASTRUCTUREProject Location:
Outreach ( SR2S)- (Box 2A) Outreach (Non SR2S)- (Box 2B) Participants (School Enrollment) Participants Current Active Trans Walker/Bicyclist Users 0 Current Active Trans Walker/Bicyclist Users Percentage of Current Active Trans Walkers/Bicyclists Percentage of Current Active Trans Walkers/Bicyclists Project Cost Project Cost ATP Requested Funds ATP Requested Funds Duration of Outreach (months) Duration of Outreach (months) Outreach to new users 0 Outreach to new users 0
Perception (must be marked with an "x")- (Box 2C) Promotional Effort (must be marked with an "x")- (Box 2D)
Outreach is Hands-on (self-efficacy) Effort Targets 5 E's or 5 P's Overcome Barriers (e.g., dist, time, etc.) Knowledgable Staff/Educator Eliminates Hazards/Threats (speed, crime, etc.) Partnership/Volunteers
Connected or Addresses Connectivity Challenges Creates Community Ownership/Relationship
Creating Value in Using Active Transportation Part of Bigger Effort (e.g., political support)
Age (must be marked with an "x")- (Box 2E) Duration (must be marked with an "x")- (Box 2F)
Younger than 10 One Day 10-12 One Month 13-24 One Year 25-55 Multiple Years 55+ Continuous Effort
Projected New Active Trans Riders Projected New Active Trans RidersLongitudinal New Users 0 Longitudinal New Users 0
CRASH DATA - (Box 2G) Last 5 Yrs Annual Assumption:Fatal Crashes 0 Benefits only accrue for five years, unless the project Injury Crashes 0 is ongoing.PDO 0
Non-Infrastructure Input Page

7
Results Page
20 Year Invest Summary AnalysisTotal Costs $0.00Net Present Cost $0.00Total Benefits $0.00Net Present Benefit $0.00Benefit-Cost Ratio 0.00
20 Year Itemized SavingsMobility $0.00Health $0.00Recreational $0.00Gas & Emissions $0.00Safety $0.00
Funds Requested $0.00Net Present Cost of Funds Requested $0.00Benefit Cost Ratio #DIV/0!

8
ATP Benefits• Mobility Benefits• Class I, Class II, and Class III
• Health Savings• $146 annual per person
• Safety Benefits• Fatality, Injury, and Property Damage Only (PDO)
• VMT Reduction• Gas and Emission Savings
• Recreational

9
Study/Agency Per Capita Cost Savings ($)
Washington DOH 19
Garrett et al. 57
South Carolina DOH 78
Georgia Department of Human Resources 79
Colditz 92
Minnesota DOH >100
Goetz et al. 172
Pronk et al. 176
Pratt 330
Michigan Fitness Foundation 1,175
Estimated Annual Per Capita Cost Savings(direct and/or indirect) of physical activity
Source: NCHRP 552, Appendix G.

10
Parameters
• Value of Time• Based on DOT’s Value of Time Guidance
• Gas Prices• Based on average fuel price (November 2013-
November 2014) – Energy Information Administration (EIA)
• Discount Rate• 4% assumed, based from Cal/B-C model
• Rate of Growth• 2% population growth (1955-2011)
• Catchment Area (CA Household Travel Survey- average length of trip)• 3 miles for biking• .5 for walking

11
SRTS Infrastructure Assumptions
180 school days2 miles distance to school = 1 hour walk ( 1
mile- composite for bike and walk distance back and forth to school)
Value of time for adults was used for child as well since did not quantify time of parents chauffeuring their kids to school.
Safety benefits are assumed to be the same as non-SRTS infrastructure projects.
12
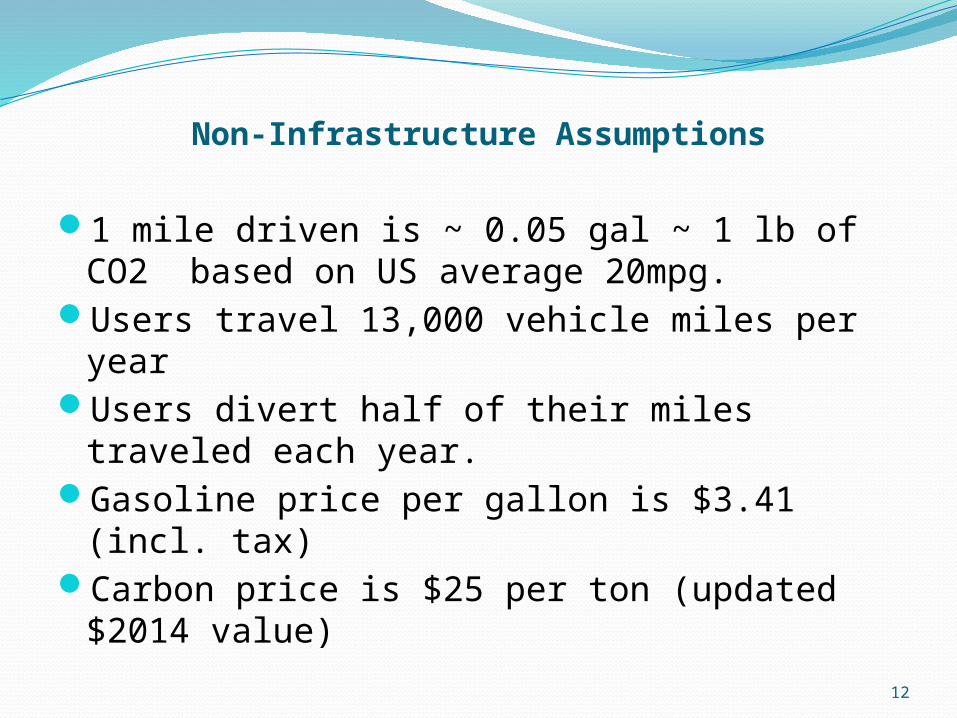
Non-Infrastructure Assumptions
1 mile driven is ~ 0.05 gal ~ 1 lb of CO2 based on US average 20mpg.
Users travel 13,000 vehicle miles per yearUsers divert half of their miles traveled each
year. Gasoline price per gallon is $3.41 (incl. tax) Carbon price is $25 per ton (updated $2014
value)

13
Types of Projects
Non-SRTS InfrastructureSRTS InfrastructureNon-STRS Non-InfrastructureSRTS InfrastructureCombination of Infrastructure & Non-
InfrastructureCombination of SRTS and Non-SRTS Non-
InfrastructureCombination of Non-SRTS and SRTS
Infrastructure
14
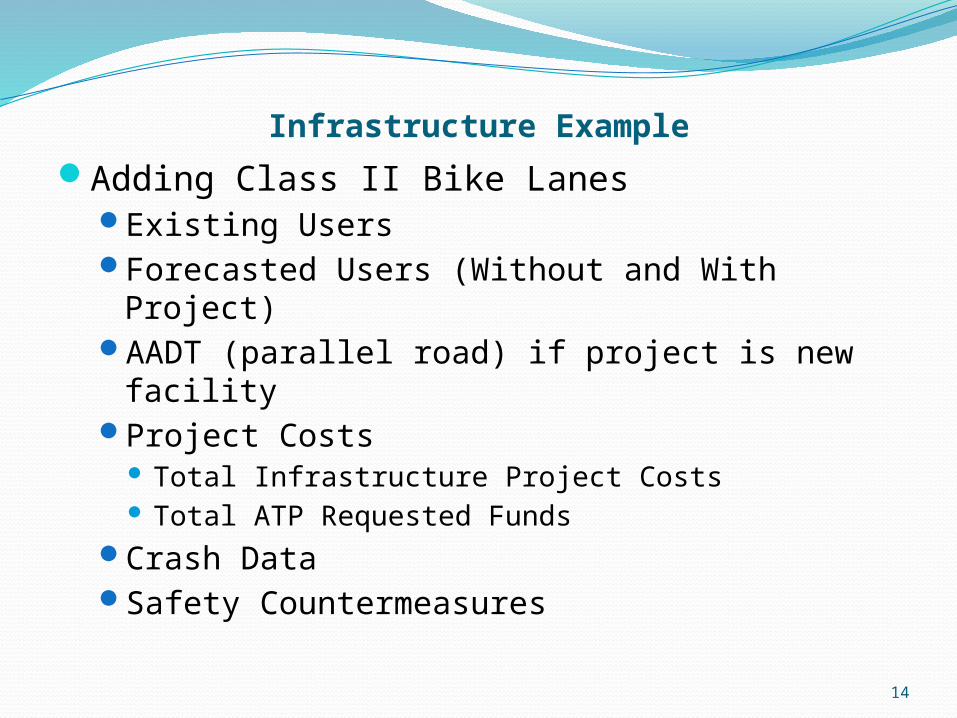
Infrastructure Example
Adding Class II Bike LanesExisting UsersForecasted Users (Without and With Project)AADT (parallel road) if project is new facilityProject Costs
Total Infrastructure Project Costs Total ATP Requested Funds
Crash DataSafety Countermeasures

15
Screenshot of Bike II Lane Completed
INFRASTRUCTURE
Bike Projects (Daily Person Trips for All Users) (Box1A) Project Costs (Box 1D)
Without P roject With P roject $1,175,000Existing 100Forecast (1 Yr after completion) 120 125
Commuters Recreational Users ATP Requested Funds (Box 1E)
Existing Trips 11 33 $560,000New Daily Trips (estimate) 5.5 16.5(1 YR aftercompletion) (actual)
CRASH DATA (Box 1F) Last 5 Yrs Annual Average
Fatal Crashes 0 0Bike Class Type Bike Class I Injury Crashes 2 0.4
Traffic (AADT) PDO 1 0.2
Pedestrian Projects (Daily Person Trips for All Users) (Box 1B) Y or NWithout P roject With P roject (Capita l i zed)
Pedestrian countdown signal headsPedestrian crossingAdvance stop bar before crosswalk
Without Project With Project Install overpass/underpassExisting step counts Raised medians/refuge islands(600 steps=0.3mi=1 trip) Pedestrian crossing (new signs and markings only)Existing miles walked Pedestrian crossing (safety features/curb extensions)
Pedestrian signalsSafe Routes to School (SR2S) (Box 1C) Total Bike lanes Y
Sidewalk/pathway (to avoid walking along roadway) YPedestrian crossing (with enhanced safety features)Pedestrian crossingOther reduction factor countermeasures YPercentage of students that currently walk or
bike to school
Existing
Projected percentage of students that will walk or bike to school after the project
Ro
adw
ays
Un
sign
aliz
ed
In
ters
ecti
on
Forecast (1 YR after project completion)
Number of student enrollmentApproximate no. of students living along school route proposed for improvement
Average Annual Daily
Project Information- Non SR2S Infrastructure
Sign
aliz
ed
Inte
rsec
tion
Project Name:Project Location:
Adding Class II Bike LaneCity of Utopia
SAFETY COUNTERMEASURES (improvements) (Box 1G)
Non-SR2S Infrastructure Project CostSR2S Infrastructure Project Cost
Non-SR2S Infrastructure SR2S Infrastructure

16
Results
Funds Requested $560,000.00Net Present Cost of Funds Requested $538,461.54Benefit Cost Ratio 3.48
Safety
$914,061.75$88,900.38
$41,685.18$690,093.90
Gas & Emissions
Mobility
Recreational $1,093,673.21
20 Year Invest Summary Analysis
20 Year Itemized Savings
$1,129,807.69$2,828,414.41
Health
Net Present Cost$1,175,000.00
$1,873,200.921.66
Total Costs
Total BenefitsNet Present BenefitBenefit-Cost Ratio

17
Non-Infrastructure Example
Safe Routes to School Evaluation/Education Project School EnrollmentActive Transportation Walkers/BicyclistsCurrent ATP UsersProject CostsATP Requested FundsDuration of OutreachCrash Data

18
Screenshot of NI Example
NON-INFRASTRUCTURE
Outreach ( SR2S)- (Box 2A) Outreach (Non SR2S)- (Box 2B)
Participants (School Enrollment) 2,565 Participants Current Active Trans Walker/Bicyclist Users 128 Current Active Trans Walker/Bicyclist UsersPercentage of Current Active Trans Walkers/Bicyclists 5% Percentage of Current Active Trans Walkers/BicyclistsProject Cost $750,000 Project CostATP Requested Funds $500,000 ATP Requested FundsDuration of Outreach (months) 36 Duration of Outreach (months)Outreach to new users 2,437 Outreach to new users 0
x xx
x xx xx x
x
x
Longitudinal New Users 518 Longitudinal New Users 0
CRASH DATA - (Box 2G) Last 5 Yrs Annual Assumption:Fatal Crashes 0 0 Benefits only accrue for five years, unless the project Injury Crashes 20 4 is ongoing.PDO 0 0
Promotional Effort (must be marked with an "x")- (Box 2D)
Age (must be marked with an "x")- (Box 2E) Duration (must be marked with an "x")- (Box 2F)
Perception (must be marked with an "x")- (Box 2C)
Outreach is Hands-on (self-efficacy)
Creates Community Ownership/RelationshipPart of Bigger Effort (e.g., political support)
Eliminates Hazards/Threats (speed, crime, etc.)Connected or Addresses Connectivity ChallengesCreating Value in Using Active Transportation
Overcome Barriers (e.g., dist, time, etc.)Effort Targets 5 E's or 5 P'sKnowledgable Staff/EducatorPartnership/Volunteers
13-2425-5555+
Project Name: Evaluations/Education ProgramProject Location:
Projected New Active Trans RidersProjected New Active Trans Riders
Younger than 1010-12
One YearMultiple YearsContinuous Effort
One MonthOne Day

19
Results
Funds Requested $500,000.00Net Present Cost of Funds Requested $480,769.23Benefit Cost Ratio 8.19
Safety
$0.00$393,426.31
$3,205,346.58$832,646.43
Gas & Emissions
Mobility
Recreational $0.00
20 Year Invest Summary Analysis
20 Year Itemized Savings
$721,153.85$4,431,419.32
Health
Net Present Cost$750,000.00
$3,939,456.235.46
Total Costs
Total BenefitsNet Present BenefitBenefit-Cost Ratio
20
Sources
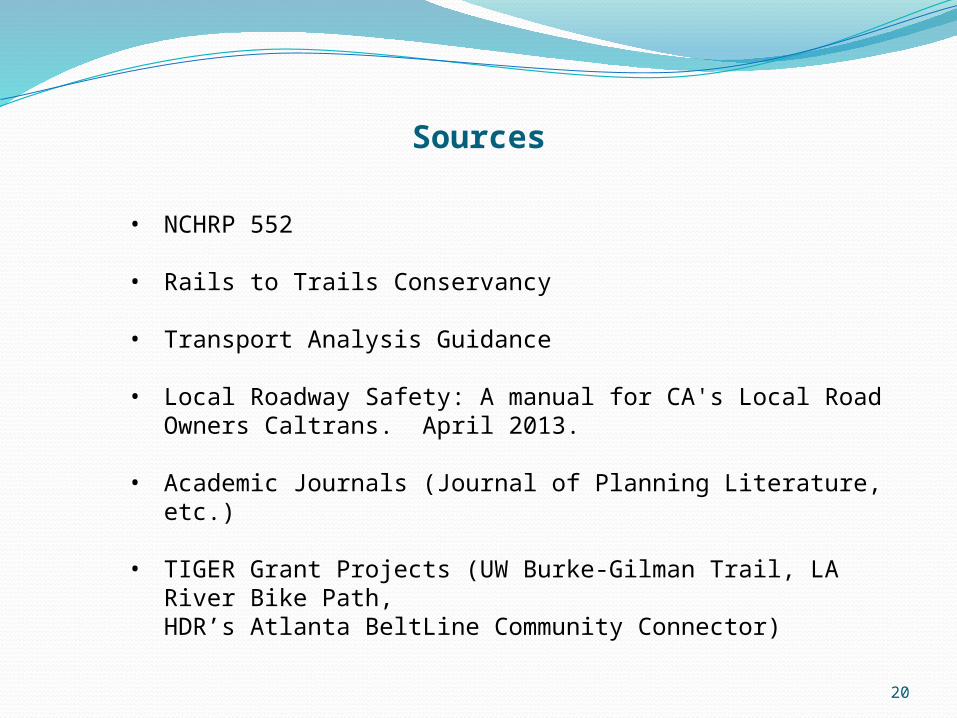
• NCHRP 552
• Rails to Trails Conservancy
• Transport Analysis Guidance
• Local Roadway Safety: A manual for CA's Local Road Owners Caltrans. April 2013.
• Academic Journals (Journal of Planning Literature, etc.)
• TIGER Grant Projects (UW Burke-Gilman Trail, LA River Bike Path,HDR’s Atlanta BeltLine Community Connector)
21
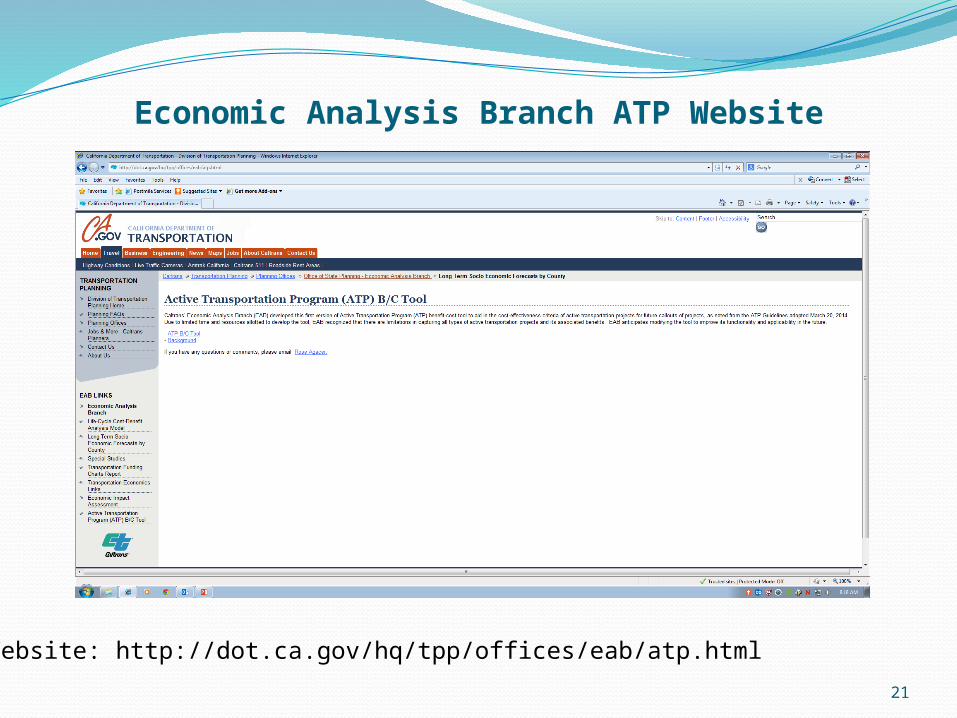
Economic Analysis Branch ATP Website
Website: http://dot.ca.gov/hq/tpp/offices/eab/atp.html
22
Contacts
Lead Economist (Primary Investigator): Rose Agacer-SolisEmail: [email protected] Number: (916) 651-6014
Staff Economist (Non-Infrastructure Investigator): Ryan OngEmail: [email protected] Number: (916) 651-6887
Economic Analysis Branch Manager: Barry PadillaEmail: [email protected] Number: (916) 653-9248