Embed Size (px)
Citation preview

© Copyright Incyte Consulting 2012
Economic Aspects and Costing of NGNs
Cotonou, Benin 8-9 May 2012
2 © Copyright Incyte Consulting 2010 © Copyright Incyte Consulting 2012
Agenda
Cost modelling purpose and concepts
The impact of NGN on cost modelling
Key areas of discussion – NGN cost estimates
Recommendations
3 © Copyright Incyte Consulting 2010 © Copyright Incyte Consulting 2012
Cost modeling purpose and concepts
4 © Copyright Incyte Consulting 2010 © Copyright Incyte Consulting 2012
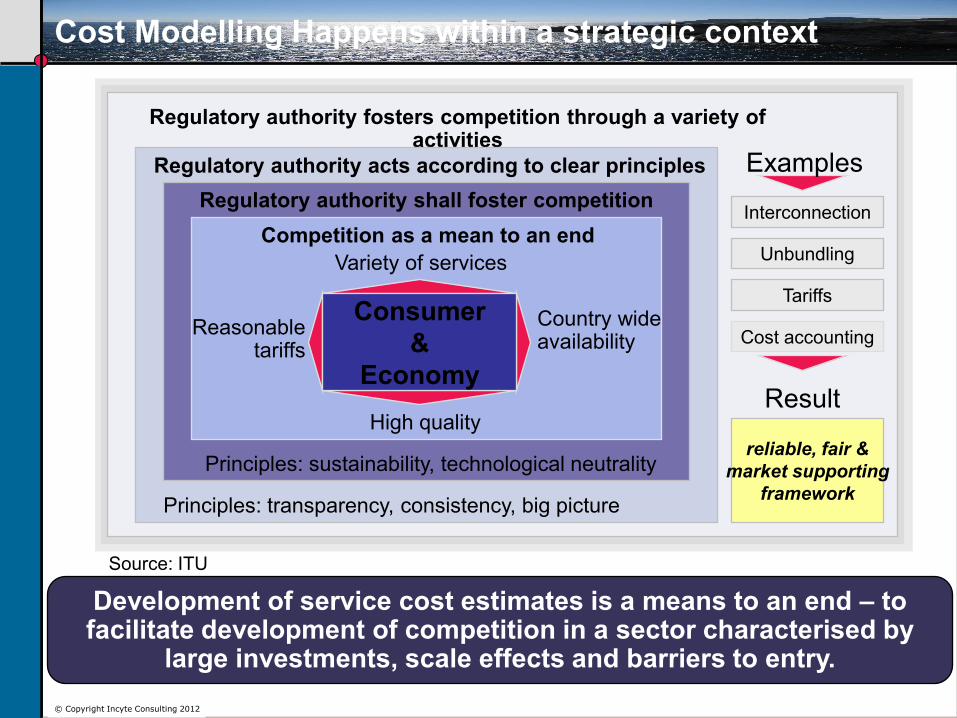
Development of service cost estimates is a means to an end – to facilitate development of competition in a sector characterised by
large investments, scale effects and barriers to entry.
Cost Modelling Happens within a strategic context
Regulatory authority fosters competition through a variety of activities
Regulatory authority acts according to clear principles
Principles: transparency, consistency, big picture
Regulatory authority shall foster competition
Principles: sustainability, technological neutrality
Competition as a mean to an end
Variety of services
High quality
Reasonable tariffs
Country wide availability
Consumer
&
Economy
Examples
Interconnection
Unbundling
Tariffs
Cost accounting
Result
reliable, fair &
market supporting
framework
Source: ITU
5 © Copyright Incyte Consulting 2010 © Copyright Incyte Consulting 2012
Development of service cost estimates is a means to an end – to facilitate development of competition in a sector characterised by
large investments, scale effects and barriers to entry.
Cost Modelling Purpose
Cost = resource quantity (labour, capital) * price
The valuation of the price component depends on the purpose of cost accounting!
Aim is to encourage economically efficient investment and sustainable competition to promote the long term interests of end users.
Cost accounting can be utilised for different – often incompatible – purposes:
Efficient use of existing infrastructure
Investment in new infrastructure by incumbents and new entrants
Regulation of access services is required where there is potential market failure
Without infrastructure based competition - ongoing regulation will be necessary.
6 © Copyright Incyte Consulting 2010 © Copyright Incyte Consulting 2012
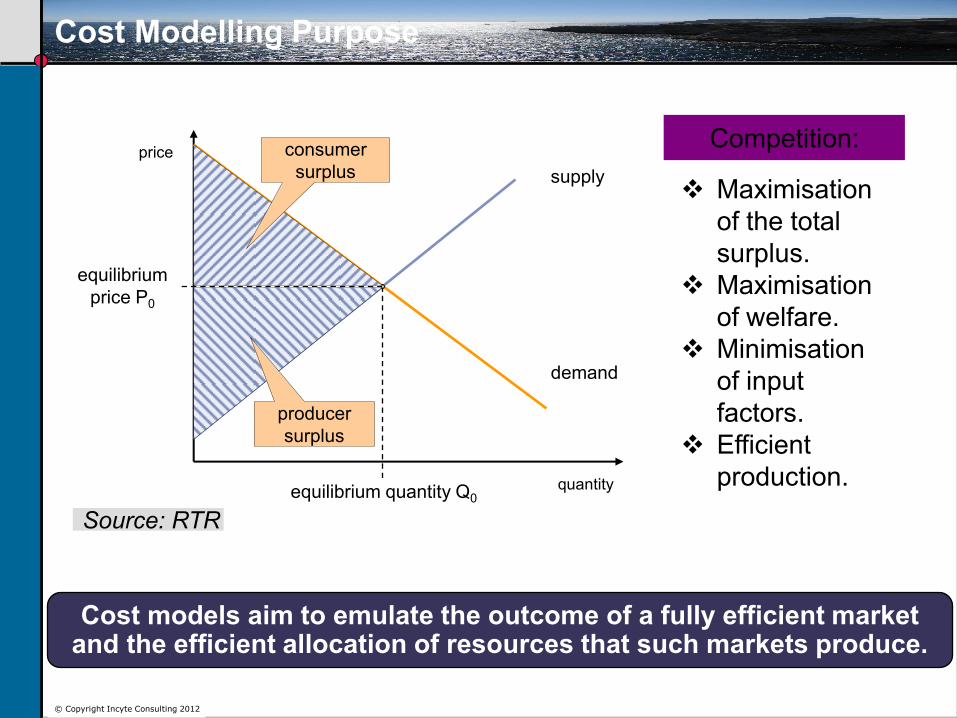
Cost models aim to emulate the outcome of a fully efficient market and the efficient allocation of resources that such markets produce.
Cost Modelling Purpose
Source: RTR
price
quantity
supply
demand
equilibrium
price P0
equilibrium quantity Q0
consumer
surplus
producer
surplus
Competition:
Maximisation
of the total
surplus.
Maximisation
of welfare.
Minimisation
of input
factors.
Efficient
production.
7 © Copyright Incyte Consulting 2010 © Copyright Incyte Consulting 2012
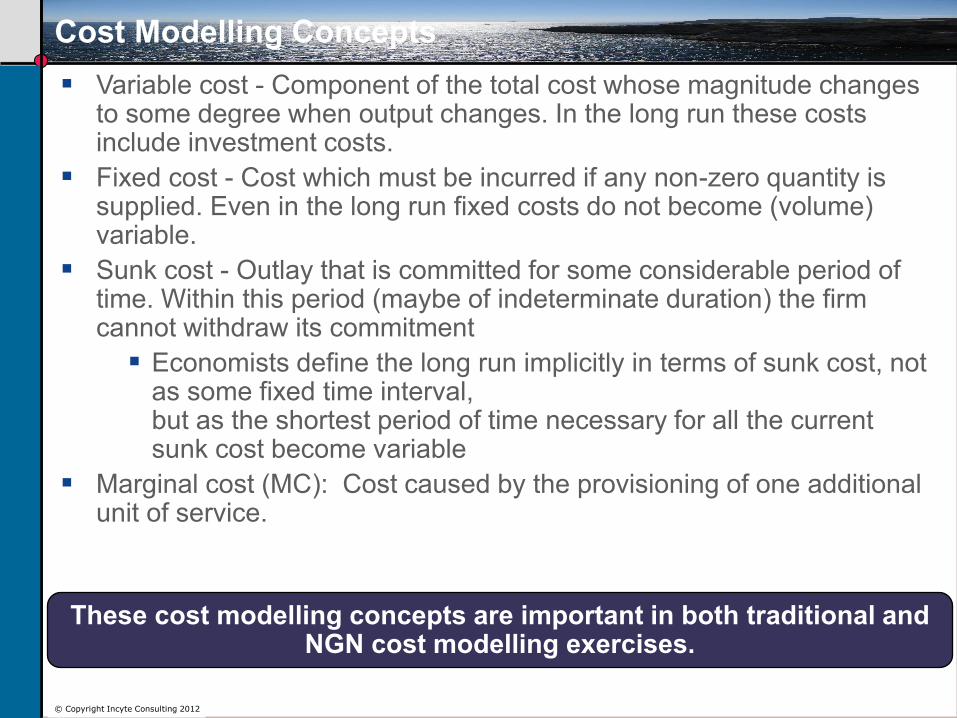
These cost modelling concepts are important in both traditional and NGN cost modelling exercises.
Cost Modelling Concepts
Variable cost - Component of the total cost whose magnitude changes to some degree when output changes. In the long run these costs include investment costs.
Fixed cost - Cost which must be incurred if any non-zero quantity is supplied. Even in the long run fixed costs do not become (volume) variable.
Sunk cost - Outlay that is committed for some considerable period of time. Within this period (maybe of indeterminate duration) the firm cannot withdraw its commitment
Economists define the long run implicitly in terms of sunk cost, not as some fixed time interval, but as the shortest period of time necessary for all the current sunk cost become variable
Marginal cost (MC): Cost caused by the provisioning of one additional unit of service.
8 © Copyright Incyte Consulting 2010 © Copyright Incyte Consulting 2012
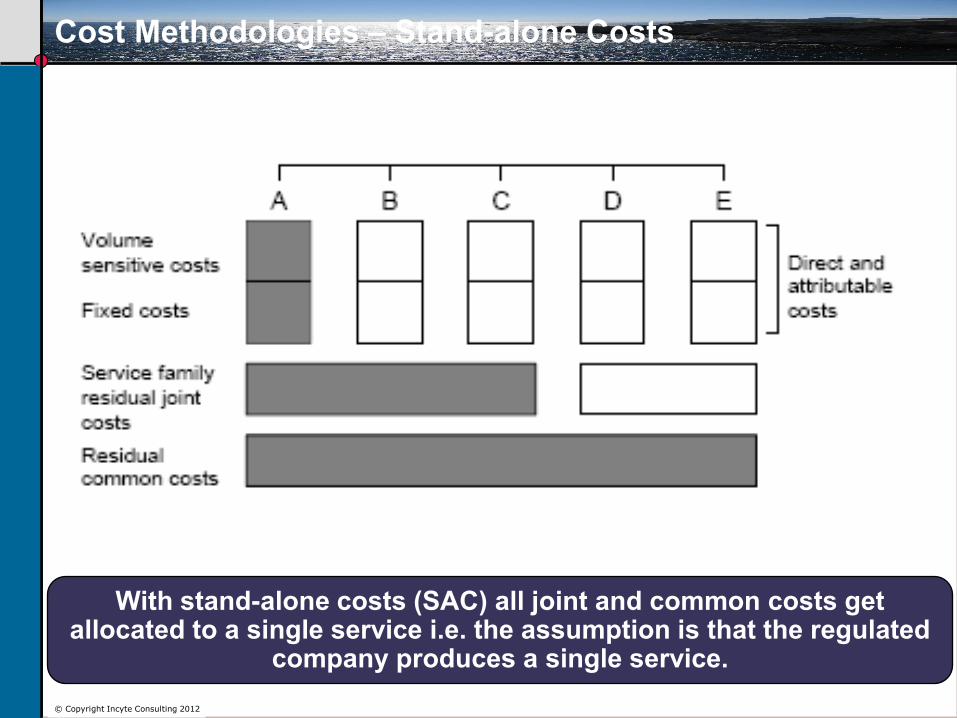
With stand-alone costs (SAC) all joint and common costs get allocated to a single service i.e. the assumption is that the regulated
company produces a single service.
Cost Methodologies – Stand-alone Costs
9 © Copyright Incyte Consulting 2010 © Copyright Incyte Consulting 2012
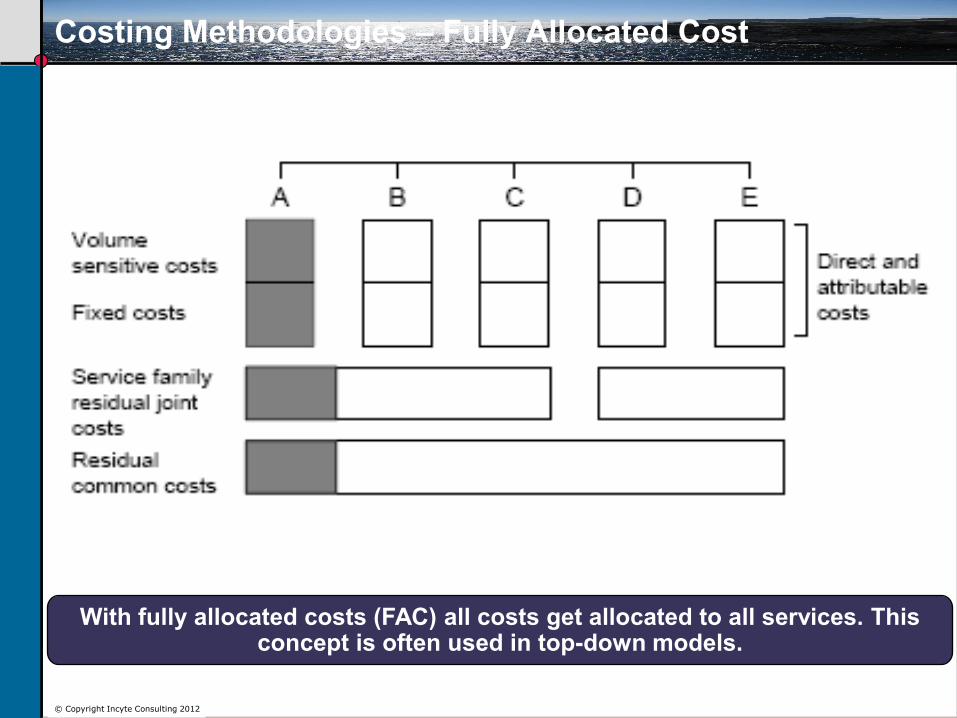
With fully allocated costs (FAC) all costs get allocated to all services. This concept is often used in top-down models.
Costing Methodologies – Fully Allocated Cost
10 © Copyright Incyte Consulting 2010 © Copyright Incyte Consulting 2012
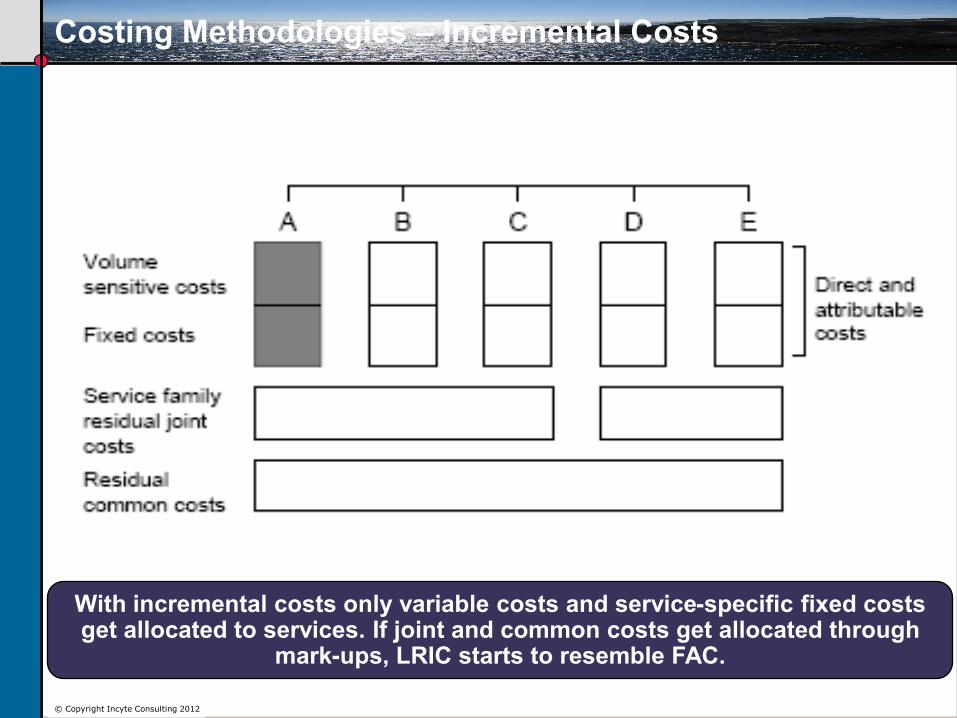
With incremental costs only variable costs and service-specific fixed costs get allocated to services. If joint and common costs get allocated through
mark-ups, LRIC starts to resemble FAC.
Costing Methodologies – Incremental Costs
11 © Copyright Incyte Consulting 2010
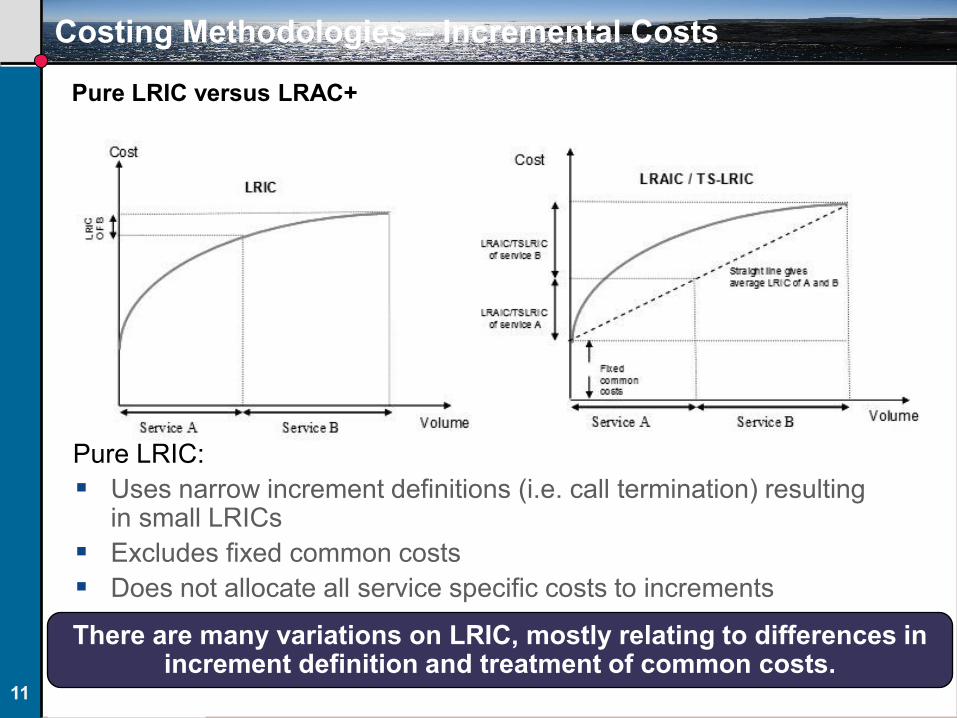
Pure LRIC versus LRAC+
Pure LRIC:
Uses narrow increment definitions (i.e. call termination) resulting in small LRICs
Excludes fixed common costs
Does not allocate all service specific costs to increments
Costing Methodologies – Incremental Costs
There are many variations on LRIC, mostly relating to differences in increment definition and treatment of common costs.
12 © Copyright Incyte Consulting 2010
When to use LRIC standards
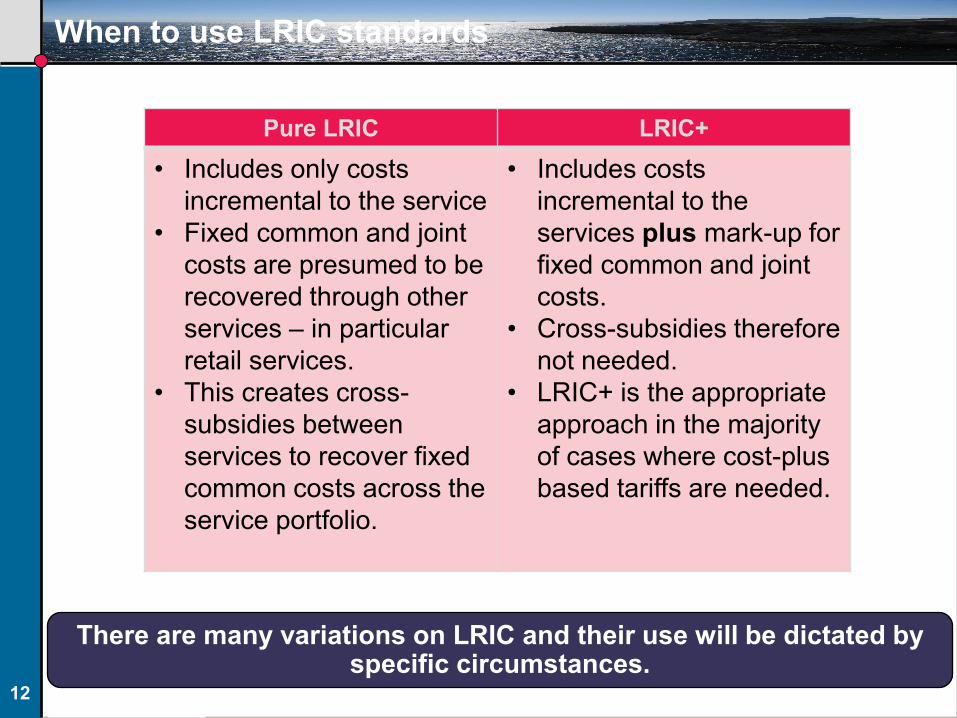
There are many variations on LRIC and their use will be dictated by specific circumstances.
Pure LRIC LRIC+
• Includes only costs
incremental to the service
• Fixed common and joint
costs are presumed to be
recovered through other
services – in particular
retail services.
• This creates cross-
subsidies between
services to recover fixed
common costs across the
service portfolio.
• Includes costs
incremental to the
services plus mark-up for
fixed common and joint
costs.
• Cross-subsidies therefore
not needed.
• LRIC+ is the appropriate
approach in the majority
of cases where cost-plus
based tariffs are needed.
13 © Copyright Incyte Consulting 2010
When to use LRIC standards
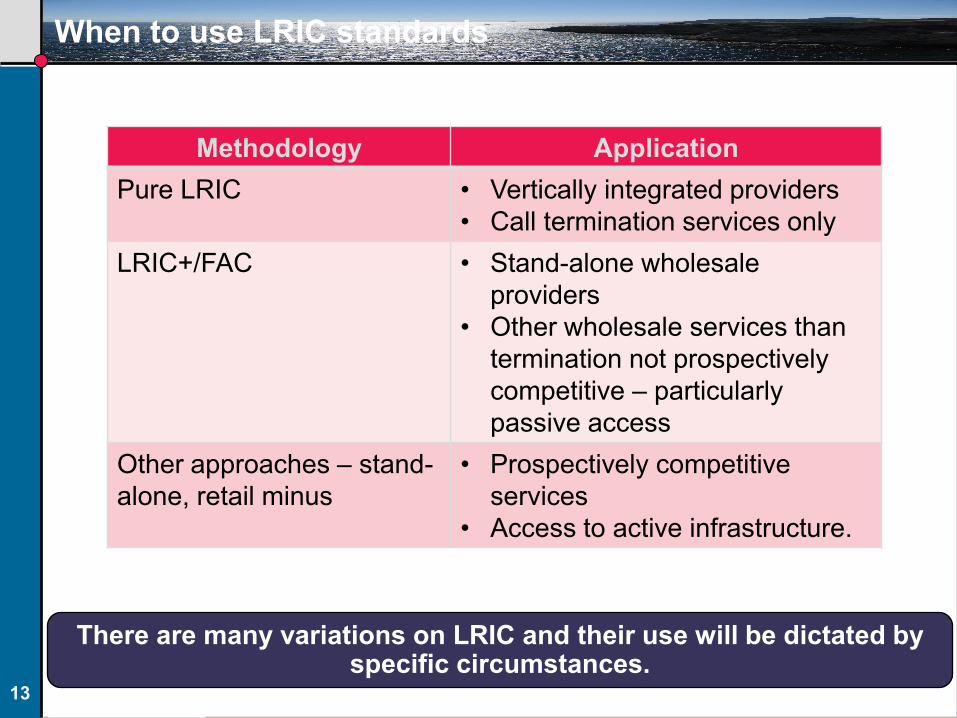
There are many variations on LRIC and their use will be dictated by specific circumstances.
Methodology Application
Pure LRIC • Vertically integrated providers
• Call termination services only
LRIC+/FAC • Stand-alone wholesale
providers
• Other wholesale services than
termination not prospectively
competitive – particularly
passive access
Other approaches – stand-
alone, retail minus
• Prospectively competitive
services
• Access to active infrastructure.
14 © Copyright Incyte Consulting 2010 © Copyright Incyte Consulting 2012
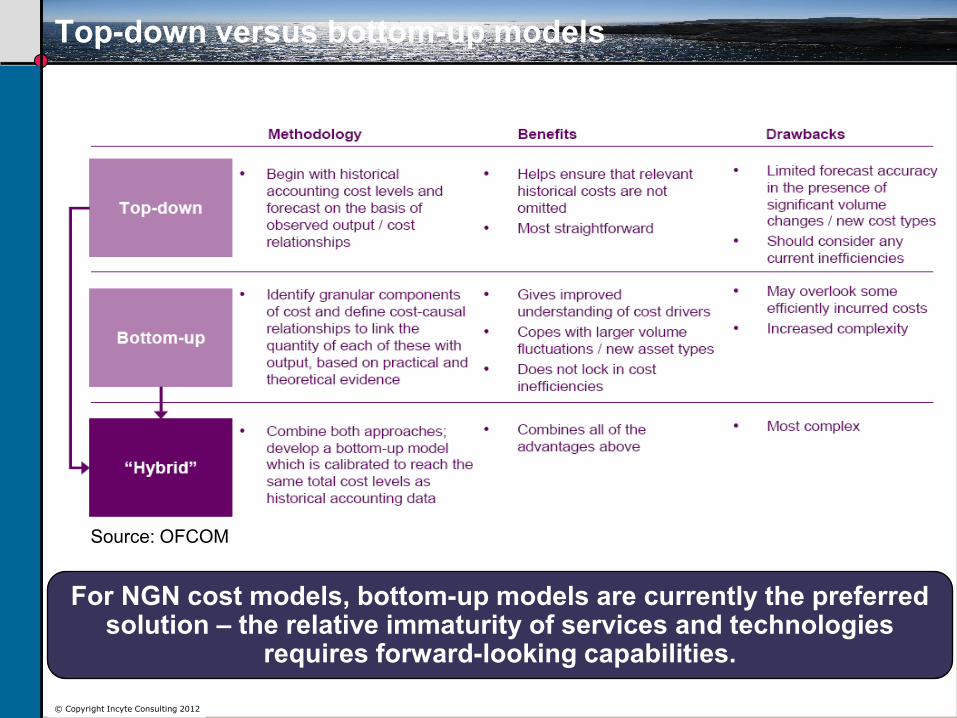
For NGN cost models, bottom-up models are currently the preferred solution – the relative immaturity of services and technologies
requires forward-looking capabilities.
Top-down versus bottom-up models
Source: OFCOM
15 © Copyright Incyte Consulting 2010 © Copyright Incyte Consulting 2012
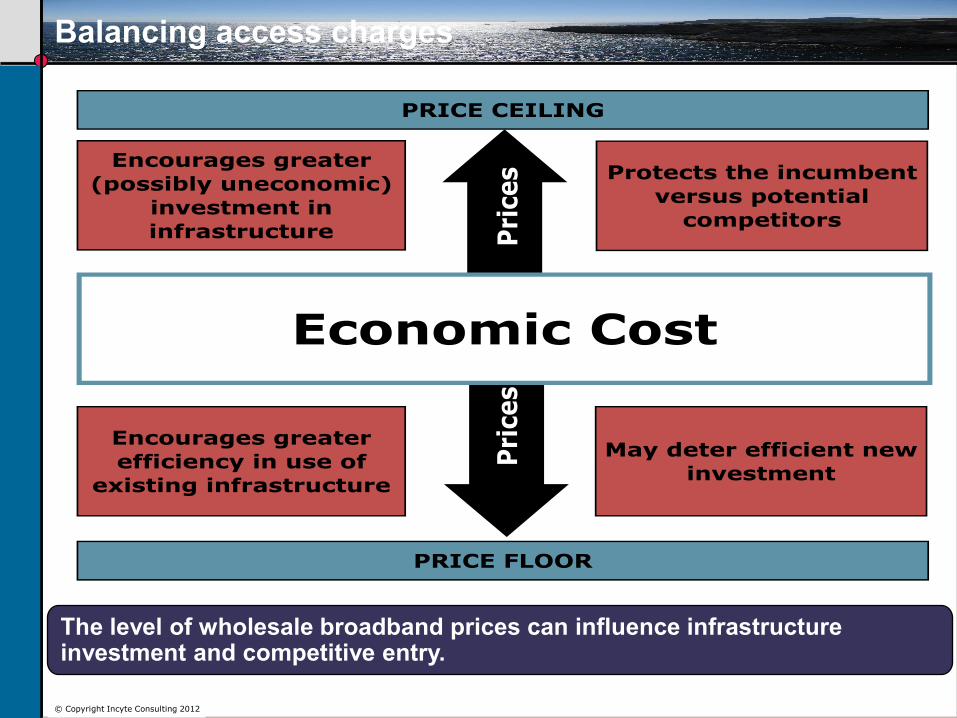
Balancing access charges
The level of wholesale broadband prices can influence infrastructure investment and competitive entry.
16 © Copyright Incyte Consulting 2010 © Copyright Incyte Consulting 2012
The impact of NGN on cost modeling
17 © Copyright Incyte Consulting 2010 © Copyright Incyte Consulting 2012
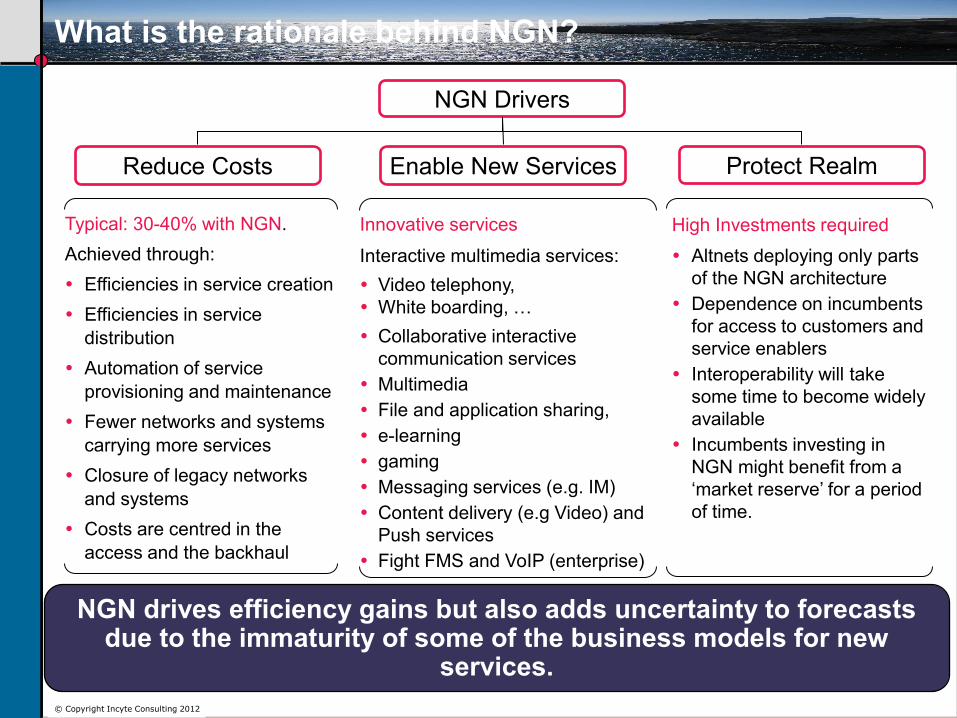
What is the rationale behind NGN?
Innovative services
Interactive multimedia services:
Video telephony,
White boarding, …
Collaborative interactive
communication services
Multimedia
File and application sharing,
e-learning
gaming
Messaging services (e.g. IM)
Content delivery (e.g Video) and
Push services
Fight FMS and VoIP (enterprise)
Typical: 30-40% with NGN.
Achieved through:
Efficiencies in service creation
Efficiencies in service
distribution
Automation of service
provisioning and maintenance
Fewer networks and systems
carrying more services
Closure of legacy networks
and systems
Costs are centred in the
access and the backhaul
High Investments required
Altnets deploying only parts
of the NGN architecture
Dependence on incumbents
for access to customers and
service enablers
Interoperability will take
some time to become widely
available
Incumbents investing in
NGN might benefit from a
‘market reserve’ for a period
of time.
Reduce Costs Enable New Services Protect Realm
NGN Drivers
NGN drives efficiency gains but also adds uncertainty to forecasts due to the immaturity of some of the business models for new
services.
18 © Copyright Incyte Consulting 2010 © Copyright Incyte Consulting 2012
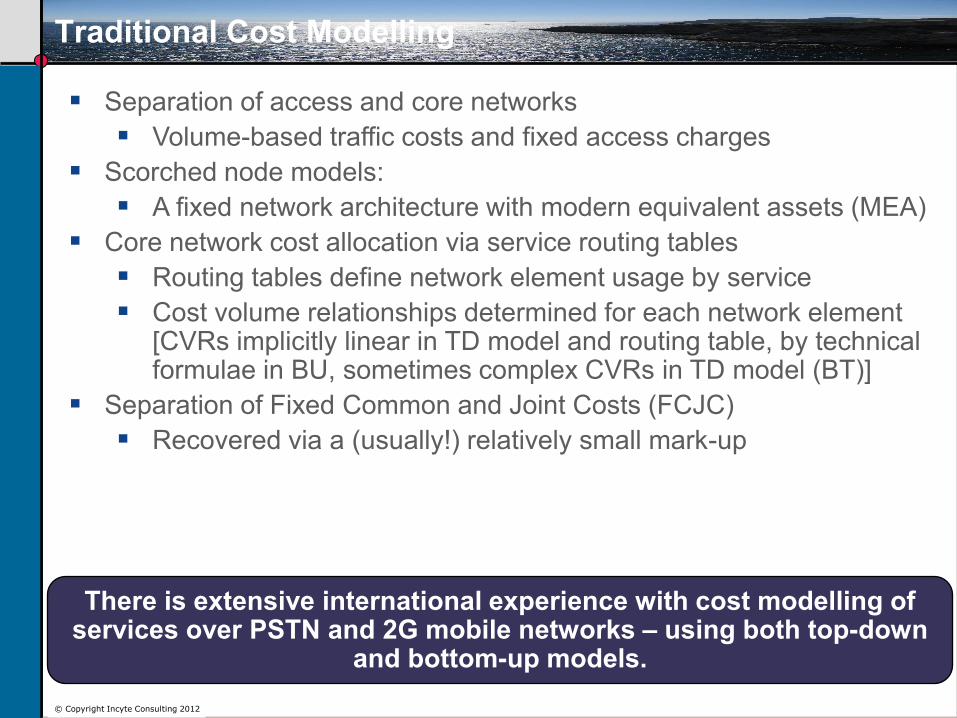
There is extensive international experience with cost modelling of services over PSTN and 2G mobile networks – using both top-down
and bottom-up models.
Traditional Cost Modelling
Separation of access and core networks
Volume-based traffic costs and fixed access charges
Scorched node models:
A fixed network architecture with modern equivalent assets (MEA)
Core network cost allocation via service routing tables
Routing tables define network element usage by service
Cost volume relationships determined for each network element [CVRs implicitly linear in TD model and routing table, by technical formulae in BU, sometimes complex CVRs in TD model (BT)]
Separation of Fixed Common and Joint Costs (FCJC)
Recovered via a (usually!) relatively small mark-up
19 © Copyright Incyte Consulting 2010 © Copyright Incyte Consulting 2012
1
9
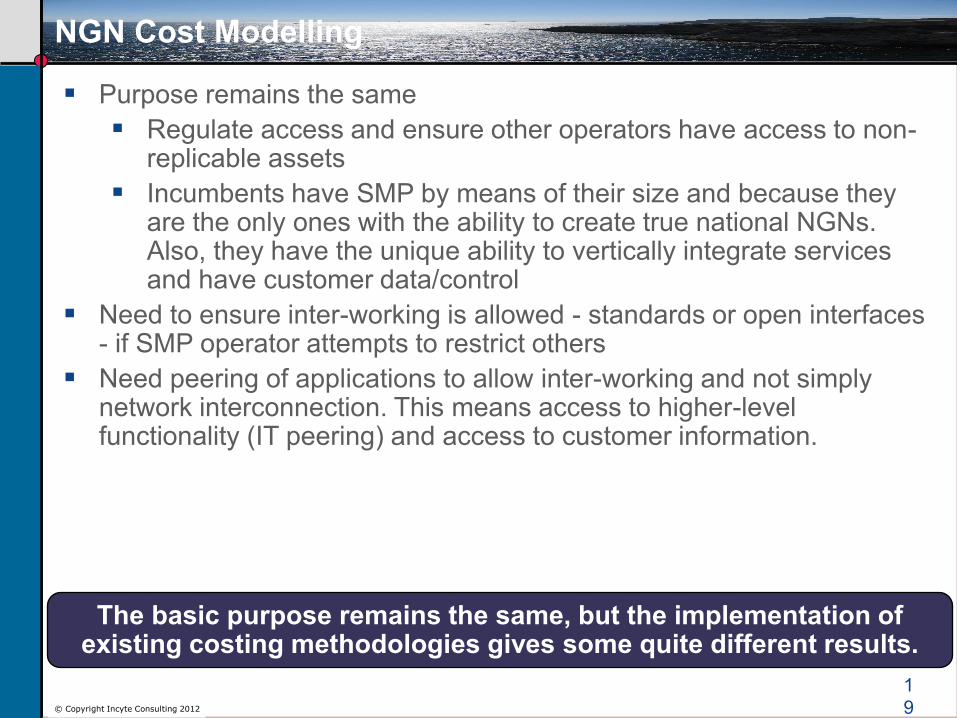
Purpose remains the same
Regulate access and ensure other operators have access to non-replicable assets
Incumbents have SMP by means of their size and because they are the only ones with the ability to create true national NGNs. Also, they have the unique ability to vertically integrate services and have customer data/control
Need to ensure inter-working is allowed - standards or open interfaces - if SMP operator attempts to restrict others
Need peering of applications to allow inter-working and not simply network interconnection. This means access to higher-level functionality (IT peering) and access to customer information.
NGN Cost Modelling
The basic purpose remains the same, but the implementation of existing costing methodologies gives some quite different results.
20 © Copyright Incyte Consulting 2010 © Copyright Incyte Consulting 2012
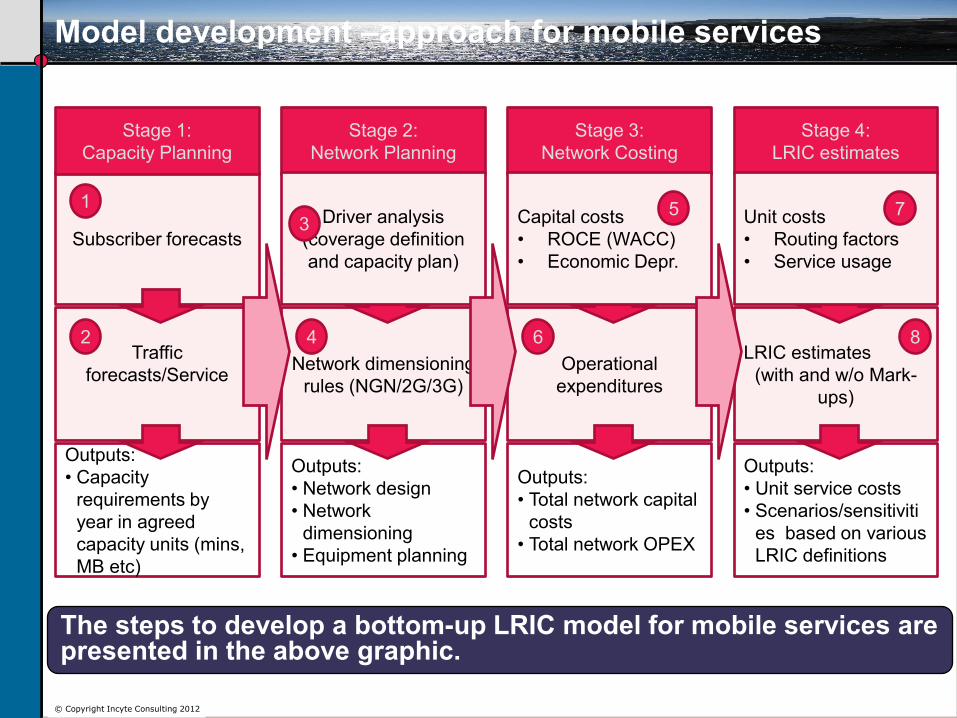
Model development –approach for mobile services
The steps to develop a bottom-up LRIC model for mobile services are presented in the above graphic.
Subscriber forecasts
Stage 1:
Capacity Planning
Traffic
forecasts/Service
Outputs:
• Capacity
requirements by
year in agreed
capacity units (mins,
MB etc)
Stage 1:
Capacity Planning
1
2
Network dimensioning
rules (NGN/2G/3G)
4
Stage 2:
Network Planning
Driver analysis
(coverage definition
and capacity plan)
3
Outputs:
• Network design
• Network
dimensioning
• Equipment planning
Operational
expenditures
6
Stage 3:
Network Costing
Capital costs
• ROCE (WACC)
• Economic Depr.
5
Outputs:
• Total network capital
costs
• Total network OPEX
LRIC estimates
(with and w/o Mark-
ups)
8
Stage 4:
LRIC estimates
Unit costs
• Routing factors
• Service usage
7
Outputs:
• Unit service costs
• Scenarios/sensitiviti
es based on various
LRIC definitions
21 © Copyright Incyte Consulting 2010 © Copyright Incyte Consulting 2012
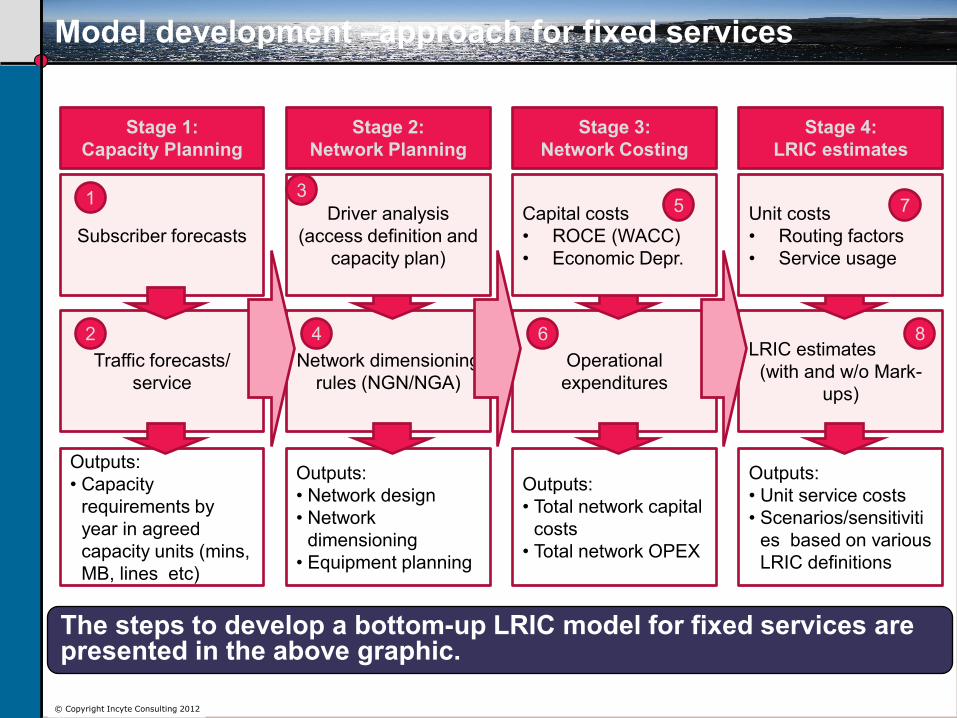
Model development –approach for fixed services
Subscriber forecasts
Traffic forecasts/
service
Outputs:
• Capacity
requirements by
year in agreed
capacity units (mins,
MB, lines etc)
Stage 1:
Capacity Planning
1
2
Network dimensioning
rules (NGN/NGA)
4
Stage 2:
Network Planning
Driver analysis
(access definition and
capacity plan)
3
Outputs:
• Network design
• Network
dimensioning
• Equipment planning
Operational
expenditures
6
Stage 3:
Network Costing
Capital costs
• ROCE (WACC)
• Economic Depr.
5
Outputs:
• Total network capital
costs
• Total network OPEX
LRIC estimates
(with and w/o Mark-
ups)
8
Stage 4:
LRIC estimates
Unit costs
• Routing factors
• Service usage
7
Outputs:
• Unit service costs
• Scenarios/sensitiviti
es based on various
LRIC definitions
The steps to develop a bottom-up LRIC model for fixed services are presented in the above graphic.
22 © Copyright Incyte Consulting 2010 © Copyright Incyte Consulting 2012
What is NGN – fixed core network
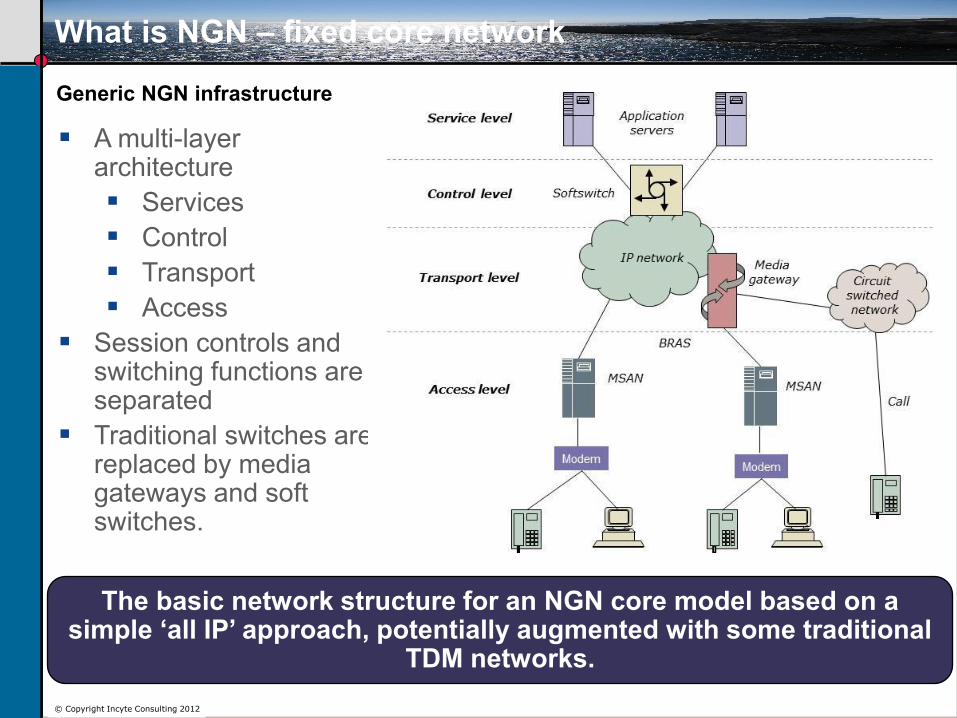
Generic NGN infrastructure
A multi-layer architecture
Services
Control
Transport
Access
Session controls and switching functions are separated
Traditional switches are replaced by media gateways and soft switches.
The basic network structure for an NGN core model based on a simple ‘all IP’ approach, potentially augmented with some traditional
TDM networks.
23 © Copyright Incyte Consulting 2010 © Copyright Incyte Consulting 2012
IP Core Network Design
Single IP core network, interconnected with an optical fibre-based SDH transmission network
Network hierarchy in the model will principally consist of:
Core Routers
Edge Routers
Aggregation Routers
MSANs including telephony and xDSL cards
Media Gateways to provide interconnection with other operators
Softswitches
The Aggregation Routers, Edge Routers and Core Routers are assumed to be installed in pairs for resilience.
What is NGN – fixed core network
The basic network structure for an NGN core model based on a simple ‘all IP’ approach, potentially augmented with some traditional
TDM networks.
24 © Copyright Incyte Consulting 2010 © Copyright Incyte Consulting 2012
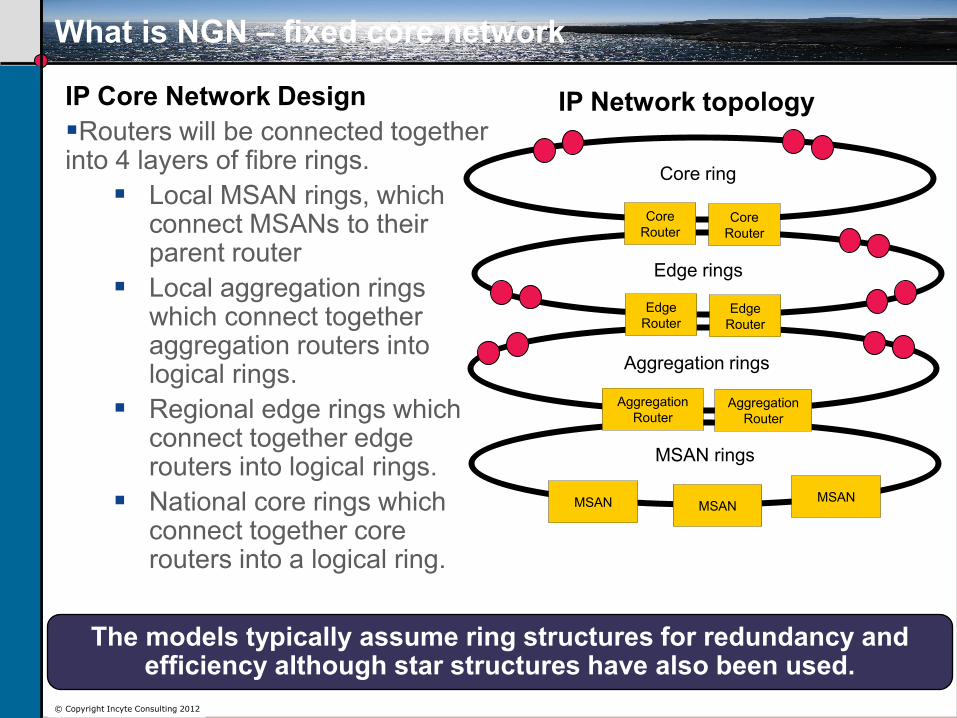
IP Core Network Design
Routers will be connected together into 4 layers of fibre rings.
Local MSAN rings, which connect MSANs to their parent router
Local aggregation rings which connect together aggregation routers into logical rings.
Regional edge rings which connect together edge routers into logical rings.
National core rings which connect together core routers into a logical ring.
Core
Router Core
Router
Edge
Router Edge
Router
Core ring
Edge rings
Aggregation rings
MSAN MSAN MSAN
Aggregation
Router Aggregation
Router
IP Network topology
MSAN rings
The models typically assume ring structures for redundancy and efficiency although star structures have also been used.
What is NGN – fixed core network
25 © Copyright Incyte Consulting 2010 © Copyright Incyte Consulting 2012
Core Network Dimensioning
Line cards and related parts of MSANs will be dimensioned based on the number of subscribers.
Network cards of MSANs, higher level routers and (if modelled) SDH transmission equipment will be dimensioned based on expected traffic in the busy hour:
Covers all services – on-net calls, outgoing calls, incoming calls, transit calls, internet access, IPTV, leased lines, data services
Busy hour traffic of all services will be covered to common units (like Mbyte or Mbps) and added together
Expected traffic in busy hour will be multiplied with routing factor
Result will be the busy hour traffic demand per network element
Softswitches will be dimensioned based on busy hour traffic of call services and number of subscribers of telephony services.
Cables, ducts, joints, manholes etc. will be dimensioned based on network topology (number and length of connections between nodes) as well as trenches, which will be split by area type (urban, suburban, rural) to allow for more detailed planning.
What is NGN – fixed core network
Generally speaking, a higher proportion of costs will not vary with traffic volumes in NGN versus PSTN>
26 © Copyright Incyte Consulting 2010 © Copyright Incyte Consulting 2012
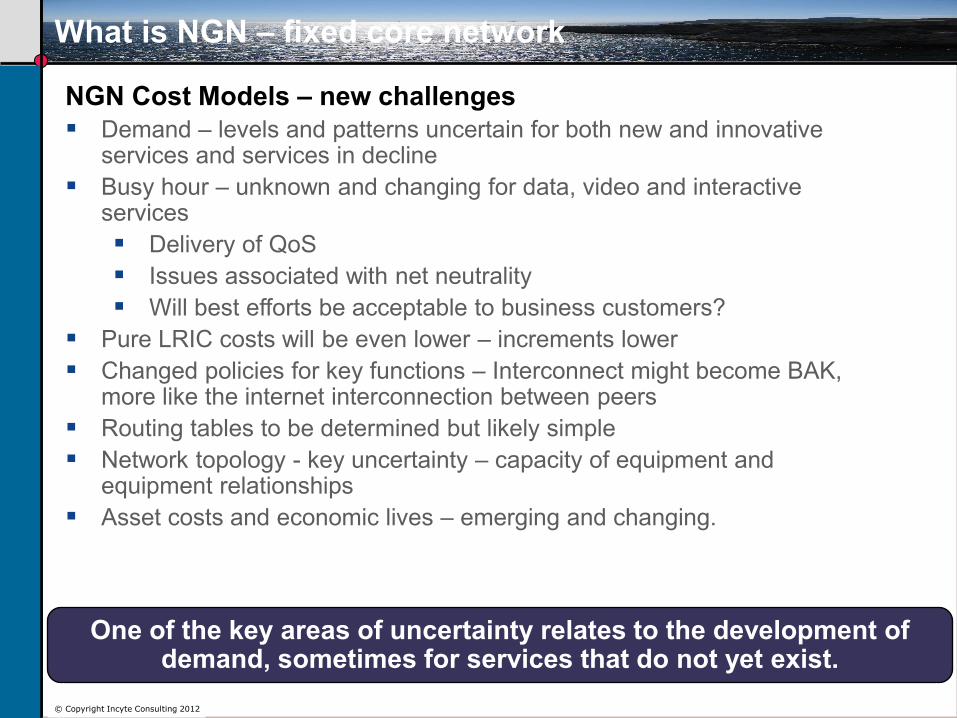
NGN Cost Models – new challenges
Demand – levels and patterns uncertain for both new and innovative services and services in decline
Busy hour – unknown and changing for data, video and interactive services
Delivery of QoS
Issues associated with net neutrality
Will best efforts be acceptable to business customers?
Pure LRIC costs will be even lower – increments lower
Changed policies for key functions – Interconnect might become BAK, more like the internet interconnection between peers
Routing tables to be determined but likely simple
Network topology - key uncertainty – capacity of equipment and equipment relationships
Asset costs and economic lives – emerging and changing.
What is NGN – fixed core network
One of the key areas of uncertainty relates to the development of demand, sometimes for services that do not yet exist.
27 © Copyright Incyte Consulting 2010 © Copyright Incyte Consulting 2012
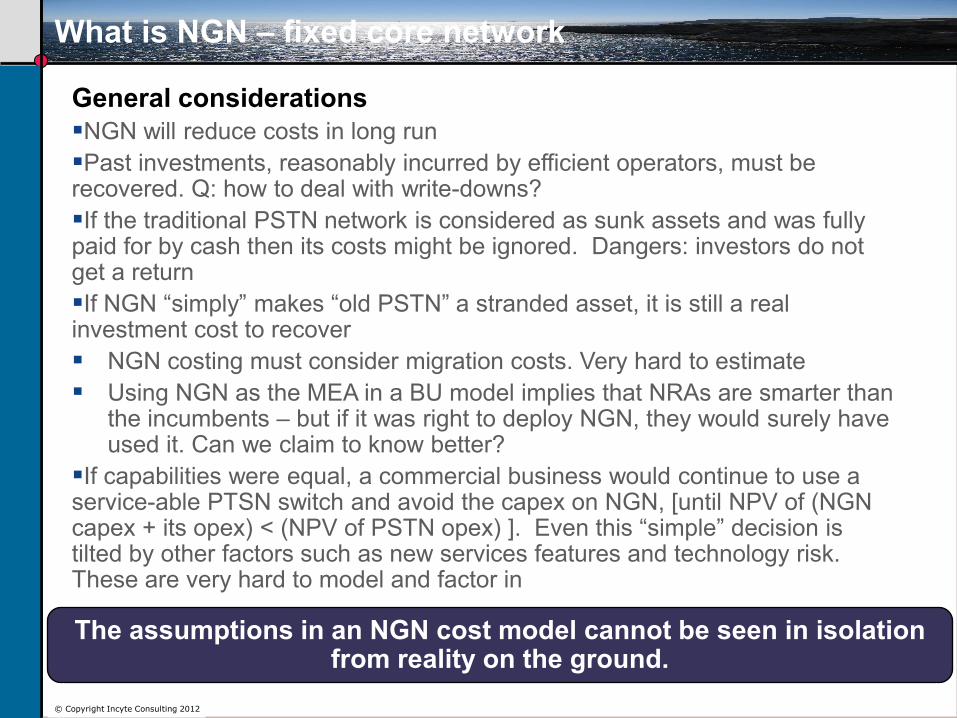
General considerations
NGN will reduce costs in long run
Past investments, reasonably incurred by efficient operators, must be recovered. Q: how to deal with write-downs?
If the traditional PSTN network is considered as sunk assets and was fully paid for by cash then its costs might be ignored. Dangers: investors do not get a return
If NGN “simply” makes “old PSTN” a stranded asset, it is still a real investment cost to recover
NGN costing must consider migration costs. Very hard to estimate
Using NGN as the MEA in a BU model implies that NRAs are smarter than the incumbents – but if it was right to deploy NGN, they would surely have used it. Can we claim to know better?
If capabilities were equal, a commercial business would continue to use a service-able PTSN switch and avoid the capex on NGN, [until NPV of (NGN capex + its opex) < (NPV of PSTN opex) ]. Even this “simple” decision is tilted by other factors such as new services features and technology risk. These are very hard to model and factor in
What is NGN – fixed core network
The assumptions in an NGN cost model cannot be seen in isolation from reality on the ground.
28 © Copyright Incyte Consulting 2010 © Copyright Incyte Consulting 2012
Key areas of discussion – NGN cost estimates
29 © Copyright Incyte Consulting 2010 © Copyright Incyte Consulting 2012
Key areas of discussion – Traffic volumes
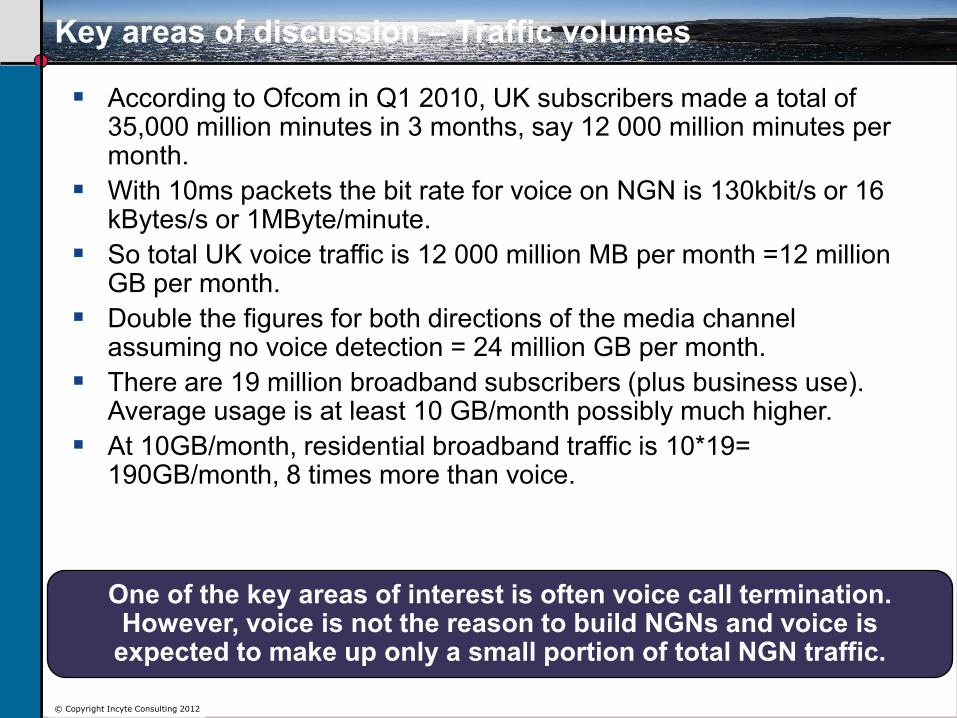
According to Ofcom in Q1 2010, UK subscribers made a total of 35,000 million minutes in 3 months, say 12 000 million minutes per month.
With 10ms packets the bit rate for voice on NGN is 130kbit/s or 16 kBytes/s or 1MByte/minute.
So total UK voice traffic is 12 000 million MB per month =12 million GB per month.
Double the figures for both directions of the media channel assuming no voice detection = 24 million GB per month.
There are 19 million broadband subscribers (plus business use). Average usage is at least 10 GB/month possibly much higher.
At 10GB/month, residential broadband traffic is 10*19= 190GB/month, 8 times more than voice.
One of the key areas of interest is often voice call termination. However, voice is not the reason to build NGNs and voice is
expected to make up only a small portion of total NGN traffic.
30 © Copyright Incyte Consulting 2010 © Copyright Incyte Consulting 2012
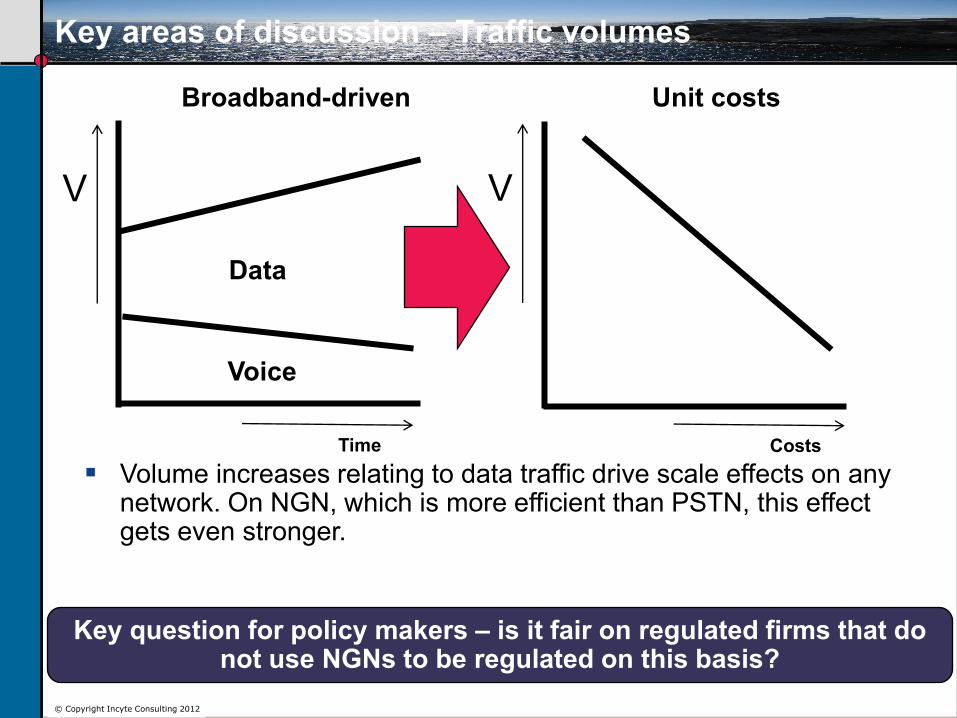
Key areas of discussion – Traffic volumes
Key question for policy makers – is it fair on regulated firms that do not use NGNs to be regulated on this basis?
Broadband-driven Unit costs
Costs Time
V V
Voice
Data
Volume increases relating to data traffic drive scale effects on any network. On NGN, which is more efficient than PSTN, this effect gets even stronger.
31 © Copyright Incyte Consulting 2010 © Copyright Incyte Consulting 2012
Treatment of legacy costs
MEA costs (which might be NGN) could be used. If the new MEA costs are simply imposed, past investments would not be recovered - setting an economic precedent.
NRAs might then be acting ultra vires and/or it could discourage future investment as regulatory risk of repeating this would remain
The use of MEAs and NGN costing must be used with great care. Devaluation in assets (CCA and other formulae to allow asset investment recovery) will increase calculated-costs - creating an short-term cost increase or “hump”
Key areas of discussion
If operators are not allowed to recover historic investments, incentives to invest in new infrastructure get reduced.
32 © Copyright Incyte Consulting 2010 © Copyright Incyte Consulting 2012
Key areas of discussion – Rate of return
One of the key areas of interest relates to the reasonable rate of return allowable on new investments in NGA and NGN infrastructure.
A key difference relates to the asymmetry of risk:
Access providers need to make upfront investments when demand for services (and sometimes even the definition of these services) is not yet clear.
Access seekers can wait for demand to materialise and then decide to obtain access services from the access provider.
Key question for policy makers – how to ensure that access providers are rewarded for this risk?
33 © Copyright Incyte Consulting 2010 © Copyright Incyte Consulting 2012
Key areas of discussion – Rate of return
NRAs should estimate investment risk inter alia by taking into account
the following factors of uncertainty:
Uncertainty relating to retail and wholesale demand;
Uncertainty relating to the costs of deployment, civil engineering works and managerial execution;
Uncertainty relating to technological progress;
Uncertainty relating to market dynamics and the evolving competitive situation, such as the degree of infrastructure-based and/or cable competition; and
Macro-economic uncertainty.
These factors may change over time, in particular due to the
progressive increase of retail and wholesale demand met. NRAs
should therefore review the situation at regular intervals and adjust
the risk premium over time.
34 © Copyright Incyte Consulting 2010 © Copyright Incyte Consulting 2012
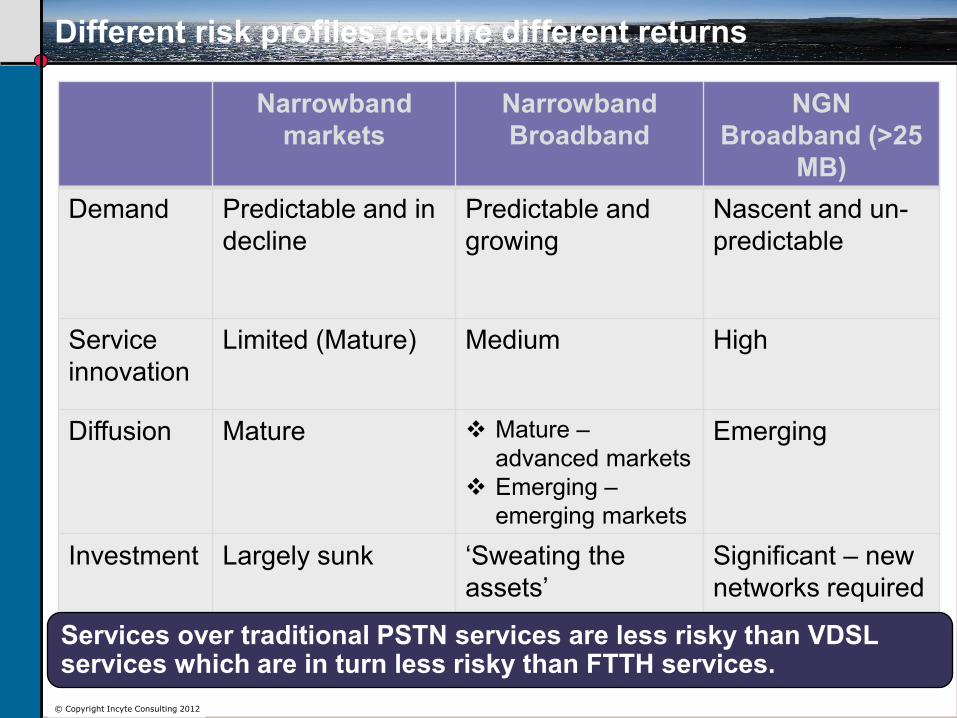
Different risk profiles require different returns
Narrowband
markets
Narrowband
Broadband
NGN
Broadband (>25
MB)
Demand Predictable and in
decline
Predictable and
growing
Nascent and un-
predictable
Service
innovation
Limited (Mature) Medium High
Diffusion Mature Mature –
advanced markets
Emerging –
emerging markets
Emerging
Investment Largely sunk ‘Sweating the
assets’
Significant – new
networks required
Services over traditional PSTN services are less risky than VDSL services which are in turn less risky than FTTH services.
35 © Copyright Incyte Consulting 2010 © Copyright Incyte Consulting 2012
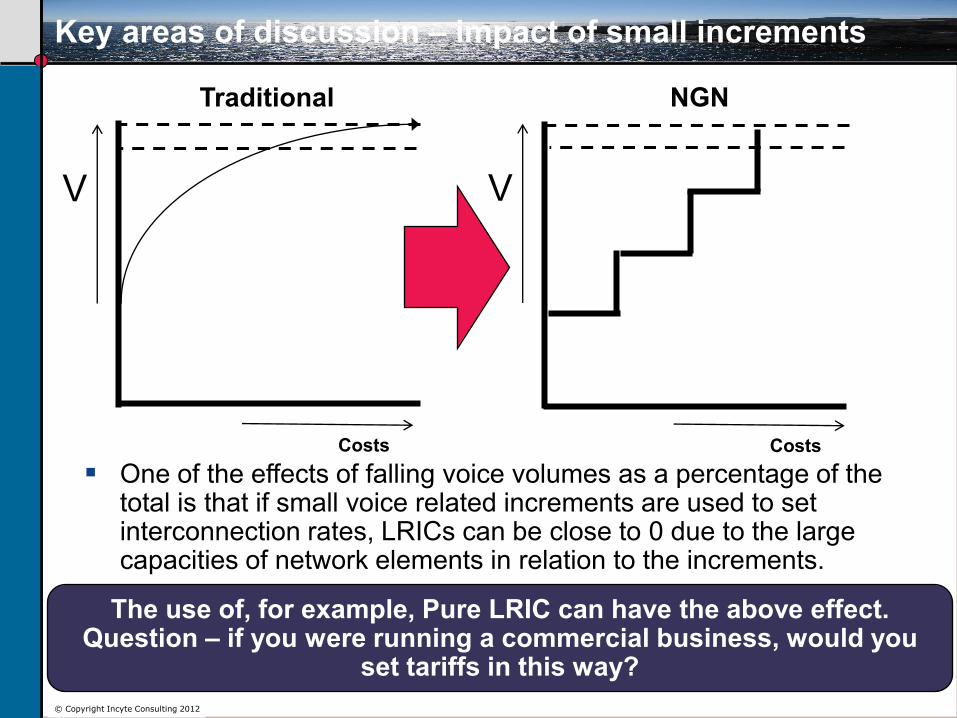
Traditional NGN
Costs Costs
V V
Key areas of discussion – impact of small increments
One of the effects of falling voice volumes as a percentage of the total is that if small voice related increments are used to set interconnection rates, LRICs can be close to 0 due to the large capacities of network elements in relation to the increments.
The use of, for example, Pure LRIC can have the above effect. Question – if you were running a commercial business, would you
set tariffs in this way?

36 © Copyright Incyte Consulting 2010 © Copyright Incyte Consulting 2012
Recommendations
37 © Copyright Incyte Consulting 2010 © Copyright Incyte Consulting 2012
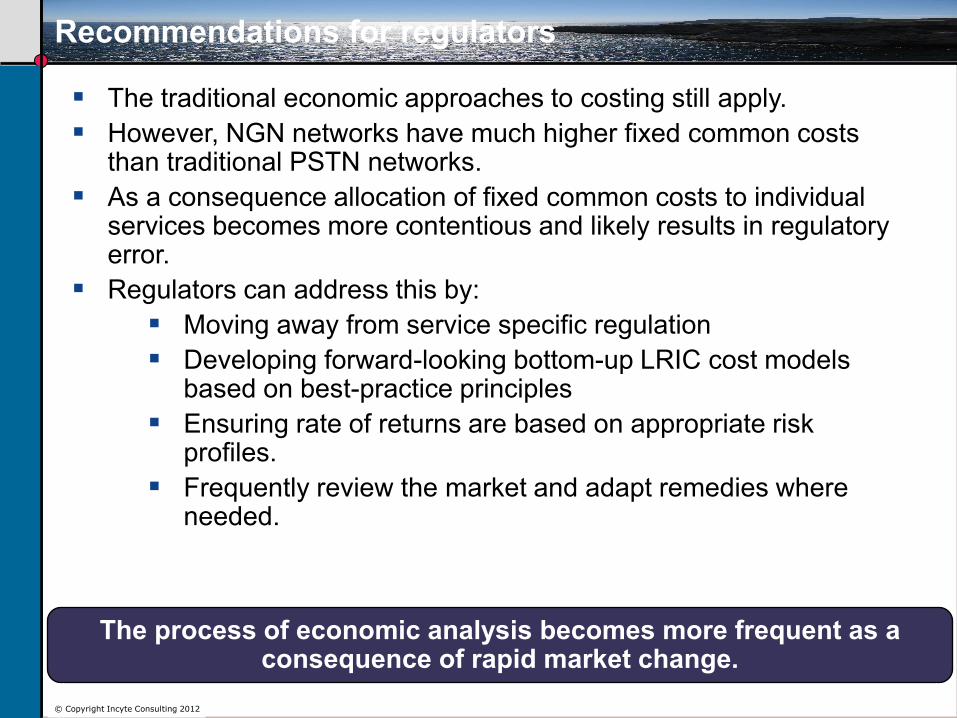
Recommendations for regulators
The traditional economic approaches to costing still apply.
However, NGN networks have much higher fixed common costs than traditional PSTN networks.
As a consequence allocation of fixed common costs to individual services becomes more contentious and likely results in regulatory error.
Regulators can address this by:
Moving away from service specific regulation
Developing forward-looking bottom-up LRIC cost models based on best-practice principles
Ensuring rate of returns are based on appropriate risk profiles.
Frequently review the market and adapt remedies where needed.
The process of economic analysis becomes more frequent as a consequence of rapid market change.

38 © Copyright Incyte Consulting 2010 © Copyright Incyte Consulting 2012
Any questions?

![REVISION D DESIGNED & DIMENSIONED ACP-22-XX-X …suddendocs.samtec.com/prints/acp-22-xx-x-xx.xx-x-xx-p-x-mkt.pdf · designed & dimensioned in millimeters[inches] this product manufactured](https://img.pdfslide.net/doc/110x75/5aa47cfd7f8b9a185d8c1528/revision-d-designed-dimensioned-acp-22-xx-x-dimensioned-in-millimetersinches.jpg)