Embed Size (px)
Citation preview
1
WSH Institute Report:
Economic Cost of Work-related Injuries and Ill-health in Singapore
Workplace Safety and Health Institute, Singapore
2
The study report here was undertaken by the following WSH Institute researchers.
LOKE Yoke Yun, BSc
TAN Wee Jin, BSocSci
Kathiresan MANICKAM, PhD
Peggy HENG, BSocSci
Caleb TJONG, BSc
LIM Guan Kheng, BEng
Samuel LIM, PhD
GAN Siok Lin, MBBS, MSc (Occ Med), FAMS (Occ Med)
Jukka TAKALA, DSc
Acknowledgements
We would like to thank Richard Webster, Shandre M. Thangavelu and Lun Kwok Chan
who provided guidance in developing the cost model. We would also like to thank
officers from Singapore’s Ministry of Health, Ministry of Social and Family Development
and Ministry of Manpower who contributed actively in the discussions during the data
collection process.
Publication Date: Oct 2013
3
Content
Executive Summary
4
1 INTRODUCTION
6
2 SINGAPORE MODEL
2.1 International Studies 2.2 Development of the Singapore Model 2.3 Approach for the Singapore Model 2.4 Considerations taken in Computation 2.4.1 Considerations for Calculation 2.4.2 Burden of Disease and Disorder Attributed to Work 2.5 The Analysis and Sources of Data 2.5.1 Cost to Employers 2.5.2 Cost to Workers 2.5.3 Cost to Community
8
3. ESTIMATED COST
3.1. Costs borne by Workers, Employers and the Community 3.2. GDP Equivalent 3.3. Enhancing Productivity with Higher Level of WSH Performance
16
4. CONCLUSIONS AND RECOMMENDATIONS
4.1. Conclusions and Recommendations 4.2. Future work
18
5. REFERENCES
19
6. APPENDICES
Appendix 1: Abbreviations Appendix 2: Comparison of Economic Models Appendix 3: Definitions and Values Appendix 4: Sensitivity Analysis
22
4
Executive Summary
Background
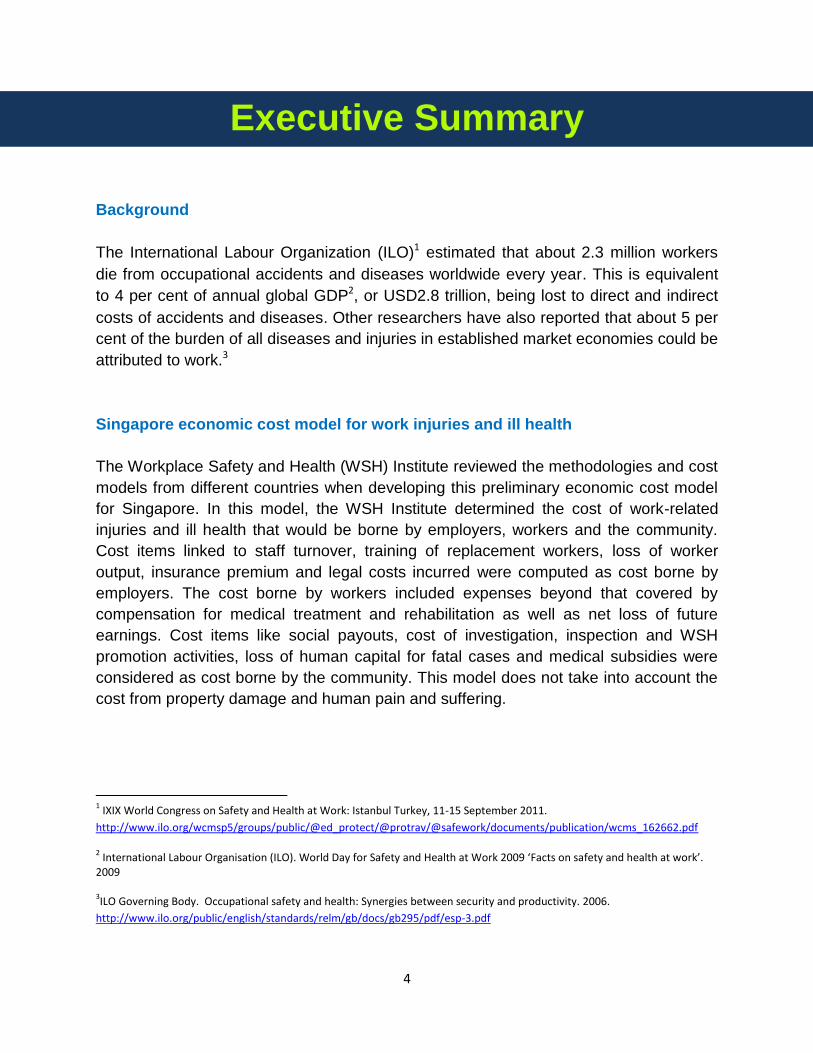
The International Labour Organization (ILO)1 estimated that about 2.3 million workers
die from occupational accidents and diseases worldwide every year. This is equivalent
to 4 per cent of annual global GDP2, or USD2.8 trillion, being lost to direct and indirect
costs of accidents and diseases. Other researchers have also reported that about 5 per
cent of the burden of all diseases and injuries in established market economies could be
attributed to work.3
Singapore economic cost model for work injuries and ill health
The Workplace Safety and Health (WSH) Institute reviewed the methodologies and cost
models from different countries when developing this preliminary economic cost model
for Singapore. In this model, the WSH Institute determined the cost of work-related
injuries and ill health that would be borne by employers, workers and the community.
Cost items linked to staff turnover, training of replacement workers, loss of worker
output, insurance premium and legal costs incurred were computed as cost borne by
employers. The cost borne by workers included expenses beyond that covered by
compensation for medical treatment and rehabilitation as well as net loss of future
earnings. Cost items like social payouts, cost of investigation, inspection and WSH
promotion activities, loss of human capital for fatal cases and medical subsidies were
considered as cost borne by the community. This model does not take into account the
cost from property damage and human pain and suffering.
1 IXIX World Congress on Safety and Health at Work: Istanbul Turkey, 11-15 September 2011.
http://www.ilo.org/wcmsp5/groups/public/@ed_protect/@protrav/@safework/documents/publication/wcms_162662.pdf
2 International Labour Organisation (ILO). World Day for Safety and Health at Work 2009 ‘Facts on safety and health at work’.
2009 3ILO Governing Body. Occupational safety and health: Synergies between security and productivity. 2006.
http://www.ilo.org/public/english/standards/relm/gb/docs/gb295/pdf/esp-3.pdf
5
Estimated SGD 10.45 billion (equivalent to 3.2% GDP) lost in 2011 to work injuries
and ill health
The total cost of work-related injuries and ill health to workers, their employers and the
community for Singapore is estimated to be SGD 10.45 billion, equivalent to 3.2% of the
nation’s GDP for 2011. The costs borne by different economic agents were estimated to
be: SGD 2.31 billion (22.1%) by employers; SGD 5.28 billion (50.5%) by workers, and
S$2.87 billion (27.4%) by the community.
Benefits from the study
This study provides deeper insights on the potential costs of work-related injuries and ill
health in Singapore. As this computation breaks the cost down into individual cost
items, it enables the relevant stakeholders to identify and prioritise potential levers to
reduce the cost of poor WSH practices in a more strategic and evidence-based
approach.
WSH Institute will continue to refine this WSH economic cost model for Singapore, so
that the individual cost items attributable to work-related injuries and ill health can be
more accurately computed.
6
1 Introduction
The extent of the costs of a work-related injury is often not fully understood. Take the
example of a worker suffering from partial incapacity as a result of a work-related injury.
At the age of 35 with a monthly salary of $2,500, this worker would have lost an
estimated $200,000 in future earnings if he is unable to return to work (lifetime cost).
For his company, the immediate loss of production output, rehiring costs, and retraining
costs is estimated to amount to $22,000. This illustrates the potential high cost of
injuries.
The International Labour Organisation (ILO)4 estimated that about 2.3 million workers
die from occupational accidents and diseases worldwide every year. ILO further
estimated that 4 per cent of annual global GDP5, or USD 2.8 trillion, is lost due to the
direct and indirect costs of such accidents and diseases (such as lost working time,
workers’ compensation, interruption of production, and medical expenses). It was
estimated that about 5 per cent of the burden of all diseases and injuries in established
market economies is attributable to work.6
Many studies relating to the economic cost of workplace injuries and diseases have
been conducted. Leigh7 estimated that the national cost of work-related injuries and
diseases in USA amounted to USD 250 billion (1.8% GDP). Safe Work Australia
estimated that the costs of work-related injuries and illnesses for Australia were AUD
57.5 billion (5.9% GDP)8 for 2005–06 and AUD 60.6 billion (4.8% GDP) for 2008–09.9
4 IXIX World Congress on Safety and Health at Work: Istanbul Turkey, 11-15 September 2011.
http://www.ilo.org/wcmsp5/groups/public/@ed_protect/@protrav/@safework/documents/publication/wcms_162662.pdf
5 International Labour Organisation (ILO). World Day for Safety and Health at Work 2009 ‘Facts on safety and health at work’. 2009
6ILO Governing Body. Occupational safety and health: Synergies between security and productivity. 2006.
http://www.ilo.org/public/english/standards/relm/gb/docs/gb295/pdf/esp-3.pdf
7 Leigh JP. Economic Burden of Occupational Injury and Illness in the United States. The Milbank Quarterly 2011;89(4):728–72.
8 Australian Safety and Compensation Council. The cost of work-related injury and illness for Australian employers, workers and
the community: 2005–06. (2009). Retrieved from the Safe Work Australia website:
http://safeworkaustralia.gov.au/AboutSafeWorkAustralia/WhatWeDo/Publications/Pages/SR200903InjuryAndIllness2005To20
06.aspx
9 Australian Safety and Compensation Council. The Costs of Work-related Injury and Illness for Australian Employers, Workers
and the community: 2008–09 (2012). Retrieved from the Safe Work Australia website:
http://www.safeworkaustralia.gov.au/AboutSafeWorkAustralia/WhatWeDo/Publications/Pages/cost-injury-illness-2008-
09.aspx
7
The costs of work injuries and illnesses may be broadly divided into direct and indirect
costs. Direct costs include workers' compensation payments, medical expenditures and
legal costs. Examples of indirect costs include training replacement employees, lost
productivity and costs associated with lower employee morale and absenteeism.
Many companies still approach safety expenditure as a necessary element of
compliance with government regulations and guidelines, rather than a contributory
factor to the economic viability of their organizations. They are hence reluctant to invest
in safety and health beyond the bare minimum as they feel it would erode their bottom-
line and reduce their competitiveness. A 2010 survey by the WSH Council10 found that
barely half (49%) of the companies in Singapore set aside an annual budget for safety
programmes. Further, only 30% of the managers surveyed believed that good safety
performance would improve business revenue/ net profits.
With the awareness of the economic impact of work injures and ill-health, all
stakeholders will be more motivated to improve WSH standards and benefit from the
enhanced productivity generated.
10
Based on the final report on the findings of the National Workplace Safety and Health Survey 2010.
8
2 Singapore Model
2.1 International Studies
In the USA, Leigh7 estimated that the national cost of occupational injuries and diseases
is USD 250 billion (1.8% GDP) in 2007. This model did not consider the subjective
component (e.g. emotional harm) and other intangible factors. The estimates were
conservative because only a single category in the model was used to represent all
direct costs of a fatal occupational injury. In the studies published by Safe Work
Australia, the estimated cost of work-related injury and illness was AUD 57.5 billion
(5.9% GDP) 8for the financial year 2005–06 and AUD 60.6 billion (4.8% GDP) for the
financial year 2008–09. The methodology used measured only the human cost and
similarly did not consider the subjective component to estimate the cost of work-related
injury and illness. It adopted an “ex-post” approach, measuring costs for a case after it
had occurred. Using an incidence approach also provided a proxy for on-going cost of
cases from previous reference years.9 A comparison of the different economic models
used by USA, UK, Australia and EU is given in Appendix 2.
The total cost of a workplace injury is often underestimated because some costs may
be indirect, are not immediately felt, or simply difficult to quantify, such as loss of
reputation. For example, apart from the direct costs of accidents such as worker
compensation, there are also indirect costs on the loss of skilled workers, delays in
production, accident investigation costs, associated legal costs, equipment damage/
replacement costs, costs to reschedule work, recruitment and the training of new staff,
loss of corporate image etc. A study by the Stanford University11 estimated that the
indirect costs due to such losses could be 4 times higher than the direct costs.
Similarly, work-related ill health also causes huge suffering and loss. However, they
remain largely invisible compared to work-related accidents, even though they are
estimated to kill six times as many people each year12. Occupational diseases can also
be economically very costly. The cost of work-related diseases in the EU is estimated to
be at least €145 billion per year13. In the US, insurance companies reportedly paid
11
Stanford University. (1982). Improving construction safety performance. Department of Civil Engineering Technical Report No.
260. http://constructionsafetyconsultant.com/articles/report_a_3.pdf 12
“The Prevention of Occupational Diseases.” International Labour Organization, 2013.
13
Ibid
9
US$21.6 billion for asbestos-exposure cases alone for the period 1990–2000, while
another USD 32 billion was paid out by prosecuted enterprises14.
Some have also argued that poor countries and poor companies cannot afford to invest
in safety initiatives. However, empirical evidence shows that this is not true. Based on a
study by the World Economic Forum15 and data from the International Labour
Organisation, the most competitive countries are also the safest ones. This
demonstrates that safety, competitiveness and long-term productivity are interlinked.
Investment in safety need not be at the expense of being competitive. From the study, it
can be deduced that no country has been able to achieve high competiveness with poor
WSH standards.
At the enterprise level, many companies have also reaped the business benefits of
better workplace safety and health. For instance, a pharmaceutical manufacturing
company in the UK invested in health promotion services (e.g. sports facilities, health
screening) and rehabilitation and treatment services (e.g. physiotherapy, counselling,
return to work programmes). They reportedly saved £200,000 a year in employee health
insurance, enjoyed 53% reduction in ergonomic-related cases and reduced their
number of work-related stress cases. Employees also noted significant improvements in
concentration and productivity at work, while absence rates dropped to become 31%
lower than the UK average16.
There are also many such examples in Singapore. One company in the construction
sector reported productivity gains from saving more than $80,000 and 2,000 man-hours
after it replaced traditional scaffold structure with a re-useable working platform built into
the metal column formwork. Workers no longer needed to erect and dismantle any
scaffold structure, achieving the twin purposes of saving cost and eliminating the risks
of working on scaffolds. The actual gains could be even higher if indirect costs were
also included17.
14
Ibid
15
World Economic Forum The Global Competitiveness Report 2012 – 2013 http://www3.weforum.org/docs/WEF_GlobalCompetitivenessReport_2012-13.pdf 16
http://www.hse.gov.uk/business/casestudy/astrazeneca.htm
17
Source: WSH-related best practices on WSH Council website.
https://www.wshc.sg/wps/portal/resources?action=detailedInfoStop&fInfoStopID=487
10
2.2 Development of the Singapore Model
An extensive background research comparing the methodologies and economic models
from different countries was carried out. WSH Institute also consulted with Safe Work
Australia18, which had earlier published the study ‘The Cost of work related injury and
illness for Australian employers, workers and the community: 2008-09’ and discussed
its relevance to the Singapore context.
To ensure that the economic model is robust and relevant factors were taken into
consideration, WSH Institute had set up 2 working groups: an international advisory
group and an internal working group. The international advisory group comprises of
international advisors from Australia and Finland who have experience in developing
economic models in their countries and thus contributed their knowledge to the
economic model for Singapore. The internal working group comprised of experts who
have knowledge of WSH-related statistics and were aware of the WSH climate in
Singapore. These members have knowledge of the trending of workplace incidents and
accidents in different workplace sectors including marine, construction, logistics and
transport and manufacturing. WSH Institute also consulted with various departments
from the Ministry of Manpower (MOM)19 as well as other government agencies including
MAS, MOH, MSF, HPB, DOS and IRAS for their inputs to the Singapore model.
Taking into consideration the methodologies and economic cost models from different
countries and in consultation with the international advisory group, the internal working
group as well as representatives from government agencies, the WSH Institute
developed a preliminary economic model to estimate the economic cost of work injures
and ill health for Singapore.
2.3 Approach for the Singapore Model
The Access Economics20 review of the relevant literature identified two key approaches
for measuring annual work injuries and ill health: the incidence approach and the
prevalence approach. The incidence approach measures only new cases occurring
18
Mr. Richard Webster, Assistant Director of Data and Analysis for Safe Work Australia, was in Singapore in Jan 2013. During his
time here, he was engaged in discussions with key stakeholders and subject experts in Singapore on his study.
19
Departments that were consulted include the Manpower Planning and Policy Division, Workplace Policy and Strategy Division
and Occupational Safety and Health Division of MOM. 20
Access Economics (2004) Costs of Workplace Injury and Illness to the Australian Economy: Reviewing the Estimation
Methodology and Estimates of the level and distribution of costs, Reports for the National Occupational Health and Safety
Commission, March 2004.
11
during the reference year, whereas the prevalence approach measures all new and
existing cases at a given point in time in the reference year. The incidence approach
measures the costs associated with workers injured or who had suffered ill health as a
proxy for on-going cost of cases from previous reference years.
The WSH Institute reviewed the methodologies and cost models from different countries
when developing a working model for Singapore. The study methodology was adapted
from similar studies done by other countries. Similar to Australia, our model measures
only human cost and does not take into account the cost of property damage, and
human pain and suffering. The analysis is based on cost incurred after an incident had
occurred. The expected future cost of new cases in the reference year is used as a
proxy for on-going cost of cases from previous years.
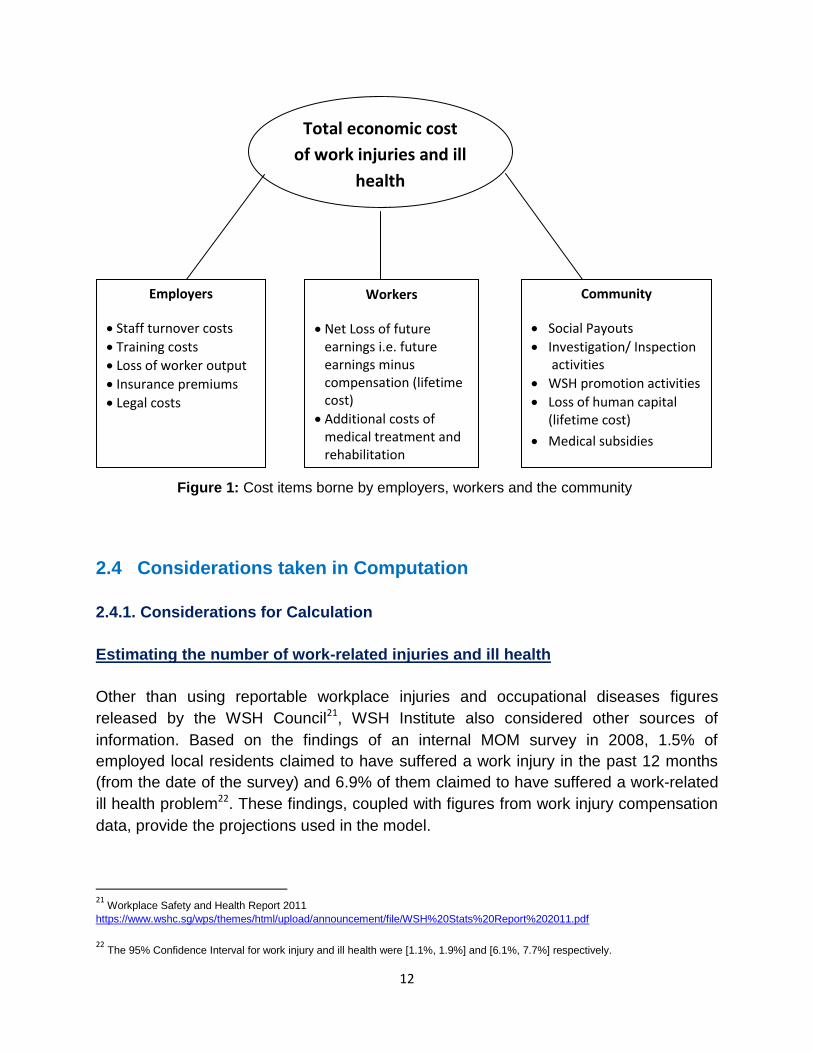
In this model, the Institute determined the cost of work-related injuries and ill health that
would be borne by employers, workers and the community (Figure 1). Cost items linked
to staff turnover, training of replacement workers, loss of worker output, insurance
premium and legal cost incurred were computed as costs borne by employers. The
costs borne by workers included loss of future earnings, additional expenses for medical
treatment and rehabilitation, beyond that covered by compensation under the Work
Injury Compensation Act. Cost items like social payouts, cost of incident investigation,
workplace inspection and promotion activities by MOM and WSH Council, loss of
human capital for fatal cases, and medical subsidies were considered as costs borne by
community. All the cost items considered are mutually exclusive to ensure that there will
be no multiple counting.
12
2.4 Considerations taken in Computation
2.4.1. Considerations for Calculation
Estimating the number of work-related injuries and ill health
Other than using reportable workplace injuries and occupational diseases figures
released by the WSH Council21, WSH Institute also considered other sources of
information. Based on the findings of an internal MOM survey in 2008, 1.5% of
employed local residents claimed to have suffered a work injury in the past 12 months
(from the date of the survey) and 6.9% of them claimed to have suffered a work-related
ill health problem22. These findings, coupled with figures from work injury compensation
data, provide the projections used in the model.
21
Workplace Safety and Health Report 2011
https://www.wshc.sg/wps/themes/html/upload/announcement/file/WSH%20Stats%20Report%202011.pdf
22
The 95% Confidence Interval for work injury and ill health were [1.1%, 1.9%] and [6.1%, 7.7%] respectively.
Figure 1: Cost items borne by employers, workers and the community
Total economic cost
of work injuries and ill
health
Employers
Staff turnover costs
Training costs
Loss of worker output
Insurance premiums
Legal costs
Workers
Net Loss of future earnings i.e. future earnings minus compensation (lifetime cost)
Additional costs of medical treatment and rehabilitation
Community
Social Payouts
Investigation/ Inspection activities
WSH promotion activities
Loss of human capital (lifetime cost)
Medical subsidies
13
Estimating the loss of future earnings
For estimating the loss of future earnings, injured workers were grouped into 3
categories: (i) Workers with permanent incapacity, (ii) Workers with partial incapacity
and (iii) Workers with work-related injuries or ill health that resulted in death.
Appropriate weights were attributed to each category, corresponding to the likeliness of
returning to work, as well as adjusting for reduced work capacity.
2.4.2 Burden of Disease and Disorder Attributed to Work Attributable fractions (AF) are the proportion of cases that would not have occurred in
the absence of work exposure. AFs were used to determine the burden of disease.
Studies adapted by ILO for global estimates state that the total AF23 for work-related
causes was 6.7% (2005). The AF method is widely used to assess work-relatedness of
a wide range of diseases and disorders.
A study used by the World Health Organization (WHO) and health professionals, as
reported in the Global Burden of Disease and Injury by Murray and Lopez (WHO/World
Bank)24, estimated that 5% of the global burden is related to work in ‘Established Market
Economies’ group of countries as classified by World Bank. While these two estimates
are not the same as economic burden, they correlate closely with the costs of work-
related problems. This work-related burden appears to increase gradually by economic
progress and national development while the traditional causes of sickness and
mortality, such as communicable diseases, are decreasing. Many highly populated
developing countries where the communicable diseases and other traditional problems
are still important have somewhat lower level of burden attributed to work. This
corroborated well with the ILO estimate for costs of occupational injuries and illnesses –
4% of annual global GDP.
The circumstances in Singapore are similar to those of other highly developed
countries. As a result of having overcome most communicable diseases as a cause of
death, the relative importance of non-communicable diseases and disorders is
constantly increasing. Some diseases that have a clear linkage to work are: work-
related cancers, circulatory diseases, chronic respiratory diseases, musculoskeletal
disorders and psychosocial factors at work, among others. For this study, the number of
23
Attributable fractions are fractions of a disease or injury which would not have occurred had the factor been non-existent in the
population in question, They are calculated based on data about existing exposures to known factors of work-related diseases and their proven impact on exposure - outcome relationship and morbidity to these diseases.
24
Elgstrand K. and Petersson N.F. OSH for Development. Royal Institute of Technology, Sweden. 2010.
14
workers who suffered from work-related ill health resulting in death is estimated using
the AF methodology.
2.5 The Analysis and sources of data
Multiple sources of data were used in this analysis, as shown in Table A2 in Appendix 3.
2.5.1 Cost to Employers
For the cost borne by employers, cost items included staff turnover cost, training costs,
loss of worker output, insurance premiums and legal costs.
Staff turnover cost included the administration cost of advertising, interviewing and
hiring of a new worker to replace an injured or diseased worker.
Training costs were estimated based on the net amount incurred after deducting cost
recovered from the Skills Development Fund (SDF)25. It included course fees, other
monetary allowances given to trainees and cost of training materials incurred in
providing structured On-The-Job-Training (OJT).26 The training cost for resident and
foreign workers was assumed to be the same.
For the loss of worker output, it refers to the loss of productivity which the employer has
to bear due to the injured or diseased worker being unable to work. Insurance
premiums, another factor used in the computation, were included to account for
payment expended for injured or diseased workers. Lastly, the computation of legal
costs were based on the WSH Act Contraventions of the 43 companies or employers
who were either fined or imprisoned in 2011.27
2.5.2 Cost to Workers
25
As required by law under the Skills Development Levy (SDL) Act in Singapore, all employers are required to pay a monthly SDL
for each of their employees working in Singapore. SDL is then channelled to the Skills Development Fund, where employers can enjoy grants to support staff training.
26
'Labour Cost and Medical Benefits 2009'. This survey is conducted by conducted by Manpower Research and Statistics
Department (MRSD), Ministry of Manpower (MOM). 27
List of Offenders Convicted under Workplace Safety and Health Act, 2011
15
The cost borne by workers includes net loss of future earnings and additional costs of
medical treatment and rehabilitation.
Net loss of future earnings measures the difference between the expected future
earnings had the incident not occur and the worker’s expected future earnings following
a work-related injury or disease. This difference is then discounted using present value
calculations to reflect the monetary value of the earnings loss to the current reference
year.28
Additional medical costs incurred relate to specialized medical treatment required due to
a work-related injury or ill health. This was estimated based on the average hospital
inpatient bill size for both medical and surgical specialties.29 For the resident workers,
the average medical cost of subsidized class wards of B2 and C were considered. For
non-resident workers, the average cost of class ward A and B1 was considered as
these classes of wards are not subsidized. For the cost item on rehabilitation, the Tan
Tock Seng Hospital (TTSH) rehabilitation study was used as a proxy to estimate the
rehabilitation cost for injured workers. This study was conducted to approximate the
costs and benefits of injured workers who receive standard care and case-manager
based care from a societal perspective.30
2.5.3 Cost to Community
Lastly, social payouts, investigation, inspection and WSH promotion activities as well as
the loss of human capital (lifetime cost) and medical subsidies formed the basis of the
cost accrued to the community.
The amount of disbursements of long term assistance administered by Ministry of Social
and Family Development (MSF) was used as a proxy for the social payout for the
workers who sustained occupational injuries or illness. The cost item on investigation,
inspection and WSH promotion activities was the cost incurred by MOM and WSHC as
these are preventive measures to reduce work related accidents and illnesses. For the
loss of human capital cost item for fatal cases – this was based on the 6000 man-days
loss per fatality. Medical subsidy is taken as the difference between unsubsidised and
subsided wards.
28
The analysis of the net loss of future earnings takes into account factors such as inflation, savings rate, labour productivity rate
and compensation received. 29
‘Average hospital inpatient bill size’ indicates the cost of medical and surgical specialities for the respective hospital class wards.
http://www.moh.gov.sg/content/moh_web/home/statistics/healthcare_institutionstatistics/average_hospitalinpatientbillsizetables.html 30
This is a research project initiated by Occupational Safety and Health Division (OSHD), Ministry of Manpower (MOM), to evaluate
the practicality, effectiveness and cost-benefits of a case-manager based system. This report has not been released for publication.
16
3 Estimated Cost
3.1 Costs borne by Workers, Employers and the Community
Following the methodology discussed in Chapter 2, this section summarizes the
estimated economic cost of work-related injuries and ill health in Singapore.
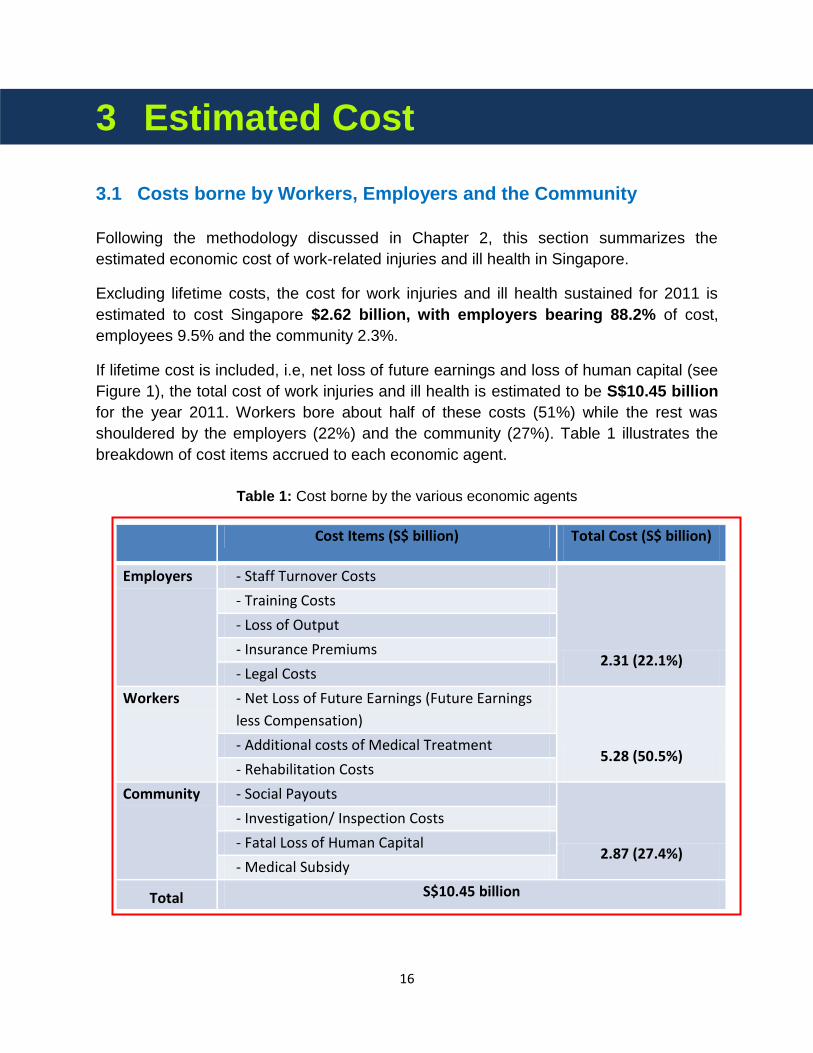
Excluding lifetime costs, the cost for work injuries and ill health sustained for 2011 is
estimated to cost Singapore $2.62 billion, with employers bearing 88.2% of cost,
employees 9.5% and the community 2.3%.
If lifetime cost is included, i.e, net loss of future earnings and loss of human capital (see
Figure 1), the total cost of work injuries and ill health is estimated to be S$10.45 billion
for the year 2011. Workers bore about half of these costs (51%) while the rest was
shouldered by the employers (22%) and the community (27%). Table 1 illustrates the
breakdown of cost items accrued to each economic agent.
Cost Items (S$ billion) Total Cost (S$ billion)
Employers - Staff Turnover Costs
2.31 (22.1%)
- Training Costs
- Loss of Output
- Insurance Premiums
- Legal Costs
Workers - Net Loss of Future Earnings (Future Earnings
less Compensation)
5.28 (50.5%) - Additional costs of Medical Treatment
- Rehabilitation Costs
Community - Social Payouts
2.87 (27.4%)
- Investigation/ Inspection Costs
- Fatal Loss of Human Capital
- Medical Subsidy
Total S$10.45 billion
Table 1: Cost borne by the various economic agents
17
Workers who suffer from partial incapacity may return to work in a reduced capacity,
lower paying jobs, possible impediments in career advancement. For those with total
incapacity, there would be no return to work at all, implying a total loss of possible future
earnings from the date of incapacity. Taken as a whole, these losses and the cost of
additional medical and rehabilitation treatment amounted to S$5.28 billion – greater
than the combined cost borne by both employers and community.
3.2 GDP-equivalent of the Costs
The estimated cost of S$10.45 billion from this study is equivalent to 3.2% of the
Singapore GDP in 2011. This is comparable to similar studies done by other countries,
e.g. Australia (4.8%) and the ILO (4.0%).
3.3 Enhancing Productivity with Higher Level of WSH Performance
While it should be noted that the costs do not represent the proportion of GDP lost as a
result of work-related injuries and ill health, it does indicate foregone economic
activity. This inevitably hampers the country’s productivity push.
With Singapore’s growth being dependent on the country’s ability to maximise labour,
capital, work practices and innovation to achieve greater output, a workforce suffering
from a high incidence of ill health and workplace injuries would mean that it would take
a significantly greater effort to increase productivity. At the same time, productivity gains
and economic growth will be eroded by the costs sustained by the various economic
agents from work-related injuries and ill health.
18
4 Conclusion & Recommendations
4.1 Conclusion and recommendations
The total economic cost was estimated to be S$10.45 billion which is equivalent to
3.2% GDP for 2011. The costs borne by different economic agents were: S$2.31 billion
(22.1%) by employers; S$5.28 billion (50.5%) by workers, and S$2.87 billion (27.4%) by
the community. The bulk of the cost was borne by the workers.
The results provide deeper insights into the potential costs of work-related injuries and
ill health in Singapore. As this computation breaks the cost down into individual cost
items (see Figure 1), it provides the evidence for the relevant stakeholders to identify
and prioritise potential levers to reduce the cost of poor WSH practices.
To further improve the economic viability and productivity of Singapore, there should be
a concerted action by all stakeholders to reduce the total cost by reducing the number
of work-related injuries and ill health in Singapore..
4.2 Future work
As this is the first economic model for Singapore, there will be refinements to the
subsequent models so that the individual cost items and the overall GDP equivalent
attributable to work-related injuries and ill health can be more accurately computed.
19
5 References
1. Access Economics (2004). Costs of Workplace Injury and Illness to the Australian Economy: Reviewing the Estimation Methodology and Estimates of the level and distribution of costs. Reports for the National Occupational Health and Safety Commission, March 2004.
2. Australian Safety and Compensation Council (2012). The Costs of Work-related Injury and Illness for Australian Employers, Workers and the community: 2008–09. Retrieved from Safe Work Australia website: http://www.safeworkaustralia.gov.au/AboutSafeWorkAustralia/WhatWeDo/Publications/Documents/660/Cost%20of%20Work-related%20injury%20and%20disease.pdf
3. Australian Safety and Compensation Council (2009). The cost of work-related
injury and illness for Australian employers, workers and the community: 2005–06. Retrieved from Safe Work Australia website: http://safeworkaustralia.gov.au/AboutSafeWorkAustralia/WhatWeDo/Publications/Pages/SR200903InjuryAndIllness2005To2006.aspx
4. Elgstrand K. and Petersson N.F. (2012). OSH for Development. Royal Institute
of Technology. 2012. 5. Gervais RL, Pawlowska Z, Bojanowski R, Kouvonen A, Karanika-Murray M,
Broek, KV, Greef MD (2009). Economic performance in small and medium-sized enterprises: a review. EU-OSHA. 2009.
6. Hamalainen P, Saarela KL, Takala J (2009). Global trend according to
estimated number of occupational accidents and fatal work-related diseases at
region and country level. Journal of Safety Research 40 (2009), 125-139,
Elsevier/NSC USA.
Retrieved from OSHA website:
https://osha.europa.eu/en/press/articles/global-trend-according-to-estimated-
number-of-occupational-accidents-and-fatal-work-related-diseases-at-region-
and-country-level
7. IXIX World Congress on Safety and Health at Work: Istanbul Turkey (2011). ILO Introductory Report: Global Trends and Challenges on Occupational Safety and Health. Retrieved from ILO website:
20
http://www.ilo.org/wcmsp5/groups/public/@ed_protect/@protrav/@safework/documents/publication/wcms_162662.pdf
8. ILO Governing Body (2006). Occupational safety and health: Synergies between security and productivity. Retrieved from ILO website: http://www.ilo.org/public/english/standards/relm/gb/docs/gb295/pdf/esp-3.pdf
9. International Labour Organization (ILO) (2009). World Day for Safety and Health at Work 2009 ‘Facts on safety and health at work’. Retrieved from ILO website: http://www.ilo.org/wcmsp5/groups/public/dgreports/dcomm/documents/ publication/wcms_105146.pdf
10. International Labour Organization (2011). ILO Introductory Report: Global
Trends and Challenges on Occupational Safety and Health.
Retrieved from ILO website:
http://www.ilo.org/wcmsp5/groups/public/@ed_protect/@protrav/@safework/doc
uments/publication/wcms_162662.pdf
11. International Labour Organization (2013). “The Prevention of Occupational Diseases.”
12. Health and Safety Executive (HSE). AstraZeneca Case Study. Retrieved from HSE website: http://www.hse.gov.uk/business/casestudy/astrazeneca.htm
13. Health and Safety Executive (HSE) Costs to Britain of workplace injuries and work-related ill health: 2009/10 update. Retrieved from HSE website: http://www.hse.gov.uk/statistics/pdf/cost-to-britain.pdf
14. Leigh JP (2011). Economic Burden of Occupational Injury and Illness in the
United States. Retrieved from The Milbank Quarterly 2011; 89(4):728–72. 15. MOM, Report on Labour Force in Singapore (2011).
Retrieved from MOM website: http://www.mom.gov.sg/Documents/statistics-publications/manpower-supply/ report-labour-2011/mrsd_2011LabourForce.pdf
16. MOM Foreign Workforce Numbers.
Retrieved from MOM website: http://www.mom.gov.sg/statistics-publications/others/statistics/Pages/ ForeignWorkforceNumbers.aspx
21
17. MOM 'Labour Cost and Medical Benefits 2009'. This survey was conducted by conducted by Manpower Research and Statistics Department (MRSD), Ministry of Manpower (MOM).
18. MOM, List of Offenders Convicted under Workplace Safety and Health Act,
2011. Retrieved from MOM website: http://www.mom.gov.sg/Documents/safety-health/reports-stats/ List%20of%20Offenders%20Convicted%20under%20WSHA%20-%202011.pdf
19. MOH ‘Average hospital inpatient bill size’ indicates the cost of medical and surgical specialities for the respective hospital class wards. Retrieved from MOH website: http://www.moh.gov.sg/content/moh_web/home/statistics/healthcare_institutionstatistics/average_hospitalinpatientbillsizetables.html.
20. National Workplace Safety and Health Survey 2010.
21. Pezzulo L. and Crook A. (2006). The economic and social costs of occupational disease and injury in New Zealand. Retrieved from NOHSAC Technical Report 4. 2006.
22. Stanford University. (1982). Improving construction safety performance.
Department of Civil Engineering Technical Report No. 260. Retrieved from Safety construction website: http://constructionsafetyconsultant.com/articles/report_a_3.pdf
22
6 Appendices
Appendix 1: Abbreviations
Appendix 2: Comparison of Economic Models
Appendix 3: Definition and Values
Appendix 4: Sensitivity Analysis
23
Appendix 1: Abbreviations
List of Abbreviations used in this Report
1. AF: Attributable Fractions
2. AUD: Australian Dollar
3. EU: European Union
4. DOS: Department of Statistics, Singapore
5. FDW: Foreign Domestic Workers
6. GDP: Gross Domestic Product
7. HPB: Health and Promotion Board, Singapore
8. HSE: Health and Safety Executive, UK
9. ILO: International Labour Organization
10. IRAS: Inland Revenue Authority of Singapore
11. MAS: Monetary Authority of Singapore
12. MOH: Ministry of Health, Singapore
13. MRSD: Manpower Research and Statistic Department, MOM
14. MSF: Ministry of Social and Family Development, Singapore
15. MOM: Ministry of Manpower, Singapore
16. OJT: On-the-Job Training
17. OSHA: Occupational Safety and Health Administration, USA
18. SDF: Skills Development Fund
19. SGD: Singapore Dollar
24
20. UK: United Kingdom
21. USA: United States of America
22. USD: United States Dollar
23. WHO: World Health Organization
24. WPR: Western Pacific Region
25. WSH: Workplace Safety and Health
25
Appendix 2: Comparison of Economic Models
Comparison of Economic Models from USA, UK, European Union, and
Australia
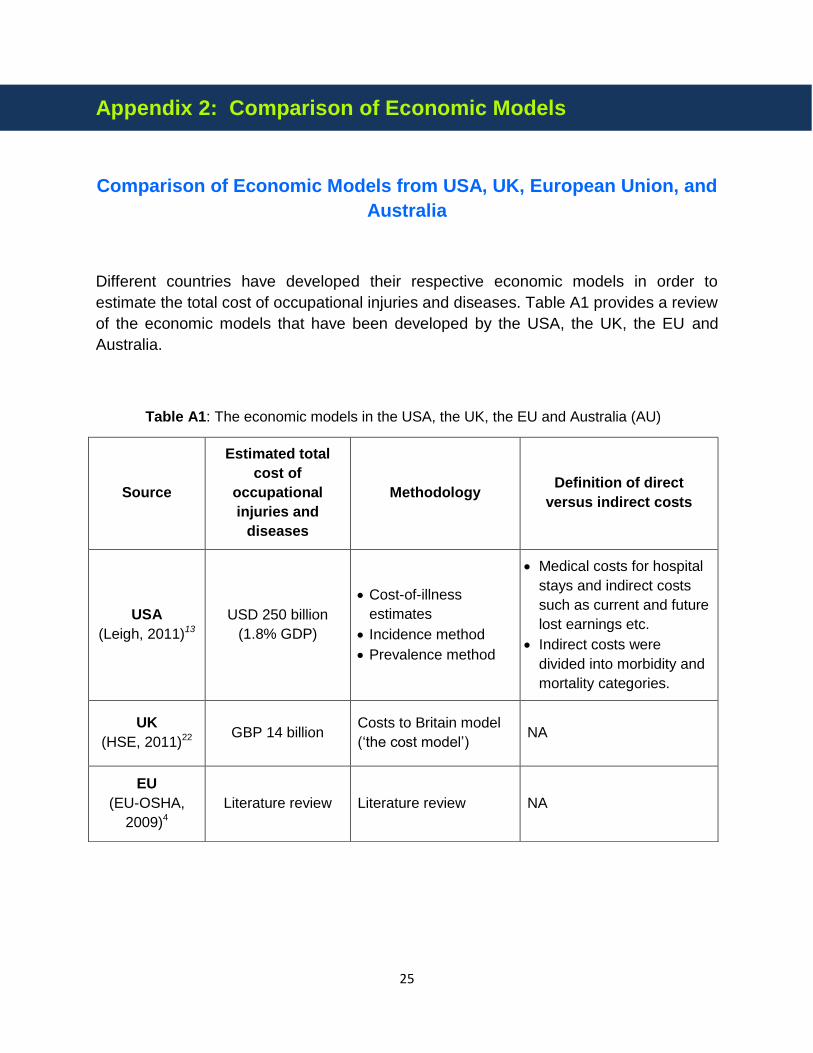
Different countries have developed their respective economic models in order to
estimate the total cost of occupational injuries and diseases. Table A1 provides a review
of the economic models that have been developed by the USA, the UK, the EU and
Australia.
Table A1: The economic models in the USA, the UK, the EU and Australia (AU)
Source
Estimated total
cost of
occupational
injuries and
diseases
Methodology Definition of direct
versus indirect costs
USA
(Leigh, 2011)13
USD 250 billion
(1.8% GDP)
Cost-of-illness
estimates
Incidence method
Prevalence method
Medical costs for hospital
stays and indirect costs
such as current and future
lost earnings etc.
Indirect costs were
divided into morbidity and
mortality categories.
UK
(HSE, 2011)22 GBP 14 billion
Costs to Britain model
(‘the cost model’) NA
EU
(EU-OSHA,
2009)4
Literature review Literature review NA
26
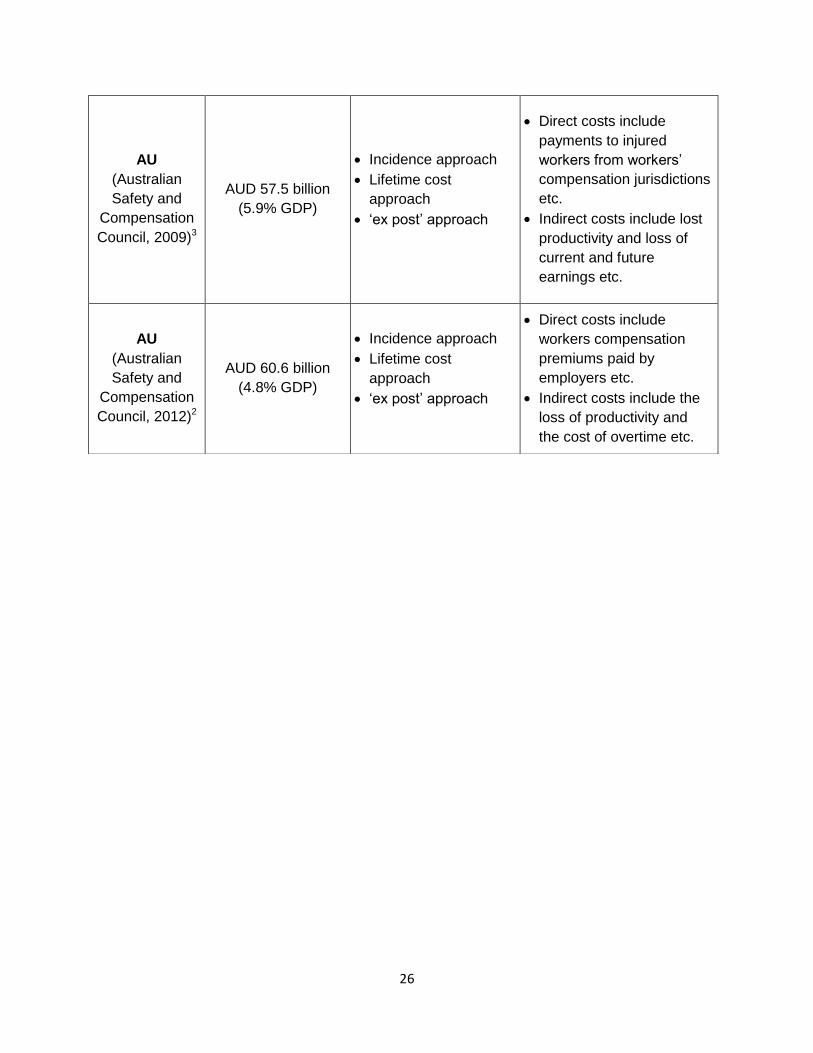
AU
(Australian
Safety and
Compensation
Council, 2009)3
AUD 57.5 billion
(5.9% GDP)
Incidence approach
Lifetime cost
approach
‘ex post’ approach
Direct costs include
payments to injured
workers from workers’
compensation jurisdictions
etc.
Indirect costs include lost
productivity and loss of
current and future
earnings etc.
AU
(Australian
Safety and
Compensation
Council, 2012)2
AUD 60.6 billion
(4.8% GDP)
Incidence approach
Lifetime cost
approach
‘ex post’ approach
Direct costs include
workers compensation
premiums paid by
employers etc.
Indirect costs include the
loss of productivity and
the cost of overtime etc.
27
Appendix 3: Definitions and Values
Definition and Values of Cost Items
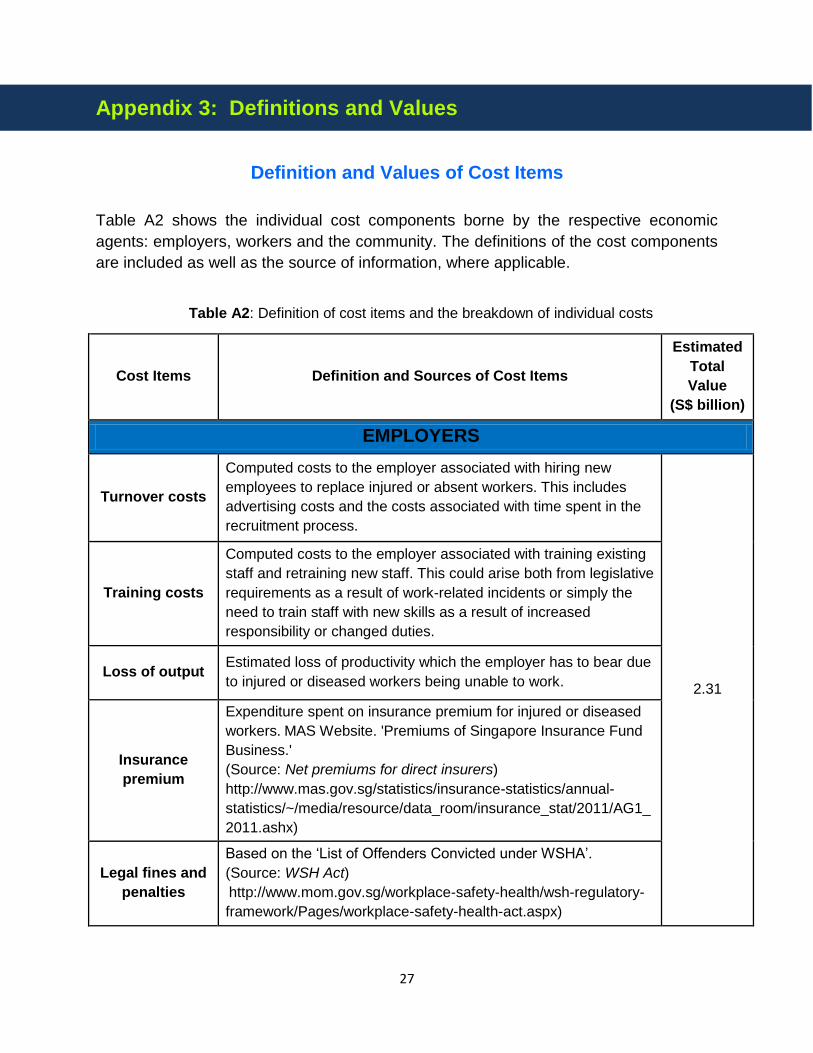
Table A2 shows the individual cost components borne by the respective economic
agents: employers, workers and the community. The definitions of the cost components
are included as well as the source of information, where applicable.
Table A2: Definition of cost items and the breakdown of individual costs
Cost Items Definition and Sources of Cost Items
Estimated
Total
Value
(S$ billion)
EMPLOYERS
Turnover costs
Computed costs to the employer associated with hiring new
employees to replace injured or absent workers. This includes
advertising costs and the costs associated with time spent in the
recruitment process.
2.31
Training costs
Computed costs to the employer associated with training existing
staff and retraining new staff. This could arise both from legislative
requirements as a result of work-related incidents or simply the
need to train staff with new skills as a result of increased
responsibility or changed duties.
Loss of output Estimated loss of productivity which the employer has to bear due
to injured or diseased workers being unable to work.
Insurance
premium
Expenditure spent on insurance premium for injured or diseased
workers. MAS Website. 'Premiums of Singapore Insurance Fund
Business.'
(Source: Net premiums for direct insurers)
http://www.mas.gov.sg/statistics/insurance-statistics/annual-
statistics/~/media/resource/data_room/insurance_stat/2011/AG1_
2011.ashx)
Legal fines and
penalties
Based on the ‘List of Offenders Convicted under WSHA’.
(Source: WSH Act)
http://www.mom.gov.sg/workplace-safety-health/wsh-regulatory-
framework/Pages/workplace-safety-health-act.aspx)
28
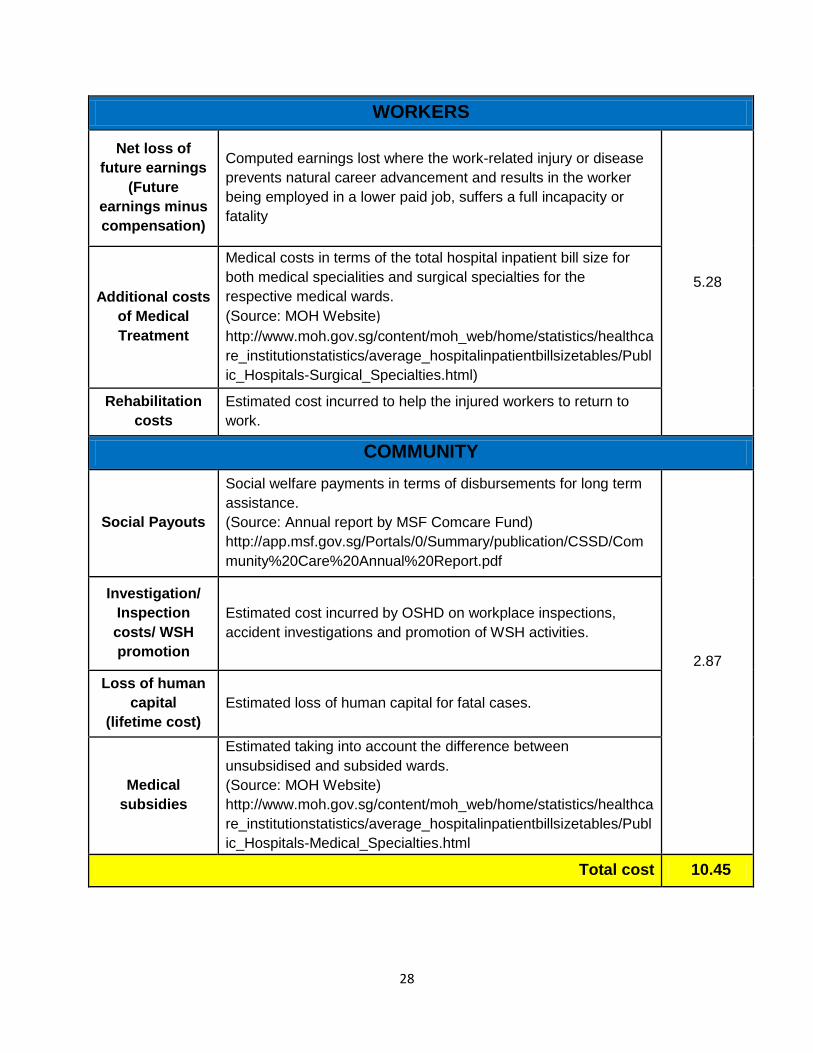
WORKERS
Net loss of
future earnings
(Future
earnings minus
compensation)
Computed earnings lost where the work-related injury or disease
prevents natural career advancement and results in the worker
being employed in a lower paid job, suffers a full incapacity or
fatality
5.28 Additional costs
of Medical
Treatment
Medical costs in terms of the total hospital inpatient bill size for
both medical specialities and surgical specialties for the
respective medical wards.
(Source: MOH Website)
http://www.moh.gov.sg/content/moh_web/home/statistics/healthca
re_institutionstatistics/average_hospitalinpatientbillsizetables/Publ
ic_Hospitals-Surgical_Specialties.html)
Rehabilitation
costs
Estimated cost incurred to help the injured workers to return to
work.
COMMUNITY
Social Payouts
Social welfare payments in terms of disbursements for long term
assistance.
(Source: Annual report by MSF Comcare Fund)
http://app.msf.gov.sg/Portals/0/Summary/publication/CSSD/Com
munity%20Care%20Annual%20Report.pdf
2.87
Investigation/
Inspection
costs/ WSH
promotion
Estimated cost incurred by OSHD on workplace inspections,
accident investigations and promotion of WSH activities.
Loss of human
capital
(lifetime cost)
Estimated loss of human capital for fatal cases.
Medical
subsidies
Estimated taking into account the difference between
unsubsidised and subsided wards.
(Source: MOH Website)
http://www.moh.gov.sg/content/moh_web/home/statistics/healthca
re_institutionstatistics/average_hospitalinpatientbillsizetables/Publ
ic_Hospitals-Medical_Specialties.html
Total cost 10.45
29
Appendix 4: Sensitivity Analysis
With the computed cost of work-related injuries and ill health dependent on the
estimated number of such cases, it is important to revisit the earlier assumptions used
in its derivations and study the impact on overall cost estimates from changes in these
assumptions.
While most parameters are computed via administrative data sources, the number of
persons in the working population estimated to have suffered a work-related injury or ill
health, a key variable used in the determination of the number of work-related injuries
and ill health, was based on survey data. Findings of an internal MOM survey in 2008
found that 1.5% of employed local residents claimed to have suffered a work injury in
the past 12 months (from the date of the survey) and 6.9% of them have had a work-
related ill health problem.
Using a lower bound of 1.1% and an upper bound of 1.9% for work-related injuries and
a lower bound of 6.1% and an upper bound of 7.7% for work-related ill health, results
show a possible range of overall cost estimates varying between SGD 9.53 billion to
SGD 11.37 billion, a deviation of 12% from estimates using the baseline parameter.