Embed Size (px)
Citation preview
Transportation Fuels Assessments ‐Policy
Economic Demographic and Energy Price InputsEconomic, Demographic, and Energy Price Inputs for Electricity,
Natural Gas and Transportation Fuel DemandNatural Gas, and Transportation Fuel Demand Forecasts
Joint Committee Workshop
February 24, 2011February 24, 2011
Gordon Schremp
Fuels and Transportation Division
California Energy Commission
DATE FEB 24 2011
RECD. FEB 25 2011
DOCKET11-IEP-1L
Topics
• Transportation Energy Demand – Federal and State Policies– Federal ‐ Renewable Fuels Standard (RFS2)– State ‐ Low Carbon Fuel Standard (LCFS)( )
• Transportation Energy Demand – Infrastructure Assessments– Historical & forecast demand– Infrastructure needs – petroleum & renewable fuelsInfrastructure needs petroleum & renewable fuels
• Advanced Biofuel Technologies• Crude Oil
l & f d d– Historical & forecast import demand– Refining capacity scenario & infrastructure needs– Crude oil “screening”
• Other Issues– MOTEMS status, new ozone standards, agricultural commodities,
ethanol import tariffs, blending credits, Macondo oil spill, and energy security
22/24/2011

Federal & State Regulations – More Biofuels
32/24/2011

Renewable Fuels Standard (RFS2) – Increased Demand for Ethanol and BiodieselDemand for Ethanol and Biodiesel
• Federal standard (RFS2) mandates increased use of renewable fuel – both ethanol and biodiesel
• Obligated parties include refiners, importers, and blenders
C i t R bl Id tifi ti N b• Companies can generate Renewable Identification Number (RIN) credits for excess renewable fuel use or purchase credits
• Program is not a “per‐gallon” regulationg p g g
• Regulation impacts can include:– Increased demand for & production of ethanol
– Increased demand for ethanol feedstock such as corn
– Displacement of gasoline
– Need for expanded renewable fuel infrastructure
2/24/2011 4

Renewable Fuels Standard (RFS2)
Total Starch Other Biomass TotalRenewable Fuel Derived Cellulosic Advanced Based Advanced
Requirement Biofuel Biofuels Biofuels Diesel BiofuelsYear Bil Gallons Bil Gallons Bil Gallons Bil Gallons Bil Gallons Bil Gallons
Advanced Biofuels
Year Bil. Gallons Bil. Gallons Bil. Gallons Bil. Gallons Bil. Gallons Bil. Gallons2008 9.00 9.00 0.002009 11.10 10.50 0.10 0.50 0.602010 12.95 12.00 0.10 0.20 0.65 0.952011 13 95 12 60 0 25 0 30 0 80 1 352011 13.95 12.60 0.25 0.30 0.80 1.352012 15.20 13.20 0.50 0.50 1.00 2.002013 16.55 13.80 1.00 0.75 1.00 2.752014 18.15 14.40 1.75 1.00 1.00 3.752015 20.50 15.00 3.00 1.50 1.00 5.502016 22.25 15.00 4.25 2.00 1.00 7.252017 24.00 15.00 5.50 2.50 1.00 9.002018 26.00 15.00 7.00 3.00 1.00 11.002019 28.00 15.00 8.50 3.50 1.00 13.002020 30.00 15.00 10.50 3.50 1.00 15.002021 33.00 15.00 13.50 3.50 1.00 18.002022 36.00 15.00 16.00 4.00 1.00 21.00
Cellulosic requirement downgraded to 6 0 million gallons for 2011
52/24/2011
Cellulosic requirement downgraded to 6.0 million gallons for 2011.

RFS2 Impact on CA Gasoline Demand Forecast2009 Results Will Be Updated2009 Results Will Be Updated
16,000
18,000
Source: Energy Commission analysis.
12,000
14,000
ons
8,000
10,000
Millions of G
allo
Initial Low Gasoline Demand Forecast
Revised Low Gasoline Demand ‐ RFS2 Scenario
4,000
6,000M
Revised E85 Low Demand ‐ RFS2 Scenario
Initial E85 Forecast
0
2,000
2008
2009
2010
2011
2012
2013
2014
2015
2016
2017
2018
2019
2020
2021
2022
2023
2024
2025
2026
2027
2028
2029
2030
62/24/2011
Can contribute to refinery overcapacity & E85 infrastructure constraints.
12%
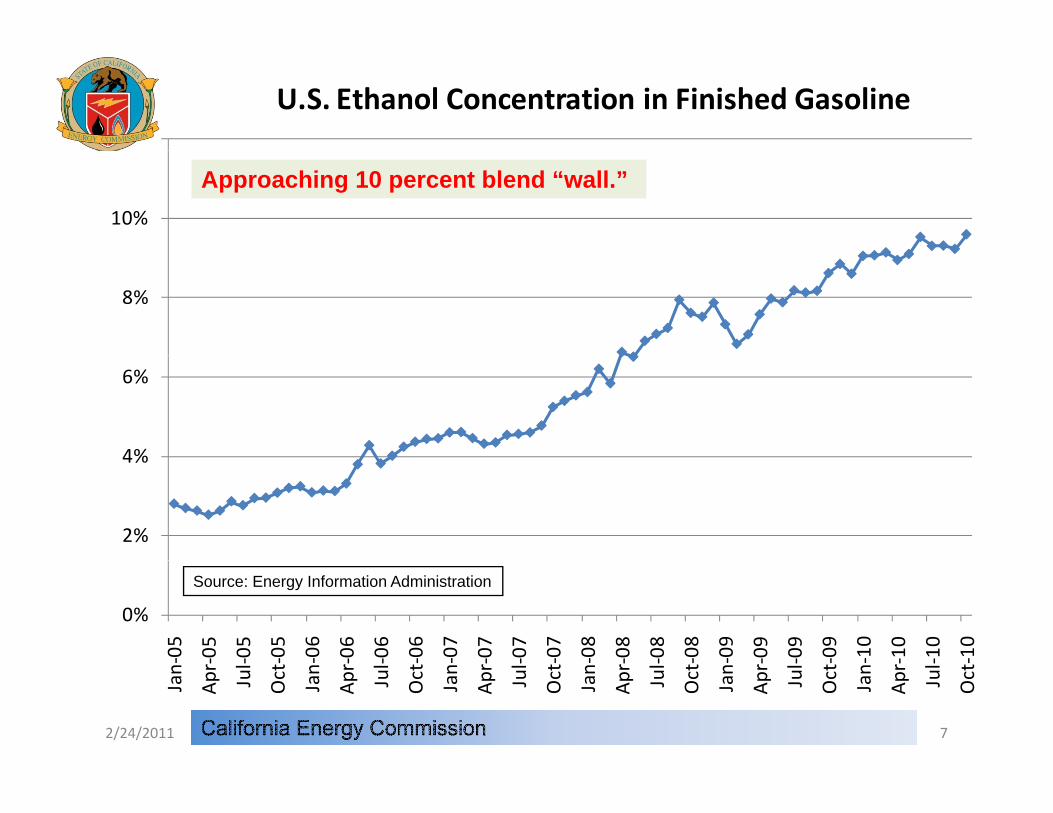
U.S. Ethanol Concentration in Finished Gasoline
10%
Approaching 10 percent blend “wall.”
8%
4%
6%
2%
4%
0%
‐05
‐05
‐05
‐05
‐06
‐06
‐06
‐06
‐07
‐07
‐07
‐07
‐08
‐08
‐08
‐08
‐09
‐09
‐09
‐09
‐10
‐10
‐10
‐10
Source: Energy Information Administration
Jan
Apr‐
Jul‐
Oct‐
Jan
Apr‐
Jul‐
Oct‐
Jan
Apr‐
Jul‐
Oct‐
Jan
Apr‐
Jul‐
Oct‐
Jan
Apr‐
Jul‐
Oct‐
Jan
Apr‐
Jul‐
Oct‐
72/24/2011
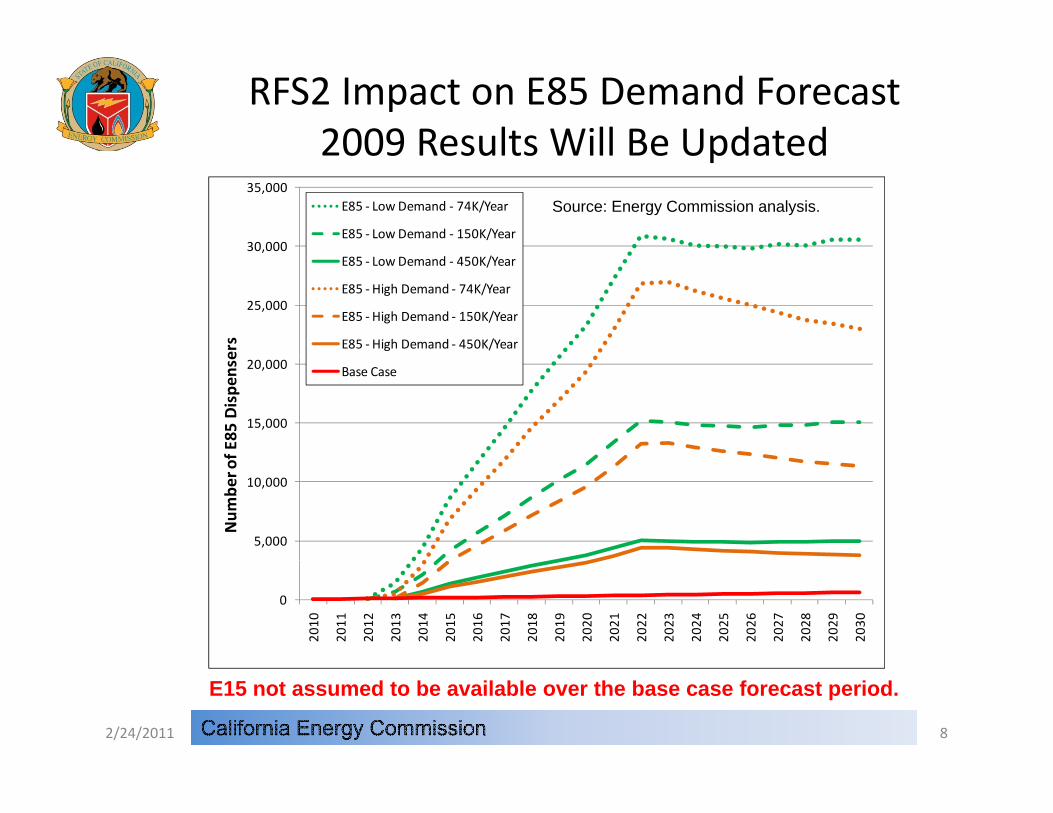
RFS2 Impact on E85 Demand Forecast2009 Results Will Be Updated2009 Results Will Be Updated
30,000
35,000E85 ‐ Low Demand ‐ 74K/Year
E85 ‐ Low Demand ‐ 150K/Year
Source: Energy Commission analysis.
25,000
,ers
E85 ‐ Low Demand ‐ 450K/Year
E85 ‐High Demand ‐ 74K/Year
E85 ‐High Demand ‐ 150K/Year
E85 ‐High Demand ‐ 450K/Year
15,000
20,000
f E85
Dispe
nse
Base Case
5,000
10,000
Num
ber o
f
0
2010
2011
2012
2013
2014
2015
2016
2017
2018
2019
2020
2021
2022
2023
2024
2025
2026
2027
2028
2029
2030
82/24/2011
E15 not assumed to be available over the base case forecast period.
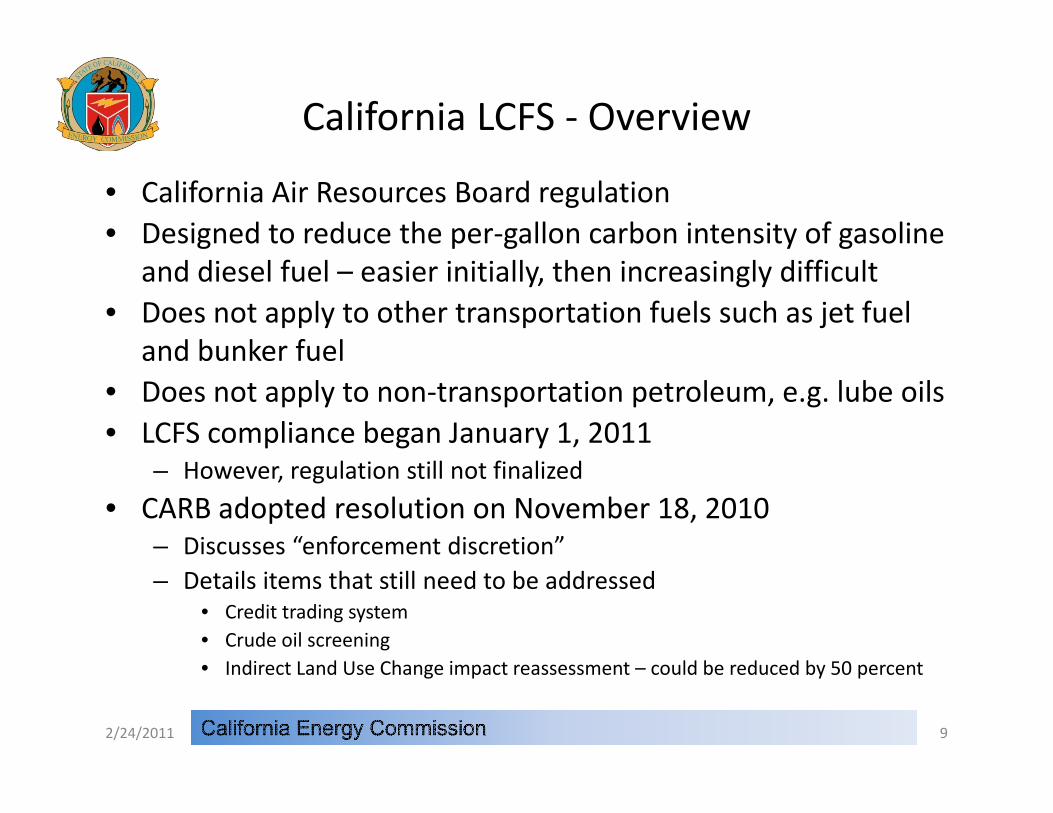
California LCFS ‐ Overview
• California Air Resources Board regulation• Designed to reduce the per‐gallon carbon intensity of gasoline
and diesel fuel – easier initially, then increasingly difficult• Does not apply to other transportation fuels such as jet fuel
and bunker fueland bunker fuel• Does not apply to non‐transportation petroleum, e.g. lube oils• LCFS compliance began January 1, 2011
– However, regulation still not finalized
• CARB adopted resolution on November 18, 2010– Discusses “enforcement discretion”– Details items that still need to be addressed
• Credit trading system• Crude oil screening
I di t L d U Ch i t t ld b d d b 50 t• Indirect Land Use Change impact reassessment – could be reduced by 50 percent
2/24/2011 9
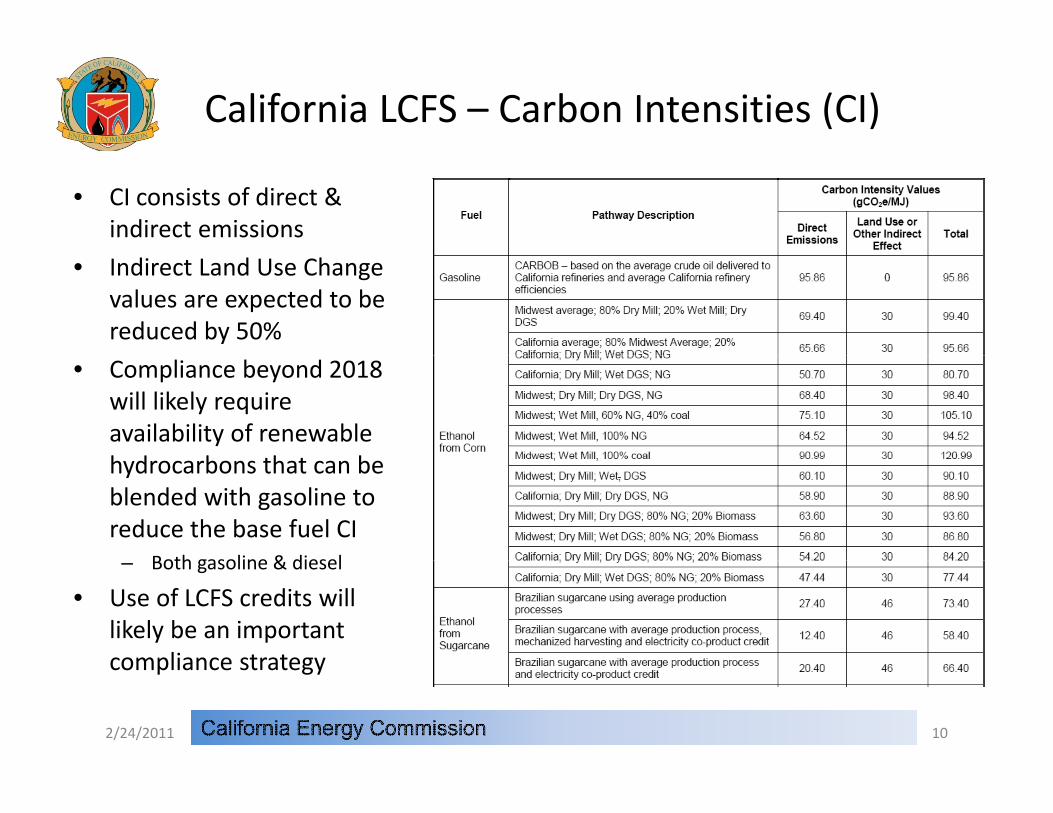
California LCFS – Carbon Intensities (CI)
• CI consists of direct & indirect emissions
• Indirect Land Use Change values are expected to be reduced by 50%
• Compliance beyond 2018 will likely require availability of renewable h d b th t bhydrocarbons that can be blended with gasoline to reduce the base fuel CI
Both gasoline & diesel– Both gasoline & diesel
• Use of LCFS credits will likely be an important compliance strategycompliance strategy
2/24/2011 10
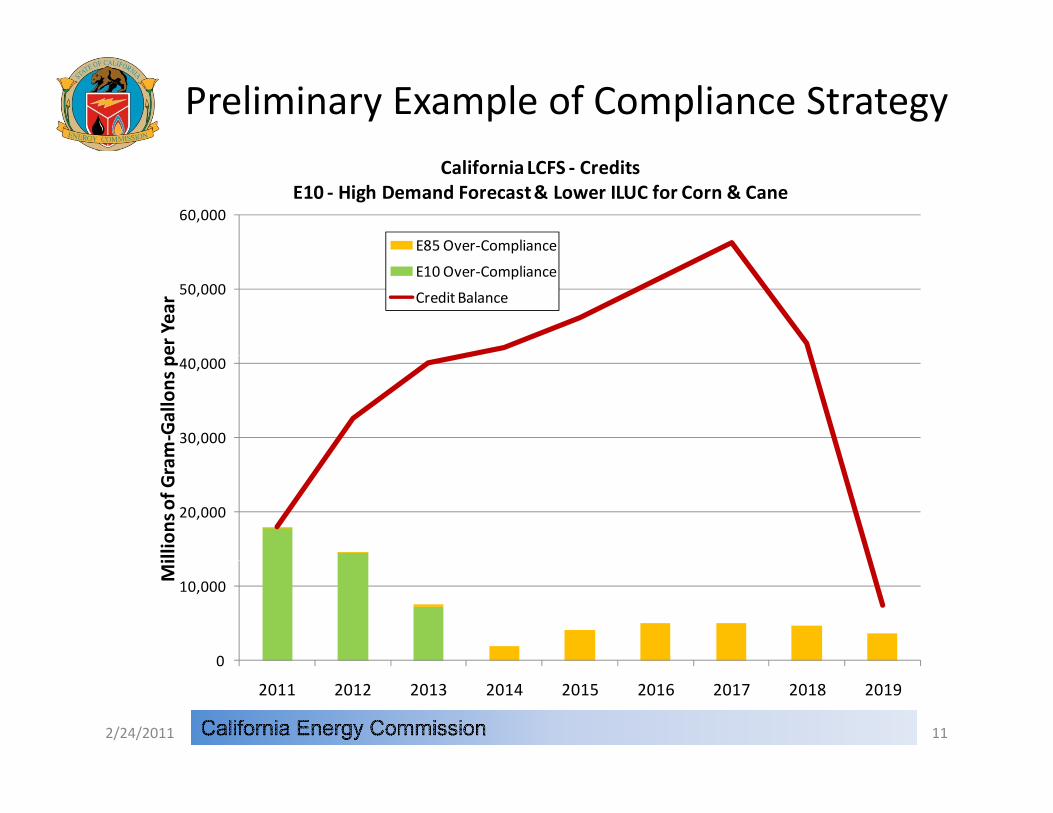
Preliminary Example of Compliance Strategy
60,000
California LCFS ‐ CreditsE10 ‐ High Demand Forecast & Lower ILUC for Corn & Cane
E85 Over‐Compliance
50,000
er Year
p
E10 Over‐Compliance
Credit Balance
30,000
40,000
m‐Gallons p
20,000
illions of G
ra
0
10,000
Mi
112/24/2011
0
2011 2012 2013 2014 2015 2016 2017 2018 2019

Transportation Energy DemandInfrastructure AssessmentsInfrastructure Assessments
122/24/2011
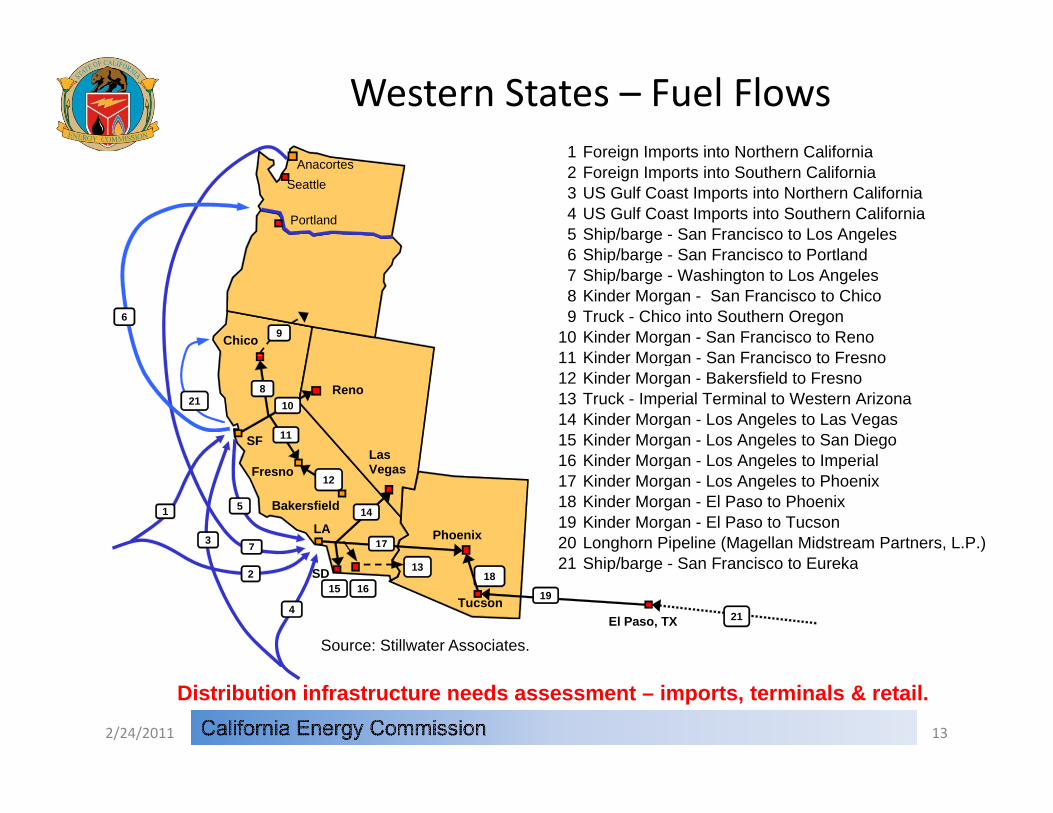
Western States – Fuel Flows1 Foreign Imports into Northern California
AnacortesSeattle
Portland
1 Foreign Imports into Northern California2 Foreign Imports into Southern California3 US Gulf Coast Imports into Northern California4 US Gulf Coast Imports into Southern California5 Ship/barge - San Francisco to Los Angeles6 Ship/barge San Francisco to Portland
Chico 96
6 Ship/barge - San Francisco to Portland7 Ship/barge - Washington to Los Angeles8 Kinder Morgan - San Francisco to Chico9 Truck - Chico into Southern Oregon
10 Kinder Morgan - San Francisco to Reno11 Kinder Morgan San Francisco to Fresno
SFLas
Reno810
11
21
11 Kinder Morgan - San Francisco to Fresno12 Kinder Morgan - Bakersfield to Fresno13 Truck - Imperial Terminal to Western Arizona14 Kinder Morgan - Los Angeles to Las Vegas15 Kinder Morgan - Los Angeles to San Diego16 Kinder Morgan Los Angeles to Imperial
LA
Bakersfield
LasVegas
Phoenix7
1
3
5 14
17
12Fresno
16 Kinder Morgan - Los Angeles to Imperial17 Kinder Morgan - Los Angeles to Phoenix18 Kinder Morgan - El Paso to Phoenix19 Kinder Morgan - El Paso to Tucson20 Longhorn Pipeline (Magellan Midstream Partners, L.P.)21 Ship/barge San Francisco to Eureka
TucsonEl Paso, TX
15SD
21
2
4
1816 19
13 21 Ship/barge - San Francisco to Eureka
Source: Stillwater Associates.
132/24/2011
Distribution infrastructure needs assessment – imports, terminals & retail.
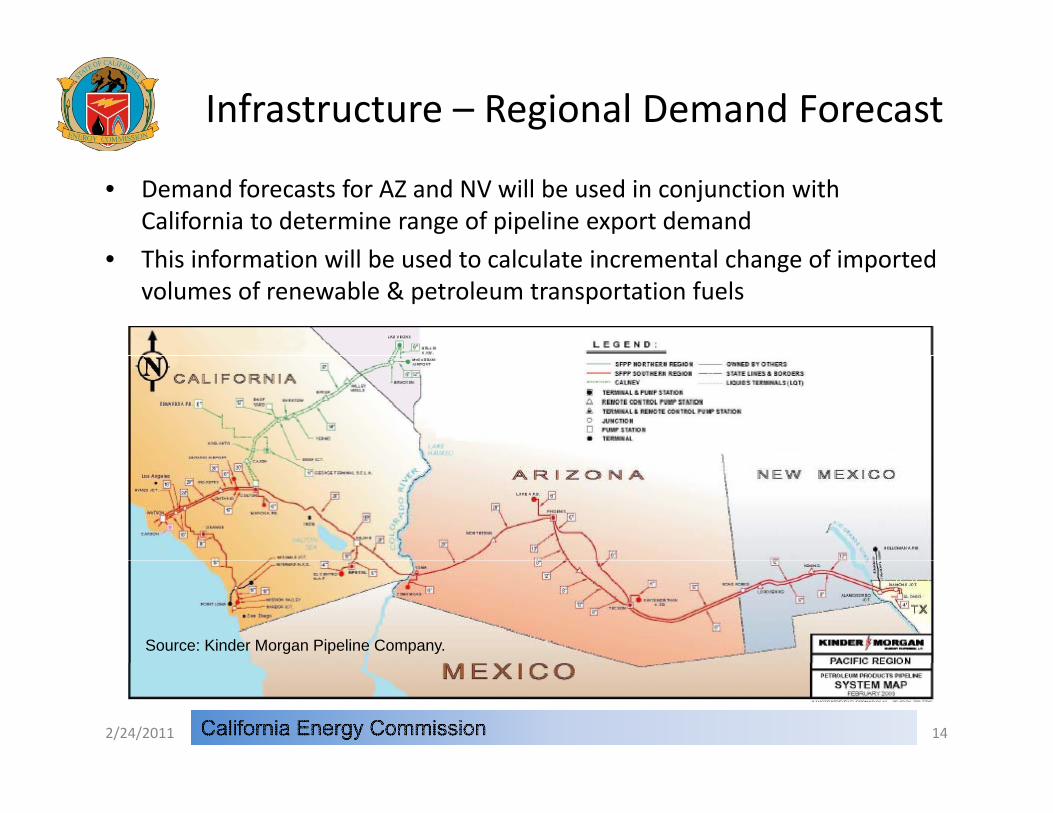
Infrastructure – Regional Demand Forecast
• Demand forecasts for AZ and NV will be used in conjunction with California to determine range of pipeline export demand
Thi i f ti ill b d t l l t i t l h f i t d• This information will be used to calculate incremental change of imported volumes of renewable & petroleum transportation fuels
Source: Kinder Morgan Pipeline Company.
2/24/2011 14

Infrastructure – Regional Pipeline Projects
• UNEV pipeline could become operational as early as the 2nd Q of 2011 with an initial pumping capacity of 30,000 BPD
• Over time, the pipeline system could be expanded to a maximum pumping capacity of up to
8 000118,000 BPD
• Will displace an undetermined portion of the forecasted pipeline d li i L V fdeliveries to Las Vegas from California
2/24/2011 15
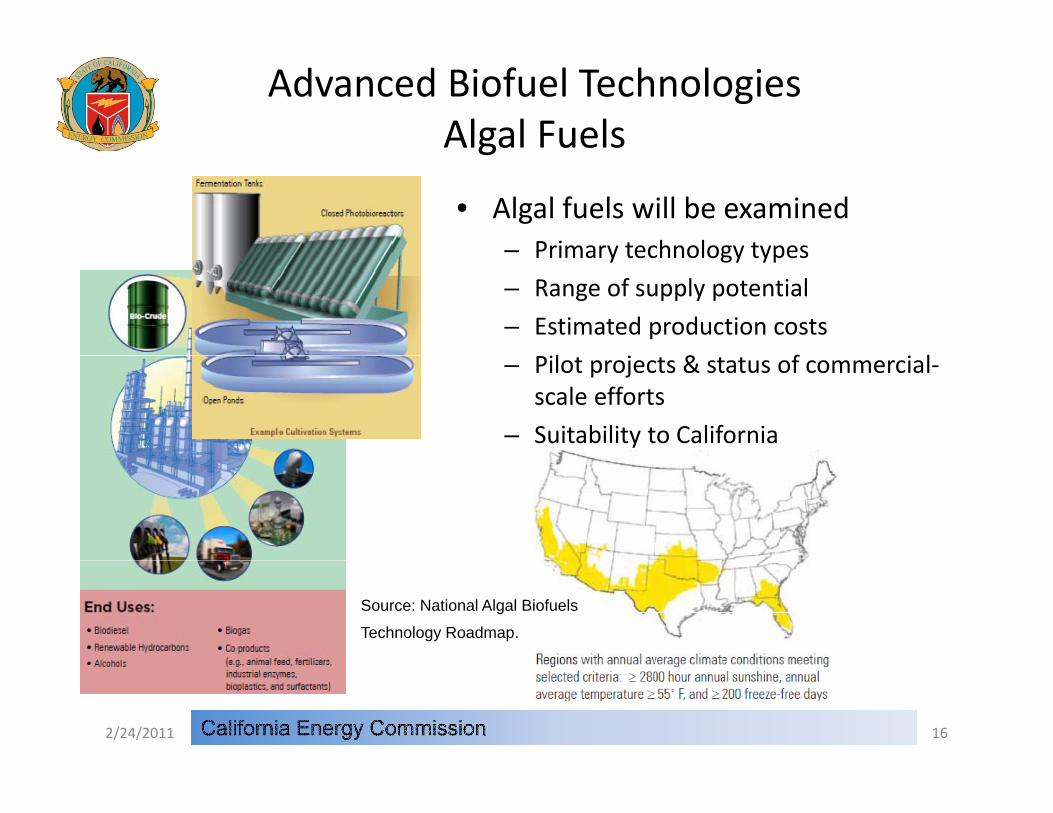
Advanced Biofuel TechnologiesAlgal Fuelsg
• Algal fuels will be examined– Primary technology typesPrimary technology types
– Range of supply potential
– Estimated production costs
l & f l– Pilot projects & status of commercial‐scale efforts
– Suitability to California
Source: National Algal Biofuels
Technology Roadmap.
2/24/2011 16
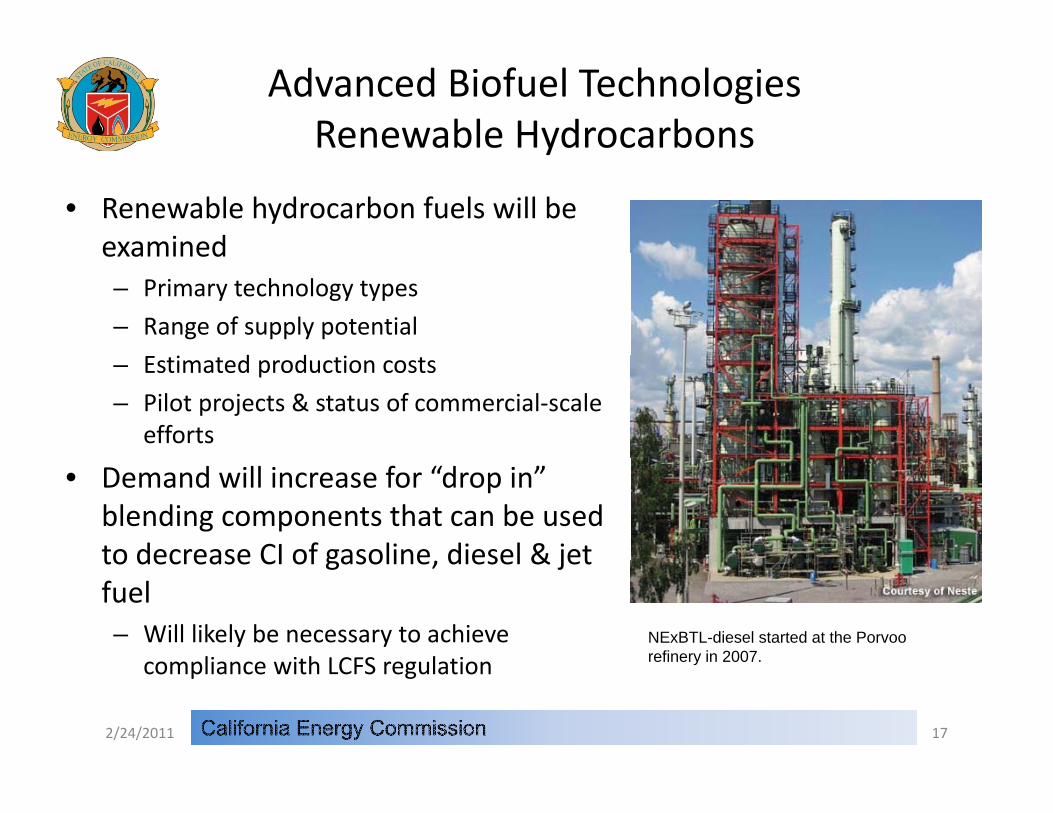
Advanced Biofuel TechnologiesRenewable Hydrocarbonsy
• Renewable hydrocarbon fuels will be examinedexamined– Primary technology types
– Range of supply potential
d d– Estimated production costs
– Pilot projects & status of commercial‐scale efforts
• Demand will increase for “drop in” blending components that can be used to decrease CI of gasoline diesel & jetto decrease CI of gasoline, diesel & jet fuel– Will likely be necessary to achieve
compliance with LCFS regulationNExBTL-diesel started at the Porvoo refinery in 2007.compliance with LCFS regulation
2/24/2011 17
y

Crude Oil
182/24/2011

Crude Oil – Import Forecast
• Crude Oil Import Forecast – Several Elements– California oil production – historical & forecast rate of decline– Demand forecast for petroleum‐based transportation fuels
450Production Peaked in 1985424 Million Barrels
p p• California, Nevada & Arizona
– California refining capacity – level or declining?
300
350
400
r Yea
r
424 Million Barrels
150
200
250
s of
Bar
rels
per
Cumulative CrudeOil Production
28.2 Billion Barrels, Equivalent to 10.7
Months of 2010 Global Demand of87 7 Milli B l
0
50
100
Mill
ions 87.7 Million Barrels
Per Day
0
1876
1883
1890
1897
1904
1911
1918
1925
1932
1939
1946
1953
1960
1967
1974
1981
1988
1995
2002
2009
192/24/2011
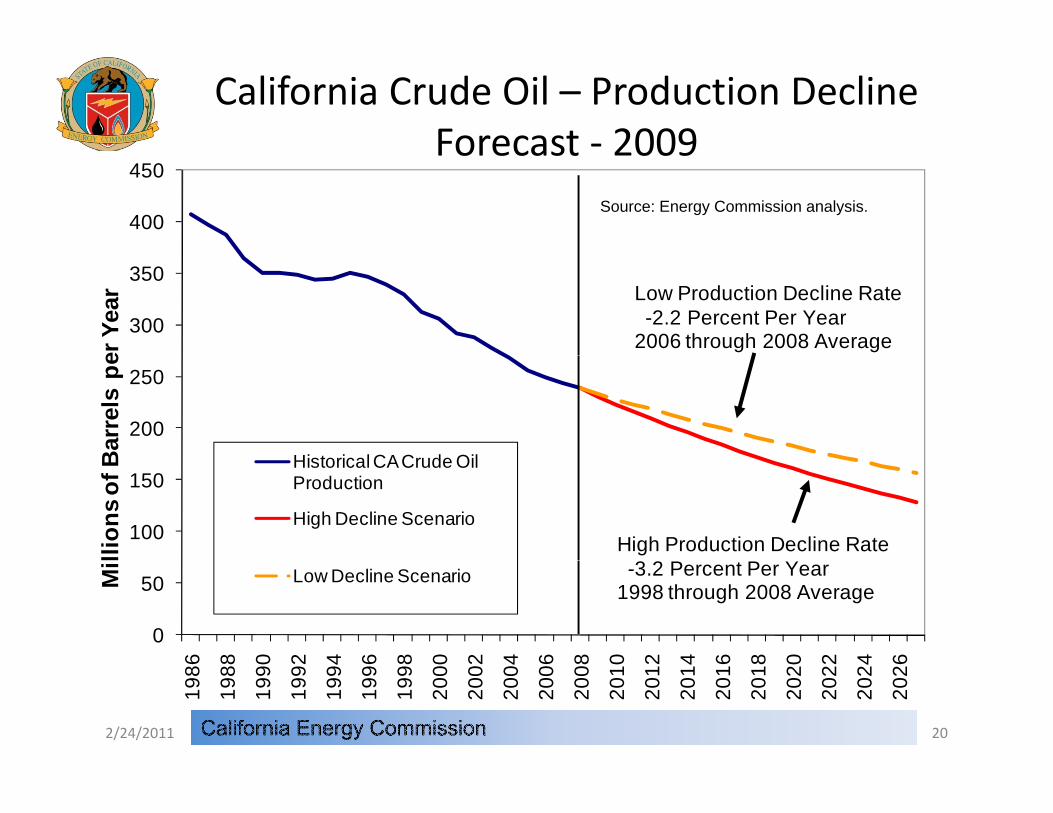
California Crude Oil – Production Decline Forecast ‐ 2009
400
450Forecast 2009
Source: Energy Commission analysis.
300
350
er Y
ear Low Production Decline Rate
-2.2 Percent Per Year2006 through 2008 Average
200
250
Bar
rels
pe
Historical CACr de Oil
100
150
llion
s of
B Historical CA Crude Oil Production
High Decline ScenarioHigh Production Decline Rate
0
50
6 8 0 2 4 6 8 0 2 4 6 8 0 2 4 6 8 0 2 4 6
Mi
Low Decline Scenario -3.2 Percent Per Year1998 through 2008 Average
1986
1988
1990
1992
1994
1996
1998
2000
2002
2004
2006
2008
2010
2012
2014
2016
2018
2020
2022
2024
2026
202/24/2011
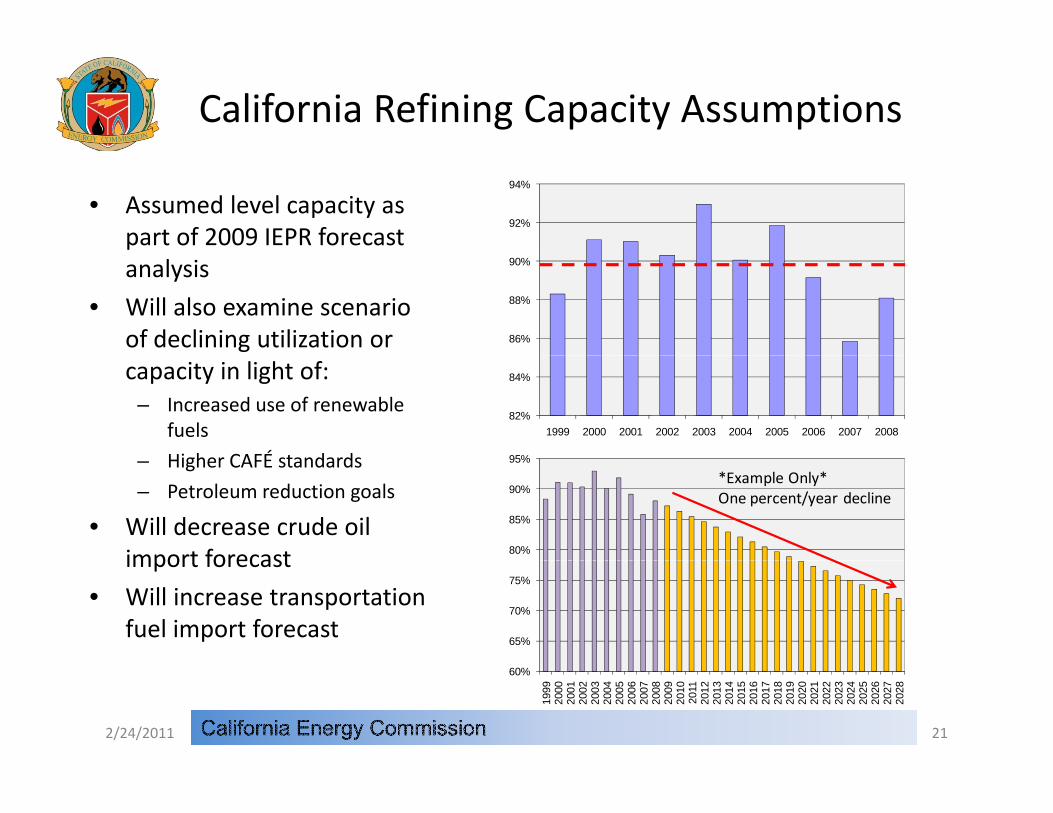
California Refining Capacity Assumptions
92%
94%
• Assumed level capacity as part of 2009 IEPR forecast
86%
88%
90%analysis
• Will also examine scenario of declining utilization or
82%
84%
1999 2000 2001 2002 2003 2004 2005 2006 2007 2008
capacity in light of:– Increased use of renewable
fuels
Higher CAFÉ standards 95%– Higher CAFÉ standards
– Petroleum reduction goals
• Will decrease crude oil import forecast 80%
85%
90%
95%
*Example Only*One percent/year decline
import forecast
• Will increase transportation fuel import forecast
65%
70%
75%
2/24/2011 21
60%
1999
2000
2001
2002
2003
2004
2005
2006
2007
2008
2009
2010
2011
2012
2013
2014
2015
2016
2017
2018
2019
2020
2021
2022
2023
2024
2025
2026
2027
2028
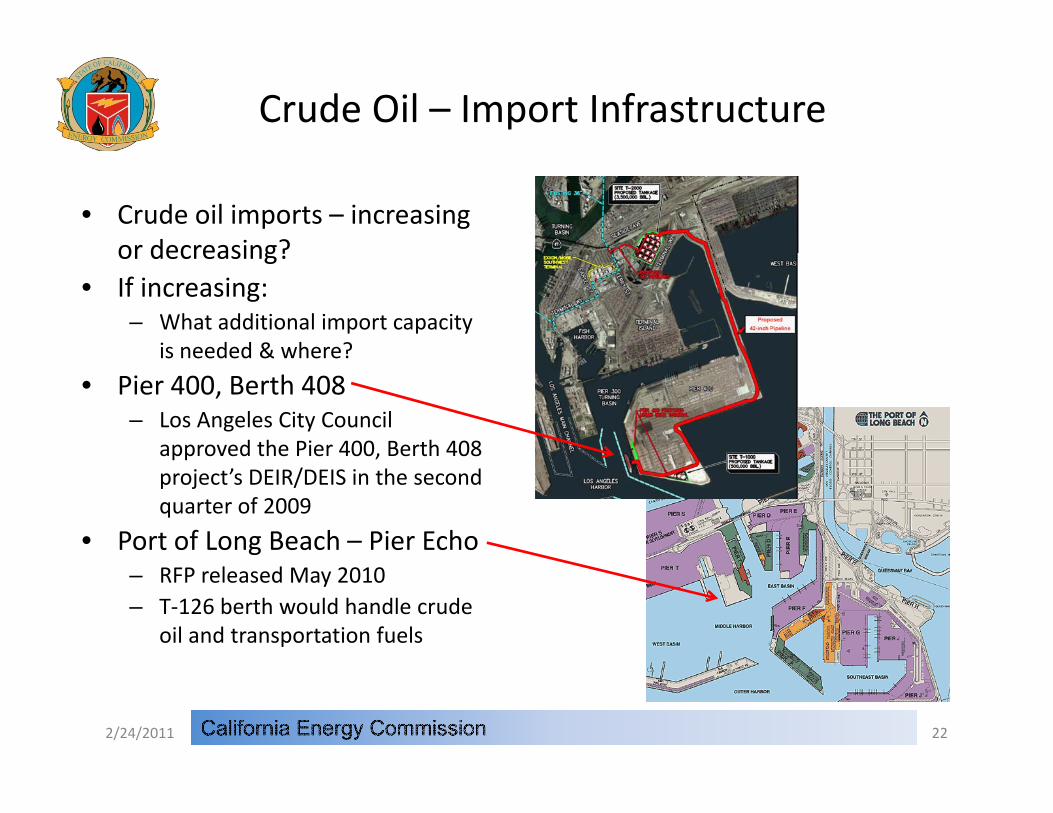
Crude Oil – Import Infrastructure
• Crude oil imports – increasing or decreasing?or decreasing?
• If increasing:– What additional import capacity
is needed & where?is needed & where?
• Pier 400, Berth 408– Los Angeles City Council
approved the Pier 400, Berth 408 pp ,project’s DEIR/DEIS in the second quarter of 2009
• Port of Long Beach – Pier Echo– RFP released May 2010– T‐126 berth would handle crude
oil and transportation fuels
2/24/2011 22
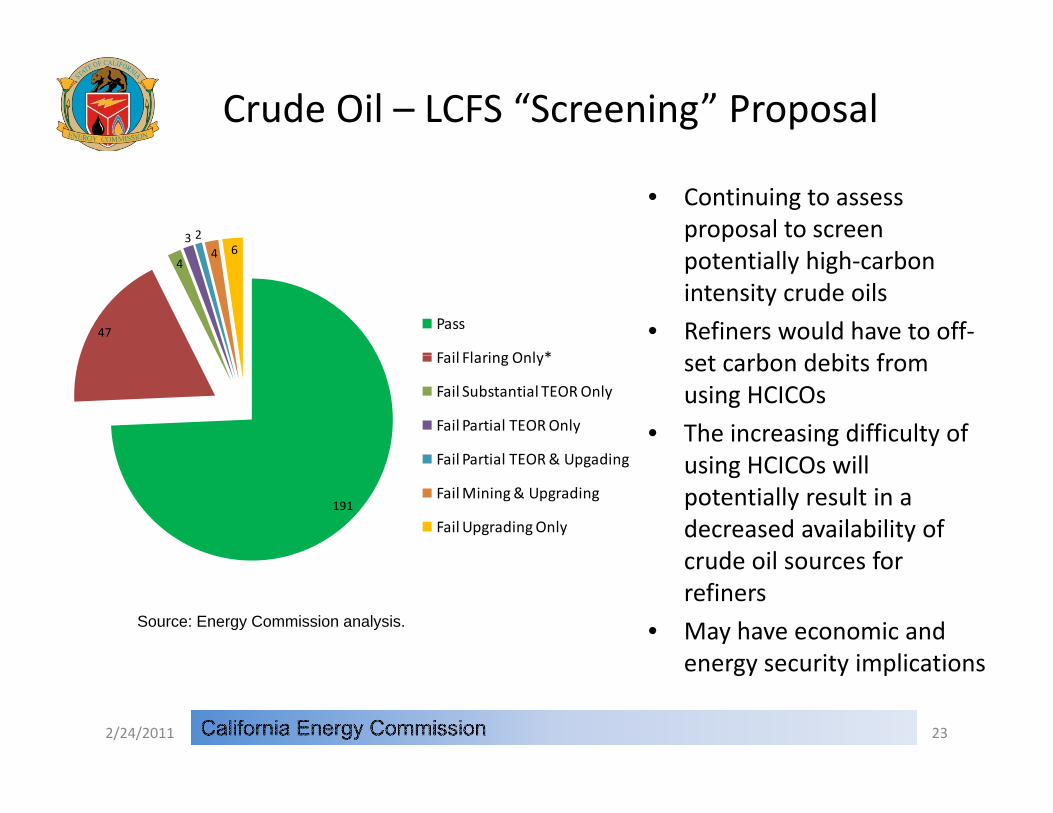
Crude Oil – LCFS “Screening” Proposal
• Continuing to assess proposal to screen
i ll hi h b3 2
4 6 potentially high‐carbon intensity crude oils
• Refiners would have to off‐b d bi f
47
44 6
Pass
Fail Flaring Only* set carbon debits from using HCICOs
• The increasing difficulty of i HCICO ill
Fail Flaring Only*
Fail Substantial TEOR Only
Fail Partial TEOR Only
Fail Partial TEOR& Upgading using HCICOs will potentially result in a decreased availability of crude oil sources for
191
Fail Partial TEOR & Upgading
Fail Mining & Upgrading
Fail Upgrading Only
crude oil sources for refiners
• May have economic and energy security implications
Source: Energy Commission analysis.
energy security implications
2/24/2011 23
Other Issues – MOTEMS Update
• Marine Oil Terminal Engineering & Maintenance Standards (MOTEMS) part of California Business Code – Chapter 31F– Require upgrades to existing marine terminals to reduce the risk of
spill related to earthquakes and tsunamis
• Most, if not all, marine oil terminals with medium or high riskMost, if not all, marine oil terminals with medium or high risk of a potential spill have completed their safety audits– Include assessments of work that needs to be completed to achieve
compliance with the standardscompliance with the standards
• Timing impacted by discussion over who pays
• It is possible that some facilities will not be upgraded and p pgtheir leases not renewed– Forecast for imports (both crude oil and transportation fuels) will have
a direct role in this debatea direct role in this debate
2/24/2011 24
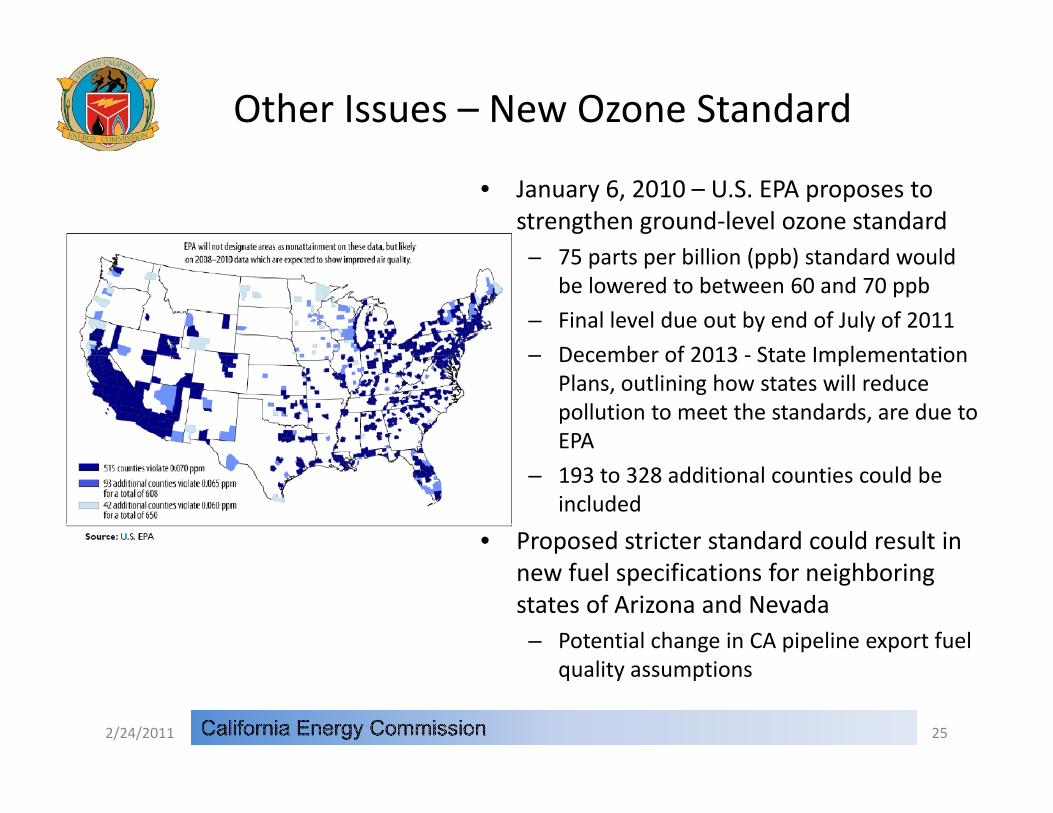
Other Issues – New Ozone Standard
• January 6, 2010 – U.S. EPA proposes to strengthen ground‐level ozone standard
75 t billi ( b) t d d ld– 75 parts per billion (ppb) standard would be lowered to between 60 and 70 ppb
– Final level due out by end of July of 2011
– December of 2013 ‐ State Implementation– December of 2013 ‐ State Implementation Plans, outlining how states will reduce pollution to meet the standards, are due to EPA
– 193 to 328 additional counties could be included
• Proposed stricter standard could result in new fuel specifications for neighboring states of Arizona and Nevada– Potential change in CA pipeline export fuel
lit tiquality assumptions
2/24/2011 25
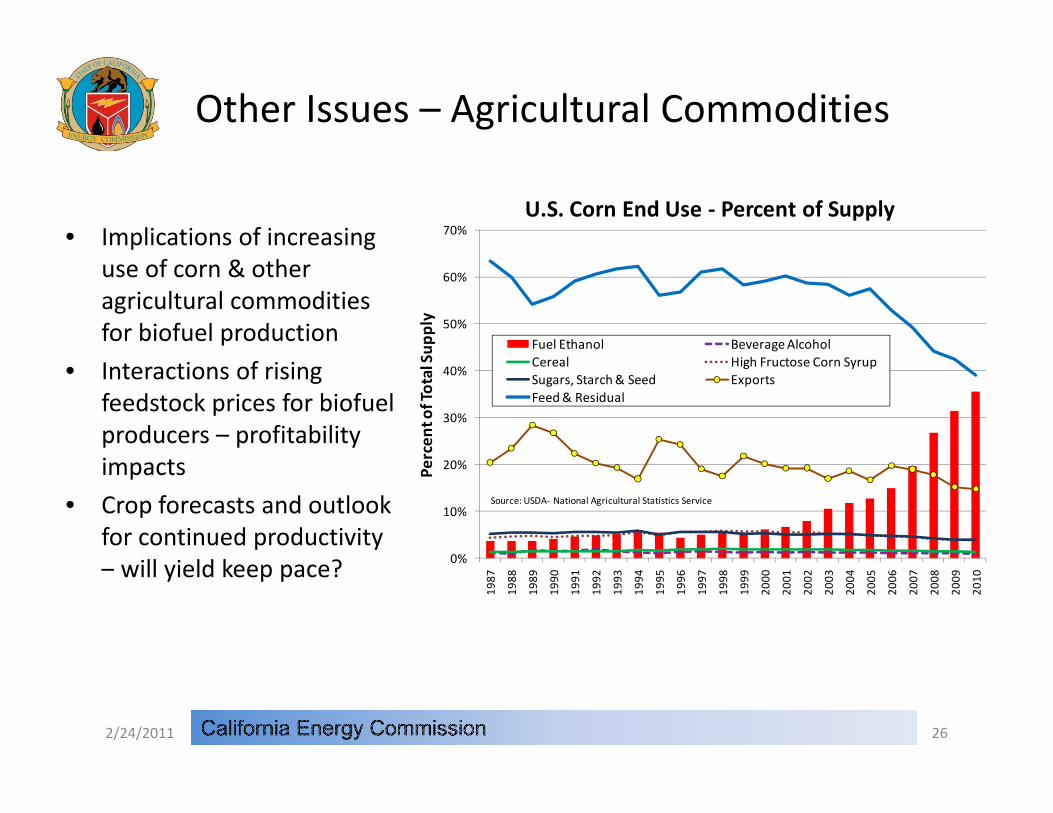
Other Issues – Agricultural Commodities
• Implications of increasing 70%U.S. Corn End Use ‐ Percent of Supply
use of corn & other agricultural commodities for biofuel production 50%
60%
Supp
ly
Fuel Ethanol Beverage Alcohol
• Interactions of rising feedstock prices for biofuel producers – profitability i
30%
40%
rcen
t of Total S Cereal High Fructose Corn Syrup
Sugars, Starch & Seed ExportsFeed & Residual
impacts
• Crop forecasts and outlook for continued productivity
ill i ld k ? 0%
10%
20%Per
Source: USDA‐ National Agricultural Statistics Service
– will yield keep pace? 0%
1987
1988
1989
1990
1991
1992
1993
1994
1995
1996
1997
1998
1999
2000
2001
2002
2003
2004
2005
2006
2007
2008
2009
2010
2/24/2011 26
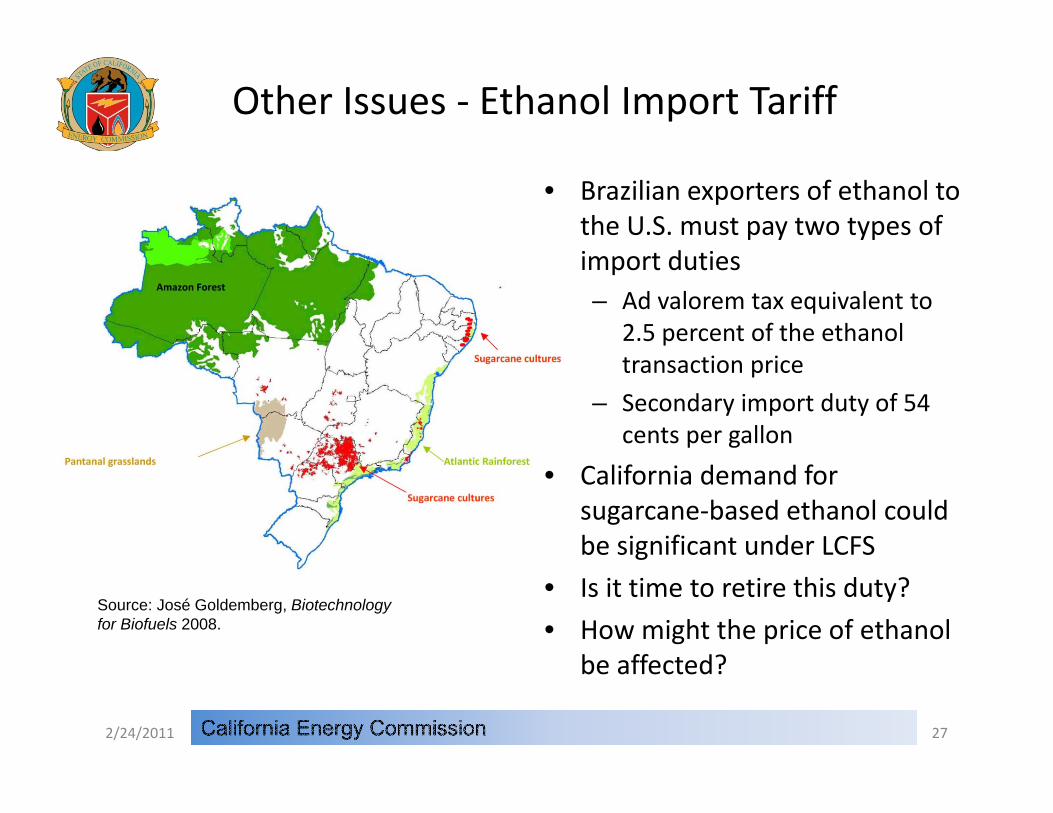
Other Issues ‐ Ethanol Import Tariff
• Brazilian exporters of ethanol to the U.S. must pay two types of i t d tiimport duties– Ad valorem tax equivalent to
2.5 percent of the ethanol transaction price
– Secondary import duty of 54 cents per gallon
• California demand for sugarcane‐based ethanol could be significant under LCFS
• Is it time to retire this duty?
• How might the price of ethanol be affected?
Source: José Goldemberg, Biotechnology for Biofuels 2008.
be affected?
2/24/2011 27
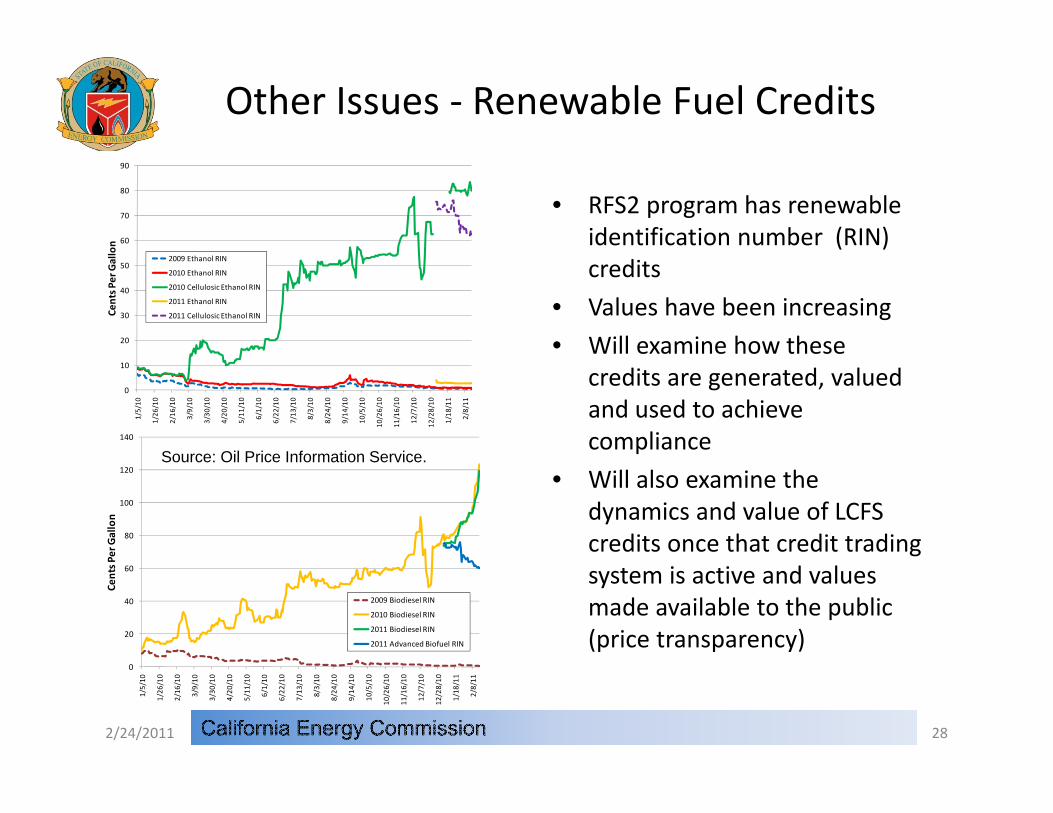
Other Issues ‐ Renewable Fuel Credits
• RFS2 program has renewable identification number (RIN) 60
70
80
90
on
credits
• Values have been increasing
• Will examine how these 20
30
40
50
Cents P
er Gall
2009 Ethanol RIN
2010 Ethanol RIN
2010 Cellulosic Ethanol RIN
2011 Ethanol RIN
2011 Cellulosic Ethanol RIN
140
credits are generated, valued and used to achieve compliance
0
10
1/5/10
1/26
/10
2/16
/10
3/9/10
3/30
/10
4/20
/10
5/11
/10
6/1/10
6/22
/10
7/13
/10
8/3/10
8/24
/10
9/14
/10
10/5/10
10/26/10
11/16/10
12/7/10
12/28/10
1/18
/11
2/8/11
Source: Oil Price Information Service
80
100
120
Per G
allon
• Will also examine the dynamics and value of LCFS credits once that credit trading
Source: Oil Price Information Service.
20
40
60
Cents P
2009 Biodiesel RIN
2010 Biodiesel RIN
2011 Biodiesel RIN
2011 Advanced Biofuel RIN
system is active and values made available to the public (price transparency)
0
1/5/10
1/26
/10
2/16
/10
3/9/10
3/30
/10
4/20
/10
5/11
/10
6/1/10
6/22
/10
7/13
/10
8/3/10
8/24
/10
9/14
/10
10/5/10
10/26/10
11/16/10
12/7/10
12/28/10
1/18
/11
2/8/11
2/24/2011 28
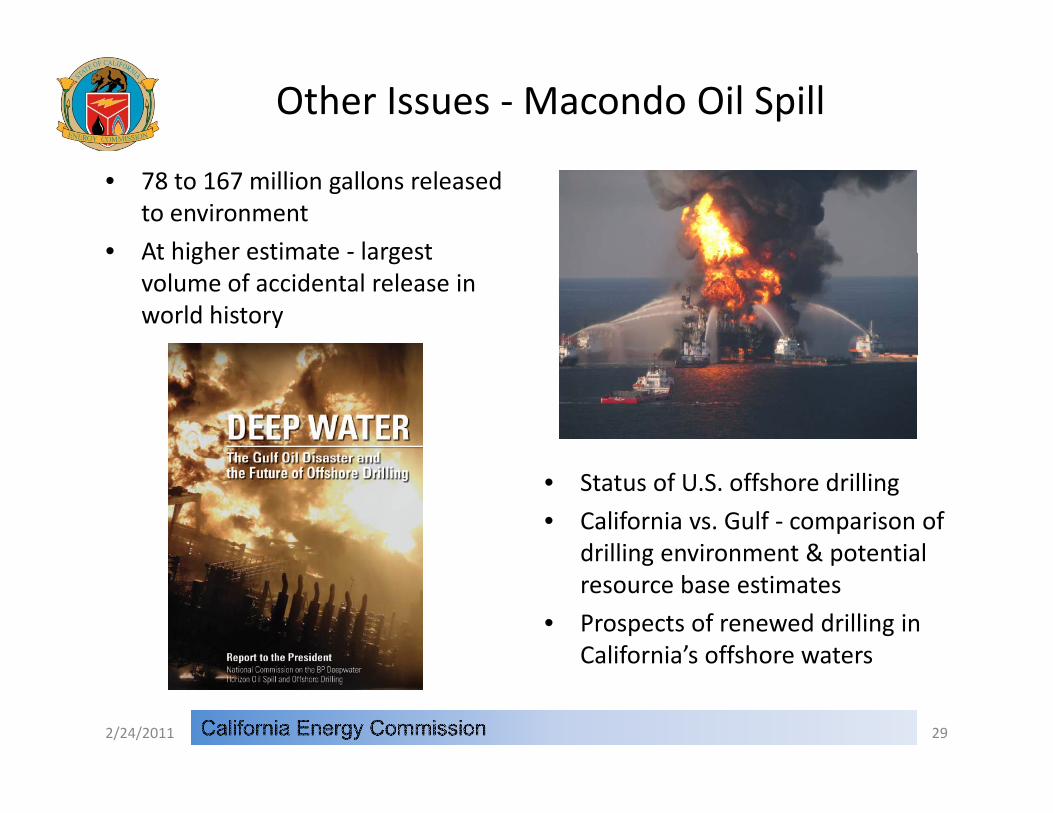
Other Issues ‐Macondo Oil Spill
• 78 to 167 million gallons released to environment
• At higher estimate ‐ largest• At higher estimate ‐ largest volume of accidental release in world history
• Status of U.S. offshore drilling
• California vs. Gulf ‐ comparison of drilling environment & potentialdrilling environment & potential resource base estimates
• Prospects of renewed drilling in California’s offshore watersCalifornia s offshore waters
2/24/2011 29

Other Issues – Energy Security
• The issue of energy security i tt ti dis attracting renewed interest as a policy consideration
• Analysis of transportation fuel issues will include a qualitative energy securityqualitative energy security assessment for specific fuels and crude oil
• Can also be relevant for renewable fuels and even advanced technologiesadvanced technologies
2/24/2011 30

Additional Q & A
Torrent Ducks – Rio Bremajo – Near San Isidro, Eastern Ecuador 10-15-2010
312/24/2011