Embed Size (px)
Citation preview
1
Economic Development in Developing Countries: Advancing Human Well‐Being
and the Capacity to Adapt to Global Warming
Indur M. Goklany
Developing countries have long been deemed to be at greater risk from global warming than
industrialized countries (see, e.g., UNEP 1993; Goklany 1995: 435). This is because, first, they
are poorer and global warming (GW) is projected to exacerbate the problems of poverty that
many of them face currently, problems such as malaria and other vector‐borne diseases,
hunger, water shortages, and vulnerability to extreme weather events and sea level rise.
Second, developing countries generally lack sufficient adaptive capacity — that is, the financial,
technological and human resources — needed to cope with these problems today (Goklany
2000; Lancet Commission 2009). This is precisely why these problems have persisted there,
despite having been virtually eliminated in the industrialized world. Accordingly, the IPCC,
among others, claim that global warming could, in fact, hinder sustainable development of
developing countries (IPCC 2007: 13, 20). Stretching this logic farther, others (e.g., Freeman
and Guzman 2009: 134‐137) argue that weak or poor governments may be swamped by the
impacts of global warming. The resulting economic instability, they claim, could then lead to
political instability, breed terrorism and conflict, and precipitate mass migration with adverse
consequences for the economic well‐being and national security of the U.S. and, following the
same chain of logic, presumably other industrialized countries as well (see, e.g., Freeman and
Guzman 2009: 134‐137).
And some even claim that we are seeing the detrimental impacts of global warming even now
(e.g., Lancet Commission 2009, WHO 2009). Mary Robinson, first female President of Ireland
and the ex‐United Nations High Commissioner for Human Rights, asserts in a report issued by
the now‐defunct Global Humanitarian Forum (2009: 1), an organization founded by Kofi Annan,
the erstwhile Secretary General of the United Nations:
The impacts of climate change are being felt today in countries around the world. In some
places, environmental changes such as prolonged drought and rising sea levels are threatening
entire communities and even nations. If we don’t take meaningful and farsighted action now to
2
address climate change, we are not only failing those who suffer today. We are also putting at
risk the well‐being of our planet and future generations.
This echoes the United Nations Framework Convention on Climate Change (2007: 20‐22) which
asserts that human well‐being is worsening in developing countries. With respect to Asia, for
instance, it claims that:
There is evidence of prominent increases in the intensity and/or frequency of many extreme
weather events such as heat waves, tropical cyclones, prolonged dry spells, intense rainfall,
tornadoes, snow avalanches, thunderstorms, and severe dust storms in the region (Cruz et al.
2007). Impacts of such disasters range from hunger and susceptibility to disease, to loss of
income and livelihoods, affecting human survival and well‐being. [UNFCCC 2007: 20]
This chapter will, first, examine the veracity of these claims. It will explore whether empirical
trends show that climate‐sensitive indicators of human well‐being are indeed worsening in
developing countries.
Second, it will shed light, briefly, on the significant factors that affect the direction of empirical
trends in climate‐sensitive indicators of human well‐being. This discussion will focus on the role
of economic and technological development powered directly or indirectly by fossil fuel
consumption.
Next, it will examine the notion — implicit in the view that developing countries will be
swamped by the future impacts of GW — that the adaptive capacity of developing countries,
which is relatively low today, will continue to be low in the future, despite the optimistic
economic assumptions built into the IPCC scenarios. These economic assumptions are among
the primary drivers of the IPCC’s emissions and climate change projections which are then used
to estimate future impacts (and damages) from GW. Thus, they are fundamental to estimates
of the magnitude of the impacts of GW.
Note that economic development can be a double‐edged sword. On one hand, all else being
equal, higher economic development would lead to higher damages from GW. On the other
hand, it also means higher adaptive capacity to cope not only with GW, but any other problems
that humanity faces (Goklany 2005). In addition, one should expect that as time marches on,
even if economic development does not advance, existing technologies should improve and
new technologies should come on line to respond to any adverse impacts of GW or take
3
advantage of any positive impacts. Such technological change, which I call “secular”
technological change in order to distinguish it from technological change resulting from
additional economic development, would occur because of the normal accretion of technology
and knowledge over time. Secular technological change would further boost adaptive capacity
(Goklany 2007a). This begs the question whether the economic development assumed by the
IPCC scenarios (accompanied by technological change) will increase the damages from GW
faster than the increases in adaptive capacity and, consequently, whether GW would hinder
sustainable development or whether insufficient economic and technological development
would hinder the ability to cope with future GW.
Fourth, this chapter will examine the potential consequences on death and disease in
developing countries resulting from GW policies, mainly in industrialized countries, that
encourage biofuel production to replace fossil fuels, and whether their toll exceeds that
attributed to GW itself.
Finally, it will weave these disparate strands together to articulate a coherent policy to
advance human well‐being in developing countries while enhancing their ability to cope with
GW.
Reality Check: Empirical Trends vs. Global Warming Hype
Here I will examine recent (decades‐long) empirical trends for various climate‐sensitive aspects
of human well‐being, and contrast them against the claims and expectations that global
warming is already reducing agricultural productivity, increasing hunger, death and disease,
drought, extreme events and affecting livelihoods and well‐being in the developing world.
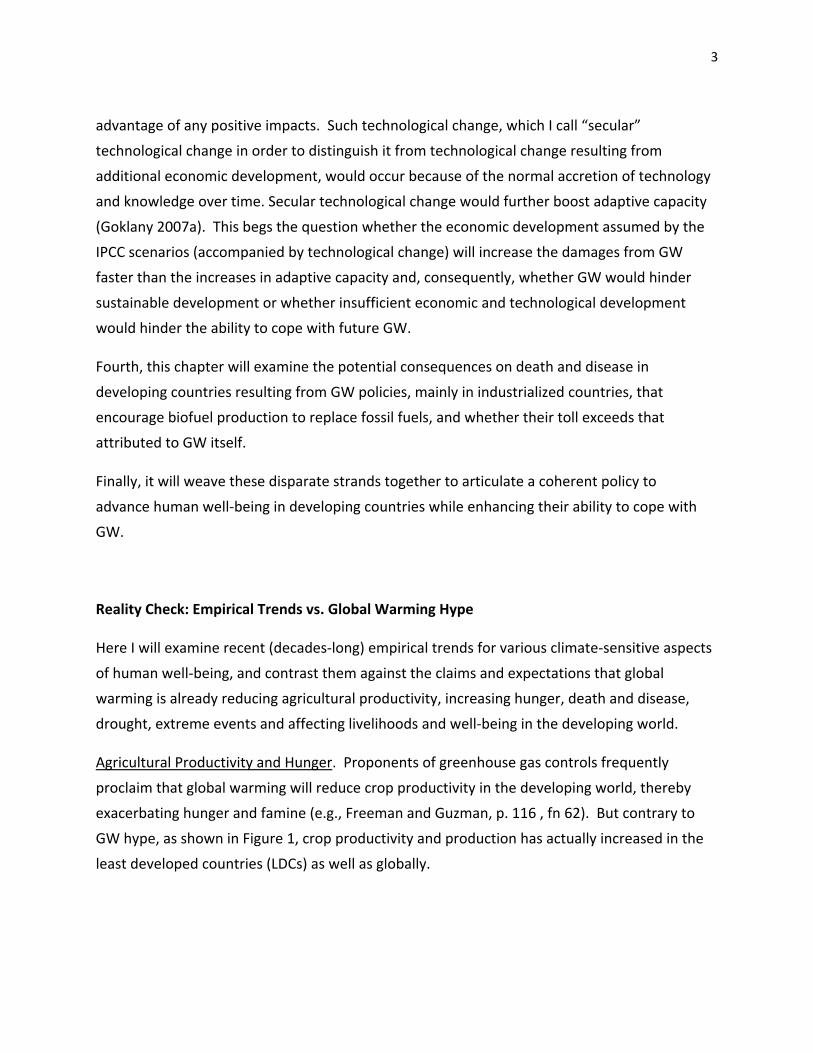
Agricultural Productivity and Hunger. Proponents of greenhouse gas controls frequently
proclaim that global warming will reduce crop productivity in the developing world, thereby
exacerbating hunger and famine (e.g., Freeman and Guzman, p. 116 , fn 62). But contrary to
GW hype, as shown in Figure 1, crop productivity and production has actually increased in the
least developed countries (LDCs) as well as globally.
4
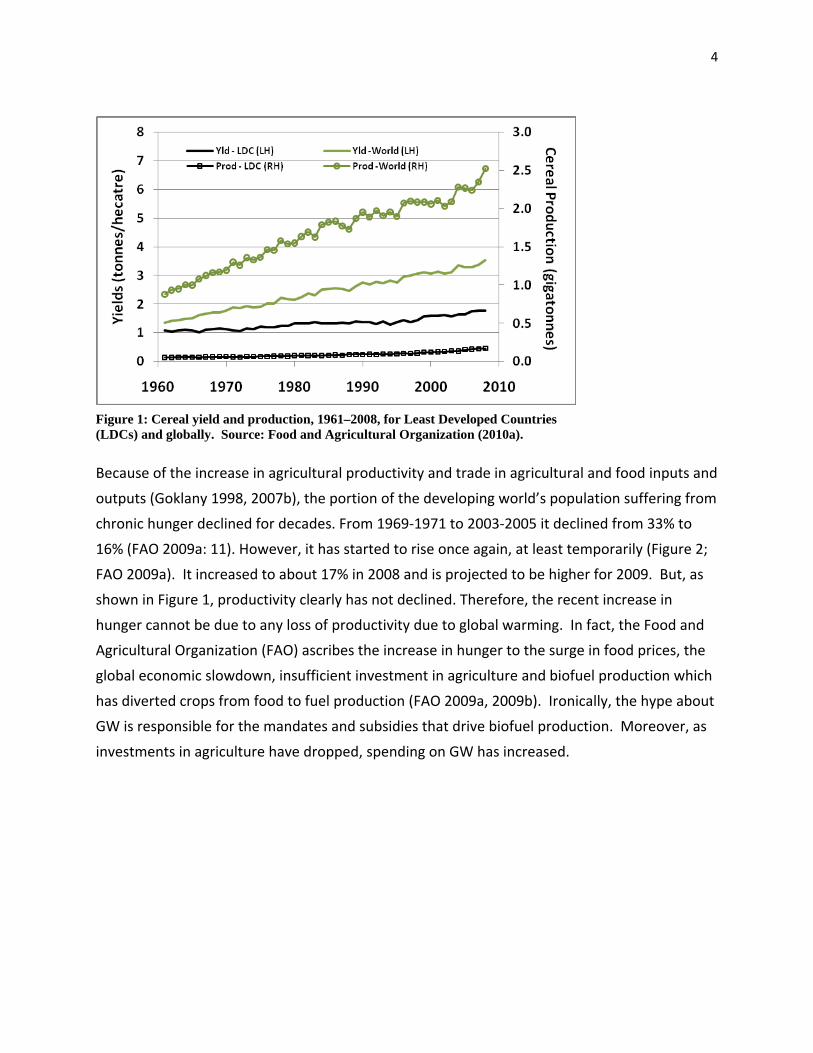
Because of the increase in agricultural productivity and trade in agricultural and food inputs and
outputs (Goklany 1998, 2007b), the portion of the developing world’s population suffering from
chronic hunger declined for decades. From 1969‐1971 to 2003‐2005 it declined from 33% to
16% (FAO 2009a: 11). However, it has started to rise once again, at least temporarily (Figure 2;
FAO 2009a). It increased to about 17% in 2008 and is projected to be higher for 2009. But, as
shown in Figure 1, productivity clearly has not declined. Therefore, the recent increase in
hunger cannot be due to any loss of productivity due to global warming. In fact, the Food and
Agricultural Organization (FAO) ascribes the increase in hunger to the surge in food prices, the
global economic slowdown, insufficient investment in agriculture and biofuel production which
has diverted crops from food to fuel production (FAO 2009a, 2009b). Ironically, the hype about
GW is responsible for the mandates and subsidies that drive biofuel production. Moreover, as
investments in agriculture have dropped, spending on GW has increased.
Figure 1: Cereal yield and production, 1961–2008, for Least Developed Countries (LDCs) and globally. Source: Food and Agricultural Organization (2010a).
5
Figure 2: Percent of developing world population suffering from chronic hunger, 1969/71–2009. Source: FAO, State of Food Insecurity 2009.
Disease. Advocates of stringent greenhouse gas controls expect GW to add to the global
burdens of death and disease (e.g., Freeman and Guzman 2009: 157). However, average life
expectancies around the world have increased from 31 years in 1900 to 47 years in the early
1950s and 69 years today (Goklany 2007b; World Bank 2010a). For developing countries, life
expectancies increased from 25–30 years in 1900, to 41 years in the early 1950s and 69 years at
present (Goklany 2009b). In fact, in virtually every country, “health‐adjusted” life expectancies
currently exceed unadjusted life expectancies from just a few decades ago (Goklany 2007b: 40).
[“Health‐adjusted” life expectancy is the life expectancy adjusted downward to partially
discount the numbers of years of life that an average person would spend in a disabled or
diseased condition.] In other words, people in developing countries are not only living longer,
they are also healthier. Therefore, there has been less disease in the aggregate, humanity is
much better able to cope with disease, or both. That is, disease is less of a problem today than
it used to be.
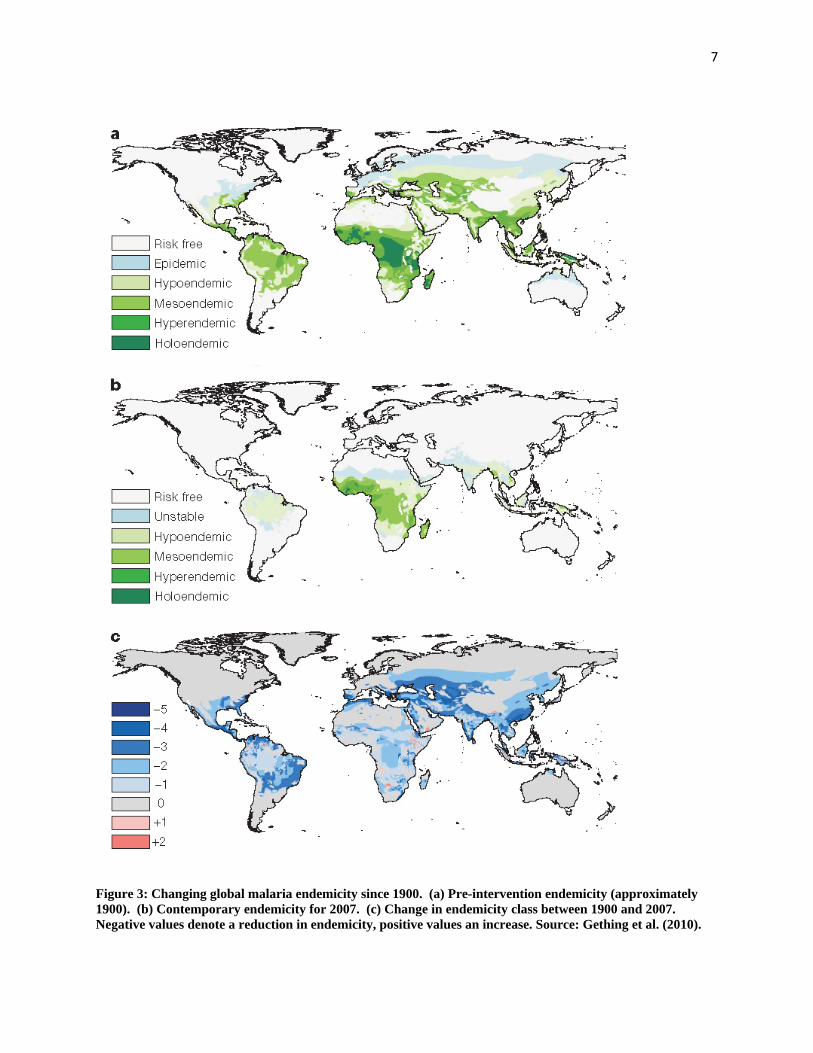
Second, the ranges of the most critical climate‐sensitive infectious diseases have actually
shrunk despite any long term warming that may have occurred. Consider malaria, which
accounts for about 75% of the global burden of disease from vector‐borne diseases (IPCC 2001:
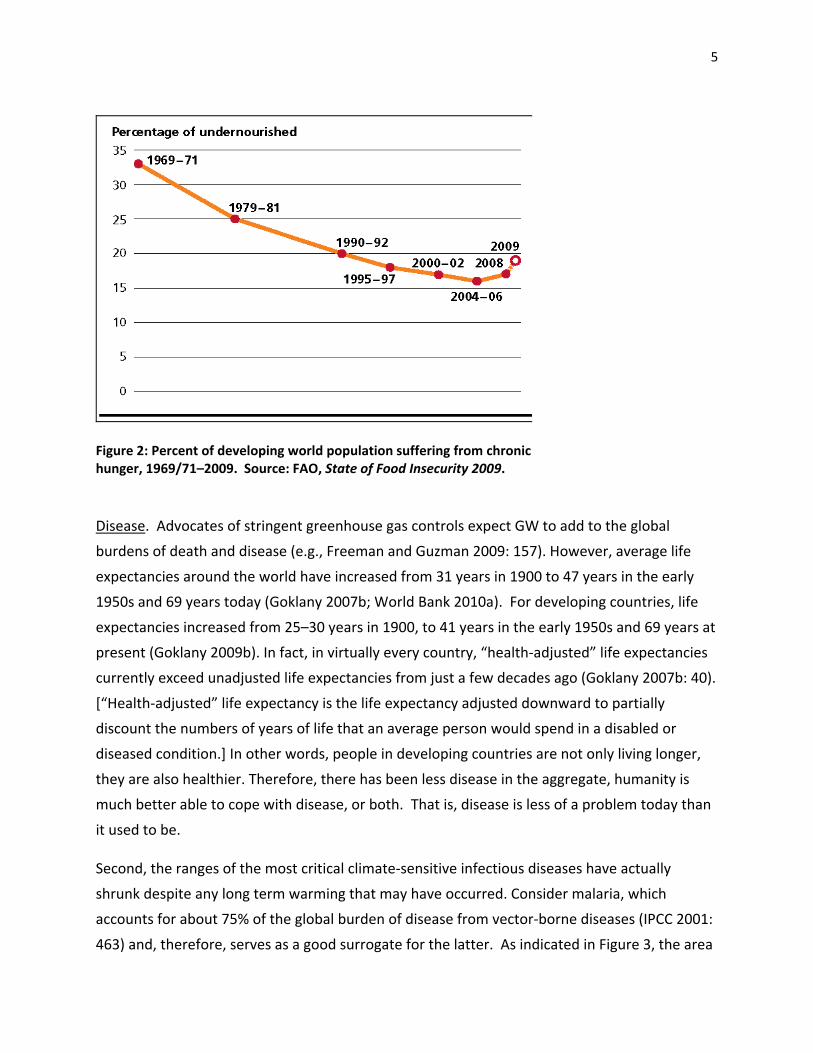
463) and, therefore, serves as a good surrogate for the latter. As indicated in Figure 3, the area
6
in which malaria due to Plasmodium falciparum — the deadliest of the four protozoan parasites
that cause malaria — is endemic, has been reduced substantially since 1900 (Gething et al.
2010), the approximate start of global warming. Endemic/stable malaria is estimated to have
covered 58% of the world’s land surface around 1900 but only 30% by 2007. P. falciparum
malaria is today restricted largely to developing countries in the tropics. Equally important, its
prevalence has decreased within its currently reduced range, with endemicity falling by one or
more classes in over two‐thirds of the current range of stable transmission (Figure 3c; Gething
et al. 2010). Gething et al. (2010) note that:
“of the 66 million km2 of the Earth’s surface thought to have sustained stable/endemic malaria in
1900, 12%, 18% and 57% had exhibited proportional decreases in the reproductive number of up to
one, between one and two, and greater than two orders of magnitude, respectively; 11% had
shown no evidence of change; and 2% had shown evidence of an increase in the reproductive
number by 2007.”
This figure, however, does not show the rebound in malaria in many developing areas that
occurred in the 1980s and 1990s due to a combination of poor policies (e.g., cessation of indoor
spraying of DDT in many countries), development of resistance to drugs and insecticides, and a
deterioration of public health infrastructure in many African countries coincident with a period
during which their economies deteriorated and AIDS was ascendant (Goklany 2007c: 178–181).
Since then, however, matters have, for the most part, been turned around. The Living Proof
Project (2009: 3) reports that not only are malaria cases declining, but it is killing fewer people.
For example, between 2001 and 2006, deaths from malaria declined by 45% in Rwanda, 50% in
Cambodia, 76% in the Philippines, 80% in Eritrea and Zanzibar, and 90% in Sao Tome and
Principe.
7
Figure 3: Changing global malaria endemicity since 1900. (a) Pre-intervention endemicity (approximately 1900). (b) Contemporary endemicity for 2007. (c) Change in endemicity class between 1900 and 2007. Negative values denote a reduction in endemicity, positive values an increase. Source: Gething et al. (2010).
8
Poverty. The proportion of the developing world’s population living in absolute poverty (i.e.,
living on less than $1.25 per day in 2005 dollars) was halved from 52 percent in 1981 to 25
percent in 2005 (World Bank 2010b). In terms of the headcount, over this period the number
of people living in extreme poverty declined from 1,900 million to 1,374 million. The most
spectacular improvements were registered in East Asia and the Pacific, where the headcount
dropped from 1,071 million to 316 million. These numbers indicate that no aggregate loss of
livelihood has occurred, as the UNFCCC (2007: 20) suggests might be occurring due to GW.
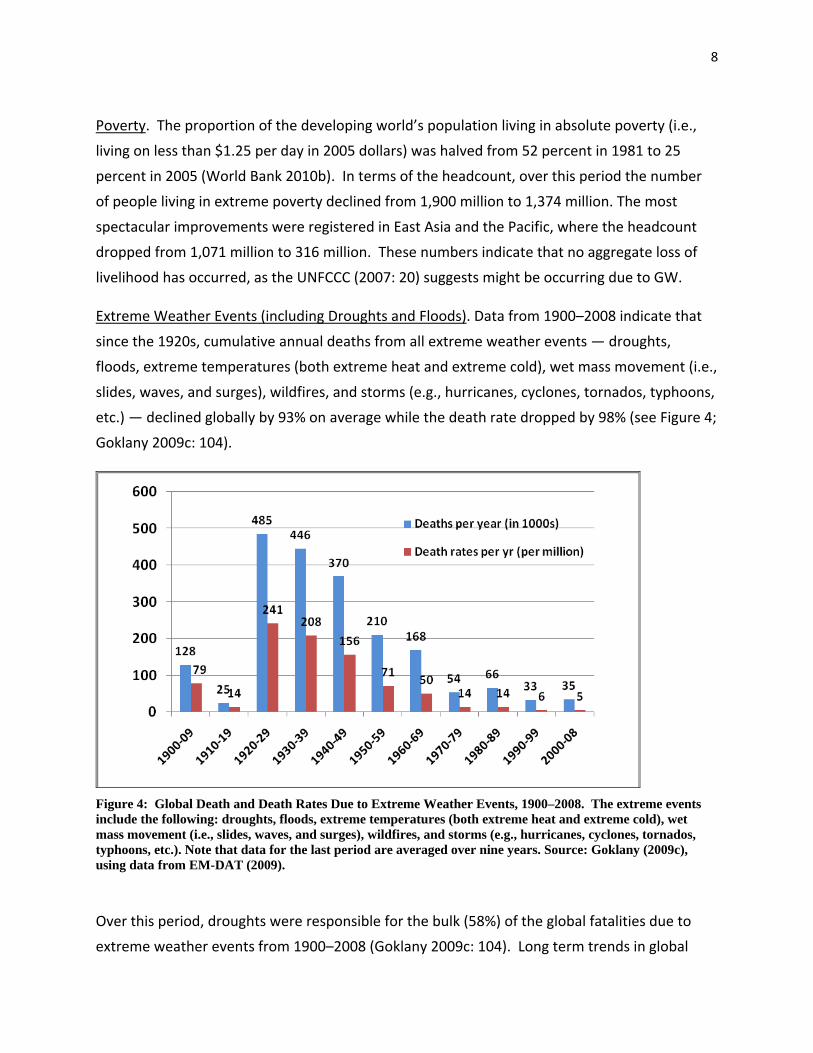
Extreme Weather Events (including Droughts and Floods). Data from 1900–2008 indicate that
since the 1920s, cumulative annual deaths from all extreme weather events — droughts,
floods, extreme temperatures (both extreme heat and extreme cold), wet mass movement (i.e.,
slides, waves, and surges), wildfires, and storms (e.g., hurricanes, cyclones, tornados, typhoons,
etc.) — declined globally by 93% on average while the death rate dropped by 98% (see Figure 4;
Goklany 2009c: 104).
Figure 4: Global Death and Death Rates Due to Extreme Weather Events, 1900–2008. The extreme events include the following: droughts, floods, extreme temperatures (both extreme heat and extreme cold), wet mass movement (i.e., slides, waves, and surges), wildfires, and storms (e.g., hurricanes, cyclones, tornados, typhoons, etc.). Note that data for the last period are averaged over nine years. Source: Goklany (2009c), using data from EM-DAT (2009).
Over this period, droughts were responsible for the bulk (58%) of the global fatalities due to
extreme weather events from 1900–2008 (Goklany 2009c: 104). Long term trends in global
9
deaths and death rates from droughts, however, indicate that they peaked in the 1920s. Since
then they have declined by 99.97% and 99.99%, respectively (Goklany 2009c: 104). From 2000–
2009, according to the EM‐DAT, the International Disaster Database, an average of 116 people
died annually due to drought (EM‐DAT 2010), compared to 472,000 deaths annually from
1920–29 (Goklany 2009c: 104). To place these numbers in context, currently over 58 million
people die each year due to all causes worldwide (WHO 2008). That is, the death toll that
inevitably used to follow in the wake of drought has been reduced almost to the vanishing
point.
With respect to floods, the second most deadly form of extreme weather event, deaths and
death rates crested in the 1930s. By 2000–2008, they were down by 98.7% and 99.6%,
respectively (Goklany 2009c: 104).
Notably, extreme weather events nowadays contribute only 0.06 percent to the global (and
U.S.) mortality burdens in an average year. Remarkably, they have declined even as all‐cause
mortality has increased (Goklany 2009c: 102). This indicates that the world, including the
developing world, is coping better with risks of death from extreme weather events than with
other, larger health risks.
Water Shortages. Not surprisingly, the possibility of water shortages leading to droughts and
hunger are recurring themes in the climate change literature (e.g., Freeman and Guzman: 139).
Droughts, which are a manifestation of severe water shortages, have plagued humanity from
time immemorial, and deaths from droughts are probably the best indicator of the
socioeconomic impact of such water shortages. But, as noted above, they have declined
remarkably in the past century.
Also, to the extent there is a concern that global warming might have reduced access to safe
water, note that between 1990 and 2006 an additional 1.6 billion people gained access to safer
water (UN 2008: 42) as the percentage of global population with such access increased from
75.7% to 86.2%, despite the increase in population and any global warming that may have
occurred (World Bank 2010).
Clearly, the direction of long term empirical trends for aggregate hunger, disease, deaths from
droughts, floods, and extreme weather events, are not consistent with expectations based on
the general narrative regarding the impacts of global warming. Reasons for this might include,
10
first, global warming is not happening. Second, the globe is warming but the agencies
responsible for anthropogenic greenhouse gas emissions are, in fact, directly or indirectly
responsible for reducing climate‐sensitive risks faster than they are being created or
exacerbated. This is manifested as increases in adaptive capacity, which then increases human
well‐being either directly or indirectly. A third possibility is that the narrative is simply based on
false expectations.
For the purposes of this chapter it is immaterial which of these explanations (or combination of
explanations) is correct. The salient fact is that empirical reality does not match claims about
deteriorating human well‐being due to GW.
Fossil Fuels and Long Term Advances in Human Well‐Being
The documented improvements since the start of the Industrial Revolution in virtually every
objective measure of human well‐being — poverty; life expectancy; infant, child and maternal
mortality; prevalence of hunger and malnutrition; child labor; job opportunities for women;
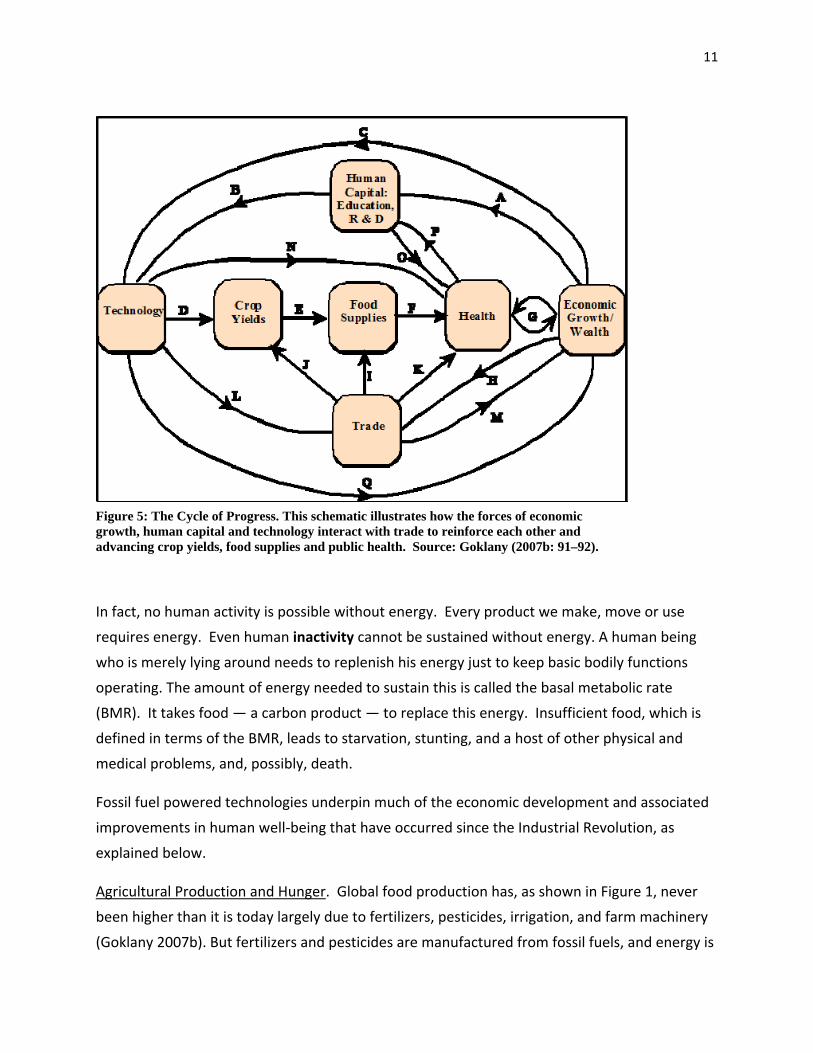
educational attainment; income — can be ascribed to a Cycle of Progress composed of the
mutually reinforcing, co‐evolving forces of economic growth, technological change and freer
trade (see Figure 5; Goklany 2007b). And fossil fuels have been integral to each facet of this
cycle.
Without the energy generated by fossil fuels, economic development would be much lower,
many of the technologies that we take for granted and have come on line since the dawn of
industrialization (e.g., devices that directly or indirectly use electricity or fossil fuels) would have
been stillborn, and the current volume of internal and external trade, upon which the global
economic system depends, would be impossible to sustain. Even trade in services would be
substantially diminished, if not impossible, without energy to generate electricity to power
lights, computers, and telecommunications. But worldwide, fossil fuels are the major source of
electricity.
11
In fact, no human activity is possible without energy. Every product we make, move or use
requires energy. Even human inactivity cannot be sustained without energy. A human being
who is merely lying around needs to replenish his energy just to keep basic bodily functions
operating. The amount of energy needed to sustain this is called the basal metabolic rate
(BMR). It takes food — a carbon product — to replace this energy. Insufficient food, which is
defined in terms of the BMR, leads to starvation, stunting, and a host of other physical and
medical problems, and, possibly, death.
Fossil fuel powered technologies underpin much of the economic development and associated
improvements in human well‐being that have occurred since the Industrial Revolution, as
explained below.
Agricultural Production and Hunger. Global food production has, as shown in Figure 1, never
been higher than it is today largely due to fertilizers, pesticides, irrigation, and farm machinery
(Goklany 2007b). But fertilizers and pesticides are manufactured from fossil fuels, and energy is
Figure 5: The Cycle of Progress. This schematic illustrates how the forces of economic growth, human capital and technology interact with trade to reinforce each other and advancing crop yields, food supplies and public health. Source: Goklany (2007b: 91–92).
12
necessary to run irrigation pumps and machinery.1 This entire suite of energy‐dependent
technologies also enabled the Green Revolution. And in today’s world, willy‐nilly, energy for
the most part means fossil fuels.
The resulting increase in yields and food production helped reduce food prices worldwide
which reduced hunger by making food more affordable (Goklany 2007b). Additional CO2 in the
atmosphere has also contributed to higher yields and food production (IPCC 2001: 254–257,
285) because it provides carbon, the basic building block of life. Yet another factor critical to
reining food prices and reducing hunger worldwide is trade within and between countries
which enables food surpluses to be moved to food deficit areas (Goklany 1995, 1998). But it
takes fossil fuels to move food around in the quantities and the speed necessary for such trade
to be an integral part of the global food system, as it indeed is. Moreover, fossil fuel dependant
technologies such as refrigeration, rapid transport, and plastic packaging, ensure that more of
the crop that is produced is actually consumed. That is, they increase the overall efficiency of
the food production system, which helps lower food prices and contain hunger worldwide.
Habitat Conversion. The increased efficiency of the food and agricultural sector, in addition to
reducing hunger (and its associated detrimental impacts on human well‐being, has also
contained the amount of land under cultivation (Goklany 1998, 2007b). Notably, conversion of
habitat to agricultural uses is the single largest threat to global biodiversity (MEA 2005). Thus,
fossil fuels, directly or indirectly, have also helped conserve nature.
Goklany (2007b: 162) estimates that between 1961 and 2002, greater use of existing and new
agricultural technologies (e.g., pesticides, fertilizers, and farm machinery) — enabled, as we
have seen for the most part, directly or indirectly by fossil fuels — saved over 1,300 million
hectares of habitat from conversion. By comparison, in 2004 the total amount of partly or
wholly protected areas in developing countries was less than 1,000 million hectares. That is,
such technological changes saved more land for the rest of nature than did reserving land for
that purpose.
1 “A much less recognized connection between water and energy are the vast amounts of energy used to treat, distribute, and use water. Water is heavy (1 liter weighs one kilogram), so moving it requires a lot of energy. Energy needs are particularly high for places where water is pumped from very deep wells, or where it is piped over long distances and steep terrain. Additionally, heating water is energy-intensive. In California, for example, 19% of the electricity use, 33% of the non-electricity natural gas, and 33 million gallons of diesel consumption is water-related.” (UN Global Compact 2009, p.4).
13
Health. Having sufficient quantity of food is the first step to a healthy population. It’s not
surprising that hunger and high mortality rates go hand in hand (WHO 2009). In addition, even
the most mundane medical and public health technologies depend on energy, most of which is
derived from fossil fuels. Such technologies include heating for sterilization; pumping water
from water treatment plants to consumers and sewage to treatment plants; and transporting
and storing vaccines, antibiotics, and blood. In addition, energy is necessary to operate a variety
of medical equipment (e.g., x‐rays, electrophoresis, and centrifuges); or undertake a number of
medical procedures. Moreover, economic surpluses generated by greenhouse gas producing
activities in the US and other industrialized countries have helped create technologies to enable
safer drinking water and sanitation; develop solutions and treatments for diseases such as AIDS,
malaria, tuberculosis; and increase life expectancies through vaccinations and improvements in
nutrition and hygiene (Goklany 2007b).
Child Labor. Fossil fuel powered machinery has not only made child labor obsolete in all but the
poorest societies, but it allows children to be children and, equally importantly, to be more
educated in preparation for a more fulfilling and productive life in a technologically more
advanced society (Goklany 2007b).
Equal Opportunity for Women and the Disabled. But for home appliances powered for the
most part by electricity, more women would be toiling in the home. Moreover, power tools and
machinery allow women, the disabled and the weak to work on many tasks that once would
have been reserved, for practical purposes, for able‐bodied men. It also expands their options
for employment and economic advancement. Unfortunately, because of their low energy use,
these benefits are limited in developing countries.
Education. Today’s populations are much more educated and productive than previous ones in
large part due to the availability of relatively cheap fossil fuel generated electrical lighting. And
education is a key factor contributing not only to economic development and technological
innovation but also personal fulfillment (Goklany 2007b).
14
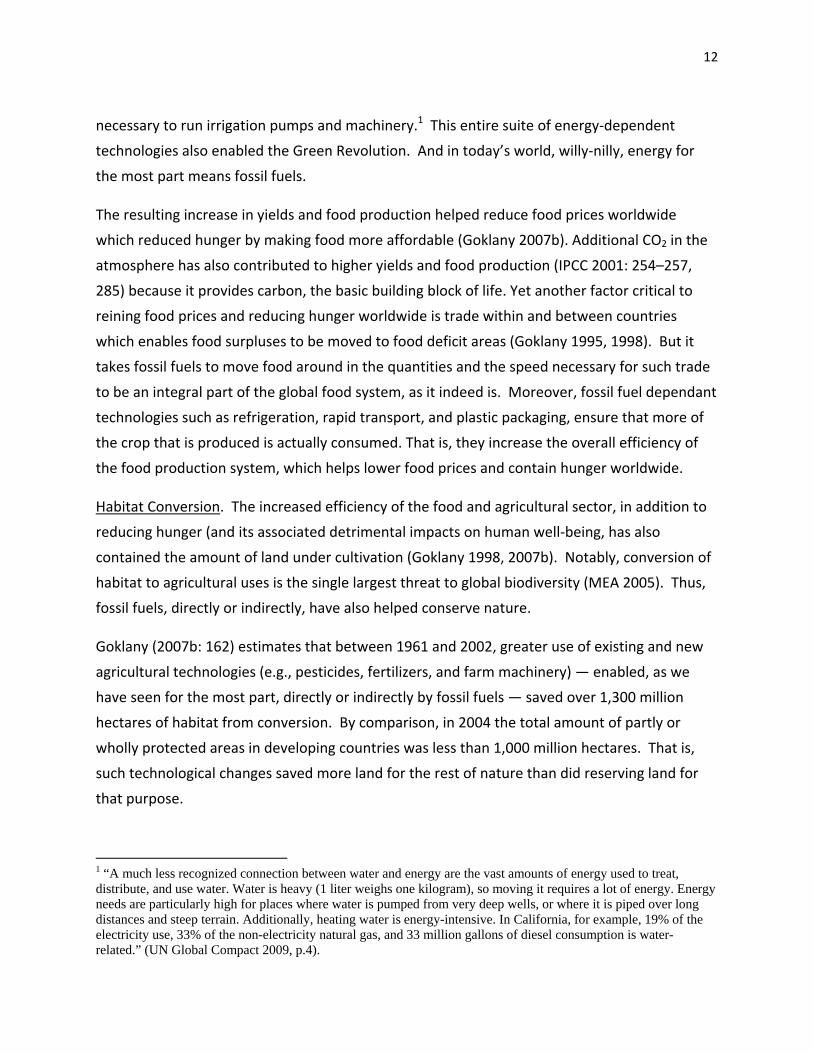
Figure 6: Guinean students study under the lights of the Conakry airport parking lot in June. (Rebecca Blackwell/The Associated Press)
As Figure 6 suggests, easy access to energy for cheap and good lighting helps increases levels of
education and human capital. This, in turn, advances economic and technological development
as well as health outcomes (as indicated by the Cycle of Progress; Figure 5) and the ability to
cope with the impacts of GW.
Poverty. Economic development, powered mainly by fossil fuels, has, as noted, helped halve
the proportion of the developing world’s population living in extreme poverty (World Bank
2009a). A substantial share of their income comes directly or indirectly from trade, tourism,
developmental aid (to the tune of at least $2.3 trillion over the decades; Easterly 2008), and
remittances ($338 billion in 2008 alone; World Bank 2009c) from industrialized countries.
Moreover, it would be impossible to sustain the amount of trade and tourism that occurs today
without fossil fuels. Much of this would have been impossible but for the wealth generated in
industrialized countries by fossil fuel powered economic development.
Ironically, higher food prices, partly because of the diversion of crops to biofuels in response to
climate change policies, helped push 130‐155 million people into extreme poverty in 2008
(World Bank 2009a: xii, 12). This is equivalent to 2.5–3.0% of the developing world’s population.
Although this was not unforeseeable (Goklany 1999: 125), this is one more unintended
15
consequence of global warming policies that were implemented based on perceptions of the
importance of global warming derived from, as shall be shown below, studies that exaggerate
its impacts, as well as poor policy analysis.
Disaster Preparedness and Response, and Humanitarian Aid. Timely preparations and response
are major factors that have contributed to the reduction in death and disease that traditionally
were caused by or accompanied disasters from extreme weather events (Figure 4; Goklany
2009c). Their success hinges on the availability of fossil fuels to move people, food, medicine
and critical humanitarian supplies before and after events strike. Economic development also
allowed the US (and other developed countries) to offer humanitarian aid to developing
countries in times of famine, drought, floods, cyclones, and other natural disasters, weather
related or not. Such aid, too, would have been virtually impossible to deliver in large quantities
or in a timely fashion absent fossil fuel fired transportation.
Future Adaptive Capacity of Developing Countries
As noted, economic development and available technology are two key determinants of
adaptive capacity (Goklany 2007a, 2007b). But economic development is also a fundamental
“driver” of greenhouse gas emissions, the magnitude of any resulting climate change, and its
future impacts. The IPCC’s emissions scenarios all assume substantial economic growth,
especially in developing countries (IPCC 2000). Here I will examine the implications of the
IPCC’s estimates of economic growth on the future adaptive capacity of developing countries. I
will also discuss the effects of secular technological change on adaptive capacity. I will then
analyze whether and how studies of the impacts of GW cited by the latest IPCC assessment
report account for changes in adaptive capacity as both economic development and technology
advance in the future.
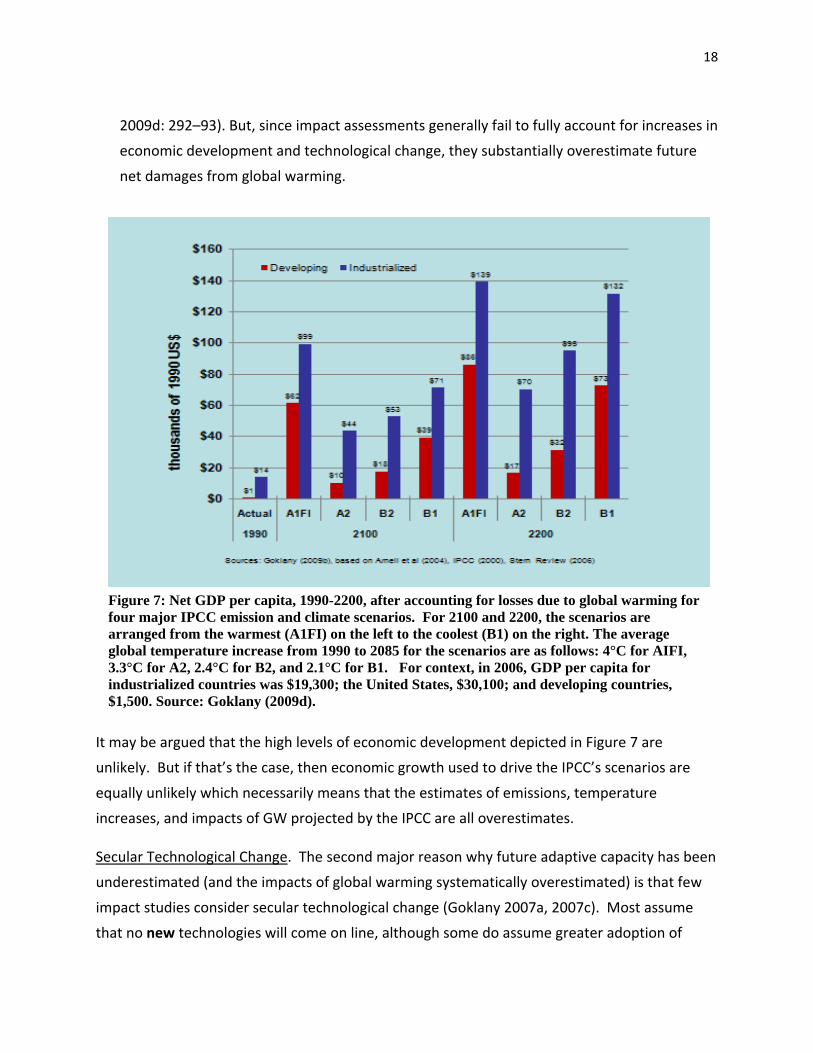
Economic Development. Figure 7, taken from Goklany (2009d), provides estimates of net GDP
per capita — a key determinant of adaptive capacity (Goklany 2007a) — for 1990 (the base year
used by the IPCC’s emissions scenarios), 2100, and 2200 using four IPCC reference scenarios for
areas that comprise today’s developing and industrialized countries. The net GDP per capita is
calculated by subtracting the equivalent costs per capita of global warming from the GDP per
capita in the absence of any warming (that is, the unadjusted GDP per capita).
16
Note that Figure 7 is designed to provide a conservative estimate of the future net GDP per
capita because I intend to show that even under the most conservative assumptions, net GDP
per capita will far exceed today’ levels despite any climate change. Accordingly, I use the Stern
Review’s estimates for the damages (or equivalent losses in GDP) from GW. First, unlike most
other studies, it accounts for losses not only due to market impacts of global warming but also
to non‐market (i.e., environmental and public health) impacts, as well as the risk of catastrophe
(see, e.g., Freeman and Guzman 2009: 127). Second, in order to develop a very conservative
estimate for the future net GDP per capita, I use the Stern Review’s 95th percentile (upper
bound) estimate of the losses in GDP due to global warming even though many economists
believe its central estimates overstate losses due to global warming. As Tol (2008: 9) observes,
“[The Stern Review’s] impact estimates are pessimistic even when compared to other studies in
the gray literature and other estimates that use low discount rates.”
In Figure 7, the net GDP per capita for 1990 is the same as the actual GDP per capita (in 1990 US
dollars, using market exchange rates, per the IPCC’s practice). This assumes that the GDP loss
due to global warming is negligible in 1990, which is consistent with using that as the base year
for estimating changes in globally averaged temperatures (as is the case for impacts studies
that will be employed in the following). For 2100, the unadjusted GDP per capita accounts for
any population and economic growth assumed in the IPCC scenarios from 1990 (the base year)
to 2100. For 2200, the unadjusted GDP per capita is assumed to be double that in 2100, which
is equivalent to a compounded annual growth rate of 0.7%, which is less than the Stern Review
(2006) assumption of 1.3%. This substantially understates the unadjusted and, therefore, the
net GDP per capita in 2200. The costs of global warming are taken from the Stern Review’s 95th
percentile estimates under the “high climate change” scenario, which is equivalent to the IPCC’s
warmest scenario (A1FI) that projects a global temperature increase of 4°C from 1990–2085.
Per the Stern Review, these costs amount to 7.5% of global GDP in 2100 and 35.2% in 2200.
These losses are adjusted downwards for the cooler scenarios per Goklany (2009d).
Figure 7 shows that despite the various assumptions that have been designed to overstate
losses from GW and understate the unadjusted GDP per capita in the absence of any warming:
For populations living in countries currently classified as “developing,” net GDP per
capita will be over 11–65 times higher in 2100 than it was in the base year, even after
accounting for global warming; it will be even higher (18–95 times) in 2200.
17
Net GDP per capita in today’s developing countries will be higher in 2200 than it was in
industrialized countries in the base year (1990) under all scenarios, despite any global
warming. That is, regardless of any global warming, populations living in today’s
developing countries will be better off in the future than people currently inhabiting
today’s industrialized countries. This is also true for 2100 for all but the “poorest” (A2)
scenario.
Under the warmest scenario (A1FI), the scenario that prompts much of the apocalyptic
warnings about global warming, net GDP per capita of inhabitants of developing
countries in 2100 ($61,500) will be double that of the US in 2006 ($30,100), and almost
triple in 2200 ($86,200 versus $30,100). [All dollar estimates are in 1990 US dollars.]
In other words, developing countries will be wealthy by today’s standards, and their
adaptive capacity should be correspondingly higher. Therefore, even if one assumes that
there will be no secular technological change — that is, no new or improved technologies
will become available between the 1990s and 2100 (see below) — developing countries’
adaptive capacity should on average far exceed the US’s today. Therefore, although claims
that developing countries will be unable to cope with future climate change may have been
true for the world of 1990 (the base year), they are simply inconsistent with the
assumptions built into the IPCC scenarios and the Stern Review’s own (exaggerated)
analysis.
Thus, the problems of poverty that warming would exacerbate (e.g., low agricultural
productivity, hunger, malnutrition, malaria and other vector borne diseases) ought to be
reduced if not eliminated by 2100, even if one ignores any secular technological change that
ought to occur in the interim. Tol and Dowlatabadi (2001), for example, show that malaria
has been functionally eliminated in a society whose annual per capita income reaches
$3,100. Therefore, even under the poorest scenario (A2), developing countries should be
free of malaria well before 2100, even assuming no technological change in the interim.
Similarly, if the average net GDP per capita in 2100 for developing countries is $10,000–
$82,000 and technologies become more cost‐effective as they have been doing over the
past several centuries (Goklany 2009b), then their farmers would be able to afford
technologies that are unaffordable today (e.g., precision agriculture) or new technologies
that should come on line by then (e.g., drought resistant seeds) (Goklany 2007b: chapter 9,
18
2009d: 292–93). But, since impact assessments generally fail to fully account for increases in
economic development and technological change, they substantially overestimate future
net damages from global warming.
It may be argued that the high levels of economic development depicted in Figure 7 are
unlikely. But if that’s the case, then economic growth used to drive the IPCC’s scenarios are
equally unlikely which necessarily means that the estimates of emissions, temperature
increases, and impacts of GW projected by the IPCC are all overestimates.
Secular Technological Change. The second major reason why future adaptive capacity has been
underestimated (and the impacts of global warming systematically overestimated) is that few
impact studies consider secular technological change (Goklany 2007a, 2007c). Most assume
that no new technologies will come on line, although some do assume greater adoption of
Figure 7: Net GDP per capita, 1990-2200, after accounting for losses due to global warming for four major IPCC emission and climate scenarios. For 2100 and 2200, the scenarios are arranged from the warmest (A1FI) on the left to the coolest (B1) on the right. The average global temperature increase from 1990 to 2085 for the scenarios are as follows: 4°C for AIFI, 3.3°C for A2, 2.4°C for B2, and 2.1°C for B1. For context, in 2006, GDP per capita for industrialized countries was $19,300; the United States, $30,100; and developing countries, $1,500. Source: Goklany (2009d).
19
existing technologies with higher GDP per capita and, much less frequently, a modest generic
improvement in productivity (Parry et al. 2004).
Current Practice in Impacts Models to Account for Changes in Future Adaptive Capacity. It is
possible to obtain an idea of whether, how and the extent to which impacts assessments used
in the IPCC’s latest assessment report account for changes in adaptive capacity over time
through an examination of the suite of studies that comprise the so‐called Fast Track
Assessments (FTAs) of the global impacts of climate change. These British government
sponsored FTAs, which were state‐of‐the‐art at the time of the writing of the IPCC’s Fourth
Assessment Report (AR4WG2), have an impeccable provenance from the point of view of
proponents of greenhouse gas controls. Many of the FTA authors were major contributors to
the IPCC’s Third and Fourth Assessments (IPCC 2001, 2007). For instance, the lead author of the
FTA’s hunger assessments (Parry et al. 1999, 2004), Professor Martin Parry, was the co‐chair of
IPCC Work Group 2 during its latest (2007) assessment. Similarly, the authors of the FTA’s water
resources and coastal flooding studies were also lead authors of corresponding chapters in the
same IPCC Fourth Assessment Report.
A dissection of the FTA methodologies shows that:
The water resources study (Arnell 2004) totally ignores adaptation, despite the fact that
many adaptations to water related problems, e.g., building dams, reservoirs, and canals,
are among mankind’s oldest adaptations, and do not depend on the development of
any new technologies (Goklany 2007c: 1034–35).
The study of agricultural productivity and hunger (Parry et al. 2004) allows for increases
in crop yield with economic growth due to greater usage of fertilizer and irrigation in
richer countries, decreases in hunger due to economic growth, some secular (time‐
dependent) increase in agricultural productivity, as well as some farm level adaptations
to deal with climate change. But these adaptations are based on 1990s technologies,
rather than technologies that would be available in the future or any technologies
developed to specifically cope with the negative impacts of global warming or take
advantage of any positive outcomes (Parry et al., 2004: 57; Goklany 2007c: 1032–33).
However, the potential for future technologies to cope with climate change is large,
especially if one considers bioengineered crops and precision agriculture (Goklany
2007b, 2007c).
20
Nicholls (2004) study on coastal flooding from sea level rise takes some pains to
incorporate improvements in adaptive capacity due to increasing wealth. But it makes a
number of questionable assumptions. First, it allows societies to implement measures to
reduce the risk of coastal flooding in response to 1990 surge conditions, but not to
subsequent sea level rise (Nicholls, 2004: 74). But this is illogical. One should expect that
any measures that are implemented would consider the latest available data and
information on the surge situation at the time the measures are initiated. That is, if the
measure is initiated in, say, 2050, the measure’s design would at least consider sea level
and sea level trends as of 2050, rather than merely the 1990 level. By that time, we
should know the rate of sea level rise with much greater confidence. Second, Nicholls
(2004) also allows for a constant lag time between initiating protection and sea level
rise. But one should expect that if sea level continues to rise, the lag time between
upgrading protection standards and higher GDP per capita will be reduced over time,
and may even turn negative. That is, the further we go into the future, the more likely
that adaptations would be anticipatory rather than reactive, particularly, as societies get
more affluent (as indicated by Figure 7). Fourth, Nicholls (2004) does not allow for any
deceleration in the preferential migration of the population to coastal areas, as might be
likely if coastal storms and flooding becomes more frequent and costly (Goklany 2007b:
1036–37).
The analysis for malaria undertaken by van Lieshout et al. (2004) includes adaptive
capacity as it existed in 1990, but does not adjust it to account for any subsequent
advances in economic and technological development. There is simply no justification
for such an assumption. If the IPCC’s assumptions about future economic development
are even half right, it is, as already noted, likely that malaria will have been eliminated
by 2100.
Overestimation of Impacts from Underestimation of Future Adaptive Capacity. So how much of
a difference in impact would consideration of both economic development and technological
change have made?
If impacts were to be estimated for 5 or so years into the future, ignoring changes in adaptive
capacity between now and then probably would not be fatal because neither economic
development nor technological change would likely advance substantially during that period.
21
However, the time horizon of climate change impact assessments is often on the order of 35–
100 years or more. The Fast Track Assessments use a base year of 1990 to estimate impacts for
2025, 2055 and 2085 (Parry 2004). The Stern Review’s time horizon extends out to 2100–2200
and beyond (Stern Review 2006). Over such periods one ought to expect substantial advances
in the levels of economic development, technological change and human capital.
Retrospective assessments indicate that over the span of a few decades, changes in economic
development and technologies can substantially reduce adverse environmental impacts and
improve human well‐being as measured by a variety of objective indicators (Goklany 2007b,
2009b). For example, due to a combination of greater wealth and secular technological change,
U.S. death rates due to various climate‐sensitive water‐related diseases — dysentery, typhoid,
paratyphoid, other gastrointestinal disease, and malaria —declined by 99.6 to 100.0 percent
over a span of 70 years from 1900 to 1970 (Goklany 2009b). Similarly, as shown in Figure 4,
average annual global mortality and mortality rates from extreme weather events have
declined by 93–98 percent since the 1920s (Goklany 2009c), a period of almost ninety years.
Thus, not fully accounting for changes in the level of economic development and secular
technological change would understate future adaptive capacity which then could overstate
impacts by one or more orders of magnitude if the time horizon is several decades into the
future.
The assumption that there would be little or no improved or new technologies that would
become available between 1990 and 2100 (or 2200), as assumed in most climate change impact
assessments, is clearly naïve. In fact, a comparison of today’s world against the world of 1990
(the base year used in most impacts studies to date) shows that even for this brief 20‐year
span, this assumption is invalid for many, if not most, human enterprises.
It should be noted that some of the newer impacts assessments have begun to account for
changes in adaptive capacity. For example, Yohe et al. (2006), in an exercise exploring the
vulnerability to climate change under various climate change scenarios, allowed adaptive
capacity to increase between the present and 2050 and 2100. However, they arbitrarily limited
any increase in adaptive capacity to “either the current global mean or to a value that is 25%
higher than the current value – whichever is higher” (Yohe et al. 2006: 4). Such a limitation
would miss most of the increase in adaptive capacity implied by Figure 7.
22
More recently, Tol et al. (2007)’s analyzed the sensitivity of deaths from malaria, diarrhea,
schistosomiasis, and dengue deaths to warming, economic development and other
determinants of adaptive capacity through the year 2100. Their results indicate,
unsurprisingly, that consideration of economic development alone could reduce mortality
substantially. For malaria, for instance, deaths would be eliminated before 2100 in a number of
the more affluent Sub Saharan countries (Tol et al. 2007: 702). This is a much more realistic
assessment of the impact of GW on malaria in a wealthier and more technologically advanced
world, and one which is more consistent with long term trends regarding the extent of malaria,
as shown in Figure 3 than the estimates provided by the Fast Track Assessments.
Finally, it should be noted that it is precisely the failure to account for the combination of
economic and technological development that caused high profile prognostications such as
Malthus’s original conjecture about running out of cropland, The Limits to Growth, and The
Population Bomb, to fizzle (Goklany 2009b).
Global Warming and Development
Although the IPCC notes that sustainable development “can reduce vulnerability to climate
change, and climate change could impede nations’ abilities to achieve sustainable development
pathways” (IPCC 2007: 20), many proponents of greenhouse gas controls on the other hand,
dwell on the latter (downside) aspect of economic development while generally ignoring the
upside (e.g., Freeman and Guzman 2009). Here I will examine whether global warming hinders
sustainable development or whether sustainable development makes it easier to cope with
warming, and which effect, if any, is predominant?
It is possible to answer these questions using results from the previously‐discussed British‐
government sponsored “Fast Track Assessments” (FTAs) of the global impacts of global
warming (Parry et al. 2004; Arnell et al. 2002, 2004). The FTAs provide estimates of the
contribution of global warming to the total populations‐at‐risk of malaria, hunger, and coastal
flooding due to sea level rise for 2085. Goklany (2009a, 2009d), while recognizing that,
realistically, 2085 is beyond the period that is reasonably foreseeable, converted these
estimates of populations‐at‐ risk into mortality by comparing historical mortality estimates from
23
the World Health Organization (for 1990, the base year) against FTA estimates of populations‐
at‐risk for that year.
The results indicate that under the IPCC’s warmest (A1FI) scenario, which gives an increase in
average global temperatures of 4°C between 1990 and 2085, global warming would contribute
no more than 13% of the total mortality from malaria,2 hunger and coastal flooding in 2085
(Goklany 2009a: 71). The remaining 87% or more is due to non‐global warming related factors.
However, had improvements in adaptive capacity been appropriately accounted for, the 87%
contribution from the latter would have been much smaller, but then so would have the 13%
share attributed to global warming (probably by a like amount).
FTA results also indicate that:
By 2085, global warming would reduce the global population at risk of water shortages,
although some areas would see increases (Arnell 2004; see Goklany 2009a: 72–74).3
This finding is contrary to the erroneous impression conveyed by the IPCC’s AR4’s Work
Group II Summary for Policy Makers (IPCC 2007) because that summary emphasizes the
number of people that may experience an increase in water shortage but neglects to
provide corresponding estimates for the number that would see a reduction in water
shortage (Goklany 2007, 2009). However, the finding that the net population
experiencing water shortage would be reduced is consistent with other studies of the
global impact of global warming on water resources (Oki and Kanae 2006). Remarkably,
this result is obtained despite the fact that Arnell (2004) does not allow for any
adaptation and, consequently, advances in adaptive capacity that should logically occur
under the IPCC scenarios!
Partly due to increases in net primary productivity because of CO2 fertilization, the
amount of habitat devoted to cropland would be halved by global warming under the
A1FI scenario, at least through 2100 (Goklany 2007b). Since diversion of habitat to
cropland is perhaps the single largest threat to species and ecosystems (Goklany 1998;
MEA 2005), this means that global warming could actually reduce pressures on
biodiversity (Goklany 1998; 2005).
2 As noted, malaria accounts for a disproportionately large share of the global burden of vector-borne disease, 3 This information is not readily apparent from the abstract in Arnell (2004), but see Goklany (2009a, pp. 72-74) and Oki and Kanae (2006).
24
Thus, at least through 2085–2100, GW may relieve some of the problems that some developing
countries face currently (e.g., water shortage and habitat loss), while in other instances, the
contribution of GW to the overall problem (e.g., cumulative mortality from malaria, hunger and
coastal flooding) would be substantially smaller than that of non‐GW related factors. Notably,
economic development, one of the fundamental drivers of GW, would reduce mortality
problems regardless of whether they are due to GW or non‐GW related factors. Hence, lack of
economic development would be a greater problem than global warming, at least through
2085–2100. This is consistent with Figure 7, which shows that notwithstanding global warming
and despite egregiously overestimating the negative consequences of global warming, future
net GDP per capita will be much higher than it is today under each scenario through at least
2200.
Note that Figure 7 also shows that through 2200, notwithstanding global warming, net GDP per
capita will be highest under the warmest scenario, and lowest under the poorest scenario (A2).
This suggests that if humanity has a choice of which development path it takes, it ought to
strive to take the scenario that has the highest economic growth, whether or not that
exacerbates global warming (Goklany 2007c). The additional economic development would
more than offset the cost of any warming.
No less important, it is far cheaper for the world to advance economic development than
mitigate climate change by a meaningful amount (Goklany 2003, 2005, 2009d). This is
consistent with the Tol et al. (2007) analysis of various climate‐sensitive infectious diseases.
That analysis suggests that
“[D]eaths will first increase, because of population growth and climate change, but
then fall, because of development … As climate can only be changed with a substantial
delay, development is the preferred strategy to reduce infectious diseases even if they
are exacerbated by climate change. Development can … increase the capacity to cope
with projected increases in infectious diseases over the medium to long term.”
Thus, it is most unlikely that under the IPCC’s warmest scenario, global warming will overwhelm
economic development in developing countries, notwithstanding the Stern Review’s upper
bound damage estimates. Second, economic development should be given priority over
reducing greenhouse gas emissions. It would enable developing countries to cope not only with
25
any negative impacts of climate change, but more importantly, other larger problems that they
will face (Goklany 2005, 2007b).
Which is Deadlier — Global warming or Global Warming Policies?
Among the policy responses to the perceived threat of climate change are subsidies and
mandates for the production and use of biofuels, including ethanol and biodiesel. As already
noted, this has helped fuel an increase in food prices which, in turn, has increased the
population suffering from chronic hunger (FAO 2009a). It has also added to the number of
people living in “absolute poverty” worldwide, particularly in developing countries (World Bank
2009a).
A World Bank Policy Research working paper estimates that the number of people living in
absolute poverty, i.e., the “poverty headcount”, in developing countries would decline from
1,208 million in 2005 to 798 million in 2010 because of economic development (De Hoyos and
Medvedev 2009). But it also estimates that higher food prices induced by biofuel production
would drive an additional 32 million into absolute poverty in 2010.
Assuming proportionality between the headcount for absolute poverty on one hand, and death
and disease in developing countries due to poverty‐related diseases on the other hand per the
World Health Organization (2009) analysis of global health risks, Goklany (in preparation)
estimates that the increase in the poverty headcount in 2010 due to biofuel demand would
translate into 192,000 additional deaths and 6.7 million additional lost DALYs in 2010 alone.
By contrast, WHO (2009) “attributes” 141,000 deaths and 5.4 million lost DALYs in 2004 to GW.
Moreover, death and disease due to poverty is real whereas death and disease attributed to
global warming is hypothetical and, according to the researchers who developed those
estimates, based on unverified models and scientific short cuts (McMichael et al. 2004: 1546; se
also Goklany 2009a: 70). Thus, biofuel policies motivated, in part, by the desire to mitigate
global warming may be responsible for more death and disease than climate change itself.
Summary
26
Despite claims that GW will reduce human well‐being in developing countries, there is no
evidence that this is actually happening. Empirical trends show that by any objective climate‐
sensitive measure, their human well‐being has, in fact, improved remarkably over the last
several decades. Specifically, their agricultural productivity has increased; the proportion of
their population suffering from chronic hunger has declined; the rate of extreme poverty has
been more than halved; rates of death and disease from malaria, other vector‐borne diseases,
and extreme weather events have declined; and, consequently, life expectancy has more than
doubled since 1900.
And while economic growth and technological development fueled mainly by fossil fuels may
be responsible for an (undetermined) portion of GW experienced this century, they are largely
responsible for the above noted improvements in human well‐being in developing countries
(and elsewhere). The fact that these improvements occurred despite any GW indicates that
economic and technological development has been, overall, a benefit to developing countries. .
Recently, however, we have seen an upturn in the rate of hunger, but this is due not to GW but,
in part, to GW policies, in particular, policies to stimulate the production and use of biofuels in
lieu of fossil fuels. These policies diverted crops away from food to fuel production, which
increased food prices and, therefore, hunger worldwide. That, in turn, also pushed a greater
share of the population of developing countries into extreme poverty. Although this biofuel
production‐induced increase in extreme poverty is significantly less than the reduction in
poverty from economic development, it increases the toll from diseases of poverty, which are
among the major causes of death and disease in developing countries.
Using estimates of death and disease per million people in extreme poverty derived from
studies from the World Health Organization and the World Bank indicates that the increase in
extreme poverty in 2010 due to biofuel production may result in 192,000 deaths and 6.7 million
lost DALYs. By comparison, a WHO study attributed 141,000 deaths and 5.4 million lost DALYs
to GW (out of 59 million deaths and 795 million lost DALYs worldwide from all causes). Thus
GW policies may be more deadly than GW itself.
It is often argued that unless greenhouse gases are reduced forthwith, the resulting GW could
have severe, if not catastrophic, consequences for developing countries because they lack the
economic and human resources to cope with GW’s consequences. But there are two major
problems with this argument. First, although developing countries’ adaptive capacity is low
27
today, it does not follow that their ability to cope will be low forever. In fact, under the IPCC’s
warmest scenario, which would increase globally averaged temperature by 4°C relative to 1990,
net GDP per capita in developing countries (after accounting for losses due to climate change
per the Stern Review’s exaggerated estimates) will be double the US’s 2006 level in 2100, and
triple that in 2200. Thus developing countries should in the future be able to cope with climate
change substantially better than the US today. But these advances in adaptive capacity, which
are virtually ignored by most assessments of the impacts and damages from global warming,
are the inevitable consequence of the assumptions built into the IPCC’s emissions scenarios.
Hence the notion that developing countries will be unable to cope with GW does not square
with the basic assumptions that underpin the magnitude of emissions, global warming and its
projected impacts under the IPCC scenarios.
Second, GW would not create new problems; rather it would exacerbate some existing
problems of poverty (e.g., hunger, malaria, extreme events), while relieving others (e.g., habitat
loss and water shortages in some places). One approach to deal with the consequences of GW
is to reduce greenhouse gas emissions. That would, however, reduce all GW impacts, whether
they are good (e.g., net reduction in the global population at risk of water shortage or in the
habitat use for cultivation) or bad (e.g., arguably increased levels of malaria or hunger). And
even where GW provides no benefits, reducing emissions would at best only reduce GW’s
contribution to the problem, but not the whole problem since non‐GW factors are also
contributors (Goklany 2005). With respect to mortality from hunger, malaria and extreme
events, for example, GW only contributes 13% of the problem in 2085 (which is beyond the
foreseeable future).
Another approach to reducing the GW impacts would be to reduce the climate‐sensitive
problems of poverty through focused adaptation (Goklany 1995, 2005, 2009e). Focused
adaptation would allow society to capture the benefits of GW while allowing it to reduce the
totality of climate‐sensitive problems that GW might worsen. For mortality from hunger,
malaria and extreme events, for instance, focused adaptation could through the foreseeable
future, address 100% of the problem whereas emission reductions would at most deal with
only 13%.
Yet another approach would be to address the root cause of why developing countries are
deemed to be most‐at‐risk, namely, they are poor. But to reduce poverty, we need sustainable
28
economic growth. This would not only address the climate‐sensitive problems of poverty but
all problems of poverty, and not just that portion caused by GW. It would, moreover, reduce
these problems faster and more cost‐effectively. No less important, it is far more certain that
sustainable economic growth will provide real benefits than would emission reductions because
although there is no doubt that poverty leads to death, disease, and other problems, there is
substantial doubt regarding the reality and magnitude of the negative impacts of GW, especially
since they ignore, for the most part, improvements in adaptive capacity. To summarize, of the
three approaches outlined above, human well‐being in developing countries is most likely to be
advanced farthest by sustainable economic development and to be advanced least by emission
reductions (Goklany 2009e). In addition, because of the inertia of the climate system, economic
development is likely to bear fruit faster than any emission reductions.
This conclusion is consistent with Figure 7, which shows that despite exaggerating the negative
consequences of global warming, net GDP per capita, a surrogate for human well‐being, is
highest under the richest‐but‐warmest scenario and lowest under the poorest scenario. Thus
developing countries should focus on becoming wealthier. The wealthier they are the better
able they will be to cope not only with the urgent problems they face today and will face in the
future, but any additional problems brought about by GW, if and when they occur.
References
Arnell, N.W. (2004). Climate change and global water resources: SRES emissions and socio‐economic scenarios. Global Environmental Change 14 (1): 31‐52.
Arnell, N.W., Cannell, M.G.R., Hulme, M., Kovats, R.S., Mitchell, J.F.B., Nicholls, R.J., Parry, M.L., Livermore, M.T.J., White, A. (2002). The consequences of CO2 stabilization for the impacts of climate change. Climatic Change 53: 413‐446.
De Hoyos, R.E., Medvedev, D. (2009). Poverty Effects of Higher Food Prices: A Global Perspective. World Bank Policy Research Working Paper 4887. Washington, DC: World Bank. 32 pp.
Easterly, William (2008). Easterly on Growth, Poverty, and Aid. Library of Economics and Liberty. http://www.econtalk.org/archives/2008/02/easterly_on_gro.html. Visited 29 November 2009.
EM‐DAT (2009). The OFDA/CRED International Disaster Database. Université Catholique de Louvain, Brussels, Belgium. Available at http://www.em‐dat.net. Data downloaded on August 24 2009.
EM‐DAT (2010). The OFDA/CRED International Disaster Database. Université Catholique de Louvain, Brussels, Belgium. Available at http://www.em‐dat.net. Data downloaded on 22 May 2010
FAO (2008a). The State of Food and Agriculture 2008. Rome: FAO. 128 pp.
FAO (2008b). State of Food Insecurity 2008. Rome: FAO. 56 pp.
29
FAO (2009a). State of Food Insecurity 2009. Rome: FAO. 57 pp.
FAO (2009b). http://www.fao.org/economic/es‐policybriefs/multimedia0/presentation‐the‐state‐of‐food‐insecurity/en/
FAO (2010a). FAOSTAT. Available at http://faostat.fao.org/default.aspx, visited 9 May 2010.
FAO (2010b). Food Price Indices. Available: http://www.fao.org/worldfoodsituation/FoodPricesIndex/en/, visited 6 March 2010.
Freeman, Jody; and Guzman, Andrew (2009). Climate Change & U.S. Interests. Version 3.1, dated 09/13/2009.
Gething, P.W., Smith, D.L., Patil, A.P., Tatem, A.J., Snow, R.W., and Hay, S.I. (2010). Climate change and the global malaria recession. Nature 465: 342–345.
Global Humanitarian Forum (2009). Key Points on Climate Justice. Working Paper, Geneva GHF.
Godfray, H.C.J., J.R. Beddington, I.R. Crute, L. Haddad, D. Lawrence, J.F. Muir, et al. (2010). Food Security: The Challenge of Feeding 9 Billion People. Science 327, 812.
Goklany, I.M. (1995). Strategies to Enhance Adaptability: Technological Change, Economic Growth and Free Trade. Climatic Change 30: 427‐449.
Goklany, I.M. (1998). Saving Habitat and Conserving Biodiversity on a Crowded Planet. BioScience 48: 941‐953.
Goklany, I.M. (1999). Meeting Global Food Needs: The Environmental Trade‐offs Between Increasing Land Conversion and Land Productivity. Technology 6: 107‐130.
Goklany, I.M. (2000). Potential Consequences of Increasing Atmospheric CO2 Concentration Compared to Other Environmental Problems. Technology 7S: 189‐213.
Goklany, I.M. (2005). A Climate Policy for the Short and Medium Term: Stabilization or Adaptation? Energy & Environment 16: 667‐680.
Goklany, I.M. (2007a). Integrated Strategies to Reduce Vulnerability and Advance Adaptation, Mitigation, and Sustainable Development. Mitigation and Adaption Strategies for Global Change DOI 10.1007/s11027‐007‐9098‐1.
Goklany, I.M. (2007b). The Improving State of the World. Washington, DC: Cato Institute, p. 25.
Goklany, I.M. (2007c). Is a Richer‐but‐warmer World Better than Poorer‐but‐cooler Worlds? Energy & Environment 18 (7 and 8): 1023‐1048.
Goklany, I.M. (2009a). Global public health: Global warming in perspective. Journal of American Physicians and Surgeons 14(3): 69‐75.
Goklany, I.M. (2009b). Have increases in population, affluence and technology worsened human and environmental well‐being? Electronic Journal of Sustainable Development 1(3). Available: http://www.ejsd.org/docs/HAVE_INCREASES_IN_POPULATION_AFFLUENCE_AND_TECHNOLOGY_WORSENED_HUMAN_AND_ENVIRONMENTAL_WELL‐BEING.pdf.
Goklany, I.M. (2009c). Deaths and Death Rates from Extreme Weather Events: 1900‐2008. Journal of American Physicians and Surgeons 14 (4): 102–09.
Goklany, I.M. (2009d). Discounting the Future. Regulation 32 (Spring): 36‐40.
Goklany, I.M. (2009d). Is Climate Change the "Defining Challenge of Our Age"? Energy & Environment 20(3): 279‐302.
IPCC [Intergovernmental Panel on Climate Change] (2000). Special Report on Emissions Scenarios. New York: Cambridge University Press.
IPCC (2001). Climate change 2001. Impacts, adaptation, and vulnerability. Cambridge University Press.
30
IPCC (2007). Climate change 2007. Impacts, adaptation, and vulnerability. Cambridge University Press.
Lancet and University College London Institute for Global Health Commission (The Lancet Commission). (2009). Managing the health effects of climate change. Lancet 373: 1693‐1733.
Living Proof Project (2009). Progress Against Malaria: Winning the Fight Against a Deadly Disease. Available at www.livingproofproject.com.
McMichael, A.J., et al. (2004). Global Climate Change. In Comparative Quantification of Health Risks: Global and Regional Burden of Disease due to Selected Major Risk Factors. Geneva: World Health Organization, 2004: 1543–1649.
Millennium Ecosystem Assessment [MEA] (2005). Millennium Ecosystem Assessment Synthesis Report. Pre‐publication Final Draft, approved by MA Board on March 23, 2005. On file with author.
Nicholls, R.J. (2004). Coastal flooding and wetland loss in the 21st century: changes under the SRES climate and socio‐economic scenarios. Global Environmental Change 14 (1): 69‐86.
Oki, T., Kanae, S. (2006). Global hydrological cycles and world water resources. Science 313: 1068‐1072.
Parry, M., Rosenzweig, C., Iglesias, A., Fischer, G., Livermore, M. (1999). Climate change and world food security: a new assessment. Global Environmental Change 9: S51–S67.
Parry, M.L., ed. (2004). Special issue: an assessment of the global effects of climate change under SRES emissions and socio‐economic scenarios. Global Environ Change 14: 1‐99.
Parry, M.L., Rosenzweig, C., Iglesias, I., Livermore, M., and Fischer, G. (2004). Effects of climate change on global food production under SRES emissions and socio‐economic scenarios. Global Environ Change 14 (1): 53–67.
Stern Review (2006). The Economics of Climate Change.
Tol, R.S.J., Dowlatabadi, H. (2001). Vector borne diseases, development & climate change. Integrated Assessment 2: 173‐181.
Tol, R.S.J., Ebi,K.L., and Yohe, G.W. (2007). Infectious Disease, Development, and Climate Change: A Scenario Analysis. Environment and Development Economics 12: 687‐706.
Tol, Richard S. J. (2008). The Social Cost of Carbon: Trends, Outliers and Catastrophes. Economics: The Open‐Access, Open‐Assessment E‐Journal, Vol. 2, 2008‐25. Available at http://www.economics‐ejournal.org/economics/journalarticles/2008‐25
UN Global Compact and Pacific Institute (2009). Climate Change and the Global Water Crisis: What Businesses Need to Know and Do. Available at http://www.unglobalcompact.org/docs/issues_doc/Environment/ceo_water_mandate/UNGC‐PI_climate‐water_whitepaper_FINAL.pdf
UNEP [United Nations Environment Programme] (1993). Climate change and North‐South relations. Climate change fact sheet 109. UNEP, May 1, 1993. Available at http://unfccc.int/resource/ccsites/senegal/fact/fs109.htm. Visited May 12, 2003.
United Nations (2008). Millennium Development Goals Report 2008. United Nations, New York.
[UNFCCC] United Nations Framework Convention on Climate Change (2007). Climate Change: Impacts, Vulnerabilities and Adaptation in Developing Countries (Bonn, UNFCCC).
University College London Institute for Global Health and Lancet Commission (2009). Managing the health effects of climate change. Lancet 373: 1693‐1733.
USDA (2010). World Agricultural Supply and Demand Estimates, WASDE‐ 480, 10 March 2010. Available: http://www.usda.gov/oce/commodity/wasde/latest.txt. Accessed 18 March 2010.
31
Van Lieshout, M., Kovats, R.S., Livermore, M.T.J., and Marten, P. (2004). Climate change and malaria: analysis of the SRES climate and socio‐economic scenarios. Global Environmental Change 14 (1): 87‐99.
WHO (2008). Climate change and health: resolution of the 61st World Health Assembly, May 24, 2008. Available: http://www.who.int/globalchange/A61_R19_en.pdf. Accessed 20 February 2010.
WHO (2008). Global Burden of Disease and Risk Factors: 2004 Update
WHO (2009). Global Health Risks: Mortality and Burden of Disease Attributable to Selected Major Risks (WHO, Geneva). Available at http://www.who.int/healthinfo/global_burden_disease/global_health_risks/en/index.html.
WHO (2009). Global health risks: mortality and burden of disease attributable to selected major risks. Available: http://www.who.int/healthinfo/global_burden_disease/global_health_risks/en/index.html. Accessed 19 November 2009.
WHO (2010). World Health Day Home Page. Available: http://www.who.int/world‐health‐day/en/index.html. Accessed 17 February 2010.
World Bank (2009a). Global Economic Prospects 2009. Available: http://siteresources.worldbank.org/INTGEP2009/Resources/10363_WebPDF‐w47.pdf. Accessed 6 March 2010.
World Bank (2009a). World Development Indicators 2009.
World Bank (2009c). Migration and Development Brief 11: A better‐than‐expected outcome for migration and remittance flows in 2009, but significant risks ahead. November 3, 2009. Available at http://siteresources.worldbank.org/INTPROSPECTS/Resources/334934‐1110315015165/MigrationAndDevelopmentBrief11.pdf.
World Bank (2010). World Bank Data Search, available at http://search.worldbank.org/data?qterm=mdgs+safe+water&language=EN&format=html, visited 5 May 2010.
World Bank (2010a). World Development Indicators, available at http://ddp‐ext.worldbank.org/ext/DDPQQ/member.do?method=getMembers&userid=1&queryId=135.
World Bank (2010b). PovCalNet, available at http://iresearch.worldbank.org/PovcalNet/povDuplic.html, visited 28 May 2010.
World Health Organization (2008). Global malaria control and elimination : report of a technical review. Geneva: WHO: 21‐24.
Yohe, Gary, Elizabeth Malone, Antoinette Brenkert, Michael Schlesinger, Henk Meijd , Xiaoshi Xinge, Daniel Lee. (2006). A Synthetic Assessment of the Global Distribution of Vulnerability to Climate Change from the IPCC Perspective that Reflects Exposure and Adaptive Capacity. CIESIN, Columbia University. http://sedac.ciesin.columbia.edu/mva/ccv/.


![[Indur Goklany] the Improving State of the World(BookFi.org)](https://img.pdfslide.net/doc/110x75/55cf9732550346d033903140/indur-goklany-the-improving-state-of-the-worldbookfiorg.jpg)