Embed Size (px)
Citation preview

REPORT ON
REGIONAL ECONOMIC DEVELOPMENTS IN THE
PHILIPPINES
2017
Department of Economic ResearchRegional Operations Sub‐Sector

i
Contents
Executive Summary ii
Foreword iv
BSP Regional Offices and Branches v
Philippines: Regional Composition vi
Key Regional Developments 1
Real Sector: Gross Regional Domestic Product (GRDP) 1 Agriculture, Livestock, Poultry and Fishery 3
Construction 11
Labor and Employment 14
Box Article: Poverty Incidence & Unemployment
Trends in the Regions 16
Fiscal Sector: Receipts and Expenditures of LGUs 20
Monetary Sector: Inflation 21
External Sector: Approved Foreign Investments 22
Financial Sector: Banking and Microfinance 24
Opportunities and Challenges 27
Conclusion 69
Statistical Annexes

ii
Executive Summary
The Philippine economy continued its solid growth track, posting a 6.7 percent gross domestic
product (GDP) expansion in 2017, within the growth target range of the national government
(NG) of 6.5 percent to 7.5 percent. All regions exhibited positive performance in 2017, led by
CAR, Davao Region, Western Visayas, SOCCSKSARGEN, ARMM, Cagayan Valley, CALABARZON,
MIMAROPA and Caraga.
Growth in the regions has been broad‐based and benefited largely from the remarkable
improvement in the agriculture sector. Favorable weather conditions and sufficient water
supply supported strong yields of major crops. Palay and corn production grew by 16.2
percent and 9.6 percent in 2017, from previous year’s contraction of 4.5 percent and 4.0
percent, respectively. Swine and fish production grew, albeit, at a slower pace while chicken
production rose amid high demand for poultry products in Eastern and Central Visayas,
Zamboanga Peninsula and Caraga regions. However, cattle production contracted in 2017
due to typhoon damage, incidence of animal deaths, less stocks available, and unfavorable
market prices, among others.
In the industry sector, construction activity weakened in 2017. The number of approved
building permits and construction of new residential buildings declined by 5.0 percent and 9.4
percent, respectively, during the year. The decline in construction activity was most apparent
in Negros Island Region and Central Visayas. Weather‐related concerns (e.g., frequent
typhoons and seismic movements) were cited as major drawbacks to infrastructure activities.
In the financial services sector, aggregate credit activity showed improvement. Nonetheless, the
increase in deposits outpaced the rise in loan portfolios resulting in lower loans‐to‐deposits ratios
(LDRs) across all regions in 2017. Bank density ratios of all regions likewise increased compared to the
2016 levels. The number of microfinance service providers in the country steadily increased as well
for most regions, reaching 1,057 in 2017, a year‐on‐year growth of 29.5 percent. Central Visayas led
the regions with the growth in microfinance‐oriented banks or MOBs (228.6 percent) in 2017,
followed by Cagayan Valley (185.7 percent) and SOCCSKSARGEN (180 percent).
Meanwhile, the national employment rate was relatively steady, registering 94.3 percent from
the previous year’s 94.6 percent. The highest rates of employment were recorded in the
regions of Cagayan Valley, ARMM, Zamboanga Peninsula and SOCCSKARGEN. In 2017, national
unemployment and underemployment rates reached 5.7 percent and 16.1 percent,
respectively. Notable improvements in underemployment were recorded in the regions of

iii
Northern Mindanao, CAR, and Eastern Visayas. A Box Article to this Report looked into the
relationship between unemployment and poverty incidence in the regions. The article
specifically discussed factors explaining the trend disparities in these indicators across the
regions.
In 2017, receipts and expenditures by Local Government Units (LGUs) reached P564.9 billion
and P465.9 billion, respectively. Of the total receipts, 71.1 percent came from external sources
(97.2 percent of which were accounted for internal revenue allotment (IRA)), local revenues
(28.1 percent), and non‐income receipts (0.7 percent). Of the total LGU receipts, 12.8 percent
came from CALABARZON, 12.7 percent from NCR and 9.4 percent from Central Luzon.
Meanwhile, total LGU expenditures were spent for general services, 48.9 percent; social
services, 24.3 percent; economic services, 22.1 percent; and debt services (4.7 percent). Of the
total LGU expenditures, CALABARZON spent 14.1 percent; NCR, 13.6 percent; and Central
Luzon, 10.4 percent.
Average annual inflation rates in most regions escalated in 2017. Of the 17 regions, 12 posted
notable increases from the previous year. Despite the acceleration, majority (a total of 12) of
these regions’ inflation rates remained within the national government’s inflation target range
of 3.0 percent ± 1.0 percentage point during the year.
The combined approved foreign and Filipino nationals’ investments in the country grew by 32.5
percent in 2017, after consecutive declines in 2015 and 2016. Ilocos Region led the recovery with a
growth of 256.1 percent, Cagayan Valley with 163.6 percent and Caraga with 117.1 percent. However,
approved foreign investments (FIs) in the country contracted in 2017 by 51.8 percent, continuing the
slide from 2016. Most of the regions (14 out of 17) experienced declines in approved FIs.
Moving forward, key challenges to regional development remain, including the adverse impact
of extreme weather‐related disturbances, particularly for regions which are dependent on the
agriculture sector. Other issues include the need for adequate and reliable infrastructure and
connectivity. On the upside, efforts to improve ease of doing business are expected to attract
more investments and encourage entrepreneurial activities in local industries. Timely
implementation of infrastructure and road projects as well as rehabilitation of existing airports
and seaports are likewise anticipated to promote tourism and further boost competitiveness
and productivity in the regions.

iv
Foreword
In June 2005, the Monetary Board approved the release of the maiden issue of the BSP’s
Report on Regional Economic Developments in the Philippines. The report widens the scope of
the BSP’s market surveillance, adding a geographic dimension to the economic indicators that
it monitors regularly. The analysis of regional trends and developments are valuable inputs in
monetary policy formulation and financial supervision.
The report tracks economic developments in the regions, focusing on demand and supply
conditions, monetary and price developments as well as the emerging economic outlook. It
helps confirm the results of the business and consumer expectations surveys conducted by the
BSP. Moreover, identifying opportunities and challenges faced by the different regions
enhances further the BSP’s forward‐looking and proactive approach to monetary policy.
Regional performance is gauged using developments in output, prices, and employment.
Selected key indicators in each of the major sectors of the economy are the focus of the
surveillance. Agriculture covers rice and corn, livestock, fishery, and poultry production. In the
industry sector, the number of building permits and housing starts are used to measure
construction activity; while developments in the banking system are used to analyze the
services sector. Also included in this Report are trends in local governments’ receipts and
expenditures, approved investments as well as microfinance activities.
Qualitative and quantitative information used in the report are collected from primary and
secondary sources, reflecting the extensive information gathered by the BSP regional offices
and branches.

v
1 BSP Regional Offices are located in Regions 1 (La Union), VI (Cebu) and XI (Davao). There are BSP branches/offices located in Regions I‐XII. These offices/branches have currency units which handle cash transactions in the region.
BSP Regional Offices and
Branches
BUTUAN BRANCH
1

vi
Region Provinces
National Capital Region (NCR)
Cities of Caloocan, Las Piñas, Makati, Malabon, Mandaluyong, Manila, Marikina, Muntinlupa, Navotas, Parañaque, Pasay, Pasig, Quezon, San Juan, Taguig and Valenzuela, and the Municipality of Pateros
Cordillera Administrative Region (CAR)
Abra, Benguet, Ifugao, Kalinga Apayao, and Mountain Province
Region I – Ilocos Region
Ilocos Norte, Ilocos Sur, La Union, and Pangasinan
Region II – Cagayan Valley
Batanes, Cagayan, Isabela, Nueva Vizcaya, and Quirino
Region III – Central Luzon
Aurora, Tarlac, Pampanga, Zambales, Bataan, Nueva Ecija, and Bulacan
Region IV A – CALABARZON (Cavite, Laguna, Batangas, Rizal, and
Quezon )
Cavite, Laguna, Batangas, Rizal, and Quezon
Region IV‐B MIMAROPA (Mindoro,
Marinduque, Romblon, and Palawan)
Occidental Mindoro, Oriental Mindoro, Marinduque, Palawan, and Romblon
Region V – Bicol Region
Camarines Norte, Camarines Sur, Albay, Masbate, Sorsogon, and Catanduanes
Region VI – Western Visayas
Iloilo, Antique, Guimaras, Aklan, Negros Occidental and Capiz
Region VII – Central Visayas Bohol, Cebu, Negros Oriental and Siquijor
Region VIII – Eastern Visayas
Leyte, Southern Leyte, Biliran, Eastern Samar, Northern Samar, and Samar (Western Samar)
Region IX – Zamboanga Peninsula
Zamboanga Sibugay, Zamboanga del Norte, and Zamboanga del Sur
Philippines: Regional Composition As of 31 December 2017 2

vii
Region Provinces
Region X – Northern Mindanao
Bukidnon, Camiguin, Misamis Oriental, Misamis Occidental, and Lanao del Norte
Region XI – Davao Region
Davao City, Davao del Norte, Davao del Sur, Davao Oriental, and Compostela Valley, Davao Occidental
Region XII – SOCCSKSARGEN (South Cotabato, Cotabato, Sultan Kudarat, Sarangani and General Santos City)
Cotabato (North Cotabato) South Cotabato, Sultan Kudarat Province and Saranggani
Region XIII – Caraga
Agusan del Norte, Agusan del Sur, Surigao del Norte, and Surigao del Sur, Dinagat Islands
ARMM (Autonomous Region in Muslim Mindanao)
Basilan, Lanao del Sur, Sulu and Tawi‐Tawi, and Maguindanao Province
2 The Negros Island Region (NIR) was abolished through Executive Order No. 38 –“Revoking Executive Order No. 183 (s. 2015) which Created a Negros Island Region and for Other Purposes”, signed by President Rodrigo Roa Duterte on 07 August 2017. The abolition of NIR reverted the provinces, cities, municipalities, and barangays of Negros Occidental and Negros Oriental to Region VI (Western Visayas) and Region VII (Central Visayas), respectively. https://psa.gov.ph/content/psgc‐3rd‐quarter‐2017‐updates‐abolition‐negros‐island‐region‐nir

2017 Report on Regional Economic Developments in the Philippines | 1
Key Regional Developments
Real Sector
Gross Regional Domestic Product
Philippine Gross Domestic Product (GDP) posted a
6.7 percent growth in 2017 supported by the
positive economic performance of all seventeen
regions. Notably, seven of the regions have
posted growth rates that were higher than the
national average GDP growth, namely: CAR (12.1
percent), Davao (10.9 percent); Central Luzon (9.3
percent); Western Visayas (8.4 percent);
SOCCSKSARGEN (8.2 percent); ARMM (7.3
percent) and Cagayan Valley (7.2 percent). By
contrast, the regions that posted the slowest
growth rates in 2017 were Eastern Visayas (1.8
percent) and Zamboanga Peninsula (2.3 percent).
The acceleration of growth in the CAR region was
supported by expansions in its industry and
services sectors. Lending strong support to the
growth of these sectors were the robust
performance of the region’s exports sector amid
increased global demand for electronics,
fabricated metals and call center services, among
others. Under the Philippine Economic Zone
Authority (PEZA), a total of US$2.9 billion worth of
export products were recorded in the region for
2017, which represented a 75.3 percent increase
compared to the previous year’s level. Meanwhile,
investments from large firms such as stock
corporations and partnerships also rose amid
continued favorable business environment in the
area. In 2017, the region was the recipient of
P299.4 million worth of investments as registered
by the Securities and Exchange Commission (SEC),
28.9 percent higher than the previous year’s
inflows. Moreover, the number of stock
corporations in the region rose from 141 to 165
and business partnerships from 62 to 72 as
reflected in the number of registrants. PEZA also
recorded P145.1 million incremental investments
from the Baguio City Economic Zone (BCEZ) and
Abanao Square IT Center specifically for call
centers and real estate activities in the region. Source: Philippine Statistics Authority (PSA)
2015 2016 2017 2015 2016 2017
PHILIPPINES 6.1 6.9 6.7 100 100 100
1 NCR 6.7 7.4 6.1 36.5 36.6 36.4
2 CAR 4.0 2.3 12.1 1.8 1.7 1.8
3 Ilocos Region (I) 5.4 8.5 5.8 3.1 3.2 3.1
4 Cagayan Valley (II) 4.1 3.8 7.2 1.8 1.7 1.7
5 Central Luzon (III) 5.6 9.5 9.3 9.3 9.5 9.7
6 CALABARZON (IV‐A) 5.8 4.8 6.7 17.1 16.8 16.8
7 MIMAROPA (IV‐B) 2.0 2.6 6.2 1.6 1.5 1.5
8 Bicol Region (V) 8.9 5.5 5.1 2.0 2.0 2.0
9 Western Visayas (VI) 8.8 5.9 8.4 4.0 4.0 4.0
10 Central Visayas (VII) 4.9 8.6 5.1 6.4 6.5 6.4
11 Eastern Visayas (VIII) 4.6 12.0 1.8 2.0 2.1 2.0
12 Zamboanga Peninsula (IX) 7.7 4.6 2.3 2.1 2.0 1.9
13 Northern Mindanao (X) 5.7 7.5 5.9 3.7 3.8 3.7
14 Davao Region (XI) 8.2 9.5 10.9 4.0 4.1 4.3
15 SOCCSKSARGEN (XII) 3.3 4.9 8.2 2.7 2.6 2.7
16 Caraga 4.5 2.0 4.3 1.3 1.2 1.2
17 ARMM ‐0.4 0.4 7.3 0.7 0.6 0.6
RegionGrowth rate Share to total
Table 1. Gross Regional Domestic Product (GRDP)Growth rate and share to total production, in percent
All regions register positive economic expansions with CAR, Davao and Central Luzon growing the fastest

Key Regional Developments
2 | 2017 Report on Regional Economic Developments in the Philippines
On the contrary, the Eastern Visayas region
exhibited a significant slowdown in GRDP growth
to 1.8 percent from the previous year’s growth of
12.0 percent. The deceleration was linked mainly
to the contraction of the industry sector by 1.7
percent in 2017 from a 19.5 percent growth a year
ago. This was on the back of the negative
performance posted by the utilities, construction,
and mining and quarrying subsectors. The region’s
services and agriculture sectors also slowed down
during the year amid the adverse effects of natural
disasters that hit the region in 2017. These
include, among others, the 6.5‐magnitude
earthquake in July 2017 that damaged the
geothermal power plant in Leyte and resulted in
total power shutdown in Eastern Visayas for three
weeks and losses of P37.8 million by the power
sector at the time and typhoon Urduja in
December 2017, which brought floods and
landslides, destroying roads and bridges,
particularly in Samar and Biliran provinces.
In terms of share to total GDP, the National Capital
Region (NCR) continued to account for more than
a third of the total GDP (36.4 percent). The other
two major contributing regions were CALABARZON
(which accounted for 16.8 percent of the 2017
GDP) and Central Luzon (9.7 percent).
By economic activity, Central Luzon accounted for
the biggest share in overall agriculture, hunting,
forestry and fishing (AHFF) sector, comprising 16.3
percent of the country’s total AHFF output. Central
Luzon’s top agricultural products included palay,
chicken, hog, tiger prawn and tilapia.
CALABARZON also had a substantial share in the
country’s AHFF sector (10.0 percent) followed by
Northern Mindanao (9.5 percent).
In the industry sector, CALABARZON remained the
primary regional hub of industrial activities as it
accounted for 30.6 percent of the country’s total
industrial production. The region’s manufacturing
and construction sub‐sectors provided a solid
backbone for the region’s industrial activities and
overall economic performance particularly in
2017. Meanwhile, the NCR was second biggest
contributor to the country’s industrial output
(accounting for 19.0 percent of the total industry
output in 2017) while Central Luzon placed third
(13.8 percent).
In the services sector, the NCR remained the
largest provider of services‐related activities,
accounting for more than half (52.1 percent) of
the country’s total services sector output. Growth
in the NCR’s services sector continued to be
supported by the robust performance of trade,
real estate, renting and business activities,
financial intermediation and manufacturing
activities. CALABARZON followed with a 9.6
percent share to total services output and Central
Luzon with 6.4 percent.
NCR, CALABARZON and Central Luzon account for the largest share of national output

Key Regional Developments
2017 Report on Regional Economic Developments in the Philippines | 3
Agriculture, Livestock, Poultry and
Fishery
Palay. Palay production improved nationwide and
grew by 16.2 percent in 2017 from a contraction in
2016. The improved performance of palay
production could be attributed to favorable
weather conditions and sufficient supply of water
across regions.
Almost all regions, except for Eastern Visayas,
posted expansion in their palay production in
2017. Double‐digit growth rates were seen in
Central Visayas (40.2 percent), Zamboanga
Peninsula (20.6 percent), Western Visayas (17.6
percent), CAR (16.2 percent) and Cagayan Valley
(13.9 percent). The improvement in these regions
was due to the following factors:
Good weather conditions in Cagayan Valley
and Western Visayas;
Increase in land utilized for the planting of
palay in Cagayan Valley and Zamboanga
Peninsula;
Sufficient delivery of water as a result of
rehabilitation of irrigation facitlites (e.g.,
communal irrigation systems and functional
small reservoir irrigation projects) in the cities
of Bayawan, Canlaon, Zamboanguita, Dauin
and Valencia in Central Visayas, in the
provinces of Cagayan Valley and Western
Visayas;
Provision of fertilizer and crop protection
support from the Department of Agriculture
and local government units (LGUs) in Western
Visayas and Zamboanga Peninsula;
Increase in area harvested in Western Visayas;
and
Improvement in average yield per hectare
brought about by the use of newly introduced
hybrid seed varieties such as Bigante, Longpin
and SL8 in Cagayan Valley, Western Visayas,
Central Visayas and Zamboanga Peninsula.
The decline in palay production in Eastern Visayas
(‐1.0 percent) could be traced to the occurrence of
rains during the vegetative and reproductive stages
of the crop.
Chart 1. Palay Production in million metric tons
0
0.5
1
1.5
2
2.5
3
3.5
4
CAR I II III
IV‐A
IV‐B V VI
VII
VIII IX X XI XII
Caraga
ARMM
2015
2016
2017
Palay production improves due to favorable weather conditions and adequate water supply
Source: PSA
Key Regional Developments
4 | 2017 Report on Regional Economic Developments in the Philippines
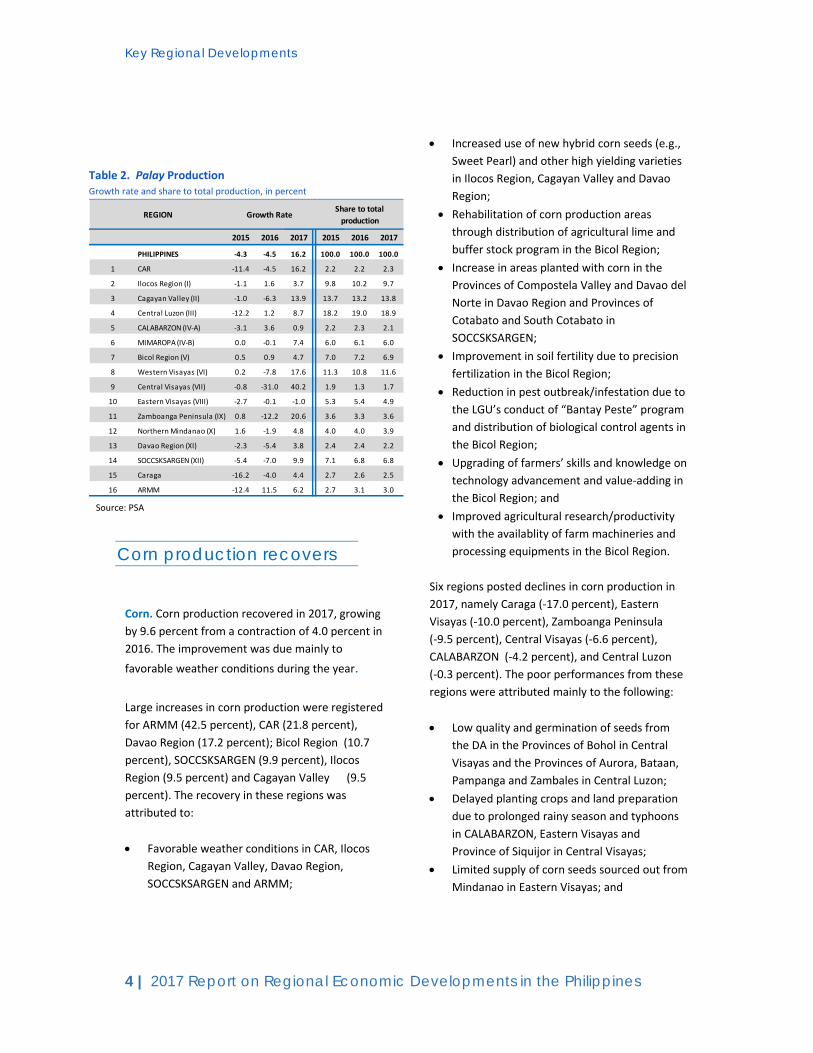
Corn. Corn production recovered in 2017, growing
by 9.6 percent from a contraction of 4.0 percent in
2016. The improvement was due mainly to
favorable weather conditions during the year. Large increases in corn production were registered
for ARMM (42.5 percent), CAR (21.8 percent),
Davao Region (17.2 percent); Bicol Region (10.7
percent), SOCCSKSARGEN (9.9 percent), Ilocos
Region (9.5 percent) and Cagayan Valley (9.5
percent). The recovery in these regions was
attributed to:
Favorable weather conditions in CAR, Ilocos
Region, Cagayan Valley, Davao Region,
SOCCSKSARGEN and ARMM;
Increased use of new hybrid corn seeds (e.g.,
Sweet Pearl) and other high yielding varieties
in Ilocos Region, Cagayan Valley and Davao
Region;
Rehabilitation of corn production areas through distribution of agricultural lime and
buffer stock program in the Bicol Region;
Increase in areas planted with corn in the Provinces of Compostela Valley and Davao del
Norte in Davao Region and Provinces of
Cotabato and South Cotabato in
SOCCSKSARGEN;
Improvement in soil fertility due to precision
fertilization in the Bicol Region;
Reduction in pest outbreak/infestation due to the LGU’s conduct of “Bantay Peste” program
and distribution of biological control agents in
the Bicol Region;
Upgrading of farmers’ skills and knowledge on
technology advancement and value‐adding in
the Bicol Region; and
Improved agricultural research/productivity
with the availablity of farm machineries and
processing equipments in the Bicol Region.
Six regions posted declines in corn production in
2017, namely Caraga (‐17.0 percent), Eastern
Visayas (‐10.0 percent), Zamboanga Peninsula
(‐9.5 percent), Central Visayas (‐6.6 percent),
CALABARZON (‐4.2 percent), and Central Luzon
(‐0.3 percent). The poor performances from these
regions were attributed mainly to the following:
Low quality and germination of seeds from
the DA in the Provinces of Bohol in Central
Visayas and the Provinces of Aurora, Bataan,
Pampanga and Zambales in Central Luzon;
Delayed planting crops and land preparation
due to prolonged rainy season and typhoons
in CALABARZON, Eastern Visayas and
Province of Siquijor in Central Visayas;
Limited supply of corn seeds sourced out from
Mindanao in Eastern Visayas; and
Table 2. Palay Production Growth rate and share to total production, in percent
2015 2016 2017 2015 2016 2017
PHILIPPINES ‐4.3 ‐4.5 16.2 100.0 100.0 100.0
1 CAR ‐11.4 ‐4.5 16.2 2.2 2.2 2.3
2 Ilocos Region (I) ‐1.1 1.6 3.7 9.8 10.2 9.7
3 Cagayan Valley (II) ‐1.0 ‐6.3 13.9 13.7 13.2 13.8
4 Central Luzon (III) ‐12.2 1.2 8.7 18.2 19.0 18.9
5 CALABARZON (IV‐A) ‐3.1 3.6 0.9 2.2 2.3 2.1
6 MIMAROPA (IV‐B) 0.0 ‐0.1 7.4 6.0 6.1 6.0
7 Bicol Region (V) 0.5 0.9 4.7 7.0 7.2 6.9
8 Western Visayas (VI) 0.2 ‐7.8 17.6 11.3 10.8 11.6
9 Central Visayas (VII) ‐0.8 ‐31.0 40.2 1.9 1.3 1.7
10 Eastern Visayas (VIII) ‐2.7 ‐0.1 ‐1.0 5.3 5.4 4.9
11 Zamboanga Peninsula (IX) 0.8 ‐12.2 20.6 3.6 3.3 3.6
12 Northern Mindanao (X) 1.6 ‐1.9 4.8 4.0 4.0 3.9
13 Davao Region (XI) ‐2.3 ‐5.4 3.8 2.4 2.4 2.2
14 SOCCSKSARGEN (XII) ‐5.4 ‐7.0 9.9 7.1 6.8 6.8
15 Caraga ‐16.2 ‐4.0 4.4 2.7 2.6 2.5
16 ARMM ‐12.4 11.5 6.2 2.7 3.1 3.0
Share to total
productionREGION Growth Rate
Corn production recovers
Source: PSA

Key Regional Developments
2017 Report on Regional Economic Developments in the Philippines | 5
Decline in area harvested due to a shift in
crops of farmers to cassava and sugarcane in
Eastern Visayas, Zamboanga Peninsula and
Caraga regions, and Province of Negros
Oriental in Central Visayas.
Livestock production. The country’s total cattle
production contracted by 1.5 percent in 2017
from a growth of 1.3 percent in 2016. The decline
was on account of poor performance in Central
Luzon (‐13.8 percent), Caraga (‐6.5 percent),
Eastern Visayas (‐5.4 percent), Cagayan Valley
(‐5.2 percent), Northern Mindanao (‐4.7 percent),
CAR (‐4.1 percent), CALABARZON (‐1.8 percent),
Ilocos (‐1.4 percent), SOCCSKSARGEN (‐1.3
percent) and ARMM (‐0.1 percent) due to the
following factors:
Losses from typhoon damages in
CALABARZON;
Less stocks available for disposition as some
were reserved for breeding, inventory build
up or work animals in CAR, Ilocos, Cagayan
Valley, Central Luzon and ARMM;
Disposition of smaller sized animals in
Cagayan Valley and Central Luzon;
Incidence of animal deaths and low culling of
unproductive animals in the Province of
Nueva Ecija;
Lack of pest management training for cattle
raisers in CALABARZON;
Declining population of cattle due to the
cease in the operation of Monterey Farm in
the Province of South Cotabato in
SOCCSKSARGEN;
Unfavorable market prices that led raisers to
hold their farm stocks in Caraga Region;
Decrease of cattle grazing areas brought
about by the non‐renewal of expired
leasehold in the Province of Bukidnon in
Northern Mindanao; and
Decreasing number of backyard farms in
SOCCSKSARGEN.
On the other hand, the regions that posted
improvements in their cattle production in 2017
were Davao (3.7 percent), Western Visayas
Cattle production contracts
Source: PSA
2015 2016 2017 2015 2016 2017
PHILIPPINES ‐3.2 ‐4.0 9.6 100 100 100
1 CAR ‐2.8 ‐16.2 21.8 3.2 2.8 3.12 Ilocos Region (I) 3.0 3.5 9.5 6.5 7.0 7.0
3 Cagayan Valley (II) ‐3.0 ‐6.8 9.5 24.0 23.3 23.2
4 Central Luzon (III) 12.6 ‐4.3 ‐0.3 3.6 3.6 3.3
5 CALABARZON (IV‐A) ‐12.8 49.4 ‐4.2 0.9 1.3 1.2
6 MIMAROPA (IV‐B) 16.5 ‐8.7 5.7 1.7 1.6 1.5
7 Bicol Region (V) ‐14.6 6.3 10.7 3.2 3.6 3.6
8 Western Visayas (VI) ‐4.9 ‐19.0 6.2 4.7 3.9 3.8
9 Central Visayas (VII) ‐8.6 4.5 ‐6.5 2.0 2.2 1.9
10 Eastern Visayas (VIII) 3.4 ‐10.5 ‐10.0 1.2 1.1 0.9
11 Zamboanga Peninsula (IX) ‐1.4 17.6 ‐9.5 2.9 3.6 3.0
12 Northern Mindanao (X) 1.7 0.6 5.2 16.2 16.9 16.3
13 Davao Region (XI) ‐20.0 ‐2.2 17.2 3.0 3.0 3.2
14 SOCCSKSARGEN (XII) ‐7.4 ‐7.7 9.9 16.5 15.8 15.9
15 Caraga ‐5.3 21.7 ‐17.0 1.6 2.0 1.5
16 ARMM ‐3.8 ‐12.3 42.5 9.0 8.2 10.6
REGION Growth RateShare to total
production
Chart 2. Corn Production In million metric tons
Table 3. Corn Production Growth rate and share to total production, in percent
Source: PSA

Key Regional Developments
6 | 2017 Report on Regional Economic Developments in the Philippines
Table 4. Cattle Production Growth rate and share to total production, in percent
(3.5 percent), Bicol (3.4 percent), MIMAROPA
(2.7 percent), Central Visayas (1.8 percent) and
Zamboanga Peninsula (0.2 percent). The improved
perfomance in these areas was due mainly to the
high demand from consumers, as well as from
hotel and restaurant industries in these regions.
Chicken production. Chicken production grew by
4.3 percent in 2017 from 0.8 percent in 2016.
Better performances in Eastern Visayas (35.9
percent), Western Visayas (8.3 percent);
SOCCSKSARGEN (7.1 percent), Zamboanga
Peninsula (5.9 percent), Central Luzon (5.7
percent), Caraga (5.2 percent) and Central Visayas
(5.1 percent) contributed to the improvement of
the chicken production in the country. Factors
behind the accelerated growth include:
Increase in the disposition of chicken in broiler
farms in Central Luzon, Central Visayas and
SOCCSKSARGEN;
Less livestock mortality due to more favorable
weather in Western Visayas;
Opening and rehabilitation of some broiler
farms in Central Luzon;
Increase in stocks in commercial broiler farms
in the Province of South Cotabato and North
Cotabato in SOCCSKSARGEN;
High demand for poultry products in Central
Visayas, Eastern Visayas, Zamboanga
Peninsula and Caraga regions;
Source: PSA
Chart 3. Cattle Productionin thousand metric tons
051015202530354045
CAR I II III
IV‐A
IV‐B V VI
VII
VIII
IX X XI
XII
Caraga
ARMM
2015
2016
2017
Source: PSA
Chicken production rises
2015 2016 2017 2015 2016 2017
PHILIPPINES 2.1 1.3 ‐1.5 100 100 100
1 CAR ‐3.1 ‐2.2 ‐4.1 1.7 1.6 1.6
2 Ilocos Region (I) 2.3 ‐2.0 ‐1.4 10.6 10.3 10.3
3 Cagayan Valley (II) ‐3.0 7.1 ‐5.2 5.3 5.6 5.4
4 Central Luzon (III) ‐0.5 2.6 ‐13.8 6.9 6.9 6.1
5 CALABARZON (IV‐A) 7.3 2.2 ‐1.8 10.5 10.6 10.6
6 MIMAROPA (IV‐B) 5.3 1.6 2.7 4.6 4.6 4.8
7 Bicol Region (V) 5.2 3.1 3.4 6.2 6.3 6.6
8 Western Visayas (VI) 0.3 1.9 3.5 9.1 9.1 9.6
9 Central Visayas (VII) ‐1.7 3.0 1.8 9.0 9.2 9.5
10 Eastern Visayas (VIII) ‐1.8 2.4 ‐5.4 0.8 0.9 0.8
11 Zamboanga Peninsula (IX) ‐1.0 ‐7.4 0.2 4.5 4.1 4.2
12 Northern Mindanao (X) 3.3 0.8 ‐4.7 14.6 14.6 14.1
13 Davao Region (XI) 2.4 0.7 3.7 4.8 4.7 5.0
14 SOCCSKSARGEN (XII) 7.1 ‐1.7 ‐1.3 7.2 7.0 7.0
15 Caraga ‐7.8 18.0 ‐6.5 0.5 0.6 0.6
16 ARMM 0.5 7.5 ‐0.1 3.7 3.9 3.9
Share to total
productionREGION Growth rate

Key Regional Developments
2017 Report on Regional Economic Developments in the Philippines | 7
Source: PSA
Source: PSA
Increasing number of broiler contract growers
in the Province of North Cotabato in
SOCCSKSARGEN;
Expansion in commercial layer farms in
Central Luzon and Eastern Visayas;
Improvement of the backyard poultry farms in
the Province of Cotabato in SOCCSKSARGEN;
High demand for duck eggs for balut‐making
in Central Luzon;
Higher buying price in Western Visayas and
SOCCSKSARGEN; and
Emergence of new broiler farms in Central
Luzon.
On the other hand, regions that exhibited
contraction in chicken production in 2017, which
moderated overall growth were Cagayan Valley
(‐3.1 percent), ARMM (‐1.9 percent), MIMAROPA
(‐1.4 percent), Ilocos (‐0.9 percent) and Davao
(‐0.3 percent). The dismal performances in poultry
production in the above‐mentioned regions were
due to the following:
Less stocks and tight supply of day‐old chicks
in commercial farms in Ilocos;
Occurrence of diseases such as Avian Flu and
New Castle Disease in Ilocos and MIMAROPA;
Decreased number of loadings of some broiler
farms in Davao City;
Shifting of broiling operations of some Davao
City farms to breeding and layer farms; and
Closure of some commercial farms in the
Province of Davao del Norte.
Source: Philippine Statistics Authority
Chart 4. Chicken Production In thousand metric tons
Table 5. Chicken Production Growth rate and share to total production, in percent
2015 2016 2017 2015 2016 2017
PHILIPPINES 5.7 0.8 4.3 100 100 100
1 CAR 7.7 ‐1.7 4.2 0.5 0.5 0.5
2 Ilocos Region (I) 0.4 ‐4.9 ‐0.9 5.0 4.7 4.5
3 Cagayan Valley (II) 2.8 2.2 ‐3.1 3.6 3.6 3.4
4 Central Luzon (III) 6.9 ‐3.0 5.7 36.7 35.3 35.8
5 CALABARZON (IV‐A) 7.7 2.1 0.1 19.4 19.6 18.8
6 MIMAROPA (IV‐B) 2.9 ‐3.2 ‐1.4 0.6 0.6 0.6
7 Bicol Region (V) 9.9 5.5 4.1 2.4 2.5 2.5
8 Western Visayas (VI) 6.6 6.6 8.3 5.4 5.7 5.9
9 Central Visayas (VII) 5.9 2.2 5.1 5.9 6.0 6.0
10 Eastern Visayas (VIII) ‐6.8 28.0 35.9 1.7 2.2 2.8
11 Zamboanga Peninsula (IX) 5.0 8.5 5.9 1.7 1.8 1.8
12 Northern Mindanao (X) 3.9 4.6 4.1 8.8 9.1 9.1
13 Davao Region (XI) 7.5 ‐2.1 ‐0.3 4.4 4.3 4.1
14 SOCCSKSARGEN (XII) ‐1.7 5.7 7.1 2.8 3.0 3.1
15 Caraga 0.7 4.6 5.2 0.8 0.8 0.8
16 ARMM ‐1.3 ‐7.8 ‐1.9 0.3 0.3 0.3
REGION Growth rateShare to total
production

Key Regional Developments
8 | 2017 Report on Regional Economic Developments in the Philippines
Swine production. Swine production grew by 1.5
percent in 2017, lower than the 5.3 percent
expansion posted in 2016. This could be
attributed to contractions in the swine production
of Central Luzon (‐3.2 percent), ARMM (‐2.6
percent), CAR (‐2.0 percent), Western Visayas (‐1.1
percent), SOCCSKSARGEN (‐1.1 percent) and
Caraga (‐0.5 percent), for the following reasons:
Low volume of stocks available in the market
in Central Luzon and the Provinces of North
Cotabato and Saranggani in SOCCSKSARGEN;
Less hog disposal for slaughter as raisers
reserved some stocks for breeding in Central
Luzon;
Less demand for pork from buyers in CAR; and
Marketing problems brought about by the
peace and order problem in ARMM.
Nonetheless, the contraction was offset by
positive performance from various regions during
the period. These were Central Visayas (9.8
percent), Northern Mindanao (6.1 percent),
MIMAROPA (4.4 percent), Bicol (4.2 percent),
Ilocos (4.1 percent), Zamboanga Peninsula (2.7
percent), Cagayan Valley (2.1 percent),
CALABARZON (1.8 percent), Davao (1.6 percent)
and Eastern Visayas (0.1 percent). These
improvements were caused by the following
factors:
Availability of more fatteners in Ilocos region;
Increased stocks for slaughter in Cagayan
Valley, Davao and Province of Siquijor in
Central Visayas;
High demand for longganisa and bagnet from
traders in Ilocos bound to Metro Manila,
Benguet and other provinces outside the
Ilocos region;
Improved facility in hog farms in
CALABARZON;
Strengthening of animal health services
through the provision of veterinary biologics
and supplements for the treatment,
prevention and control of foot and mouth
disease (FMD) in the Bicol region;
Table 6. Swine Production Growth rate and share to total production, in percent
Swine production slows down
Source: PSA
2015 2016 2017 2015 2016 2017
PHILIPPINES 4.3 5.3 1.5 100 100 100
1 CAR ‐7.0 ‐1.4 ‐2.0 1.3 1.2 1.1
2 Ilocos Region (I) 1.4 4.6 4.1 3.9 3.9 4.0
3 Cagayan Valley (II) 2.6 3.6 2.1 3.2 3.2 3.2
4 Central Luzon (III) 11.0 9.4 ‐3.2 19.9 20.7 19.8
5 CALABARZON (IV‐A) 6.6 8.5 1.8 15.9 16.4 16.4
6 MIMAROPA (IV‐B) 4.6 2.5 4.4 3.7 3.6 3.7
7 Bicol Region (V) 1.9 ‐1.7 4.2 5.8 5.4 5.6
8 Western Visayas (VI) ‐0.1 5.8 ‐1.1 8.4 8.5 8.2
9 Central Visayas (VII) 4.3 7.1 9.8 7.7 7.8 8.5
10 Eastern Visayas (VIII) ‐0.1 ‐0.1 0.1 3.6 3.4 3.4
11 Zamboanga Peninsula (IX) 1.4 ‐1.6 2.7 3.8 3.6 3.6
12 Northern Mindanao (X) 3.7 4.5 6.1 8.0 8.0 8.3
13 Davao Region (XI) 5.2 4.1 1.6 6.8 6.7 6.7
14 SOCCSKSARGEN (XII) ‐1.2 0.6 ‐1.1 5.6 5.3 5.2
15 Caraga ‐0.6 7.1 ‐0.5 1.9 1.9 1.9
16 ARMM ‐1.6 ‐6.1 ‐2.6 0.5 0.5 0.4
Share to total
productionREGION Growth rate
Chart 5. Swine Production In hundred thousand metric tons
Source: PSA

Key Regional Developments
2017 Report on Regional Economic Developments in the Philippines | 9
Strict implementation of regulatory quarantine
rules at entry points, massive advocacy and
information drive against FMD in the Bicol
region;
Increased backyard farming in Northern
Mindanao, and Provinces of Davao del Sur,
Occidental and Davao del Norte in Davao
region;
Increased disposition of hogs due to favorable
prices in Ilocos, MIMAROPA, Central Visayas,
Davao, Provinces of Nueva Vizcaya and Quirino
in and Cagayan Valley and the Province of
Compostela Valley in Davao region; and
Increased demand for pork in Cagayan Valley,
CALABARZON, MIMAROPA and Northern
Mindanao.
Fish Production. The rate of decline of the fishery
subsector in the country was slower at 1.0 percent
in 2017 compared to 6.3 percent a year ago. The
improvement was due to the positive
performances in SOCCSKSARGEN (9.3 percent),
Central Luzon (5.4 percent), ARMM (3.9 percent);
Ilocos (2.6 percent), Bicol (1.9 percent),
MIMAROPA (1.3 percent), and CALABARZON
(0.3 percent), which mitigated further contraction
of the overall fishery subsector. The positive
performance could be traced to the following
factors:
Bigger sizes of fish captured in Ilocos region;
More harvest from payaos and artificial reefs
in Ilocos region;
Provision of good quality fingerlings and
fishing gears from the Bureau of Fisheries and
Aquatic Resources (BFAR) of Central Luzon
and CALABARZON;
More fishing operations due to less gale
warnings and weather disturbances in Ilocos
and SOCCSKSARGEN;
Newly established fishponds in brackish water
in Central Luzon;
Increased number of boats in operation in Ilocos region;
Favorable water salinity suitable to the growth of fish species in Central Luzon;
More unloading of frozen tuna for cold storage and canneries such as big‐eye and yellow fin tuna in SOCCSKSARGEN;
Increase in fish catch from marine waters in Ilocos region;
Expansion of areas for fishpond operations in Central Luzon and MIMAROPA; and
High survival rate in Ilocos region and Central Luzon.
Nonetheless, the continued contraction was due
to the dismal performances of Central Visayas
(‐17.7 percent), Zamboanga Peninsula (‐7.3
percent), Northern Mindanao (‐6.6 percent),
Cagayan Valley (‐4.6 percent), Eastern Visayas
(‐2.9 percent), Davao (‐2.3 percent), Caraga
(‐2.3 percent) and Western Visayas (‐1.7 percent).
Fish production registers slower decline Chart 6. Fish production
in hundred thousand metric tons
Source: PSA

Key Regional Developments
10 | 2017 Report on Regional Economic Developments in the Philippines
The negative performance in these regions was
due to the following factors:
Less fishing operations and minimal catch due
to rough seas brought about by unpredictable
weather conditions in Cagayan Valley,
Western Visayas, Northern Mindanao and
Davao regions;
Less fishing trips due to strict enforcement of
fishery law and regulations in CAR and
Central Visayas regions;
Less fish stocks in inland water due to the
damages in some fish habitats in Northern
Mindanao caused by quarrying activities;
Decrease in culture seaweed production due
to sudden change in temperature in the
Province of Bohol in Central Visayas;
Decrease in the number of licensed
commercial fishing vessels in Eastern Visayas
after the onslaught of Typhoon Yolanda;
Decrease in harvest of spinosum seaweeds
due to less financial support from traders in
Central Visayas;
Presence of “ice‐ice” disease in the Provinces
of Lanao del Norte and Misamis Occidental in
Northern Mindanao;
Less area harvested for aquaculture fisheries
due to water pollution coming from marine
cages in Davao;
Less appearance of migratory species in the
Province of Siquijor in Central Visayas;
Less fishing operations due to aging fishing
vessels in Eastern Visayas;
Diminished number of catch due to dry
docking of fishing vessels in Cagayan Valley,
Western Visayas and Central Visayas;
Implementation of Fisheries Administrative
Order No. 167 that prohibits commercial
fishing in the Visayas Sea in Western Visayas;
Non‐renewal of fishing permits of some
operators in the Province of Bohol in Central
Visayas; and
Limited distribution of fingerlings by BFAR in
Davao.
Table 7. Fish production Growth rate and share to total production, in percent
2015r2016
r2017
p2015
r2016
r2017
p
PHILIPPINES ‐0.8 ‐6.3 ‐1.0 100 100 100
1 NCR ‐16.1 17.5 ‐27.0 2.3 2.9 2.1
2 CAR ‐2.8 8.7 ‐1.3 0.1 0.1 0.1
3 Ilocos Region (I) ‐7.1 ‐2.9 2.6 3.5 3.6 3.7
4 Cagayan Valley (II) ‐6.3 ‐5.1 ‐4.6 1.2 1.2 1.2
5 Central Luzon (III) ‐0.4 ‐1.6 5.4 6.0 6.3 6.7
6 CALABARZON (IV‐A) ‐3.3 ‐12.5 0.3 8.1 7.6 7.7
7 MIMAROPA (IV‐B) 4.7 ‐17.9 1.3 12.7 11.1 11.3
8 Bicol Region (V) ‐9.1 ‐12.6 1.9 5.8 5.4 5.5
9 Western Visayas (VI) ‐2.2 ‐1.3 ‐1.7 8.6 9.1 9.0
10 Central Visayas (VII) ‐3.5 ‐1.1 ‐17.7 4.0 4.2 3.5
11 Eastern Visayas (VIII) ‐1.8 3.9 ‐2.9 2.9 3.2 3.2
12 Zamboanga Peninsula (IX) 1.6 ‐4.8 ‐7.3 12.5 12.8 11.9
13 Northern Mindanao (X) 2.9 2.4 ‐6.6 3.5 3.8 3.6
14 Davao Region (XI) 9.4 ‐2.5 ‐2.3 1.3 1.3 1.3
15 SOCCSKSARGEN (XII) 1.4 ‐11.2 9.3 7.1 6.7 7.4
16 Caraga ‐2.1 ‐8.5 ‐2.3 1.8 1.8 1.7
17 ARMM 1.2 ‐5.0 3.9 18.7 18.9 19.9p preliminary
r revised
Source: PSA
Share to total
productionREGION Growth rate

Key Regional Developments
2017 Report on Regional Economic Developments in the Philippines | 11
Construction
Construction. Construction activity weakened in
2017, posting a reversal from the double‐digit
growth rate achieved in the previous year. After
expanding for three consecutive years, the
number of approved building permits declined by
5.0 percent in 2017, from a growth of 12.1 percent
in 2016. Similarly, after a five‐year growth streak,
Construction activity slumps
Chart 7. Approved Building Permits Levels, 2013‐2017
Table 8. Total Number of Approved Building Permits Levels and growth rates, 2013‐2017
Source: PSA
2013 2014 2015 2016r
2017p 2013 2014 2015 2016
r2017
p
PHILIPPINES 120,775 126,875 132,006 147,998 140,605 ‐0.2 5.1 4.0 12.1 ‐5.0
1 NCR 13,948 13,381 12,863 13,166 11,583 0.7 ‐4.1 ‐3.9 2.4 ‐12.0
2 CAR 1,161 1,460 1,123 1,202 1,219 ‐1.7 25.8 ‐23.1 7.0 1.4
3 Ilocos Region (I) 7,060 7,511 7,990 8,825 10,481 ‐2.2 6.4 6.4 10.5 18.8
4 Cagayan Valley (II) 2,256 3,347 3,182 3,246 4,294 ‐15.0 48.4 ‐4.9 2.0 32.3
5 Central Luzon (III) 12,025 16,047 13,991 14,481 15,437 ‐11.0 33.4 ‐12.8 3.5 6.6
6 CALABARZON (IV‐A) 31,340 29,092 32,951 34,713 34,776 13.0 ‐7.2 13.3 5.3 0.2
7 MIMAROPA (IV‐B) 2,086 2,508 2,874 2,634 2,233 ‐6.0 20.2 14.6 ‐8.4 ‐15.2
8 Bicol Region (V) 3,177 2,830 3,487 3,513 3,009 6.0 ‐10.9 23.2 0.7 ‐14.3
9 Western Visayas (VI) 5,124 5,483 7,059 6,317 6,445 ‐21.0 7.0 28.7 ‐10.5 2.0
10 Central Visayas (VII) 13,168 12,440 12,824 14,801 11,219 ‐8.3 ‐5.5 3.1 15.4 ‐24.2
11 Eastern Visayas (VIII) 1,980 2,407 4,937 4,879 3,972 ‐15.1 21.6 105.1 ‐1.2 ‐18.6
12 Negros Island Region 9,686 5,916 ‐38.9
13 Zamboanga Peninsula (IX) 3,484 3,761 4,505 4,032 4,016 ‐9.2 8.0 19.8 ‐10.5 ‐0.4
14 Northern Mindanao (X) 7,698 8,119 8,599 9,378 7,960 1.6 5.5 5.9 9.1 ‐15.1
15 Davao Region (XI) 8,916 11,500 8,120 10,091 10,263 ‐2.3 29.0 ‐29.4 24.3 1.7
16 SOCCSKSARGEN (XII) 3,100 2,822 2,846 3,013 3,414 15.9 ‐9.0 0.9 5.9 13.3
17 Caraga 3,984 3,922 4,548 3,861 4,211 28.6 ‐1.6 16.0 ‐15.1 9.1
18 ARMM 268 245 107 160 157 26.4 ‐8.6 ‐56.3 49.5 ‐1.9
Note: Sum of details may not add up to totals due to rounding.
p Preliminary
r Revised to reflect data updates per PSA
Source: PSA
REGION Levels Growth rate
0
5,000
10,000
15,000
20,000
25,000
30,000
35,000
40,000
NCR
CAR I II III
IV‐A
IV‐B V VI
VII
VIII
NIR IX X XI
XII
Caraga
ARMM
2013 2014 2015 2016r 2017p

Key Regional Developments
12 | 2017 Report on Regional Economic Developments in the Philippines
construction of new residential buildings declined
by 9.4 percent in 2017, from a growth of 16.4
percent in 2016.1
Given significantly high growth rates posted in
2016, high base effect may have contributed to
the contraction of construction activity. Downside
factors to construction activity may also include
the acceleration of inflation from 1.3 percent in
2016 to 2.9 percent in 2017; weather‐related
disturbances such as flooding in parts of Visayas
1 The weakening of new residential construction is accompanied by a slight increase in residential real estate prices, as the residential real estate price index (RREPI) increased by 3.6 percent in 2017, on the back of a 6.5‐percent increase in prices of condominium units. While new residential construction in NCR contracted by
and Mindanao in early 2017 due to heavy rainfall
and the aftermath of typhoon Nina in December
2016; infrastructure damages from earthquakes
that struck Surigao del Norte, Batangas, and Leyte;
heightened peace and order concerns amid the
Marawi siege in May to October 2017; power
fluctuations and outages; delays in government
projects; and difficulties in domestic logistics,
especially in terms of inter‐island connectivity.
Among the regions, the decline in construction
activity is most apparent in geographic neighbors
Negros Island Region (NIR) and Central Visayas.
8.1 percent in 2016, the price of housing units increased by 4.8 percent, driven by a 6.0‐pecent increase in the price of condominium units. For the rest of the Philippines, a deceleration in the increase of real estate prices was noted at 2.7 percent, albeit a 10.5‐percent increase in the prices of condominium units.
Table 9. Total Number of New Residential Building ConstructionLevels and growth rates, 2013‐2017
2013 2014 2015 2016r
2017p 2013 2014 2015 2016 2017
PHILIPPINES 87,767 90,201 97,174 113,097 102,417 0.5 2.8 7.7 16.4 ‐9.4
1 NCR 7,071 6,772 6,435 6,587 6,055 ‐0.9 ‐4.2 ‐5.0 2.4 ‐8.1
2 CAR 842 1,041 826 938 885 0.2 23.6 ‐20.7 13.6 ‐5.7
3 Ilocos (I) 5,346 5,695 5,801 6,498 7,519 ‐4.3 6.5 1.9 12.0 15.7
4 Cagayan Valley (II) 1,580 2,500 2,189 2,265 3,336 ‐19.3 58.2 ‐12.4 3.5 47.3
5 Central Luzon (III) 8,298 11,852 10,617 10,685 10,768 ‐15.5 42.8 ‐10.4 0.6 0.8
6 CALABARZON (IV‐A) 25,059 21,480 25,842 27,829 26,785 20.3 ‐14.3 20.3 7.7 ‐3.8
7 MIMAROPA (IV‐B) 1,445 1,738 1,872 2,007 1,431 ‐3.6 20.3 7.7 7.2 ‐28.7
8 Bicol (V) 2,550 2,084 2,691 2,690 2,056 9.2 ‐18.3 29.1 0.0 ‐23.6
9 Western Visayas (VI) 3,834 3,851 5,192 4,848 4,992 ‐24.4 0.4 34.8 ‐6.6 3.0
10 Central Visayas (VII) 9,754 8,599 9,627 12,571 8,623 ‐13.6 ‐11.8 12.0 30.6 ‐31.4
11 Eastern Visayas (VIII) 1,214 1,569 3,857 3,671 2,586 ‐13.8 29.2 145.8 ‐4.8 ‐29.6
12 Negros Island Region 8,447 4,752 ‐43.7
13 Zamboanga Peninsula (I 2,571 2,868 3,669 3,456 3,154 ‐9.2 11.6 27.9 ‐5.8 ‐8.7
14 Northern Mindanao (X) 6,445 6,718 7,313 8,014 6,508 4.2 4.2 8.9 9.6 ‐18.8
15 Davao Region (XI) 6,711 9,168 5,964 7,906 7,940 4.9 36.6 ‐34.9 32.6 0.4
16 SOCCSKSARGEN (XII) 1,922 1,502 1,544 1,556 1,623 10.5 ‐21.9 2.8 0.8 4.3
17 Caraga 2,896 2,569 3,644 3,002 3,266 29.9 ‐11.3 41.8 ‐17.6 8.8
18 ARMM 229 195 91 127 138 24.5 ‐14.8 ‐53.3 39.6 8.7
Note: Sum of details may not add up to totals due to rounding.p Preliminary
r Revised to reflect data updates per PSA
Source: PSA
REGIONLevels Growth rate

Key Regional Developments
2017 Report on Regional Economic Developments in the Philippines | 13
Construction activity in NIR contracted by 38.9
percent in terms of approved building permits and
43.7 percent in terms of new residential
construction. Infrastructure activities were
negatively affected by weather‐related concerns,
such as frequent typhoons, seismic activities
including the phreatic eruption of Mt. Kanlaon, as
well as flash floods in the Banica and Okoy Rivers,
rendering some major spillways impassable to
vehicles.
For Central Visayas, approved building permits and
new residential construction declined by 24.2
percent and 31.4 percent respectively – a reversal
from the 15.4‐percent and 30.6 percent growth
rates registered during the previous year. It may
be noted that the decline in approved building
permits was more pronounced in the first half,
wherein the region posted 36.9‐percent
contraction, easing to 6.9 percent contraction in
the second half of the year. Heavy and frequent
rainfall across provinces in the region as well as
Metro Cebu’s worsening traffic congestion may
have contributed to the decline in construction
activity.
Upside factors to construction activity include the
government’s massive infrastructure investment
program; increased connectivity due to the
implementation of road, railway, and airport
projects; rise in retail developments on the back of
strong consumption and the expansion of the
middle‐class population; growing urbanization
especially in emerging business process
outsourcing (BPO) hubs; and increased housing
projects catering to low‐ and middle‐income
groups aided by financial support from
government through the Pag‐IBIG Affordable
Housing Program.
Positive regional contributions to construction
growth were minimal and mostly attributable to
Ilocos and Cagayan Valley.
In Ilocos, construction activity in terms of
approved building permits grew at an accelerated
pace, from 10.5 percent in 2016 to 18.8 percent in
2017. It may be noted that the region has posted
growth rates above 6 percent since 2014. Likewise,
growth in residential construction increased from
12.0 percent in 2016 to 15.7 percent in 2017.
Meanwhile, construction activity in Cagayan Valley
registered exponential growth in 2017, with new
building permits and residential construction
increasing by 32.3 percent and 47.3 percent
respectively in 2017, from 2.0 percent and 3.5
percent the previous year. Building projects in
these regions may have been boosted by
increased connectivity brought about by the
construction of various road networks, including
the Alaminos‐Bani Bypass Road, Candon City By‐
pass Road, and additional segments of the Tarlac‐
Pangasinan‐La Union Expressway in Ilocos Region
and the completion of 278.24 kilometers of
national, secondary, and tertiary roads in Cagayan
Valley. Construction activity in Ilocos may also be
propelled by a thriving BPO industry, with Metro
Chart 8. New Residential ConstructionLevels, 2013‐2017
Source: PSA
0
5,000
10,000
15,000
20,000
25,000
30,000
NCR
CAR
I
II
III
IV‐A
IV‐B V
VI
VII
VIII
NIR
IX X
XI
XII
Caraga
ARMM
2013 2014 2015 2016r 2017p

Key Regional Developments
14 | 2017 Report on Regional Economic Developments in the Philippines
Laoag recognized as one of the “Next Wave Cities”
for Information Technology and Business Process
Management (IT‐BPM).
Labor and Employment
Employment. The national employment rate
registered 94.3 percent in 2017, lower by 0.3
percentage points (ppts) from 94.6 percent in
2016. Among the 17 regions, those with the
highest level of employment were Cagayan Valley,
96.8 percent; ARMM, 96.6 percent; Zamboanga
Peninsula and SOCCSKSARGEN both at 96.0
percent.
Out of the 17 regions, employment in ARMM,
Central Visayas, and CALABARZON grew faster by
0.5 ppts, 0.4 ppts, and 0.2 ppts, respectively, in
2017 compared to 2016. Employment in Central
Visayas was boosted by the rapid growth in
transport network vehicle services such as Uber
and Grab as well as the full swing implementation
of major infrastructure projects such as the
Mactan‐Cebu International Airport Terminal 2, the
New Bohol Airport, and the Marina Town Project
in Dumaguete. Similarly, CALABARZON (the
largest source of labor force among all regions)
attributed its employment growth to the services
and industry sectors, particularly in manufacturing
boosted by the Government’s Manufacturing
Resurgence Program, as well as the increasing
number of economic zones in the region.
Unemployment rate rose by 0.3 percentage points
to 5.7 percent in 2017 from 5.4 percent in 2016.
Ilocos Region posted the highest unemployment
EmploymentUnemploy‐
menta
Underem‐
ploymentEmployment
Unemploy‐
mentb
Underem‐
ploymentEmployment
Unemploy‐
mentb
Underem‐
ployment
PHILIPPINES 93.7 6.3 18.5 94.6 5.4 18.3 94.3 5.7 16.1
1 NCR 91.5 8.5 10.0 93.3 6.7 8.7 92.6 7.4 9.3
2 CAR 95.2 4.9 20.8 95.6 4.4 23.1 95.7 4.3 14.8
3 Ilocos Region (I) 91.6 8.4 16.9 93.8 6.2 17.4 91.1 8.9 19.9
4 Cagayan Valley (II) 96.8 3.2 11.1 96.9 3.1 12.8 96.8 3.2 13.6
5 Central Luzon (III) 92.2 7.8 13.5 93.4 6.6 16.1 93.4 6.6 11.4
6 Calabarzon (IV‐A) 92.0 8.0 18.2 92.8 7.2 15.6 93.0 7.0 14.0
7 Mimaropa (IV‐B) 96.7 3.3 20.8 95.9 4.1 21.8 95.2 4.8 23.7
8 Bicol Region (V) 94.4 5.6 31.6 95.4 4.6 30.2 95.4 4.6 27.6
9 Western Visayas (VI) 94.6 5.4 21.3 95.2 4.8 19.3 94.6 5.4 16.7
10 Central Visayas (VII) 94.1 5.9 18.4 95.1 4.9 14.7 95.5 4.5 17.5
11 Eastern Visayas (VIII) 94.6 5.4 31.8 95.5 4.5 29.9 95.6 4.4 22.6
12 Zamboanga Peninsula (IX) 96.5 3.5 18.5 96.2 3.8 22.5 96.0 4.0 17.3
13 Northern Mindanao (X) 94.4 5.6 24.9 94.8 5.2 27.9 94.7 5.3 18.6
14 Davao Region (XI) 94.2 5.8 19.0 95.5 4.5 16.8 95.1 4.9 17.8
15 Soccsksargen (XII) 96.5 3.5 23.2 95.9 4.1 23.7 96.0 4.0 17.9
16 Caraga (XIII) 94.3 5.7 26.2 95.0 5.0 28.0 94.9 5.1 23.1
17 ARMM 96.5 3.5 11.1 96.1 3.9 13.5 96.6 3.4 7.0
a Without Leyte
b With Leyte
p Preliminary
Source: PSA
REGION
2015 2016 2017P
1 Starting with April 2016 round, the Labor Force Survey (LFS) adopted the population projection based on the 2010 Census o f Population and Housing (2010 CPH) while previous survey rounds were derived using 2000 CPH population projections.
Employment declines slightly
Table 10. Employment Indicators averages in percent

Key Regional Developments
2017 Report on Regional Economic Developments in the Philippines | 15
rate at 8.9 percent, driven by employment losses
in the agriculture sector. Unemployment rate was
also high in NCR at 7.4 percent and CALABARZON
at 7.0 percent. Conversely, the lowest
unemployment rates were registered in Cagayan
Valley at 3.2 percent, ARMM at 3.4 percent, and
SOCCSKSARGEN at 4.0 percent.
Meanwhile, underemployment eased in 11 regions
bringing national underemployment rate to 16.1
percent in 2017 from 18.3 percent in 2016. The
regions with notable improvements were
Northern Mindanao (18.6 percent from 27.9
percent), CAR (14.8 percent from 23.1 percent),
and Eastern Visayas (22.6 percent from 29.9 percent). The decline in underemployment was
due to the creation of higher quality jobs and
increase in full‐time wage and salaried workers in
private establishments as well as the reduction in
the closure of establishments and retrenchment.
On the other hand, the Bicol Region had the
highest underemployment rate at 27.6 percent, as
quality job generation is usually driven by
seasonality factors.

Key Regional Developments
16 | 2017 Report on Regional Economic Developments in the Philippines
Box Article Poverty Incidence and Unemployment Trends in the Regions
Poverty Incidence in the Regions Poverty incidence among individuals and families eased in all regions in the Philippines, except in the country’s capital, as shown in the latest Official Poverty Statistics for 2015 relative to the previous survey in 2012 (Figure 1). In the National Capital Region (NCR), poverty incidence among individuals remained the same as in 2012 at 3.9 percent, while poverty incidence among families increased to 2.7 percent in 2015 from 2.6 percent in 2012. Despite not having gone down in 2015, poverty incidence in the NCR has been the lowest among the regions. The highest poverty incidence among individuals in 2015 was recorded for the Autonomous Region in Muslim Mindanao (ARMM) at 53.7 percent, followed by Caraga (39.1 percent) and Eastern Visayas (38.7 percent). Poverty incidence in the ARMM over the past four surveys has consistently been significantly above national levels, which in 2015 was at 21.6 percent. Meanwhile, regions with the lowest rate of poverty next to the NCR were CALABARZON with poverty incidence at a single digit level (9.1 percent) followed by Central Luzon (11.2 percent). The most improved regions were Davao, SOCCSKSARGEN and Western Visayas as poverty incidence went down by 8.7, 7.4 and 6.7 percentage points, respectively. At the household level, the ARMM likewise recorded the highest poverty incidence in 2015, followed by Caraga and Eastern Visayas. Meanwhile, regions that exhibited the lowest poverty incidence among families over the past four poverty statistics releases were the NCR, CALABARZON, and Central Luzon.
Source: Philippine Statistics Authority (PSA)

Key Regional Developments
2017 Report on Regional Economic Developments in the Philippines | 17
Poverty Incidence and Unemployment Weakness in employment generation and the lack of sustainable income opportunities are among themajor factors cited as causing poverty in the Philippines.1 In such case, regions with the lowest/highestpoverty incidence should have the lowest/highest rate of unemployment. Based on the 2015 estimates of the Labor Force Survey (LFS), the regions with the lowestunemployment rates were Cagayan Valley (3.2 percent) followed by ARMM (3.4) as well as theZamboanga Peninsula and SOCCSKSARGEN (both at 4.0 percent). Meanwhile, regions with the highestrates of unemployment were Ilocos (8.9 percent), NCR (7.4 percent) and CALABARZON (7.0 percent).Interestingly, the regions which registered the lowest poverty incidence in 2015, i.e., NCR andCALABARZON, had the highest rates of unemployment (Figure 2). Meanwhile, ARMM which has thehighest poverty incidence among individuals posted the second lowest unemployment in 2017. Whydoes this seem counter‐intuitive?
Source: PSA
There are several factors that may explain this divergence (see trendlines in Figure 2) in poverty andunemployment rates. These include: (a) the conceptual relationship between poverty andunemployment; (b) how both indicators are measured; and (c) the underlying structure of employmentin the country. To explain the relationship of the two concepts of poverty and unemployment, Saunders (2002) showspossible combinations of poverty status and employment status (Figure 3).
Source: Saunders (2002)
The first quadrant in Figure 3 indicates that it is possible to be employed but considered poor, as may
be exemplified by the ARMM case. The low level of unemployment but high rate of poverty in the
ARMM can be attributed to the high proportion of employed persons in the agriculture sector as well
as those who are classified as self‐employed or unpaid family worker (SUFW), i.e., informal sector
1Asian Development Bank (ADB), 2009, “Poverty in the Philippines: Causes, Constraints and Opportunities”
FIGURE 3. RELATIONSHIP BETWEEN POVERTY AND EMPLOYMENT STATUS

Key Regional Developments
18 | 2017 Report on Regional Economic Developments in the Philippines
employment. This implies that people employed in the region are composed largely of those who workwith minimal or no income at all – incomes that fall below the per capita poverty threshold. A 2016report by the World Bank cited that in‐work poverty is pervasive in the Philippines due mainly to thehigh incidence of low‐pay.1 The report noted that workers employed in low‐skilled, low‐productivityjobs run a higher risk of poverty than the unemployed because the capacity to earn is quite low. In fact,in the past four poverty surveys, employed individuals belonging to poor families have consistentlyposted higher poverty incidence than the unemployed population, although the difference hasnarrowed through the years (Table 1).
Table 1. Poverty Incidence Among Employed and Unemployed (in %)
2006 2009 2012 2015
PHILIPPINES 26.6 26.3 25.2 21.6
Employed population 22.9 22.8 21.9 18.0
Unemployed population 16.5 16.8 18.7 16.4 Source: PSA
Meanwhile, the third quadrant covers those who are unemployed but not poor, as may be the case forthe NCR. This represents individuals who do not hold any job but may receive some form of “income”from family members.2 The World Bank report (2016) indicated that the unemployed are often thosewho are well‐educated young persons that come from well‐off families. Assessing the link between poverty and unemployment also depends significantly on how they aremeasured. Saunders (2002) underscored that the unit of analysis in poverty determination ishousehold income whereas for the labor force status it is the individual. In the Philippines, poverty incidence is based on the income derived from the Family Income andExpenditure Survey (FIES), which refers to total family income rather than individual income. The totalincome of a family with one or more members who are working is divided among the family membersto arrive at the per capita income of each member. This may be one reason why the ARMM registeredthe highest poverty incidence per individual as it registered the largest household size of 6.1 personscompared to the national average of 4.4 persons (Figure 4).3 By definition, all family members areconsidered poor if the per capita income falls below the poverty threshold.
Source: PSA
1 World Bank, January 2016, Republic of the Philippines Labor Market Review: Employment and Poverty 2 Family Income is defined as primary income and receipts from other sources received by all family members during thereference period, as participants in any economic activity or as recipients of transfers, pensions, grants, interests, food andnon‐food items received as gifts by the family. 3 Caution must be taken, however, in concluding that larger families tended to be poorer. There are a number of studiesdevoted into looking more closely at the relationship between household size and poverty.

Key Regional Developments
2017 Report on Regional Economic Developments in the Philippines | 19
Consideration should also be taken as to the nature and structure of employment in the country in theassessment of the nexus between poverty and unemployment. In terms of the class of workers, forexample, about a third of employed persons in the country are classified as self‐employed and unpaidfamily workers (SUFW, i.e., those without pay in own‐family operated farm or business). Based on areport by the Department of Labor and Employment (DOLE), SUFWs are those who work “underrelatively precarious circumstances” as they are less likely to have formal work arrangements, accessto benefits or social protection programs and, therefore more exposed to economic cycle risks.1 In addition, among those who are employed, 1 out of 6 are underemployed or those who would liketo work more hours to augment their earnings. Underemployment in the regions actually has astronger positive correlation with poverty incidence than unemployment (Figure 5). Both the WorldBank and Organization of Economic Cooperation and Development (OECD) cite that, from theperspective of poverty in the Philippines, underemployment is a bigger issue than unemployment.2
Source: PSA
Conclusion and policy implications This article aims to identify some of the gaps in understanding the relationship between poverty andunemployment in the Philippines from a regional perspective. At the outset, regional data on rates ofpoverty and unemployment prominently show divergence, challenging the widely‐held view that thelack of jobs is to blame for the high incidence of poverty in the country. Looking at some of the factors that explain this disparity, particularly based on regional data, offers astark inference – that people find themselves poor (i.e., falling below the poverty threshold) notbecause they do not work but mainly because they hold low quality jobs and receive very little earnings,if they get any at all. This has significant implications for poverty‐reduction policies and initiatives inthe Philippines. Poverty alleviation measures would therefore entail not only the creation of jobs butensuring the availability of better quality and more decent jobs. As a final point, discussions in this article bears emphasis that the poverty rate and employment statusare only two of the many features and facets of a country’s poverty situation. In the Philippines, therehas already been some extensive research devoted in the construction of a multi‐dimensional povertyindex (MPI) to allow for a more profound poverty assessment and more targeted intervention.3
1 MDGs Indicators on Employment: Proportion of Self‐Employed and Unpaid Family Workers in Total Employment, LabstatUpdates, December 2012 2 World Bank, January 2016, Republic of the Philippines Labor Market Review: Employment and Poverty; OECD, 2014,Philippine Country Note, extract from Economic Outlook for Southeast Asia, China and India 2014: Beyond the Middle‐IncomeTrap 3 Albis, Manuel Leonard and Jessmond Elviña (2017) “Employment Correlates of Multidimensional Poverty in the Philippines”
Key Regional Developments
20 | 2017 Report on Regional Economic Developments in the Philippines
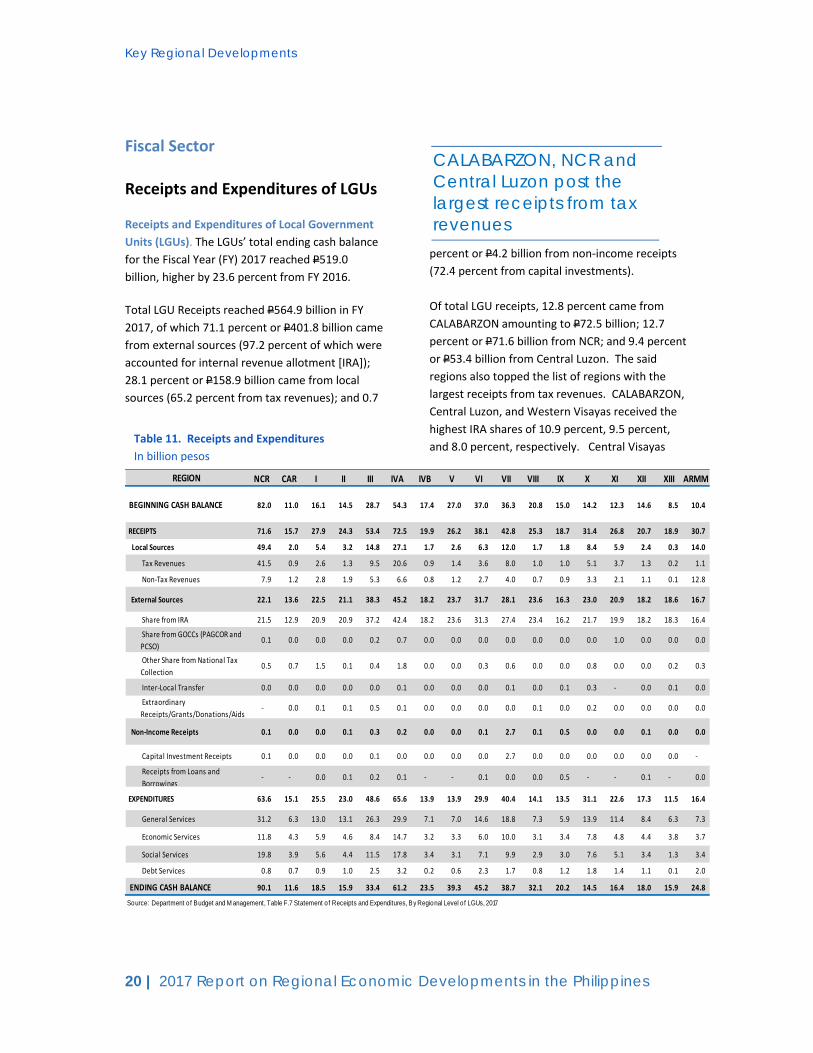
Fiscal Sector Receipts and Expenditures of LGUs
Receipts and Expenditures of Local Government
Units (LGUs). The LGUs’ total ending cash balance
for the Fiscal Year (FY) 2017 reached P519.0
billion, higher by 23.6 percent from FY 2016.
Total LGU Receipts reached P564.9 billion in FY
2017, of which 71.1 percent or P401.8 billion came
from external sources (97.2 percent of which were
accounted for internal revenue allotment [IRA]);
28.1 percent or P158.9 billion came from local
sources (65.2 percent from tax revenues); and 0.7
percent or P4.2 billion from non‐income receipts
(72.4 percent from capital investments).
Of total LGU receipts, 12.8 percent came from
CALABARZON amounting to P72.5 billion; 12.7
percent or P71.6 billion from NCR; and 9.4 percent
or P53.4 billion from Central Luzon. The said
regions also topped the list of regions with the
largest receipts from tax revenues. CALABARZON,
Central Luzon, and Western Visayas received the
highest IRA shares of 10.9 percent, 9.5 percent,
and 8.0 percent, respectively. Central Visayas Table 11. Receipts and Expenditures
In billion pesos
CALABARZON, NCR and Central Luzon post the largest receipts from tax revenues
NCR CAR I II III IVA IVB V VI VII VIII IX X XI XII XIII ARMM
82.0 11.0 16.1 14.5 28.7 54.3 17.4 27.0 37.0 36.3 20.8 15.0 14.2 12.3 14.6 8.5 10.4
71.6 15.7 27.9 24.3 53.4 72.5 19.9 26.2 38.1 42.8 25.3 18.7 31.4 26.8 20.7 18.9 30.7
49.4 2.0 5.4 3.2 14.8 27.1 1.7 2.6 6.3 12.0 1.7 1.8 8.4 5.9 2.4 0.3 14.0
Tax Revenues 41.5 0.9 2.6 1.3 9.5 20.6 0.9 1.4 3.6 8.0 1.0 1.0 5.1 3.7 1.3 0.2 1.1
Non‐Tax Revenues 7.9 1.2 2.8 1.9 5.3 6.6 0.8 1.2 2.7 4.0 0.7 0.9 3.3 2.1 1.1 0.1 12.8
22.1 13.6 22.5 21.1 38.3 45.2 18.2 23.7 31.7 28.1 23.6 16.3 23.0 20.9 18.2 18.6 16.7
Share from IRA 21.5 12.9 20.9 20.9 37.2 42.4 18.2 23.6 31.3 27.4 23.4 16.2 21.7 19.9 18.2 18.3 16.4
Share from GOCCs (PAGCOR and
PCSO) 0.1 0.0 0.0 0.0 0.2 0.7 0.0 0.0 0.0 0.0 0.0 0.0 0.0 1.0 0.0 0.0 0.0
Other Share from National Tax
Collection 0.5 0.7 1.5 0.1 0.4 1.8 0.0 0.0 0.3 0.6 0.0 0.0 0.8 0.0 0.0 0.2 0.3
Inter‐Local Transfer 0.0 0.0 0.0 0.0 0.0 0.1 0.0 0.0 0.0 0.1 0.0 0.1 0.3 ‐ 0.0 0.1 0.0
Extraordinary
Receipts/Grants/Donations/Aids ‐ 0.0 0.1 0.1 0.5 0.1 0.0 0.0 0.0 0.0 0.1 0.0 0.2 0.0 0.0 0.0 0.0
0.1 0.0 0.0 0.1 0.3 0.2 0.0 0.0 0.1 2.7 0.1 0.5 0.0 0.0 0.1 0.0 0.0
Capital Investment Receipts 0.1 0.0 0.0 0.0 0.1 0.0 0.0 0.0 0.0 2.7 0.0 0.0 0.0 0.0 0.0 0.0 ‐
Receipts from Loans and
Borrowings‐ ‐ 0.0 0.1 0.2 0.1 ‐ ‐ 0.1 0.0 0.0 0.5 ‐ ‐ 0.1 ‐ 0.0
63.6 15.1 25.5 23.0 48.6 65.6 13.9 13.9 29.9 40.4 14.1 13.5 31.1 22.6 17.3 11.5 16.4
General Services 31.2 6.3 13.0 13.1 26.3 29.9 7.1 7.0 14.6 18.8 7.3 5.9 13.9 11.4 8.4 6.3 7.3
Economic Services 11.8 4.3 5.9 4.6 8.4 14.7 3.2 3.3 6.0 10.0 3.1 3.4 7.8 4.8 4.4 3.8 3.7
Social Services 19.8 3.9 5.6 4.4 11.5 17.8 3.4 3.1 7.1 9.9 2.9 3.0 7.6 5.1 3.4 1.3 3.4
Debt Services 0.8 0.7 0.9 1.0 2.5 3.2 0.2 0.6 2.3 1.7 0.8 1.2 1.8 1.4 1.1 0.1 2.0
90.1 11.6 18.5 15.9 33.4 61.2 23.5 39.3 45.2 38.7 32.1 20.2 14.5 16.4 18.0 15.9 24.8
Source: Department o f Budget and M anagement, Table F.7 Statement o f Receipts and Expenditures, By Regional Level o f LGUs, 2017
EXPENDITURES
ENDING CASH BALANCE
REGION
BEGINNING CASH BALANCE
RECEIPTS
Local Sources
External Sources
Non‐Income Receipts

Key Regional Developments
2017 Report on Regional Economic Developments in the Philippines | 21
registered the highest non‐income receipts at P2.7
billion sourced from capital investments.
Meanwhile, total LGU Expenditures amounted to
P465.9 billion which were spent for general
services, 48.9 percent or P227.7 billion; social
services, 24.3 percent or P113.0 billion; economic
services, 22.1 percent or P103.0 billion; and debt
services, 4.7 percent or P22.1 billion.
In FY 2017, the regions that disbursed the largest
amount were CALABARZON at P65.6 billion, NCR
at P63.6 billion, and Central Luzon at P48.6 billion.
The said amounts comprised 14.1 percent, 13.6
percent, and 10.4 percent of the total nationwide
LGU expenditures, respectively. Most of the
expenditures from these regions were devoted to
general services.
Monetary Sector
Inflation
Inflation. Average annual inflation rates in most
regions escalated in 2017 compared to the
previous year. Of the 17 regions, 12 posted
notable increases from previous year’s inflation.
Despite the acceleration, majority (a total of 12) of
these regions’ inflation rates remained within the
national government’s inflation target range of 3.0
percent ± 1.0 percentage point during the year.
The regions that registered within‐target inflation
rates in 2017 include: Ilocos (2.0 percent),
Western Visayas (2.2 percent), Caraga (2.4
percent), Zamboanga Peninsula (2.4 percent),
CALABARZON (2.8 percent), Central Luzon (3.1
percent), Central Visayas (3.2 percent), Cagayan
Valley (3.4 percent), Northern Mindanao (3.4
percent), Davao (3.6 percent), Eastern Visayas (3.8
percent), and Metro Manila (4.0 percent).
The average annual inflation rates recorded in the
17 regions ranged from a low of 1.8 percent
(which was twice higher than the lowest average
inflation registered in 2016 of 0.9 percent) to a
high of 4.6 percent. The two regions which posted
the highest and above‐target annual average
inflation rates in 2017 were Bicol (4.6 percent) and
ARMM (4.5 percent). The rise in inflation in the
Bicol Region was attributed to higher oil prices,
which manifested into higher domestic prices for
both food and non‐food commodities due to
higher cost of production and the devastating
impact of typhoon Nina which hit the region in
December 2016 causing significant damage on
agricultural crops in the region. In ARMM, higher
inflation during the year was driven by faster price
Source: PSA
Inflation rates in the regions increase
Table 12. Inflation Rate
In percent
ALL ITEMS
PHILIPPINES 1.4 1.8 3.2
1 Metro Manila 1.0 1.2 4.0
Areas Outside Metro Manil 1.5 1.9 2.9
2 CAR 1.5 1.9 1.8
3 Ilocos Region (I) 1.4 1.8 2.0
4 Cagayan Valley (II) 2.0 3.0 3.4
5 Central Luzon (III) 1.3 2.2 3.1
6 CALABARZON (IV‐A) 0.9 0.9 2.8
7 MIMAROPA (IV‐B) 1.4 2.1 1.8
8 Bicol Region (V) 1.0 1.1 4.6
9 Western Visayas (VI) 2.3 2.2 2.2
10 Central Visayas (VII) 1.8 2.8 3.2
11 Eastern Visayas (VIII) 1.8 1.3 3.8
12 Zamboanga Peninsula (IX) 2.5 2.9 2.4
13 Northern Mindanao (X) 1.3 1.4 3.4
14 Davao Region (XI) 2.6 3.2 3.6
15 SOCCSKSARGEN (XII) 1.4 2.9 1.9
16 Caraga 2.5 1.9 2.4
17 ARMM 2.6 2.9 4.5
REGION 2015 2016 2017

Key Regional Developments
22 | 2017 Report on Regional Economic Developments in the Philippines
increases in food and non‐alcoholic beverages;
alcoholic beverages and tobacco; and housing,
water, electricity, gas and other fuels. Meanwhile,
three regions registered below‐target inflation
rates in 2017 namely CAR and MIMAROPA (both at
1.8 percent, respectively) and SOCCSKSARGEN (1.9
percent). The low average inflation rate in these
regions during the year was attributed to the
slower price increases in food and alcoholic
beverages; education; and restaurants and
miscellaneous goods and services contributed to
the deceleration in price hikes.
2 Approved foreign investments represent investment commitments and pledges by foreigners regardless of the percentage of ownership of the ordinary shares, which may be realized in the near future, while FDI refers to actual foreign investments generated, with the foreign
External Sector
Approved Foreign Investments
Approved foreign investments. As reported by
investment promotion agencies (IPAs), approved
foreign investments (FIs) in the country contracted
in 2017 by 51.8 percent, continuing the slide from
2016. Most of the regions (14 out of 17)
experienced declines in approved FIs.2
investors owning 10 percent or more of the ordinary shares. [Source: PSA. (2018). Foreign investments: fourth quarter 2017, In The Foreign Investments in the Philippines, 22 February 2018, Quezon City, Philippines.]
2015 2016 2017 2015 2016 2017
PHILIPPINES 31.2 ‐10.7 ‐51.8 100 100 100
1 NCR ‐34.4 10.1 ‐53.7 13.9 17.2 16.5
2 CAR 1,651.6 ‐6.2 ‐99.4 10.7 11.3 0.1
3 Ilocos Region (I) ‐‐ 737.7 66.7 0.3 2.8 9.6
4 Cagayan Valley (II) 74.2 263.4 ‐96.2 0.2 1.0 0.1
5 Central Luzon (III) ‐11.3 ‐39.6 ‐23.1 9.3 6.3 10.0
6 CALABARZON (IV‐A) 32.6 ‐18.4 ‐48.7 47.2 43.1 45.8
7 MIMAROPA (IV‐B) 69.7 ‐66.9 ‐24.9 1.6 0.6 0.9
8 Bicol Region (V) 444,202,139.8 ‐100.0 ‐‐ 0.8 0.0 0.2
9 Western Visayas (VI) 339.7 28.5 ‐25.9 2.9 4.2 6.5
10 Central Visayas (VII) 61.8 16.4 ‐55.2 4.8 6.2 5.8
11 Eastern Visayas (VIII) ‐94.7 ‐93.2 5,380.8 0.0 0.0 0.1
12 Zamboanga Peninsula (IX) ‐‐ ‐‐ ‐100.0 0.0 0.1 0.0
13 Northern Mindanao (X) 45.4 ‐60.7 36.9 1.6 0.7 2.0
14 Davao Region (XI) 243.2 ‐25.8 ‐46.5 0.7 0.6 0.7
15 SOCCSKSARGEN (XII) 115.8 69.0 ‐94.0 2.6 5.0 0.6
16 Caraga 88.9 ‐55.2 ‐70.7 1.3 0.6 0.4
17 ARMM ‐100.0 ‐‐ ‐33.1 0.0 0.5 0.7
Several Locations 2
1,887,465.4 ‐100.0 ‐‐ 2.1 0.0 0.1
No Site Yet 3
‐‐ ‐100.0 ‐‐ 0.0 0.0 0.0
1 Locations not indicated in the raw data submitted to PSA.
2 As indicated in the raw data submitted to PSA.
p preliminary
‐‐ infinite growth rate
Source: PSA
Growth Rate Share to total
Coverage of reports: Authority of the Freeport Area of Bataan (AFAB), Board of
Investments (BOI), BOI‐Autonomous Region of Muslim Mindanao (BOI‐ARMM),
Clark Development Corporation (CDC), Cagayan Economic Zone Authority
(CEZA), Philippine Economic Zone Authority (PEZA), and Subic Bay Metropolitan
REGION
Approved foreign investments contract…
Table 13. Approved Foreign InvestmentsGrowth Rates and Share to Total

Key Regional Developments
2017 Report on Regional Economic Developments in the Philippines | 23
Eastern Visayas region posted the highest growth
(>1,000 percent) rate in approved FIs followed by
Ilocos Region with 66.7 percent and Northern
Mindanao with 36.9 percent. Biggest declines in
approved FIs were observed in Zamboanga
Peninsula (100.0 percent), CAR (99.4 percent) and
Cagayan Valley (96.2 percent) after a few years of
strong growth.
In terms of share to total approved FIs, top
location regions in 2017 were CALABARZON (45.8
percent), NCR (16.5 percent), Central Luzon (10.0
percent) , Ilocos Region (9.6 percent) and Western
Visayas (6.5 percent). Majority of the approved FIs
in Region IV‐A and Region III were intended for
projects in the manufacturing industry. For NCR,
the projects would be mostly in real estate
activities.
Approved investments of foreign and Filipino
nationals. Combined approved foreign and Filipino
nationals’ investments in the country grew by 32.5
2015 2016 2017 2015 2016 2017
PHILIPPINES ‐9.1 ‐0.1 32.5 100.0 100.0 100.0
1 NCR ‐45.9 34.7 ‐19.4 17.2 23.2 14.1
2 CAR 1,100.8 117.2 ‐95.7 3.8 8.4 0.3
3 Ilocos Region (I) ‐26.0 495.3 256.1 0.4 2.5 6.8
4 Cagayan Valley (II) 122.9 ‐1.1 163.6 0.8 0.8 1.6
5 Central Luzon (III) ‐58.7 49.8 101.6 8.7 13.1 19.9
6 CALABARZON (IV‐A) 21.1 ‐33.0 106.3 39.5 26.5 41.2
7 MIMAROPA (IV‐B) ‐52.9 ‐6.8 ‐33.3 0.9 0.8 0.4
8 Bicol Region (V) 514.6 ‐51.9 23.1 1.4 0.7 0.6
9 Western Visayas (VI) 198.5 ‐50.8 ‐35.1 12.2 6.0 2.9
10 Central Visayas (VII) 168.4 24.7 ‐12.1 6.0 7.4 4.9
11 Eastern Visayas (VIII) 262.9 ‐88.9 ‐9.2 1.1 0.1 0.1
12 Zamboanga Peninsula ( ‐‐ 4,314.6 ‐100.0 0.0 0.1 0.0
13 Northern Mindanao (X) ‐75.0 ‐3.3 ‐18.0 2.3 2.2 1.4
14 Davao Region (XI) ‐48.5 276.4 ‐52.1 1.1 4.1 1.5
15 SOCCSKSARGEN (XII) 224.8 78.3 27.9 1.9 3.4 3.3
16 Caraga ‐24.9 ‐49.3 117.1 0.6 0.3 0.5
17 ARMM ‐32.4 ‐19.2 53.2 0.4 0.3 0.4
0.0 0.0
Several Locations 1
35.3 ‐100.0 ‐‐ 1.7 0.0 0.0
No Site Yet 2
‐‐ ‐100.0 ‐‐ 0.0 0.0 0.0
1 Locations not indicated in the raw data submitted to PSA.
2 As indicated in the raw data submitted to PSA.
p preliminary
‐‐ infinite growth rate
Source: PSA
Share to total
Coverage of reports: Authority of the Freeport Area of Bataan (AFAB), Board of
Investments (BOI), BOI‐Autonomous Region of Muslim Mindanao (BOI‐ARMM), Clark
Development Corporation (CDC), Cagayan Economic Zone Authority (CEZA), Philippine
Economic Zone Authority (PEZA), and Subic Bay Metropolitan Authority (SBMA).
REGIONGrowth rate
Table 14. Approved Foreign and Filipino InvestmentsGrowth Rates and Share to Total

Key Regional Developments
24 | 2017 Report on Regional Economic Developments in the Philippines
percent in 2017, after consecutive declines in 2015
and 2016. Ilocos Region led the recovery with a
growth of 256.1 percent, Cagayan Valley with
163.6 percent and Caraga with 117.1 percent.
Biggest declines in approved FIs were observed in
Zamboanga Peninsula (100.0 percent), CAR (95.7
percent) and Cagayan Valley (96.2 percent).
In terms of share to total foreign and Filipino
approved investments, top location regions in
2017 were CALABARZON (41.2 percent), Central
Luzon (19.9 percent), NCR (14.1 percent), Ilocos
Region (6.8 percent) and Western Visayas (4.9
percent). Majority of the investments in NCR were
intended for real estate activities. For
CALABARZON and Central Luzon, the ventures
would be mostly in electricity, gas, steam and air
conditioning supply and transportation and
storage, respectively.
Financial Sector
Banking and Microfinance
Banking. While aggregate credit activity showed
improvement, the increase in deposits outpaced
the rise in loan portfolios resulting in lower loans‐
to‐deposits ratios (LDR) for all regions in 2017.
NCR registered the highest LDR at 89.0 percent in
2017, followed by SOCCSKSARGEN (49.4 percent)
and Central Visayas (45.6 percent). The high LDRs
in these regions reflected banks’ greater efficiency
in channeling deposits to lending activities.
Deposit liabilities in 2017 of BSP‐supervised
institutions in all regions managed to post
growths. Robust deposit liabilities upticks were
observed in Western Visayas (90.4 percent),
ARMM (30.6 percent) and MIMAROPA (23.5
percent). Meanwhile, declines in LDRs were
observed in Zamboanga Peninsula, ARMM and
Davao Region.
…while combined approved foreign and Filipino investments expand
Increase in bank deposits outpaces increase in loan portfolio
Table 15. Loans‐to‐Deposits Ratio
In percent
Deposit liabilities continue to grow
2015 2016 2017
PHILIPPINES 63.2 65.0 70.6
1 NCR 79.8 81.8 89.0
2 CAR 14.7 14.1 13.7
3 Ilocos Region (I) 23.0 22.5 24.5
4 Cagayan Val ley (I I ) 40.6 43.0 43.4
5 Centra l Luzon (I I I) 28.2 29.6 33.3
6 CALABARZON (IV‐A) 19.0 19.6 23.4
7 MIMAROPA (IV‐B) 1/
32.7 33.7 33.2
8 Bicol Region (V) 32.5 34.1 33.2
9 Western Visayas (VI) 27.6 28.1 30.8
10 Centra l Visayas (VII) 40.2 42.4 45.6
11 Eastern Visayas (VIII) 25.4 24.8 26.7
12 Negros Is land Region 2/
25.7 27.5 ‐
13 Zamboanga Peninsula (IX) 26.0 29.8 25.3
14 Northern Mindanao (X) 29.3 32.4 33.3
15 Davao Region (XI) 35.2 42.5 40.8
16 SOCCSKSARGEN (XI I) 38.5 46.5 49.4
17 Caraga 29.0 32.5 32.1
18 ARMM 17.5 15.8 13.9
REGION
Details may not add up to to tals due to rounding-off
Source: SDC, SES-BSP
1/ Under Administrative Order No. 129 Palawan was reclassified from Region VI to M imaropa effective August 31, 2007.
2/ Negros Island Region (NIR) created under Executive Order No. 183 d t d 29 M 2015 d f th i f N O id t l

Key Regional Developments
2017 Report on Regional Economic Developments in the Philippines | 25
In terms of share to total deposit liabilities, more
than half are concentrated in the NCR (67.3
percent). Other top regions with high share of
deposit liabilities were CALABARZON (6.9 percent),
Central Luzon (5.1 percent), Central Visayas (5.0
percent), and Western Visayas (2.7 percent). The
NCR continued to have the highest number of
banks relative to the total number of
cities/municipalities with a density ratio of 214.6
percent in 2017. Following NCR were
CALABARZON and Central Luzon with density
ratios of 12.2 percent and 9.3 percent,
respectively. The density ratios of all regions have
increased compared to the 2016 levels. This
indicates that more banks are able to provide
services to a greater number of
cities/municipalities in their areas.
Microfinance. The number of microfinance service
providers in the country steadily increased for
most regions, reaching 1,057 in 2017, a growth of
29.5 percent.
2015 2016 2017 2015 2016 2017
PHILIPPINES 9,165,412 10,491,828 11,704,683 8.4 14.5 11.6
1 NCR 6,194,270 7,069,117 7,879,151 4.7 14.1 11.5
2 CAR 83,579 96,425 110,175 16.6 15.4 14.3
3 Ilocos Region (I) 158,033 185,367 204,110 18.4 17.3 10.1
4 Cagayan Valley (II) 100,826 113,997 128,293 17.8 13.1 12.5
5 Central Luzon (III) 455,998 527,290 601,811 16.8 15.6 14.1
6 CALABARZON (IV‐A) 620,919 731,257 812,384 16.0 17.8 11.1
7 MIMAROPA (IV‐B) 1/
54,575 65,056 80,335 22.3 19.2 23.5
8 Bicol Region (V) 107,426 124,626 140,314 18.5 16.0 12.6
9 Western Visayas (VI) 149,948 167,858 319,543 ‐30.8 11.9 90.4
10 Central Visayas (VII) 463,518 505,395 582,732 7.6 9.0 15.3
11 Eastern Visayas (VIII) 84,925 94,334 109,184 20.3 11.1 15.7
12 Negros Island Region 2/
142,009 160,275 12.9
13 Zamboanga Peninsula (IX) 83,613 95,866 107,690 17.9 14.7 12.3
14 Northern Mindanao (X) 132,285 152,816 172,437 15.4 15.5 12.8
15 Davao Region (XI) 174,259 214,789 240,357 16.0 23.3 11.9
16 SOCCSKSARGEN (XII) 93,771 108,077 124,496 16.5 15.3 15.2
17 Caraga 55,809 69,266 78,591 17.4 24.1 13.5
18 ARMM 9,649 10,017 13,079 27.4 3.8 30.6
Highest 6,194,270 7,069,117 7,879,151
Lowest 9,649 10,017 13,079
National Average 174,773 201,336 239,096
(excluding National Capital Region)1/ Under Administrative Order No. 129 Palawan was reclassified from Region VI to M imaropa effective August 31, 2007.
2/ Negros Island Region (NIR) created under Executive Order No. 183 dated 29 M ay 2015, composed o f the provinces of Negros Occidental (formerly from Region VI Western Visayas) and Negros Oriental (formerly from Region VII Central Visayas)
Details may not add up to to tals due to rounding-off
Growth rateREGION
Levels
Source: SDC,SES,BSP
Table 16. Deposit Liabilities
Levels and Growth rate
Bank density consistently improves
Number of microfinance-oriented banks surges

Key Regional Developments
26 | 2017 Report on Regional Economic Developments in the Philippines
Central Visayas led the regions with the growth in
microfinance‐oriented banks or MOBs (228.6
percent) in 2017, followed by Cagayan Valley
(185.7 percent) and SOCCSKSARGEN (180
percent). The number of MOBs in Northern
Mindanao and NCR both declined, as they posted
5.9 percent and 5.8 percent contractions,
respectively. In terms of share to total MOBs,
regions with most microfinance banks were
CALABARZON (26.9 percent), Bicol (12.7 percent),
Western Visayas (9.9 percent), Central Luzon (8.0
percent) and Ilocos Region (7.4 percent).
Meanwhile, outstanding microfinance loans
extended by the banking system likewise grew by
24.5 percent in 2017. Top regions that posted
strong loan growth were CAR (77.4 percent),
Central Luzon (45.1 percent), Zamboanga
Peninsula (44.9 percent) and NCR (44.3 percent).
However, microfinance loans in MIMAROPA and
Ilocos Region fell by 31.7 percent and 27.6
percent, respectively.
In terms of share to total microfinance loans
outstanding, majority were in CALABARZON (72.8
percent).
The number of microfinance borrowers likewise
experienced an uptick in 2017 by 16 percent.
Regions with the most growth in the number of
borrowers were Central Visayas (30.4 percent),
CALABARZON (20.5 percent) and Zamboanga
Peninsula (17.8 percent). However, the number of
microfinance borrowers fell mostly in Ilocos
Region (40.9 percent), MIMAROPA (16.9 percent)
and NCR (9.3 percent).
Similar to total microfinance loans outstanding,
majority of microfinance borrowers were located in
CALABARZON (79.4 percent).
REGION 2015 2016 2017
PHILIPPINES 6.6 6.8 7.2
1 NCR 198.8 206.1 214.6
2 CAR 2.1 2.1 2.3
3 Ilocos Region (I) 3.9 4.2 4.7
4 Cagayan Valley (II) 3.7 3.8 4.2
5 Central Luzon (III) 2/
8.4 8.8 9.3
6 CALABARZON (IV‐A) 3/
11.4 11.7 12.2
7 MIMAROPA (IV‐B) 3/
3.4 3.7 3.8
8 Bicol Region (V) 3.5 3.8 4.1
9 Western Visayas (VI) 3/
4.2 4.5 5.2
10 Central Visayas (VII) 5.8 5.9 6.0
11 Eastern Visayas (VIII) 1.4 1.5 1.6
12 Negros Island Region 4/
4.9 5.2 ‐
13 Zamboanga Peninsula (IX) 3.0 3.1 3.1
14 Northern Mindanao (X) 4.0 4.1 4.3
15 Davao Region (XI) 8.3 8.7 9.1
16 SOCCSKSARGEN (XII) 4.4 4.6 5.0
17 Caraga 3.0 2.8 2.9
18 ARMM 0.2 0.2 0.2
Source: SDC, SES-BSP
1/ Ratio o f the Number o f Banking Offices to the Number o f M unicipalities and Cities Per Region
2/ Inclusive of the province of Aurora effective M ay 17, 2002 as provided under Executive Order No. 103
3/ Executive Order No. 103 dated M ay 17, 2002 divided Region IV (Southern Tagalog) into Region IV-A (CALABARZON) and Region IV-B (M IM AROPA). Under Administrative Order No. 129 Palawan was reclassified from Region VI to M IM AROPA effective August 31, 2007.
4/ Negros Island Region (NIR) created under Executive Order No. 183 dated 29 M ay 2015, composed of the provinces of Negros Occidental (formerly from Region VI Western Visayas) and Negros Oriental (formerly from Region VII Central Visayas)
Table 17. Bank Density Ratio
In percent Table 18. Number of Microfinance‐Oriented
Banks

Opportunities and Challenges
2017 Report on Regional Economic Developments in the Philippines | 27
CORDILLERA ADMINISTRATIVE REGION
Opportunities Development of a ₱690,000 mini‐retailing
trading center for organic products received by Barangay Loacan Organic Farmers Association (BLOFA) of Sitio Bacong, Loacan, Itogon, to increase production of organic products.
Strenghtening agri‐industrial development through the establishment of the Eastern Kalinga Growth Center (EKGC), which is part of the region’s spatial strategy of establishing two primary and regional growth centers in the region: the BLISTT (Baguio City‐La Trinidad‐Itogon‐Sablan‐Tuba‐Tublay) area as the southern growth node and Eastern Kalinga (Tabuk‐Pinukpuk‐Rizal) as the northern growth node.
Proposed establishment of a Regional Research and Development Center for Innovative Science and Engineering. This project seeks to fill the region’s gap in facilities and equipment needed for basic and scientific research, innovations, and trainings and make these available to the entire Cordillera region and its neighboring regions.
Commitment from the Cordillera Regional Development Council (RDC‐CAR) and private sector stakeholders in restoring commercial operations of the Baguio Airport.
Funding of the study “Estimating the Urban Carrying Capacity of Baguio City” by the National Economic and Development Authority (NEDA) Research and Development (R&D) Program. This study is in response to incessant calls by the region’s development stakeholders to assess the City’s population carrying capacity. The study will help NEDA, the City Government, and key development stakeholders formulate more responsive plans, programs and policies that would help ensure the sustainability of the City’s urban environment without causing serious degradation and irreversible damage.
Approval of the Integrated Management and Development Plans of Abra, Agno and Cagayan River Basins by RDC‐CAR. These plans support the region’s role as the Watershed Cradle of Northern Philippines.
CAR

Opportunities and Challenges
28|2017 Report on Regional Economic Developments in the Philippines
CORDILLERA ADMINISTRATIVE REGION
Challenges Need for the preservation of the organic
production of the heirloom rice of the region, through its Heirloom Rice Project (HRP) by the Department of Agriculture (DA) Cordillera, in partnership with the Agriculture Training Institute (ATI).
Unbalanced economic growth since the trade and industry sector is concentrated in Baguio City.
Need for prioritization of development activities, which are part of the BLISTT Action Agenda 2016‐2019 as follows: a) integrated engineered sanitary landfill for Baguio City and the Municipalities of La Trinidad, Itogon, Sablan, Tuba, and Tublay; b) preparation of a BLISTT tourism brochure; c) establishment of ecozones in the BLISTT; d) and the completion of the BLISTT Outer and Inner Circumferential Roads.
CAR

Opportunities and Challenges
2017 Report on Regional Economic Developments in the Philippines | 29
ILOCOS
Opportunities Agricultural Credit Policy Council’s (ACPC’s)
Production Loan Easy Access (PLEA) grant of ₱20 million to the Nueva Segovia Consortium of Cooperatives (NSCC) as credit conduits to farmers engaged in onion and garlic growing in the region. The PLEA program is a special credit program designed by the DA to provide fast, convenient and affordable credit window for farmers and fisherfolk to boost the productivity and income of the farmer‐members.
Construction of a ₱44 million flood mitigation structure at Badoc Bridge, Badoc, Ilocos Norte in Q4 2017, to support local farmers in their farming and trade activities.
Information drive on quality production of
the newly improved flavor of Virginia tobacco by the National Tobacco Administration (NTA) was held in all tobacco‐growing municipalities in the region. Moreover, NTA's Integrated Farming and Other Income Generating Activities Project (IFOIGAP), which aims to improve the volume and quality of production for tobacco and other crops, will augment the income of local farmers.
Implementation of the following projects by the Department of Public Works and Highways (DPWH): a) rehabilitation of the Candon‐Salcedo‐Del Pilar Road; b) rehabilitation of concrete roads; c) slope protection; and d) Portland Cement Concrete Pavement (shoulder) and drainage.
Implementation of various agricultural programs/projects by the Provincial Governments of Ilocos Norte and Ilocos Sur, as follows: o Continuous implementation of the
Development of international cruises by the Ilocos Norte Tourism Office (INTO) and Small to Medium Enterprises (SME) Office (Superstar Virgo, under Star Cruises).
Implementation of the Nurses Development Program (NDP) of the Department of Health (DOH) is expected to increase employment in Ilocos Norte and Ilocos Sur.
Construction of the US$390 million mega‐economic zone in Pangasinan, a 30‐year program that will initially benefit 10 municipalities, including Dagupan City, to be undertaken by a consortium of big foreign companies from China, Singapore and Taiwan.
The opening of Binalonan to Pozorrubio segment of the Tarlac‐Pangasinan‐La Union Expressway by end‐2017, to spawn more economic developments in Pangasinan and adjacent provinces.
Opening of shopping malls and recreational buildings in Dagupan City and Urdaneta City.
Distribution of farming equipment to farmers’ associations or at least 138 farmers in the Province of Ilocos Sur. This is part of the DOLE Integrated Livelihood and Emergency Employment Program (DILEEP), the agency’s contribution to the government’s agenda of inclusive growth, which is expected to boost entrepreneurial activities that will create more employment opportunities in barangays.
Irrigation of 12,000 hectares of farmlands benefitting 10,000 farmers by Agno River Irrigation System Extension Project (ARISEP) in end‐2018.
Region I

Opportunities and Challenges
30|2017 Report on Regional Economic Developments in the Philippines
Opportunities Integrated Pest/Nutrient Management, and conduct of trainings, technology demonstrations, and technical assistance to local farmers, fisher folks and livestock growers.
o Provision of crop production facilities such as farm tractor, rice reaper, seed spreader/cleaner, corn sheller, combined rice thresher/harvester, moisture meter, hammer mill, cassava grater and pressor, and vacuum pack sealer to local farmers; and fisheries production facilities/fishing paraphernalia to fishpond and fish cage operators.
o Distribution of hybrid/certified rice/corn seeds, planting materials, seedlings (cacao, fruit trees, coffee, mungbeans, garlic, onion, various vegetables and fruits), organic and inorganic fertilizers to local farmers.

Opportunities and Challenges
2017 Report on Regional Economic Developments in the Philippines | 31
ILOCOS
Challenges Decline in the mango production by 20
percent in the City of San Carlos, Pangasinan.
Massive infestation of worms on onion plants, with damages estimated at ₱75.0 million (91 percent or 274 hectares infected) in various municipalities of Pangasinan.
Shortage of skilled workers in carpentry, masonry, machine operators, heavy equipment operators, and welders for the simultaneous construction of bridges, highways and school buildings.
Region I

Opportunities and Challenges
32|2017 Report on Regional Economic Developments in the Philippines
CAGAYAN VALLEY
Opportunities Implementation of the road projects under
the Philippine Rural Development Program (PRDP) Phase 2 will provide key infrastructure, facilities, technology and information that will increase income, productivity and competitiveness of small farmers and fisherfolks in the countryside.
Completion of the dairy processing plant in the Province of Isabela will create marketing opportunities for dairy products which will spur development in the dairy industry and other economic activities in the area.
Completion of the rehabilitation and extension of the Mallig River Irrigation System (Mallig RIS), contributing to additional palay production.
Completion of the 2017 National Greening Program (NGC) (covering seedling production, procurement and plantation) of the Department of Environment and Natural Resources (DENR)‐Region 2 will help in the attainment of food security, land productivity, poverty reduction, self‐sufficiency in wood and agro‐forestry products, environmental stability and climate change mitigation and adaptation in the Region.
Replacement of the old Sisim Bridge (₱52.2 million), located in San Agustin, Isabela, will play a major function in the interplay of agricultural, industrial and tourism growth and exchanges between the Municipalities of San Agustin, Jones, and Echague in Isabela and towns of Madella and Nagtipunan in Quirino.
Implementation of the approved Cagayan Valley Regional Development Plan (CVRDP) 2017‐2022 will serve as the first concrete step toward realizing the Cagayan Valley Region as the “Prime Water Resource, Agro‐Industrial Hub, and Emerging Tourism Destination” in the country.
On‐going and future development plans and programs which will create vast opportunities:
“Full Aerodome Certificate” by the Civil Aviation Authority of the Philippines (CAAP) to the Cagayan North International Airport (CNIA) in 2017
Memorandum of Understanding between CEZA and Traders Holding Co. Ltd. of Japan to develop CEZA into a premier FinTech hub for financial technologies
Infrastructure projects vital to the increasing intra‐Asian trade transactions (medical center, corporate center, convention center, boutique hotel and cyber park)
CEZA’s industrial, agro‐industrial, commercial and tourism projects for Northern Luzon (US$161 billion): Re‐development and Rehabilitation of
Port Irene (point of entry for Northern Luzon) and modernization of ports of Aparri and Claveria (sub‐logistics hub) and a six‐lane expressway linking the new airport to Port Irene to towns in Tuguegarao City.
Region II

Opportunities and Challenges
2017 Report on Regional Economic Developments in the Philippines | 33
Opportunities Concreting of the Lullutan‐Cabanungan Road
will improve transport mobility of residents to move agricultural products among barangays, municipalities and cities. The completed ₱15.9‐million project will provide an easier access and comfort to the motorists and residents since the road section is a gateway to the western barangays in the Municipality of Gamu.
A parallel railway system for passengers and cargo to provide better connectivity and a faster, cheaper and more efficient transport of goods and commodities in and out of the Zone.
Re‐opening of the Bagabag Airport in Nueva Vizcaya which will cater to the Clark‐Bagabag‐Clark route is expected to boost tourism.
Opening of new malls and recreational centers.
Completion of the Gattaran Flood Control and gabion retaining walls, which amounted to ₱73.0 million and ₱102.0 million, respectively. These projects are built to mitigate extensive flooding in Cagayan River Basin and low‐lying areas of Nueva Vizcaya.

Opportunities and Challenges
34|2017 Report on Regional Economic Developments in the Philippines
CAGAYAN VALLEY
Challenges Need to develop climate‐resilient crop
varieties and adaptive technologies to counter massive effects of unpredictable climate disturbances to the agricultural sector of the region.
Illegal poaching and fishing are still rampant which cause damage and compromise security and protection of the northern seas.
Low level of investments that can be attributed to the following: a) lack of infrastructure; b) high production cost; c) unstable supply of raw materials due to lack of connectivity between production areas and processing centers; d) poor handling, packaging and delivery; e) insufficient technical know‐how and trainings on entrepreneurship; and f) lack of access to easy credit, financial packages and modern technology to boost production and income.
Lack of an all‐weather airport which should be equipped with advanced navigational systems and upgraded features (e.g. visual flight routes) for all‐weather and night landing. Moreover, runways are limited and below the standard size for larger aircrafts.
Region II

Opportunities and Challenges
2017 Report on Regional Economic Developments in the Philippines | 35
CENTRAL LUZON
Opportunities Hosting of the “Binhi ng Pag‐asa Program”,
in collaboration with the Agricultural Training Institute ‐ Regional Training Center III (ATI‐RTC III), which aimed to engage young farmers in proper farming. Lectures were provided on vermi‐composting, nursery management, organic concoctions, harvest and post‐harvest handling, as well as leadership and organic agriculture practitioners and experts.
Development of DA’s projects, as follows: a) construction of an onion research laboratory in Bongabon to increase the yield of local farmers and to introduce alternatives (shallots instead of seeds and drip irrigation through solar power generation) and b) construction of a ₱302‐million biotechnology center in Muñoz, to improve crop productivity and create varieties.
Completion of a ₱2.1 billion infrastructure projects (200‐hectare portion of the Tipo area) which include the following: a) 19.6 kilometers of national roads; b) 88 lineal meters of bridges; c) 31 flood control structures; and d) 105 other infrastructure projects.
Completion of a 12.2 kilometer‐farm‐to‐market roads which amounted to ₱105.0 million.
Conduct of training sessions by Department of Trade and Industry (DTI) under its Small and Medium Enterprises Roving Academy (SMERA) Program to prepare Central Luzon entrepreneurs to bigger markets and scale up the operations of micro, small, and medium enterprises in the region.
Construction of a ₱2.6 billion tourism estate which include a residential complex, named
Expansion of the Clark International Airport (CIA) with a new passenger terminal building and a link expressway, which may allow additional flights from international carriers.
Development of the Clark Green City (CGC) Project in Clark Freeport Zone, Pampanga, which envisioned helping decongest main urban centers.
Production of four Very Large Crude‐oil Carriers (VLCCs) by Hanjin Heavy Industries and Construction‐Philippines (HHIC‐Phil) in Subic Bay Freeport Zone (SBFZ). This huge project is estimated to create additional job opportunities for more than 32,000 Filipino workers and is being recognized as a world‐class shipyard with competitive edge.
Proposed construction by the Subic Bay Metropolitan Authority (SMBA) of the Subic‐Clark railway project by China Harbor Engineering Co. Ltd. (CHEC).
Development of a ₱3.6‐billion golf course, hotel and leisure facilities complex (200‐hectare portion of the Tipo Area) in the Subic Bay Freeport by a Korean‐led company.
Establishments of four (4) Negosyo Centers (NC) in Bataan. Negosyo Centers are responsible for promoting ease of doing business and facilitating access to services for MSMEs.
Region III

Opportunities and Challenges
36|2017 Report on Regional Economic Developments in the Philippines
Opportunities as “the Sharp Clark Hills”. This is a joint venture of South Korea’s POSCO Engineering and Construction Co. Ltd. and JB Cresta, which is expected to employ 500 construction workers and 50 to 70 regular workers once operational.

Opportunities and Challenges
2017 Report on Regional Economic Developments in the Philippines | 37
CENTRAL LUZON
Challenges The bird flu outbreak (H5N6 strain or avian
flu) has forced authorities to cull more than 600,000 chickens, ducks and quails in the affected Provinces (Pampanga and Nueva Ecija), thus, curtailing the growth of the poultry industry in the region.
Inadequate and low standard tourism facilities in Nueva Ecija as a major setback in promoting the tourism industry in the Province. Likewise, tourism personnel and front liners are not equipped with proper training to handle tourism planning and promotion.
The risk of damage to natural resources in the Province of Aurora has increased due to the construction of new resorts extending to the reserved forest areas and salvage zones.
Region III

Opportunities and Challenges
38|2017 Report on Regional Economic Developments in the Philippines
CALABARZON
Opportunities Ecozones lined up in the Province of Quezon
are expected to provide local jobs in the region. A strong collaboration between the Philippine Economic Zone Authority (PEZA) and concerned local government units (LGUs) is needed to ensure that development will be inclusive and sustainable.
Physical and technical expansion of new and existing Business Process Outsourcing (BPO) companies in the region will further drive growth in the services sector.
Increased production of agricultural commodities for food processing in the City of San Pablo, the food processing hub of the region.
Improvements in the area of Batangas Port
will boost the port’s potential as the “port of exit”. Trade, business and tourism are expected to rise due to this development.
Region IV‐A
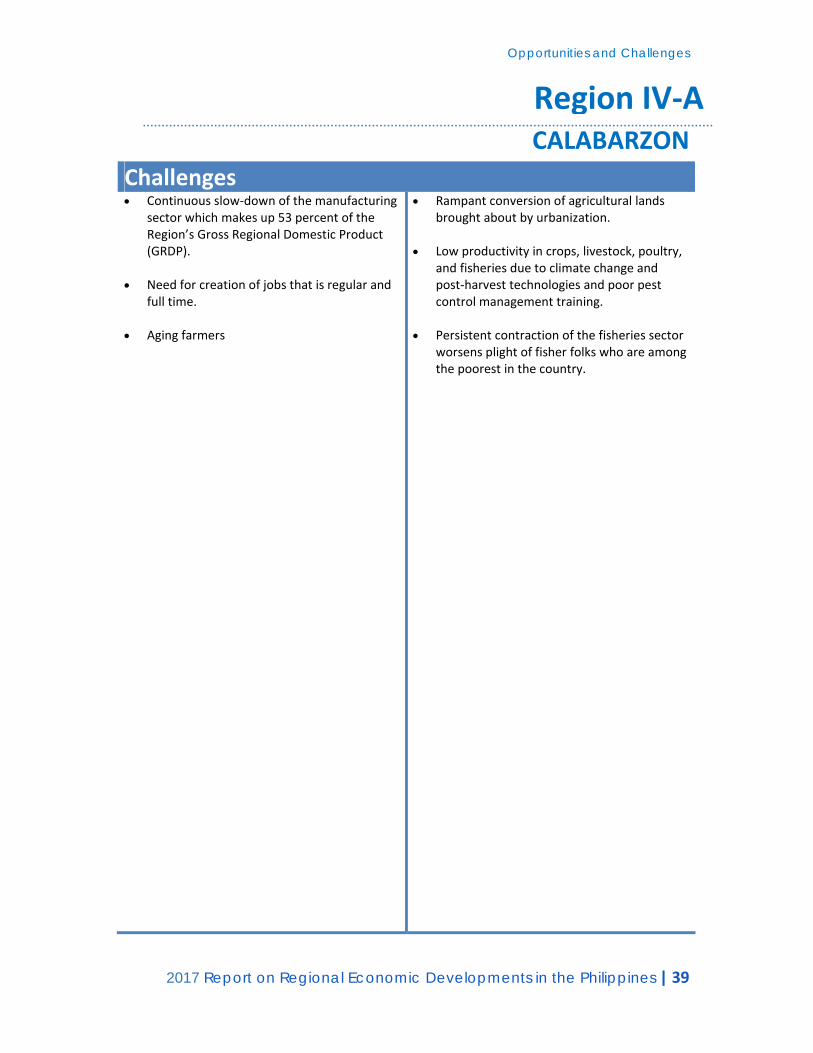
Opportunities and Challenges
2017 Report on Regional Economic Developments in the Philippines | 39
CALABARZON
Challenges Continuous slow‐down of the manufacturing
sector which makes up 53 percent of the Region’s Gross Regional Domestic Product (GRDP).
Need for creation of jobs that is regular and full time.
Aging farmers
Rampant conversion of agricultural lands brought about by urbanization.
Low productivity in crops, livestock, poultry, and fisheries due to climate change and post‐harvest technologies and poor pest control management training.
Persistent contraction of the fisheries sector
worsens plight of fisher folks who are among the poorest in the country.
Region IV‐A

Opportunities and Challenges
40|2017 Report on Regional Economic Developments in the Philippines
MIMAROPA
Opportunities Increasing production in the aquaculture
sector.
Conduct of the annual MIMAROPA Festival,
which showcases the region’s best products
and services, will strengthen partnership
among the region’s stakeholders.
Region IV‐B

Opportunities and Challenges
2017 Report on Regional Economic Developments in the Philippines | 41
MIMAROPA
Challenges Need to sustain investments, infrastructure,
and the aquaculture sector.
Need for strict enforcement of proper
farming and fishing practices in order to
avoid resource degradation, water shortage,
and marine resource depletion.
Limited number of water transport as well as water transport service providers.
Region IV‐B

Opportunities and Challenges
42|2017 Report on Regional Economic Developments in the Philippines
BICOL
Opportunities Strong global demand for fermented cacao
beans gives the local farmers opportunities and incentives.
High demand of about 18 metric tons (MT) per month for roasted pili nut confectioneries from the US, Japan, China, Canada and Hongkong.
Bullish market for abaca fiber, which is shared by several grading/baling establishments, pulp mills, cordage manufacturers and fiber craft processors from all over the country.
Ongoing agricultural programs of Albay Province: a) Farmers’ Bounty Village: AFB Village; b) Development of Albay Family‐Based Food Production Program (AFBFPP); c) Rural‐Based Organization (RBO); d) Organic Agricultural Program; e)High Value Crops Development Program (HVCDP); and f) Fishery Production and Regulation.
Opening of additional flights, as well as new air and sea routes are expected to generate influx of visitors to various destinations in the region. Air connectivity was developed between Clark to Masbate, Catanduanes and additional flights from Cebu to Legazpi were opened by Philippine Airlines.
Development of tourism sites by the Bottom‐Up Budgeting (BuB) program will create opportunities for the hosting communities.
Implementation of the following agricultural programs in the Province of Sorsogon: a) Special Area for Agricultural Development (SAAD) Program; b) Extension Program for Agricultural and Fishery in National Development; c) continued implementation of the PAMANA Program; d) continued assistance in the implementation of the PRDP‐ Global Environment Facility (GEF) project for marine protected areas (MPAs) and small livelihood projects (SLPs) to 4 municipalities (Pilar, Magallanes, Matnog and Bulan); and e) implementation of 10 Micro Enterprises in the province under the Philippine Rural Development Project.
Region V

Opportunities and Challenges
2017 Report on Regional Economic Developments in the Philippines | 43
BICOL
Challenges Delays and complexities in the bidding
processes of agricultural machineries/equipment.
Agriculture losses estimated at ₱5.2 billion brought about by Typhoon Nina in Catanduanes, Albay and Camarines Sur.
High costs of utilities that affect the trade and industry sectors.
Lack of alternative livelihood for the displaced miners affected by the Cease and Desist Order (CDO) issued by the Department of Environment and Natural Resources ‐ Mines and Geosciences Bureau (DENR‐MGB).
Region V

Opportunities and Challenges
44|2017 Report on Regional Economic Developments in the Philippines
WESTERN VISAYAS
Opportunities Development and construction of new
bridges, and opening of roadways (Aklan circumferential and by‐pass roads) to link tourist destinations.
Potential renewable energy and hydro‐ power projects in Nabas, Aklan and Madalag, Aklan, respectively.
Increase in the volume of rice and corn production that can be attributed to sufficient irrigation, favourable weather conditions and higher yielding seed varieties.
Turnover of a rice processing center (₱5.9 million) and a rice thresher (₱1.0 million) by the Department of Agriculture (DA) to benefit the farmers from Guimaras.
Turn over of the new fishing port (₱40‐million) by the Philippine Fisheries Development Authority (PFDA) to boost the fishery industry.
Inauguration of Solong Bridge, reducing the travel time of commuters from 24 barangays in the Province.
Revival of the Evelio B. Javier (EBJ) Airport that will further boost the Province’s tourism industry.
Enhancement of health and medical services through improved hospitals and more medical professionals.
Enhancement of the National Greening Program (NGP) and development of a bamboo and mangrove plantation.
Distribution of 507 land patents (385.2 hectares of agricultural land) to the
Construction of Antique Regional Evacuation Center for disaster response.
Implementation of a poverty monitoring scheme called Community‐Based Monitoring System (CBMS) introduced by the Department of Interior and Local Government (DILG) to capture the multidimensional aspects of poverty in 9 municipalities in the Province.
Adoption of the Electronic New Government Accounting System (eNGAS) by the Province of Antique to improve the financial and operational management of local offices.
Increasing tourist arrivals (1.5 million) due to the enhanced provincial advertisements and promotions of history and culture.
Construction of new malls and recreational buildings.
Improved stadiums that will cater to more local, national or international sports events, which include the hosting of the Palarong Pambansa in the Western Visayas Regional State Colleges and the Universities Athletic Association (WVRAA) meet.
Hosting of the 20th National Mango Congress in 2018 in time for the 25th Manggahan Festival.
Provision of financial assistance to 119 public schools in 32 municipalities in the province which includes the following: a) repair of school buildings (₱16.5 million); b) construction of school buildings (₱3.9 million); c) construction of school facilities (₱12.8) and; d) procurement of school equipment (₱670,000).
Region VI

Opportunities and Challenges
2017 Report on Regional Economic Developments in the Philippines | 45
Opportunities residents of the Province of Guimaras.
Improved fishery industry with the (a) construction of the Community Fish Landing Center (CFLC) in Brgy. Sebario, San Lorenzo, Guimaras; (b) acquisition of 250 units of 20‐footer fiberglass fishing boats in 5 municipalities of the Province of Guimaras, which amounted to ₱3.0 million and ₱15.0 million, respectively; and (c) strict implementation and compliance on regulations against illegal fishing.
Widening of Mantangingi Bridge in Nueva Valencia, Guimaras which also complements the widened Guimaras Circumferential Road, and facilitating smoother flow of traffic in the Province.
Development of the ₱24.0 million Agriculture Machinery Testing and Evaluation Center (AMTEC) Visayas Satellite at Western Visayas Integrated Agricultural Research Center (WESVIARC), Jaro, Iloilo City, improving the quality of equipment for the farmers.
Development of a tissue culture technology by the Aquaculture Department of the Southeast Asian Fisheries Development Center (SEAFDEC) in Tigbauan, Iloilo that is seen to boost seaweeds production.
Rehabilitation of the degraded forestland within Mount Apitong in Concepcion, Iloilo by the Palm Concepcion Power Corporation (PCPC) and the University of the Philippines‐Los Baños Foundation Inc. (UPLBFI), to improve its forest cover, restore the ecological balance, enhance biodiversity and water yield capacity of the watersheds of the mountain.
Construction of additional buildings at Mosqueda Campus, Guimaras State College (GSC), wherein about 200 tertiary students will be given a conducive learning environment.
Construction of 46 school‐based teen centers that will serve as a venue where students could spend their vacant time productively and leisurely.
Designation of the Province of Iloilo as pilot area in Western Visayas for the JobStart program of the Department of Labor and Employment (DOLE) and Asian Development Bank (ADB) which aims to shorten the youth’s school to work transition by enhancing the knowledge and skills they acquired in formal education or technical training in order for them to become more responsive to the demands of the labor market.
Provision of ₱1.4‐million worth of ballistic equipment for Special Weapons and Tactics (SWAT) of the Iloilo Provincial Police Office to better respond to serious security risks (e.g., kidnapping or bomb threats).
Declaration of the Province of Iloilo as official merchant of their Electronic Payment Portal (ePP) by the Land Bank of the Philippines. ePP is an alternative payment channel that allows clients to pay for products and services offered by government and private institutions via the internet.
Allocation of ₱1.4 billion for the construction of the North Negros alternative road and the lengthening and widening of the Bacolod‐Silay Airport Access Road.
Grant of employment opportunities for the Province of Negros Occidental thru a signed a Memorandum of Understanding (MOU) with Northern Territory of Australia.
Possible creation of the Panay‐Guimaras‐Negros Bridge, to facilitate inter‐island business and boost the local economy.
Creation of the North Negros BioPower, a biomass power plant project in Manapla, Negros Occidental, which aims to generate

Opportunities and Challenges
46|2017 Report on Regional Economic Developments in the Philippines
Opportunities
Generation of at least 3,500 jobs due to the opening of ₱2.2 billion three‐level Festive Walk Mall in Iloilo Business Park in April 2018 by Megaworld.
On‐going pre‐feasibility study on the construction of the Panay‐Guimaras‐Negros bridge by officials from the Department of Public Works and Highways (DPWH) and members of China Communications Construction Company (CCCC) Highway Consultants Co. Ltd.
Completion of the ₱40.2 million Esplanade 1 Extension and Nabitasan‐San Rafael Bypass Road to provide pedestrians a better pathway from the foot of Iloilo Bridge to the foot of Nabitasan Bridge.
Completion of the 787‐lineal meter Nabitasan‐San Rafael Bypass Road which is expected to lessen the travel time from Iloilo City downtown area to Iloilo‐Jaro Diversion Road.
Installation of portable water systems in remote and far‐flung barangays at a total project cost of ₱30.7 million.
Establishment of the ₱12.9 million rainwater harvesting facilities in 25 municipalities near evacuation centers. All these have a total capacity of 17,000 liters of water per system‐load, and can provide the water requirements of 100 evacuees for 15 days.
Construction of 30 small dams by the Federation of Negros Occidental Small Water Impounding System Association (FNOSWISA) for farmers of Negros Occidental, as part of the mitigation measures against climate change and further boost rice production.
The Victorias Milling Company Biomass Cogeneration Project, a biomass plant in Victorias City, Negros Occidental, is expected to generate 64‐megawatts of electricity
185 million kWh of electricity per annum, primarily from the waste produced during the harvesting and processing of sugar cane, supplemented by herbaceous and woody energy plants.
The Bacolod‐Silay Economic Zone and Technopark in Bagtic, Silay City will become the first mixed‐use zone and the 20th economic zone under PEZA featuring a “dual‐technology” scheme that will let the employees work in the area while acquiring more skills through a technical school in the ecozone.
The DA‐Western Visayas will build the first solar‐powered irrigation system powered through a renewable energy where the Ilog‐Hilabangan River runs, in Hinigaran Municipality, Negros Occidental.
Construction of a US$300‐million ship recycling facility by the Tsuneishi Heavy Industries, that is expected to create jobs for residents of Hinobaan, Negros Occidental.
Construction of a bridge that will link barangays in Himamaylan City, Negros Occidental, spearheaded by the Philippine Army’s 542nd Engineering Construction Battalion.
The Department of Science and Technology‐Negros Occidental will start their initial site assessment and consultant’s evaluation for food safety standards and practices of 10 food manufacturing businesses in the Province to recommend the areas of manufacturing that need to be improved, or the equipment or machinery to make the enterprise safer and more productive.
Construction of a ₱600 million Magic Island theme park at Silay City, Negros Occidental to boost the tourism industry in the Province.
Earmarked ₱30 million budget from the Department of Transportation and

Opportunities and Challenges
2017 Report on Regional Economic Developments in the Philippines | 47
Opportunities ready to be exported to the grid and used for its milling operation.
Leasing a portion of the Negros First Ranch, Brgy. Sta. Rosa, Murcia to Tenshinzan farm, a private corporation based in Japan, for a dairy development project.
Development and conservation of the Sum‐Ag River in Bacolod City.
Launch of the “Up‐Valuing Project” in Brgy. Bulata, Cauayan, to provide technical and financial support to Gemora Chua Agrarian Reform Cooperative for the production of muscovado sugar.
Launch of farm business schools in the Region to provide trainings for farmers in agri‐business and trade.
The Project Uitzending Managers (PUM) of the Netherlands will administer assistance to the agriculture sector and micro, small and medium entrepreneurs.
Development of the bamboo industry in the province of Negros Occidental due to the town’s abundance and existence of natural bamboo forests.
Construction of a ₱3.5 million cassava‐processing center in Brgy. Tabunan, Bago City, to aid production of cassava crops.
Establishment of a ₱4.0 million Muy Bien Plant, manufacturer of the Iida Farms Turmeric Products in Brgy. Poblacion, Sagay City, to encourage planting of alternative root crops such as ginger, turmeric, lemon grass and calamansi.
Opening of a laboratory for breeding bio‐controllers for pests infesting the agricultural crops in Negros Occidental.
Grant of ₱6.3 million worth of projects to seven hog raisers associations in the
Communication (DOTC) for a concrete runway and a passenger terminal of the Kabanklan City airport.
Implementation of the Bacolod‐Negros Economic Highway by DPWH to help decongest the diversion road in Bacolod City.
Creation of the ₱126.0 million Kabankalan‐DILG Presidential Bridge, to connect Brgy. Camugao to the nearby barangays in Kabankalan City.
Generation of additional jobs by One Asia Foundation, a Japanese investor of a caregiving center at Mambukal Resort in Murcia, Negros Occidental.
Purchase of a new ₱30.0 million sanitary landfill in Bacolod City, an approved budget from the Annual Investment Plan.
Commitment from the Hotel and Restaurant Association of Negros Occidental (HRANO) to conduct more effective training programs, skills training and consumer education to boost food tourism and increase tourism opportunities in the Province.
Awarding of the Taklong Island National Marine Reserve (TINMR), ‘Para el MAR’ which means ‘for the sea’, for being the most outstanding National Integrated Protected Area System (NIPAS) Marine Protected Area (MPA) in the Philippines.
Production of charcoal briquettes, using rice as the main ingredient of the charcoal and then sold in the market for a lower price.
Purchase of water buffalo breeds in the Northern Territory of Australia to improve meat and milk production of the local carabao.

Opportunities and Challenges
48|2017 Report on Regional Economic Developments in the Philippines
Opportunities Province of Negros Occidental, in support of food security, increase the income of hog raisers and farmers, and promote the swine industry.

Opportunities and Challenges
2017 Report on Regional Economic Developments in the Philippines | 49
WESTERN VISAYAS
Challenges Presence of insurgencies in some parts of
the region creates concern on the safety of civilians.
Degradation of water quality, siltation of marine environment, damage of coral areas, presence of toxic contaminants in the water, displacement of local residents and unsafe working conditions of workers, among others, from mining activities.
Depletion of resources intended to provide support for food security and to maintain the ecological balance due to exploitation, settlements intrusion, unsound management practice, and premature conversion of land for urban use.
Delay in the construction of ₱11.2 billion Jalaur River Multipurpose Project (JRMP) Stage II in Calinog, Iloilo, which is aimed at using water from the Jalaur River for power generation and irrigation. It involves the construction of three dams, a 6.6 megawatt hydro power plant and an 81 kilometer long canal.
Shortfall in rice production target by the Province of Iloilo, with harvest reaching only 906,000 MT in 2017 against 1 million MT target for the year.
Temporary suspension or moratorium on issuance of new quarry permits within the province’s five major river systems which include the Aganan, Jalaur, Sibalom, Suage and Ulian river systems. The suspension by the Provincial government was due to alarm over the ill effects of excessive quarrying on rivers to existing public infrastructures such as bridges and dams.
Vulnerability of ten (10) areas in Guimaras to sinkholes, which weaken the Island’s foundation. A strong earthquake could cause soil liquefaction.
Indiscriminate diggings for potable water due to the dry spell could aggravate the formation of sinkholes in Guimaras.
Presence of tectonic faults situated at Tablas, Pandanan, Negros Trench, West Panay, and Central Negros Fault System, increase the vulnerability of the Province of Capiz to ground shaking.
Damage in crops due to severe drought caused by the El Niño phenomenon, which affected 1,000 hectares of rain‐fed lands in four Iloilo towns.
The Bacolod City government facilitated a consultation dialogue with juvenile justice partners or stakeholders involved in handling Children in Conflict with the Law and Children at Risk to address the problem of street children and rugby‐sniffing children in the City.
The Bacolod City government requested the DPWH to look into the cause of flooding in several areas in Bacolod City, like barangays Pahanocoy and Sum‐ag, and address the problem of clogged drainages.
Revoked creation of the Negros Island Region, reverting Negros Occidental to Western Visayas and Negros Oriental to Central Visayas.
Weak sugar industry as prices continued to decline, thus, limiting opportunities for farmers.
Region VI

Opportunities and Challenges
50|2017 Report on Regional Economic Developments in the Philippines
Challenges Crop production losses which amounted to
₱24.5 million in the Province of Negros Occidental due to weather disturbances.
Occurrence of plant diseases and pest infestations in some areas of the Province of Negros Occidental.
Delinquent stall holders, kiosks and occupants in the major markets of Bacolod City which affect SMEs and the City’s revenues.
Incidents of successive fowl and poultry deaths due to bird flu cases.
Marine security threat, environmental challenges and terrorist spillovers since the southern part of Negros is adjacent to Mindanao and the Sulu Sea.

Opportunities and Challenges
2017 Report on Regional Economic Developments in the Philippines | 51
CENTRAL VISAYAS
Opportunities Awarding of ₱66.0 million agricultural
program under the Special Area for Agricultural Development (SAAD) that allows beneficiaries to use funds for corn and mango productions, cattle fattening, livestock raising and other livelihood projects.
Construction of the ₱975.0 million Tanjay‐Bais River Irrigation Project.
Construction of the ₱490.0 million sugar mill plant of HDJ Bayawan Agri‐venture Corporation (HBAC) which will reduce imported fuel usage and cost of transporting sugarcane among farmers.
Urban farming project implementation in Dumaguete City in lieu of the diminishing land area for agriculture in the City.
Turn over of ₱108.0 million of Dauin small reservoir irrigation system (SRIS) in Dauin, Negros Oriental, programmed to irrigate 1,000 hectares of agricultural lands.
Distribution of 10 fiberglass bancas to poorest of the poor fisher folks in coastal barangays in Dumaguete City.
Provision of post‐harvest equipment and
machineries to benefit farmers.
Development of power generating and geothermal projects for sustainable electricity in Negros Oriental (Mabinay Solar Power Project; Montesol Wind Power Project; Monte Solar Energy, Incorporated; Dauin Development Corporation; Amlan Hydropower Plant A, B; Ilog Hydroelectric Power Plant; and Montesol II Solar PV Power Project).
Opening of the Mactan Cebu International Airport (MCIA) Terminal 2 and Panglao International Airport in Bohol by Q2 2018 and Q3 2018, respectively and developments in Dumaguete City Airport and Siquijor Airport.
Launch of the first seaplane services in Cebu City which will allow local and foreign tourists hassle‐free inter‐island trips for business or leisure.
Construction of a Halal plant by Cebu‐based food manufacturer Virginia Foods, Incorporated.
Launch of the “Go Lokal” project including micro, small and medium enterprises (MSMEs) in Central Visayas to provide opportunities for entrepreneurs to access the local consumer market.
Approved ₱12.5 billion cement production project of South Western Cement Corp (SWCC) in Cebu will provide employment opportunities.
Construction/rehabilitation and improvement of various roads in Negros Oriental.
Construction and improvement of municipal and city halls, multipurpose buildings and function halls, stadiums, hotels and recreational areas.
Construction of water supply systems in various municipalities in Negros Oriental.
Implementation of the ₱78.5 million Kanlaon‐Inland Resort and Eco‐tourism (KIRAET) project at Canlaon City, Negros Oriental
Region VII
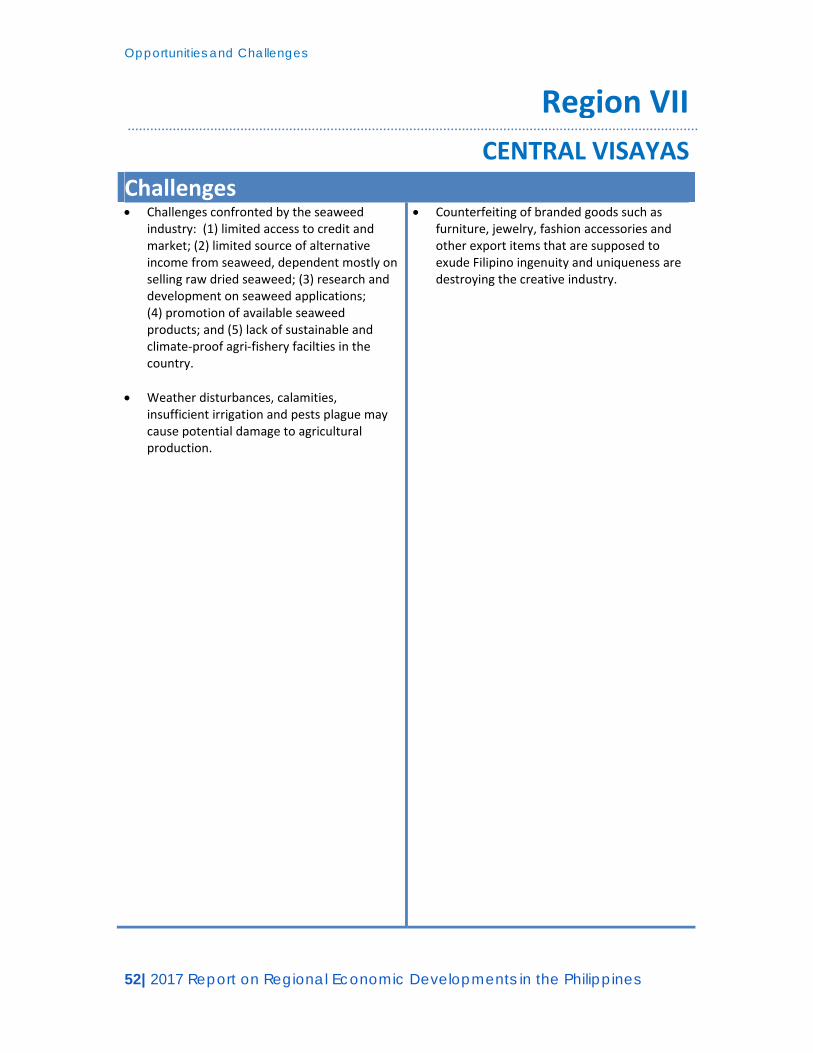
Opportunities and Challenges
52|2017 Report on Regional Economic Developments in the Philippines
CENTRAL VISAYAS
Challenges Challenges confronted by the seaweed
industry: (1) limited access to credit and market; (2) limited source of alternative income from seaweed, dependent mostly on selling raw dried seaweed; (3) research and development on seaweed applications; (4) promotion of available seaweed products; and (5) lack of sustainable and climate‐proof agri‐fishery facilties in the country.
Weather disturbances, calamities, insufficient irrigation and pests plague may cause potential damage to agricultural production.
Counterfeiting of branded goods such as furniture, jewelry, fashion accessories and other export items that are supposed to exude Filipino ingenuity and uniqueness are destroying the creative industry.
Region VII
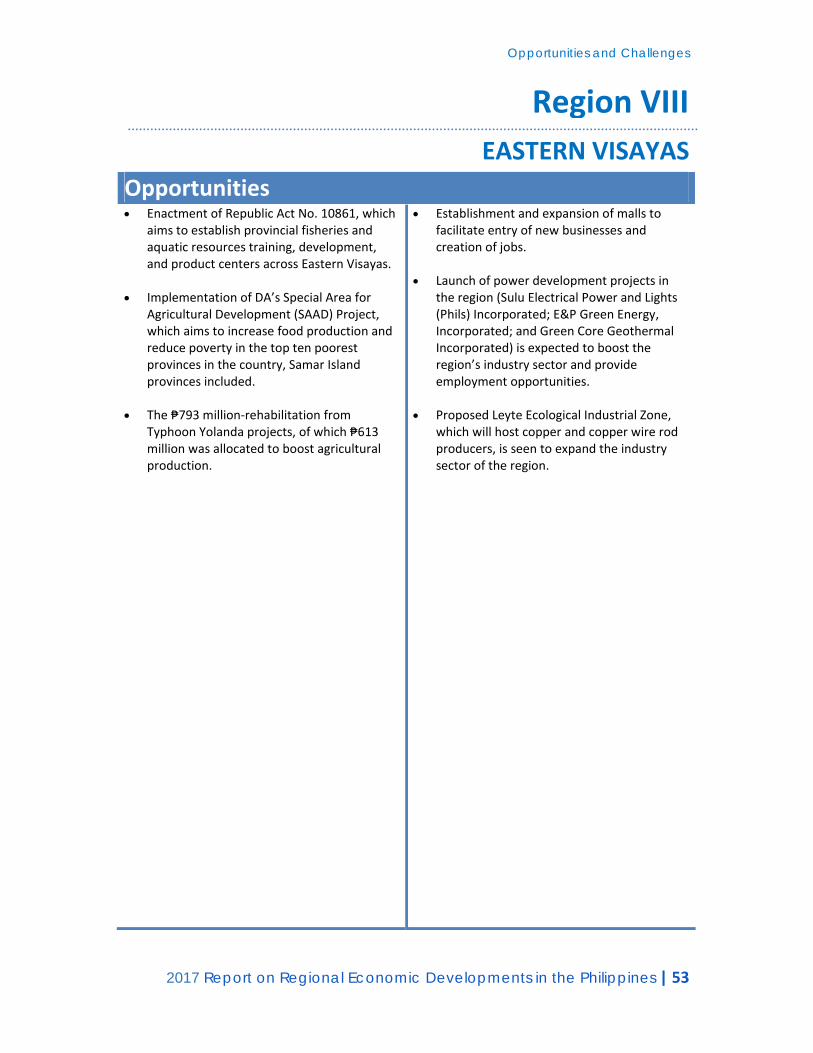
Opportunities and Challenges
2017 Report on Regional Economic Developments in the Philippines | 53
EASTERN VISAYAS
Opportunities Enactment of Republic Act No. 10861, which
aims to establish provincial fisheries and aquatic resources training, development, and product centers across Eastern Visayas.
Implementation of DA’s Special Area for Agricultural Development (SAAD) Project, which aims to increase food production and reduce poverty in the top ten poorest provinces in the country, Samar Island provinces included.
The ₱793 million‐rehabilitation from
Typhoon Yolanda projects, of which ₱613 million was allocated to boost agricultural production.
Establishment and expansion of malls to facilitate entry of new businesses and creation of jobs.
Launch of power development projects in the region (Sulu Electrical Power and Lights (Phils) Incorporated; E&P Green Energy, Incorporated; and Green Core Geothermal Incorporated) is expected to boost the region’s industry sector and provide employment opportunities.
Proposed Leyte Ecological Industrial Zone,
which will host copper and copper wire rod producers, is seen to expand the industry sector of the region.
Region VIII
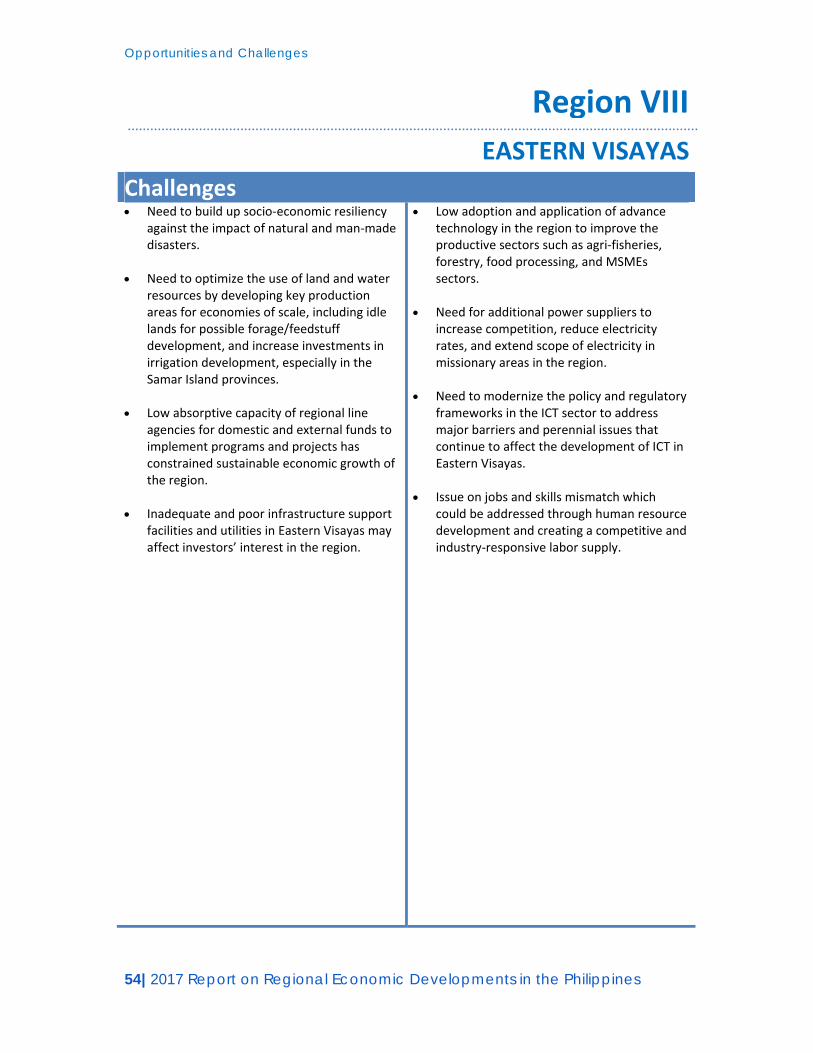
Opportunities and Challenges
54|2017 Report on Regional Economic Developments in the Philippines
EASTERN VISAYAS
Challenges Need to build up socio‐economic resiliency
against the impact of natural and man‐made disasters.
Need to optimize the use of land and water resources by developing key production areas for economies of scale, including idle lands for possible forage/feedstuff development, and increase investments in irrigation development, especially in the Samar Island provinces.
Low absorptive capacity of regional line agencies for domestic and external funds to implement programs and projects has constrained sustainable economic growth of the region.
Inadequate and poor infrastructure support
facilities and utilities in Eastern Visayas may affect investors’ interest in the region.
Low adoption and application of advance technology in the region to improve the productive sectors such as agri‐fisheries, forestry, food processing, and MSMEs sectors.
Need for additional power suppliers to
increase competition, reduce electricity rates, and extend scope of electricity in missionary areas in the region.
Need to modernize the policy and regulatory
frameworks in the ICT sector to address major barriers and perennial issues that continue to affect the development of ICT in Eastern Visayas.
Issue on jobs and skills mismatch which could be addressed through human resource development and creating a competitive and industry‐responsive labor supply.
Region VIII

Opportunities and Challenges
2017 Report on Regional Economic Developments in the Philippines | 55
ZAMBOANGA PENINSULA
Opportunities Additional US$450 million funding support
under the infrastructure development component of the PRDP, which would include a total of 10 farm‐to‐market road projects worth ₱1.82 billion.
Proposed projects for inclusion in FY 2018 Annual Investment Program and Budget of DPWH, to wit: o Gravel to concrete Naga‐Tampilisan
Road (₱450 million); o Gravel to concrete Sindangan‐Bayog
Road (ZDN side)(₱525 million); o Gravel to concrete Eastern Bobongan‐
Sominot‐Midsalip‐Dumingag Road (₱350 million);
o Widening of the Kabasalan‐Naga‐Ipil‐R.T. Lim Surabay section to 4 lanes (₱600 million);
o Widening of the Ipil‐Titay Road to 4 lanes (₱300 million);
o Widening of the Liloy‐Tampilisan‐ boundary Sibugay Road to 4 lanes (₱450 million);
o Widening of the Pagadian‐Buug Road, Dumalinao‐Diplo section to 4 lanes (₱300 million).
Proposed establishment of a triple “A” poultry dressing plant to be located at the 100‐hectare ZamboEcozone Halal Hub will enable the region to compete with neighboring countries in terms of quality and standards of poultry products.
The establishment of Bakas Alliance of Municipalities. It was intended to spearhead the development of the Zamboanga Economic Corridor.
Implementation of the Rural Agro‐Enterprise Partnership for Inclusive Development and
Proposed transfer of Zamboanga City Jail to Barangay Talisayan, Zamboanga City to improve the jail condition as well as increase its capacity which is now way above the ideal number of inmates.
In the present positioning of Zamboanga Peninsula as the Agri‐Fishery Corridor of the Philippines, the Bureau of Fisheries and Aquatic Resources (BFAR), under its Targeted Actions to Reduce Poverty and Generate Economic Transformation (TARGET) Program targets 10 percent of the poor fisherfolk population and seeks to reduce poverty through:
a. Provision of livelihood development and support program – promotion of ecologically sound, economically viable and socially equitable interventions;
b. Establishment of Community Fish Landing Centers (CFLCs) – an economic growth center for marketing and promotion of a “culturally distinct” value‐55 added product of the community;
c. Municipal Fisherfolk Registration System (FishR); and,
d. Municipal Fishing Vessel and Gear registration (BoatR).
Region IX

Opportunities and Challenges
56|2017 Report on Regional Economic Developments in the Philippines
Opportunities Growth (RAPID Growth) Project which aims to promote successful business models associating farmers and micro, small and medium agribusiness in four of the seven priority value chains selected by DTI, (i.e. cocoa, coffee, processed fruits and nuts, and coconut).

Opportunities and Challenges
2017 Report on Regional Economic Developments in the Philippines | 57
ZAMBOANGA PENINSULA
Challenges Abandoned, underdeveloped and
underutilized fishponds in the region. Of the total 11,779.36 hectares of fishpond, around 1,170.31 hectares or 9.9% are underdeveloped or underutilized and 1,203.72 hectares or 10.2% are abandoned.
Unstable and volatile rubber prices affect production in the industry and its farmers as well.
Infestation of cocolisap in an estimated 430,000 of the 2.9 million coconut covering 64 barangays in Zamboanga City. Without appropriate interventions, the local industry would lose an estimated income amounting to ₱897.125 million affecting some 10,097 farmers.
Systems loss exceeding the 13% limit set by the Energy Regulatory Commission. This is not withstanding the generally sufficient power supply in the region and reliability indices of electric cooperatives regarding unplanned power interruptions are still within the prescribed standards of NEA.
Delays in the departure of shipping vessels from Zamboanga City due to the following:
1. Aleson Shipping Lines raised the problem regarding the immigration process in the Zamboanga Sea Port, which causes a three to four‐hour delay in the departure of its vessels to Sandakan.
2. Lack of immigration officers checking the passports of passengers.
3. The Overseas Passenger Assistance Center (OPAC) established by the Department of Justice‐ Inter‐Agency Council Against Trafficking (IACAT) requires passengers to pass by center for profiling before proceeding to the immigration officer for passport stamping, a procedure unique to Zamboanga Port.
Region IX

Opportunities and Challenges
58|2017 Report on Regional Economic Developments in the Philippines
\ NORTHERN MINDANAO
Opportunities Exemption of farmers who own eight
hectares of land or below from paying irrigation service fees, as stipulated by the Republic Act 10969 or the Free Irrigation Service Act. This will support and improve irrigation facilities and improve productivity.
Development of post‐harvest facilities and construction and rehabilitation of farm‐to‐market roads and irrigation facilities to improve production in the region.
Establishment of Farm Business School (FBS) by the DA in partnership with the LGUs in the region, which aims to build farmer capacity in entrepreneurial and management skills.
Opening of a credit facility from Land Bank of the Philippines (LBP), “Sikat Saka program”, will benefit small palay farmers in the region.
Expansion in corn production due to an increased demand for yellow corn and specialized corn varieties, such as sweet corn and popcorn.
Favorable climate suitable for high‐milk producing temperate breeds, low disease incidence, and rich soil to support feed requirements gives Bukidnon the potential to become the dairy capital of the country.
Development of the cattle industry with DA’s priorities to address the livestock program. Priority areas include conservation and improvement of genetic materials, sustenance of disease‐free environment to ensure food security, promotion of technologies that can provide value‐added to commodities and address climate change, and in establishing and upgrading of facilities
Sustained government programs and support provided to farmers in the region such as animal dispersal, artificial insemination, massive vaccination and deworming aimed at encouraging more farmers to engage in swine growing.
Setting‐up of quarantine areas at the borders of major swine‐producing provinces such as Misamis Oriental and Bukidnon have helped reduce the threat of diseases affecting swine.
Sustained support provided by various government agencies and LGUs in the fingerling re‐stocking of rivers and lakes will likely increase inland fish production.
Intensified campaign and coordination with the LGUs against illegal fishing activities, and destructive fishing methods along with monitoring, control, and surveillance activities point toward improving the performance of the fish industry.
Disaster risk reduction and mitigating projects all throughout the region will likely increase both public and private construction projects. The project, UN‐Habitat’s Building Climate Resiliency through Urban Plans and Designs (BCRUPD) with the City of Cagayan de Oro as one of its partners, is expected to improve the capacity of the LGU to develop resilient urban plans and designs and facilitate urban adaptation projects to access climate financing and other modalities of funding.
Decongestion plan of Cagayan de Oro City will likely disperse construction projects in the nearby municipalities and provinces.
Region X

Opportunities and Challenges
2017 Report on Regional Economic Developments in the Philippines | 59
Opportunities to support development of stock.
Opening of the 12.77 kilometers Cagayan de Oro Coastal Road which serves as a bypass road connecting six (6) barangays of Cagayan de Oro City and two (2) barangays in Opol, Misamis Oriental, reducing travel time and supports efficient trade, commerce and employment.
Proliferation and expansion of commercial centers and establishments (e.g. malls, superstores, hotels, restaurants and recreation centers) in the region will increase employment opportunities.

Opportunities and Challenges
60|2017 Report on Regional Economic Developments in the Philippines
NORTHERN MINDANAO
Challenges Weather disturbances, low adoption of
modern technologies, infestation of pests and production‐related costs, slow down production in various industries.
Imposition of Martial Law in Mindanao and the region’s proximity to Marawi and other areas plagued by insurgent groups may discourage investors from expanding in the area and may hamper construction growth in the region.
Importation of cattle breeds from New Zealand to Mindanao via Bulacan route poses serious bio‐security concerns and unnecessary risk to the region’s cattle industry.
Need for an effective land‐use planning and urban management to create sustainable housing communities is increasingly felt due to fast rate of urbanization and climate change concerns.
Continuing increase of prices of land and construction materials would result in slow return of investment and marginal profitability.
Threats in the peace and order situation in Mindanao will have negative effects on the labor situation of the region.
Region X

Opportunities and Challenges
2017 Report on Regional Economic Developments in the Philippines | 61
DAVAO
Opportunities Agricultural modernization, increased public
spending on big‐ticket infrastructure projects and ongoing projects in the transportation sector will contribute to achieving development targets on expanding allied industries (construction and manufacturing) internal circulation, mobility and external linkages in Davao Region.
Real estate investments from the private sector remains highly favorable as these are expected to result in more low‐cost housing projects, and mixed‐use commercial townships.
Expected higher employment rate in 2018 as more people gain quality jobs due to the massive infrastructure spending program of the national government and a healthy consumption base supporting private sector growth.
Region XI

Opportunities and Challenges
62|2017 Report on Regional Economic Developments in the Philippines
DAVAO
Challenges Need to intensify efforts to improve the
agriculture sector for more opportunities in creating value‐added agricultural products.
Presence of New People’s Army (NPA) in most of the provinces in the region that will discourage the entry of investors and tourists.
Region XI

Opportunities and Challenges
2017 Report on Regional Economic Developments in the Philippines | 63
SOCCSKSARGEN
Opportunities Establishment of the early warning device in
North Cotabato (electric siren, LED beacon, controller box, and solar panel) to minimize the effect of flooding in communities along flood‐prone rivers.
Development of the Halal Industry towards world recognition and unifying Global Halal Standards is strengthened by DOST XII.
Road‐widening, improvement of flood control projects that would entail the availability of jobs for professionals, workers and laborers in the construction subsector, will be accelerated in the region.
Continuous investments of nationally recognized fast food franchises and malls of multinational‐owned conglomerates in different urban areas in the region will generate employment.
Region XII

Opportunities and Challenges
64|2017 Report on Regional Economic Developments in the Philippines
SOCCSKSARGEN
Challenges Expected torrential rains could trigger
flashfloods and landslides and affect livelihood and economic activities.
Region XII

Opportunities and Challenges
2017 Report on Regional Economic Developments in the Philippines | 65
CARAGA
Opportunities Grant of a ₱2.3‐billion project by the
International Fund for Agricultural Development (IFAD), to propel agriculture‐based processing enterprises and entrepreneurial communities.
Endorsement of the Rural Agro‐Enterprise
Partnership and Inclusive Development
(RAPID) Growth Project spearheaded by DTI
and hosting of exhibits on diverse cacao
products to promote and to advance the
cacao industry in the region.
Endorsement of the proposed projects of the region under the Convergence Program under the Roads Leveraging Linkages of Industry and Trade (ROLL‐IT) by the RDC, to open trade and industry opportunities.
On‐going construction of the remaining strategic roads and infrastructure investments in the Province of Dinagat Islands will boost tourism and business opportunities in the province.
Construction of the Philippine Army Camp in Tago, Surigao del Sur to eliminate presence of insurgents in the province.
Region XIII

Opportunities and Challenges
66|2017 Report on Regional Economic Developments in the Philippines
CARAGA
Challenges Insufficient supply of water especially during
calamities, which hampers economic activities and adversely affects the health and sanitation in the region.
Region XIII

Opportunities and Challenges
2017 Report on Regional Economic Developments in the Philippines | 67
AUTONOMOUS REGION IN MUSLIM MINDANAO
Opportunities Strengthening the six‐model industry
clusters composed of MSMEs, to drive economic growth through the Japan International Cooperation Agency (JICA) and the DTI – Autonomous Region in Muslim Mindanao (ARMM). JICA and DTI have identified rubber, seaweeds, palm oil, abaca, coffee, and coconut industry clusters in conflict areas as model industries where the region can succeed through investments in technology transfer.
Declaration of the Polloc Freeport and Ecozone in Parang, Maguindanao as ‘halal hub’, the first genuine halal ecozone in the country. ARMM government is continually working to open the possibilities to the halal market in the region as well as in the country that serves as a gateway to the multi‐trillion dollar halal industry.
Proposed signing by the regional government (through PEZA) and the United States Halal Chamber of Commerce of an MOU to formalize cooperation in the access of halal products from Mindanao to the American market.
Promotion of tourism through the regional tourism roadmap. Foreign tourists mostly from Malaysia are doing the annual visit to Sheik Karim al Makdum Mosque, the first and oldest mosque in the Philippines built in 1380. Domestic tourists, most are from Luzon, are also lured by the beautiful and virgin beaches of the province.
Approval of ₱3.2 billion worth of investments by the Regional Board of Investments ‐ Autonomous Region in Muslim Mindanao (RBOI‐ARMM): o ₱3 billion telecommunications project,
Tier One Communications International Inc., will provide cellular services, broadband wireless internet, and public WiFi
o ₱129 million port‐related services project, Bangsamoro Terminal Services Inc. (BTSI), will provide efficient logistics support to the thriving businesses in Cotabato City and nearby municipalities in Maguindanao
o ₱ 40 million water treatment plant and bulk water supply, Mactan Rock TGV Builders Corporation
o ₱33.5 million General cargo vessel with a capacity of 494 metric tons (MT), J. Sayang Shipping Lines, Inc., will provide shipping services to traders in Tawi‐Tawi
o ₱32 million aqua‐marine cold storage and fish processing facility, Abing Seafoods and Cold Storage (ASCS)
Re‐opening of cross‐border deal with some members of the Association of Southeast Asian Nations (ASEAN). This development was in response to a call of Mindanao Development Authority (MinDA) for cross‐border trade with Sabah, Malaysia.
Construction of Bangsamoro Road Network Development Project to be funded by JICA. The said road network covers 200 kilometers of road consisting of 11 access roads and bridges connecting ARMM and other regions in Mindanao.
ARMM
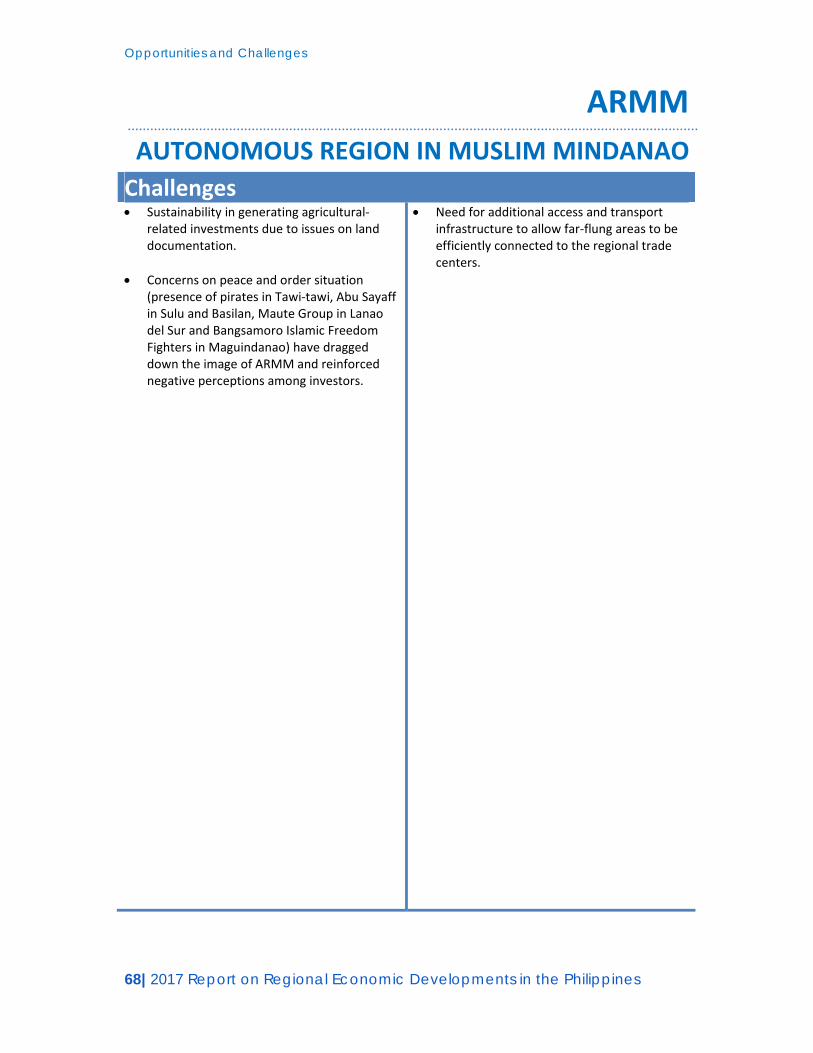
Opportunities and Challenges
68|2017 Report on Regional Economic Developments in the Philippines
AUTONOMOUS REGION IN MUSLIM MINDANAO
Challenges Sustainability in generating agricultural‐
related investments due to issues on land documentation.
Concerns on peace and order situation (presence of pirates in Tawi‐tawi, Abu Sayaff in Sulu and Basilan, Maute Group in Lanao del Sur and Bangsamoro Islamic Freedom Fighters in Maguindanao) have dragged down the image of ARMM and reinforced negative perceptions among investors.
Need for additional access and transport infrastructure to allow far‐flung areas to be efficiently connected to the regional trade centers.
ARMM

2017 Report on Regional Economic Developments in the Philippines |69
Conclusion
Going forward, weather‐related disturbances, as well as natural and man‐made calamities will
continue to pose risks to regional development, therefore highlighting the need to build up
socio‐economic resilience and disaster preparedness of local governments and communities.
Apart from the adverse effects of climate change on the livelihood and income of farmers and
fisherfolk, inadequate irrigation facilities, pest infestation, and outbreak of plant and animal
diseases will remain as major challenges in areas heavily dependent on agriculture and fishery
sectors. In order to counter the possible impact of these conditions on food production and
prices, and to boost productivity and income of rural workers, several measures and
collaborative efforts are being undertaken by the national and local governments, non‐
government organizations, the private sector, and stakeholders. These include provision of
sufficient water supply; development of climate‐resilient crop varieties, adaptive technologies,
and agri‐fishery facilities; distribution of post‐harvest equipment, machineries, hybrid seeds,
and fertilizers; provision of accessible and affordable credit window for farmers and fisherfolk;
establishment of agricultural research laboratories and climate‐smart farm business schools;
and setting up of community fish landing and agricultural trading centers. In addition,
construction of strategically located farm‐to‐market roads will not only minimize
transportation cost for farmers but will also ensure the quality of farm produce through faster
and favorable transport conditions.
Moreover, in order to enhance investment opportunities throughout the country, there
continues to be a need for reliable and affordable power supply; improved interconnectivity
between rural/far‐flung areas and the regions’ major economic centers through adequate
infrastructure and efficient transport systems; and lasting peace and order situation. In
addition, efforts to improve ease of doing business at the local level are expected to attract
more inward investments and bring about enterprise development among the locals.
Establishment of retail trade and commercial establishments present viable employment
opportunities and other positive externalities in the regions.
In most regions, tourism promotion and development continue to play a vital role in providing
income and job opportunities in the rural areas. Interventions such as upgrading of facilities
and enhancing accessibility of tourism destinations by opening new and improving existing air,
land and sea routes remain crucial. Lastly, enhancing mobility of goods and services through
timely implementation of infrastructure and road projects as well as construction and
rehabilitation of airports and sea ports are also anticipated to further boost competitiveness
and productivity. All of these, in turn, are expected to lead to sustainable and far‐reaching
development in the regions.

2017 Report on Regional Economic Developments in the Philippines
Statistical Annexes List of Tables
1 Gross Regional Domestic Product (GRDP)
2 Palay Production
3 Corn Production
4 Cattle Production
5 Chicken Production
6 Swine Production
7 Fish Production
8 Total Number of Approved Building Permits
9 Total Number of New Residential Building Construction
10 Employment Indicators
11 Receipts and Expenditures
12 Inflation Rate
13 Approved Foreign Investments
14 Approved Foreign and Filipino Investments
15 Deposit Liabilities
16 Loans‐to‐Deposits Ratio
17 Bank Density Ratio
18 Microfinance Oriented Banks
19 Microfinance Loans Outstanding in the Banking System
20 Microfinance Borrowers in the Banking System

1. Gross Regional Domestic Product (GRDP) at constant 2000 prices
2013 2014 2015 2016 2017 2013 2014 2015 2016 2017
PHILIPPINES 6,750,631,383 7,165,477,851 7,600,175,069 8,122,741,433 8,665,707,506 7.1 6.1 6.1 6.9 6.7
1NCR 2,455,228,444 2,597,052,167 2,770,552,677 2,976,234,624 3,158,081,656 9.1 5.8 6.7 7.4 6.1
2CAR 124,630,544 128,688,178 133,848,201 136,873,913 153,411,322 5.4 3.3 4.0 2.3 12.1
3Ilocos Region (I) 211,361,389 224,979,174 237,178,755 257,277,270 272,257,487 7.0 6.4 5.4 8.5 5.8
4Cagayan Valley (II) 120,474,018 129,114,289 134,444,616 139,548,688 149,578,296 6.6 7.2 4.1 3.8 7.2
5Central Luzon (III) 612,282,603 668,918,294 706,343,196 773,108,325 844,709,530 4.5 9.2 5.6 9.5 9.3
6CALABARZON (IV‐A) 1,170,574,623 1,230,372,013 1,302,297,272 1,364,736,594 1,456,088,132 6.6 5.1 5.8 4.8 6.7
7MIMAROPA (IV‐B) 110,673,201 119,911,229 122,258,656 125,432,256 133,228,208 1.3 8.3 2.0 2.6 6.2
8Bicol Region (V) 136,852,119 142,760,974 155,449,066 164,065,917 172,358,884 8.2 4.3 8.9 5.5 5.1
9Western Visayas (VI) 266,982,502 280,852,008 305,503,332 323,535,392 350,821,902 3.4 5.2 8.8 5.9 8.4
10Central Visayas (VII) 427,258,117 460,280,508 482,898,676 524,597,384 551,179,952 7.4 7.7 4.9 8.6 5.1
11Eastern Visayas (VIII) 150,072,628 146,476,790 153,224,685 171,610,264 174,669,515 4.6 ‐2.4 4.6 12.0 1.8
12Zamboanga Peninsula (IX) 137,214,139 146,320,802 157,640,786 164,866,496 168,702,094 4.2 6.6 7.7 4.6 2.3
13Northern Mindanao (X) 250,536,070 268,424,368 283,769,262 304,952,799 323,009,662 5.4 7.1 5.7 7.5 5.9
14Davao Region (XI) 257,385,537 281,348,316 304,412,137 333,405,134 369,797,076 6.7 9.3 8.2 9.5 10.9
15SOCCSKSARGEN (XII) 185,305,980 196,770,182 203,183,377 213,182,370 230,598,148 8.4 6.2 3.3 4.9 8.2
16Caraga 84,475,406 92,419,812 96,587,795 98,511,669 102,701,036 8.2 9.4 4.5 2.0 4.3
17ARMM 49,324,066 50,788,748 50,582,581 50,802,338 54,514,604 3.8 3.0 ‐0.4 0.4 7.3
Source: Philippine Statistics Authority (PSA)
REGIONLevels (In Thousand Pesos) Growth rate
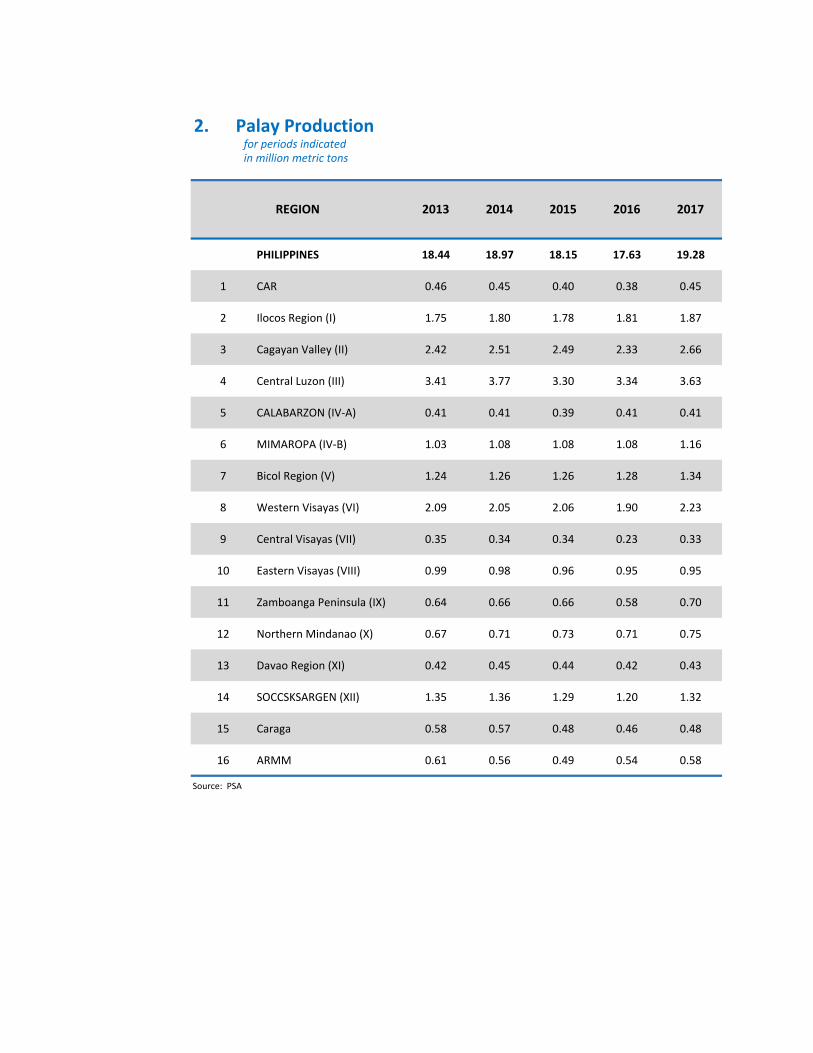
2. Palay Production for periods indicated in million metric tons
PHILIPPINES 18.44 18.97 18.15 17.63 19.28
1 CAR 0.46 0.45 0.40 0.38 0.45
2 Ilocos Region (I) 1.75 1.80 1.78 1.81 1.87
3 Cagayan Valley (II) 2.42 2.51 2.49 2.33 2.66
4 Central Luzon (III) 3.41 3.77 3.30 3.34 3.63
5 CALABARZON (IV‐A) 0.41 0.41 0.39 0.41 0.41
6 MIMAROPA (IV‐B) 1.03 1.08 1.08 1.08 1.16
7 Bicol Region (V) 1.24 1.26 1.26 1.28 1.34
8 Western Visayas (VI) 2.09 2.05 2.06 1.90 2.23
9 Central Visayas (VII) 0.35 0.34 0.34 0.23 0.33
10 Eastern Visayas (VIII) 0.99 0.98 0.96 0.95 0.95
11 Zamboanga Peninsula (IX) 0.64 0.66 0.66 0.58 0.70
12 Northern Mindanao (X) 0.67 0.71 0.73 0.71 0.75
13 Davao Region (XI) 0.42 0.45 0.44 0.42 0.43
14 SOCCSKSARGEN (XII) 1.35 1.36 1.29 1.20 1.32
15 Caraga 0.58 0.57 0.48 0.46 0.48
16 ARMM 0.61 0.56 0.49 0.54 0.58
Source: PSA
REGION 2015 2016 20172013 2014

3. Corn Production for periods indicated in million metric tons
PHILIPPINES 7.38 7.77 7.52 7.22 7.91
1 CAR 0.24 0.24 0.24 0.20 0.24
2 Ilocos Region (I) 0.45 0.48 0.49 0.51 0.56
3 Cagayan Valley (II) 1.71 1.86 1.80 1.68 1.84
4 Central Luzon (III) 0.23 0.24 0.27 0.26 0.26
5 CALABARZON (IV‐A) 0.08 0.07 0.06 0.10 0.09
6 MIMAROPA (IV‐B) 0.10 0.11 0.13 0.11 0.12
7 Bicol Region (V) 0.26 0.29 0.24 0.26 0.29
8 Western Visayas (VI) 0.35 0.37 0.35 0.28 0.30
9 Central Visayas (VII) 0.17 0.16 0.15 0.16 0.15
10 Eastern Visayas (VIII) 0.09 0.09 0.09 0.08 0.07
11 Zamboanga Peninsula (IX) 0.21 0.22 0.22 0.26 0.23
12 Northern Mindanao (X) 1.19 1.20 1.22 1.22 1.29
13 Davao Region (XI) 0.23 0.28 0.22 0.22 0.26
14 SOCCSKSARGEN (XII) 1.31 1.34 1.24 1.14 1.26
15 Caraga 0.11 0.13 0.12 0.14 0.12
16 ARMM 0.67 0.70 0.67 0.59 0.84
Source: PSA
REGION 2015 2016 20172013 2014

4. Cattle Production for periods indicated in thousand metric tons in liveweight
PHILIPPINES 258.45 261.319 266.90 270.42 266.30
1 CAR 4.66 4.57 4.43 4.33 4.16
2 Ilocos Region (I) 27.82 27.70 28.35 27.77 27.38
3 Cagayan Valley (II) 14.34 14.54 14.11 15.11 14.33
4 Central Luzon (III) 18.94 18.41 18.31 18.79 16.20
5 CALABARZON (IV‐A) 24.79 26.15 28.05 28.66 28.13
6 MIMAROPA (IV‐B) 11.15 11.65 12.27 12.47 12.80
7 Bicol Region (V) 14.87 15.64 16.46 16.97 17.55
8 Western Visayas (VI) 23.12 24.17 24.24 24.71 25.57
9 Central Visayas (VII) 24.53 24.47 24.06 24.78 25.23
10 Eastern Visayas (VIII) 2.48 2.29 2.25 2.31 2.18
11 Zamboanga Peninsula (IX) 12.68 12.24 12.12 11.22 11.24
12 Northern Mindanao (X) 36.68 37.85 39.10 39.41 37.54
13 Davao Region (XI) 11.85 12.45 12.75 12.83 13.31
14 SOCCSKSARGEN (XII) 18.60 17.96 19.24 18.91 18.66
15 Caraga 1.51 1.54 1.42 1.68 1.57
16 ARMM 10.44 9.70 9.75 10.48 10.47
Source: PSA
20172013 2014REGION 2015 2016

5. Chicken Production for periods indicated in thousand metric tons in liveweight
PHILIPPINES 1,555.07 1,571.76 1,660.81 1,674.51 1,745.89
1 CAR 7.36 7.18 7.74 7.60 7.92
2 Ilocos Region (I) 83.26 82.46 82.83 78.76 78.08
3 Cagayan Valley (II) 55.53 57.70 59.32 60.64 58.78
4 Central Luzon (III) 549.85 570.13 609.51 590.99 624.69
5 CALABARZON (IV‐A) 302.57 298.54 321.67 328.43 328.65
6 MIMAROPA (IV‐B) 10.40 10.34 10.64 10.30 10.15
7 Bicol Region (V) 34.47 36.44 40.04 42.24 43.97
8 Western Visayas (VI) 94.83 84.34 89.91 95.83 103.82
9 Central Visayas (VII) 88.33 92.21 97.62 99.74 104.84
10 Eastern Visayas (VIII) 35.46 30.42 28.35 36.29 49.32
11 Zamboanga Peninsula (IX) 26.70 26.49 27.83 30.20 31.99
12 Northern Mindanao (X) 135.96 140.52 146.03 152.80 159.09
13 Davao Region (XI) 67.38 68.42 73.58 72.01 71.76
14 SOCCSKSARGEN (XII) 45.24 47.97 47.14 49.84 53.40
15 Caraga 11.90 13.16 13.25 13.86 14.59
16 ARMM 5.85 5.43 5.36 4.94 4.85
Source: PSA
REGION 2015 2016 20172013 2014

6. Swine Production for periods indicated in thousand metric tons in liveweight
PHILIPPINES 2,012.17 2,032.30 2,120.33 2,231.66 2,265.02
1 CAR 30.53 28.77 26.75 26.36 25.83
2 Ilocos Region (I) 82.98 81.61 82.73 86.55 90.07
3 Cagayan Valley (II) 68.77 67.09 68.85 71.36 72.87
4 Central Luzon (III) 362.34 380.67 422.53 462.43 447.52
5 CALABARZON (IV‐A) 309.49 315.60 336.35 365.06 371.71
6 MIMAROPA (IV‐B) 73.11 74.22 77.67 79.59 83.05
7 Bicol Region (V) 114.26 121.36 123.61 121.54 126.60
8 Western Visayas (VI) 182.60 178.52 178.33 188.76 186.60
9 Central Visayas (VII) 156.33 156.77 163.53 175.11 192.20
10 Eastern Visayas (VIII) 85.96 76.61 76.50 76.39 76.45
11 Zamboanga Peninsula (IX) 82.24 80.18 81.32 80.05 82.20
12 Northern Mindanao (X) 159.75 163.98 170.01 177.67 188.45
13 Davao Region (XI) 133.85 136.24 143.31 149.16 151.60
14 SOCCSKSARGEN (XII) 118.25 119.81 118.37 119.05 117.74
15 Caraga 40.32 39.83 39.59 42.39 42.19
16 ARMM 11.42 11.05 10.88 10.21 9.95
Source: PSA
REGION 2015 2016 20172013 2014

7. Fish Production for periods indicated in hundred thousand metric tons
PHILIPPINES 46.49 43.56 43.11
1 NCR 1.07 1.26 0.92
2 CAR 0.04 0.04 0.04
3 Ilocos Region (I) 1.62 1.57 1.61
4 Cagayan Valley (II) 0.56 0.53 0.51
5 Central Luzon (III) 2.77 2.73 2.87
6 CALABARZON (IV‐A) 3.79 3.31 3.32
7 MIMAROPA (IV‐B) 5.88 4.83 4.89
8 Bicol Region (V) 2.68 2.34 2.39
9 Western Visayas (VI) 4.02 3.97 3.90
10 Central Visayas (VII) 1.86 1.84 1.51
11 Eastern Visayas (VIII) 1.35 1.40 1.36
12 Zamboanga Peninsula (IX) 5.83 5.55 5.15
13 Northern Mindanao (X) 1.63 1.67 1.56
14 Davao Region (XI) 0.59 0.58 0.57
15 SOCCSKSARGEN (XII) 3.29 2.92 3.19
16 Caraga 0.83 0.76 0.75
17 ARMM 8.67 8.24 8.56
Source: PSAr revisedp preliminary
2015r 2016r 2017pREGION

8. Total Number of Approved Building Permits levels and growth rates
2013 2014 2015 2016r 2017p 2013 2014 2015 2016r 2017p
PHILIPPINES 120,775 126,875 132,006 147,998 140,605 ‐0.23 5.05 4.04 12.11 ‐5.00
1 NCR 13,948 13,381 12,863 13,166 11,583 0.68 ‐4.07 ‐3.87 2.36 ‐12.02
2 CAR 1,161 1,460 1,123 1,202 1,219 ‐1.69 25.75 ‐23.08 7.03 1.41
3 Ilocos Region (I) 7,060 7,511 7,990 8,825 10,481 ‐2.20 6.39 6.38 10.45 18.76
4 Cagayan Valley (II) 2,256 3,347 3,182 3,246 4,294 ‐15.03 48.36 ‐4.93 2.01 32.29
5 Central Luzon (III) 12,025 16,047 13,991 14,481 15,437 ‐10.99 33.45 ‐12.81 3.50 6.60
6 CALABARZON (IV‐A) 31,340 29,092 32,951 34,713 34,776 13.02 ‐7.17 13.26 5.35 0.18
7 MIMAROPA (IV‐B) 2,086 2,508 2,874 2,634 2,233 ‐5.95 20.23 14.59 ‐8.35 ‐15.22
8 Bicol Region (V) 3,177 2,830 3,487 3,513 3,009 6.01 ‐10.92 23.22 0.75 ‐14.35
9 Western Visayas (VI) 5,124 5,483 7,059 6,317 6,445 ‐20.95 7.01 28.74 ‐10.51 2.03
10 Central Visayas (VII) 13,168 12,440 12,824 14,801 11,219 ‐8.26 ‐5.53 3.09 15.42 ‐24.20
11 Eastern Visayas (VIII) 1,980 2,407 4,937 4,879 3,972 ‐15.09 21.57 105.11 ‐1.17 ‐18.59
12 Negros Island Region 9,686 5,916 ‐38.92
13 Zamboanga Peninsula (I 3,484 3,761 4,505 4,032 4,016 ‐9.20 7.95 19.78 ‐10.50 ‐0.40
14 Northern Mindanao (X) 7,698 8,119 8,599 9,378 7,960 1.58 5.47 5.91 9.06 ‐15.12
15 Davao Region (XI) 8,916 11,500 8,120 10,091 10,263 ‐2.28 28.98 ‐29.39 24.27 1.70
16 SOCCSKSARGEN (XII) 3,100 2,822 2,846 3,013 3,414 15.93 ‐8.97 0.85 5.87 13.31
17 Caraga 3,984 3,922 4,548 3,861 4,211 28.64 ‐1.56 15.96 ‐15.11 9.07
18 ARMM 268 245 107 160 157 26.42 ‐8.58 ‐56.33 49.53 ‐1.88
Note: Sum of details may not add up to totals due to rounding.
r Revised to reflect data updates per PSA
p Preliminary
Source: PSA
Levels Growth rate REGION

9. Total Number of New Residential Building Construction for periods indicated
2013 2014 2015 2016r 2017p 2013 2014 2015 2016 2017
PHILIPPINES 87,767 90,201 97,174 113,097 102,417 0.48 2.77 7.73 16.39 ‐9.44
1 NCR 7,071 6,772 6,435 6,587 6,055 ‐0.87 ‐4.23 ‐4.98 2.36 ‐8.08
2 CAR 842 1,041 826 938 885 0.24 23.63 ‐20.65 13.56 ‐5.65
3 Ilocos (I) 5,346 5,695 5,801 6,498 7,519 ‐4.31 6.53 1.86 12.02 15.71
4 Cagayan Valley (II) 1,580 2,500 2,189 2,265 3,336 ‐19.35 58.23 ‐12.44 3.47 47.28
5 Central Luzon (III) 8,298 11,852 10,617 10,685 10,768 ‐15.46 42.83 ‐10.42 0.64 0.78
6 CALABARZON (IV‐A) 25,059 21,480 25,842 27,829 26,785 20.26 ‐14.28 20.31 7.69 ‐3.75
7 MIMAROPA (IV‐B) 1,445 1,738 1,872 2,007 1,431 ‐3.60 20.28 7.71 7.21 ‐28.70
8 Bicol (V) 2,550 2,084 2,691 2,690 2,056 9.16 ‐18.27 29.13 ‐0.04 ‐23.57
9 Western Visayas (VI) 3,834 3,851 5,192 4,848 4,992 ‐24.42 0.44 34.82 ‐6.63 2.97
10 Central Visayas (VII) 9,754 8,599 9,627 12,571 8,623 ‐13.57 ‐11.84 11.95 30.58 ‐31.41
11 Eastern Visayas (VIII) 1,214 1,569 3,857 3,671 2,586 ‐13.78 29.24 145.83 ‐4.82 ‐29.56
12 Negros Island Region 8,447 4,752 ‐43.74
13 Zamboanga Peninsula (IX) 2,571 2,868 3,669 3,456 3,154 ‐9.15 11.55 27.93 ‐5.81 ‐8.74
14 Northern Mindanao (X) 6,445 6,718 7,313 8,014 6,508 4.15 4.24 8.86 9.59 ‐18.79
15 Davao Region (XI) 6,711 9,168 5,964 7,906 7,940 4.86 36.61 ‐34.95 32.56 0.43
16 SOCCSKSARGEN (XII) 1,922 1,502 1,544 1,556 1,623 10.46 ‐21.85 2.80 0.78 4.31
17 Caraga 2,896 2,569 3,644 3,002 3,266 29.87 ‐11.29 41.85 ‐17.62 8.79
18 ARMM 229 195 91 127 138 24.46 ‐14.85 ‐53.33 39.56 8.66
Note: Sum of details may not add up to totals due to rounding.r Revised to reflect data updates per PSA
p Preliminary
Source: PSA
REGIONLevels Growth rate

10. Employment Indicators for periods indicated averages in percent
EmploymentUnemploy‐
ment
Underem‐
ploymentEmployment
Unemploy‐
ment
Underem‐
ploymentEmployment
Unemploy‐
mentaUnderem‐
ploymentEmployment
Unemploy‐
mentbUnderem‐
ploymentEmployment
Unemploy‐
mentbUnderem‐
ployment
PHILIPPINES 92.80 7.20 19.00 93.40 6.60 18.40 93.70 6.30 18.53 94.55 5.45 18.32 94.29 5.71 16.13
1 NCR 89.70 10.30 12.10 89.80 10.20 10.80 91.50 8.50 10.00 93.33 6.67 8.74 92.59 7.41 9.32
2 CAR 95.50 4.50 14.10 94.80 5.20 13.20 95.20 4.90 20.80 95.61 4.39 23.08 95.71 4.29 14.76
3 Ilocos Region (I) 91.70 8.30 20.00 91.80 8.20 15.40 91.60 8.40 16.90 93.81 6.19 17.42 91.13 8.87 19.85
4 Cagayan Valley (II) 96.80 3.20 12.90 96.30 3.60 11.60 96.80 3.20 11.10 96.92 3.08 12.79 96.85 3.15 13.58
5 Central Luzon (III) 91.30 8.70 14.50 91.90 8.10 14.30 92.20 7.80 13.50 93.40 6.60 16.10 93.37 6.63 11.42
6 Calabarzon (IV‐A) 90.80 9.20 17.90 92.00 8.00 18.60 92.00 8.00 18.20 92.85 7.15 15.60 93.03 6.97 13.97
7 Mimaropa (IV‐B) 96.00 4.10 23.40 95.60 4.40 19.60 96.70 3.30 20.80 95.91 4.10 21.80 95.24 4.80 23.70
8 Bicol Region (V) 93.50 6.50 37.30 94.20 5.80 32.00 94.40 5.60 31.60 95.38 4.62 30.23 95.43 4.57 27.65
9 Western Visayas (VI) 93.10 6.90 22.70 94.20 5.80 21.40 94.60 5.40 21.30 95.20 4.80 19.27 94.60 5.40 16.70
10 Central Visayas (VII) 93.70 6.30 15.10 94.20 5.80 17.70 94.10 5.90 18.40 95.09 4.91 14.74 95.50 4.50 17.50
11 Eastern Visayas (VIII) 94.70 5.30 25.10 94.20 5.80 31.20 94.60 5.40 31.80 95.53 4.47 29.87 95.56 4.44 22.64
12 Zamboanga Peninsula (IX) 96.50 3.50 21.80 96.50 3.50 20.10 96.50 3.50 18.50 96.24 3.76 22.46 96.04 3.96 17.32
13 Northern Mindanao (X) 94.30 5.70 25.70 94.50 5.40 24.70 94.40 5.60 24.90 94.76 5.24 27.88 94.71 5.29 18.57
14 Davao Region (XI) 93.10 6.90 17.20 94.40 5.60 19.10 94.20 5.80 19.00 95.51 4.49 16.81 95.14 4.86 17.77
15 Soccsksargen (XII) 95.60 4.40 22.70 96.50 3.50 20.70 96.50 3.50 23.20 95.89 4.11 23.74 96.05 3.95 17.94
16 Caraga (XIII) 94.00 6.00 27.10 94.80 5.20 25.00 94.30 5.70 26.20 95.03 4.97 28.01 94.93 5.07 23.10
17 ARMM 95.30 4.60 12.40 96.60 3.40 11.70 96.50 3.50 11.10 96.06 3.94 13.54 96.55 3.45 7.03
a Without Leyte
b With Leyte
Source: PSA
2015 2016 2017P
p Preliminary
2013 2014REGION

11. Receipts and Expenditures in billion pesos
NCR CAR I II III IVA IVB V VI VII VIII IX X XI XII XIII ARMM
82.00 10.98 16.10 14.55 28.66 54.30 17.43 27.03 37.02 36.25 20.83 15.01 14.16 12.28 14.60 8.49 10.40
71.65 15.67 27.87 24.33 53.35 72.49 19.90 26.24 38.08 42.83 25.33 18.72 31.40 26.75 20.65 18.88 30.73
49.43 2.02 5.36 3.20 14.76 27.14 1.66 2.57 6.30 11.99 1.71 1.84 8.38 5.86 2.40 0.27 13.97
41.54 0.86 2.56 1.29 9.49 20.58 0.88 1.41 3.58 7.97 1.02 0.96 5.09 3.74 1.31 0.17 1.15
7.88 1.16 2.80 1.91 5.27 6.55 0.78 1.17 2.72 4.03 0.69 0.88 3.29 2.12 1.09 0.10 12.82
22.14 13.65 22.50 21.05 38.26 45.19 18.24 23.66 31.70 28.12 23.55 16.34 23.01 20.89 18.20 18.61 16.73
21.54 12.88 20.85 20.86 37.16 42.45 18.18 23.61 31.35 27.44 23.42 16.23 21.70 19.86 18.18 18.28 16.42
0.08 0.01 0.01 0.01 0.16 0.67 0.01 0.01 0.00 0.02 0.00 0.01 0.01 1.02 0.00 0.00 0.00
0.48 0.73 1.52 0.09 0.36 1.81 0.03 0.01 0.29 0.58 0.04 0.01 0.80 0.01 0.00 0.19 0.28
0.04 0.00 0.00 0.02 0.05 0.14 0.00 0.02 0.04 0.06 0.00 0.09 0.33 0.00 0.09 0.00
0.03 0.11 0.07 0.52 0.13 0.03 0.00 0.03 0.03 0.09 0.00 0.16 0.00 0.01 0.04 0.02
0.09 0.00 0.01 0.08 0.34 0.16 0.00 0.00 0.08 2.71 0.06 0.54 0.01 0.00 0.05 0.00 0.03
0.09 0.00 0.00 0.00 0.13 0.03 0.00 0.00 0.00 2.70 0.05 0.00 0.01 0.00 0.00 0.00
0.01 0.08 0.21 0.14 0.08 0.01 0.01 0.54 0.05 0.03
63.56 15.08 25.47 23.02 48.64 65.59 13.86 13.92 29.94 40.37 14.10 13.55 31.07 22.65 17.26 11.48 16.37
31.21 6.28 12.98 13.09 26.28 29.91 7.14 6.95 14.55 18.81 7.34 5.92 13.92 11.36 8.42 6.26 7.32
11.79 4.29 5.94 4.58 8.40 14.73 3.16 3.32 6.00 9.98 3.10 3.44 7.75 4.79 4.37 3.76 3.66
19.78 3.86 5.61 4.37 11.50 17.77 3.37 3.09 7.07 9.87 2.90 3.00 7.56 5.11 3.41 1.32 3.42
0.78 0.65 0.94 0.97 2.46 3.19 0.19 0.56 2.31 1.71 0.77 1.18 1.84 1.39 1.06 0.14 1.97
90.09 11.57 18.49 15.86 33.37 61.20 23.48 39.34 45.17 38.71 32.06 20.19 14.49 16.39 17.99 15.89 24.76
Source: Department of Budget and Management, Table F.7 Statement of Receipts and Expenditures, By Regional Level of LGUs, 2017
ENDING CASH BALANCE
Tax Revenues
Non‐Tax Revenues
Share from IRA
Share from GOCCs (PAGCOR and
PCSO) Other Share from National Tax
Collection
Inter‐Local Transfer
Extraordinary
Receipts/Grants/Donations/Aids
Non‐Income Receipts
External Sources
Capital Investment Receipts
Receipts from Loans and
Borrowings
General Services
Economic Services
Social Services
Local Sources
RECEIPTS
REGION
BEGINNING CASH BALANCE
Debt Services
EXPENDITURES

12. Inflation Rate in percent
ALL ITEMS
PHILIPPINES 3.00 4.10 1.40 1.80 3.20
1 Metro Manila 1.60 3.20 1.00 1.20 4.00
Areas Outside Metro Manila 3.30 4.50 1.50 1.90 2.90
2 CAR 3.40 3.70 1.50 1.90 1.80
3 Ilocos Region (I) 2.30 4.50 1.40 1.80 2.00
4 Cagayan Valley (II) 3.40 4.10 2.00 3.00 3.40
5 Central Luzon (III) 2.70 3.60 1.30 2.20 3.10
6 CALABARZON (IV‐A) 2.60 4.00 0.90 0.90 2.80
7 MIMAROPA (IV‐B) 2.60 4.50 1.40 2.10 1.80
8 Bicol Region (V) 3.50 5.30 1.00 1.10 4.60
9 Western Visayas (VI) 3.80 4.70 2.30 2.20 2.20
10 Central Visayas (VII) 4.70 5.00 1.80 2.80 3.20
11 Eastern Visayas (VIII) 4.30 7.00 1.80 1.30 3.80
12 Zamboanga Peninsula (IX) 4.30 5.60 2.50 2.90 2.40
13 Northern Mindanao (X) 4.40 4.50 1.30 1.40 3.40
14 Davao Region (XI) 3.20 3.60 2.60 3.20 3.60
15 SOCCSKSARGEN (XII) 3.70 5.20 1.40 2.90 1.90
16 Caraga 3.90 5.30 2.50 1.90 2.40
17 ARMM 3.40 4.10 2.60 2.90 4.50
Source: PSA
REGION 2015 2016 20172013 2014

13. Approved Foreign Investments for periods indicated in million pesos
PHILIPPINES 274,013.55 186,960.02 245,215.70 219,038.60 105,638.67
1 NCR 54,819.61 52,069.71 34,137.33 37,572.42 17,404.60
2 CAR 391.14 1,502.16 26,311.12 24,667.79 143.70
3 Ilocos Region (I) 1,399.85 725.61 6,078.41 10,131.70
4 Cagayan Valley (II) 162.68 341.87 595.68 2,164.50 82.54
5 Central Luzon (III) 119,927.67 25,614.52 22,714.93 13,716.72 10,546.25
6 CALABARZON (IV‐A) 60,459.41 87,189.19 115,647.82 94,336.66 48,351.98
7 MIMAROPA (IV‐B) 106.80 2,264.45 3,842.71 1,272.28 955.07
8 Bicol Region (V) 309.15 . 2,020.16 0.0 240.27
9 Western Visayas (VI) 1,093.06 1,636.33 7,194.81 9,243.05 6,849.84
10 Central Visayas (VII) 17,636.82 7,229.03 11,697.04 13,613.66 6,102.94
11 Eastern Visayas (VIII) 5,419.40 723.54 38.15 2.58 141.25
12 Zamboanga Peninsula (IX) ‐ ‐ 0.0 205.99 0.0
13 Northern Mindanao (X) 2,780.31 2,660.67 3,869.68 1,520.70 2,081.76
14 Davao Region (XI) 6,589.29 504.98 1,733.04 1,285.26 687.81
15 SOCCSKSARGEN (XII) 764.98 2,995.11 6,462.29 10,922.55 657.21
16 Caraga 1,831.37 1,648.63 3,114.63 1,395.95 409.05
17 ARMM 322.00 579.56 0.0 1,040.08 695.40
Several Locations 1 ‐ 0.27 5,096.43 0.0 157.31
No Site Yet 2 ‐ ‐ 14.27 0.0 0.0
Source: Philippine Statistics Authority (PSA)
Coverage of reports: Authority of the Freeport Area of Bataan (AFAB), Board of Investments (BOI),
BOI‐Autonomous Region of Muslim Mindanao (BOI‐ARMM),
Clark Development Corporation (CDC), Cagayan Economic Zone Authority (CEZA),
Philippine Economic Zone Authority (PEZA), and Subic Bay Metropolitan Authority (SBMA).p Preliminary
. Rounds off to zero1 Locations not indicated in the raw data submitted to PSA.2 As indicated in the raw data submitted to PSA.
Source: PSA
2017 pREGION 2013 2014 2015 2016

14. Approved Foreign and Filipino Investments for periods indicated in million pesos
PHILIPPINES754,032.5 755,911.7 686,866.1 685,952.5 908,667.2
1 NCR151,955.0 218,245.6 118,088.0 159,018.1 128,173.9
2 CAR4,219.1 2,202.1 26,441.8 57,421.4 2,440.8
3 Ilocos Region (I)4,992.5 3,944.8 2,920.8 17,388.6 61,920.9
4 Cagayan Valley (II)3,220.0 2,459.5 5,481.9 5,421.4 14,288.2
5 Central Luzon (III)217,399.1 145,104.2 59,987.3 89,888.5 181,204.8
6 CALABARZON (IV‐A)166,656.5 223,968.2 271,262.7 181,680.9 374,748.6
7 MIMAROPA (IV‐B)6,331.8 12,981.3 6,113.2 5,700.0 3,803.1
8 Bicol Region (V)6,286.1 1,514.0 9,305.6 4,476.9 5,510.9
9 Western Visayas (VI)18,075.4 28,089.5 83,856.4 41,221.6 26,738.0
10 Central Visayas (VII)35,377.3 15,253.8 40,934.3 51,031.0 44,874.1
11 Eastern Visayas (VIII)16,332.6 2,065.0 7,493.1 829.8 753.7
12 Zamboanga Peninsula (IX)1,471.1 0.0 16.5 728.8 0.0
13 Northern Mindanao (X)56,881.9 63,774.5 15,935.1 15,413.4 12,633.1
14 Davao Region (XI)52,287.5 14,448.4 7,438.1 27,998.9 13,416.2
15 SOCCSKSARGEN (XII)2,198.1 4,084.0 13,262.7 23,647.3 30,246.7
16 Caraga8,803.4 5,184.1 3,893.3 1,974.3 4,286.6
17 ARMM1,545.0 3,867.7 2,614.1 2,111.4 3,234.5
Several Locations 1
0.0 8,725.0 11,806.8 0.0 393.3
No Site Yet 2 0.0 0.0 14.3 0.0 0.0
Source: PSA
1 Locations not indicated in the raw data submitted to PSA.
2 As indicated in the raw data submitted to PSA.
Coverage of reports: Authority of the Freeport Area of Bataan (AFAB), Board of Investments (BOI), BOI‐Autonomous Region of Muslim Mindanao
(BOI‐ARMM), Clark Development Corporation (CDC), Cagayan Economic Zone Authority (CEZA), Philippine Economic Zone Authority (PEZA),
and Subic Bay Metropolitan Authority (SBMA).
REGION 2013 2014 2015 2016 2017 p

2013 2014 2015 2016 2017
PHILIPPINES 7,551,561 8,457,599 9,165,412 10,491,828 11,704,683
1 NCR 5,347,947 5,916,447 6,194,270 7,069,117 7,879,151
2 CAR 64,568 71,703 83,579 96,425 110,175
3 Ilocos Region (I) 121,182 133,527 158,033 185,367 204,110
4 Cagayan Valley (II) 73,268 85,617 100,826 113,997 128,293
5 Central Luzon (III) 337,235 390,433 455,998 527,290 601,811
6 CALABARZON (IV‐A) 467,711 535,184 620,919 731,257 812,384
7 MIMAROPA (IV‐B) 1/ 37,663 44,630 54,575 65,056 80,335
8 Bicol Region (V) 79,010 90,683 107,426 124,626 140,314
9 Western Visayas (VI) 194,120 216,811 149,948 167,858 319,543
10 Central Visayas (VII) 368,145 430,715 463,518 505,395 582,732
11 Eastern Visayas (VIII) 58,723 70,583 84,925 94,334 109,184
12 Negros Island Region 2/ ‐ ‐ 142,009 160,275 ‐
13 Zamboanga Peninsula (IX) 59,954 70,891 83,613 95,866 107,690
14 Northern Mindanao (X) 98,174 114,626 132,285 152,816 172,437
15 Davao Region (XI) 129,507 150,169 174,259 214,789 240,357
16 SOCCSKSARGEN (XII) 68,388 80,460 93,771 108,077 124,496
17 Caraga 39,680 47,544 55,809 69,266 78,591
18 ARMM 6,287 7,576 9,649 10,017 13,079
Source: SDC‐SES‐BSP
15. Deposit Liabilities in million pesos
Details may not add up to totals due to rounding‐off
REGION
1/ Under Administrative Order No. 129 Palawan was reclassified from Region VI to Mimaropa effective August 31, 2007.
2/ Negros Island Region (NIR) created under Executive Order No. 183 dated 29 May 2015, composed of the provinces of Negros Occidental (formerly from

16. Loans‐to‐Deposits Ratioin percent
2013 2014 2015 2016 2017
PHILIPPINES 56.27 60.25 63.21 65.00 70.57
1NCR 68.00 73.30 79.80 81.75 88.99
2CAR 17.00 16.63 14.65 14.10 13.73
3Ilocos Region (I) 22.00 23.35 23.03 22.46 24.50
4Cagayan Valley (II) 33.00 40.17 40.62 43.01 43.38
5Central Luzon (III) 27.00 30.69 28.22 29.55 33.26
6CALABARZON (IV‐A) 20.00 20.08 18.95 19.63 23.45
7MIMAROPA (IV‐B) 1/ 31.00 32.43 32.69 33.68 33.15
8Bicol Region (V) 32.00 34.25 32.52 34.07 33.18
9Western Visayas (VI) 28.00 28.91 27.56 28.12 30.77
10Central Visayas (VII) 36.00 38.33 40.23 42.42 45.58
11Eastern Visayas (VIII) 27.00 28.86 25.40 24.79 26.69
12Negros Island Region 2/ 25.75 27.54
13Zamboanga Peninsula (IX) 29.00 27.82 25.98 29.75 25.34
14Northern Mindanao (X) 32.00 31.63 29.31 32.38 33.30
15Davao Region (XI) 37.00 39.38 35.16 42.48 40.80
16SOCCSKSARGEN (XII) 36.00 39.88 38.52 46.45 49.35
17Caraga 28.00 29.91 29.05 32.50 32.11
18ARMM 20.00 20.95 17.48 15.85 13.87
1/ Under Administrative Order No. 129 Palawan was reclassified from Region VI to Mimaropa effective August 31,
2007.
Details may not add up to totals due to rounding‐off
2/ Negros Island Region (NIR) created under Executive Order No. 183 dated 29 May 2015, composed of the provinces of Negros
Occidental (formerly from Region VI Western Visayas) and Negros Oriental (formerly from Region VII Central Visayas)
REGION
Source: SDC‐SES‐BSP

17. Bank Density Ratio 1/
in percent
REGION 2013 2014 2015 2016 2017
PHILIPPINES 6.05 6.31 6.55 6.81 7.19
1 NCR 184.76 192.65 198.76 206.12 214.60
2 CAR 1.95 2.01 2.06 2.14 2.30
3 Ilocos Region (I) 3.49 3.65 3.89 4.16 4.70
4 Cagayan Valley (II) 3.33 3.54 3.73 3.85 4.20
5 Central Luzon (III) 2/ 7.68 7.95 8.37 8.82 9.30
6 CALABARZON (IV‐A) 3/ 10.63 11.03 11.42 11.73 12.20
7 MIMAROPA (IV‐B) 3/ 3.01 3.21 3.37 3.66 3.80
8 Bicol Region (V) 3.10 3.33 3.48 3.75 4.10
9 Western Visayas (VI) 3/ 4.30 4.51 4.22 4.50 5.20
10 Central Visayas (VII) 4.95 5.17 5.79 5.87 6.00
11 Eastern Visayas (VIII) 1.28 1.30 1.40 1.47 1.60
12 Negros Island Region 4/ ‐ ‐ 4.93 5.21 ‐
13 Zamboanga Peninsula (IX) 2.76 2.79 2.99 3.06 3.10
14 Northern Mindanao (X) 3.73 3.96 4.04 4.12 4.30
15 Davao Region (XI) 7.92 8.08 8.33 8.65 9.10
16 SOCCSKSARGEN (XII) 3.94 4.28 4.44 4.64 5.00
17 Caraga 2.84 2.99 2.99 2.85 2.90
18 ARMM 0.18 0.18 0.18 0.16 0.20
3/ Executive Order No. 103 dated May 17, 2002 divided Region IV (Southern Tagalog) into Region IV‐A (CALABARZON) and Region IV‐
B (MIMAROPA). Under Administrative Order No. 129 Palawan was reclassified from Region VI to MIMAROPA effective August 31,
2007.
2/ Inclusive of the province of Aurora effective May 17, 2002 as provided under Executive Order No. 103
1/ Ratio of the Number of Banking Offices to the Number of Municipalities and Cities Per Region
4/ Negros Island Region (NIR) created under Executive Order No. 183 dated 29 May 2015, composed of the provinces of Negros
Data Source: SDC‐SES‐BSP
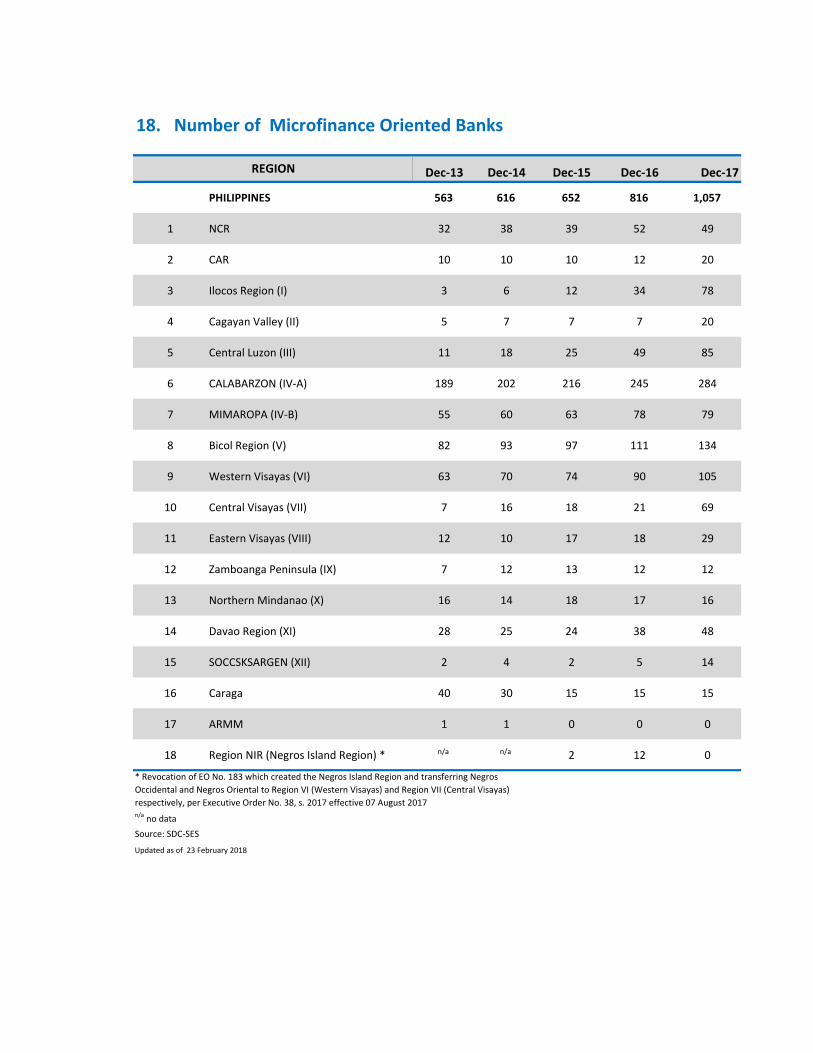
18. Number of Microfinance Oriented Banks
Dec‐17
PHILIPPINES 563 616 652 816 1,057
1 NCR 32 38 39 52 49
2 CAR 10 10 10 12 20
3 Ilocos Region (I) 3 6 12 34 78
4 Cagayan Valley (II) 5 7 7 7 20
5 Central Luzon (III) 11 18 25 49 85
6 CALABARZON (IV‐A) 189 202 216 245 284
7 MIMAROPA (IV‐B) 55 60 63 78 79
8 Bicol Region (V) 82 93 97 111 134
9 Western Visayas (VI) 63 70 74 90 105
10 Central Visayas (VII) 7 16 18 21 69
11 Eastern Visayas (VIII) 12 10 17 18 29
12 Zamboanga Peninsula (IX) 7 12 13 12 12
13 Northern Mindanao (X) 16 14 18 17 16
14 Davao Region (XI) 28 25 24 38 48
15 SOCCSKSARGEN (XII) 2 4 2 5 14
16 Caraga 40 30 15 15 15
17 ARMM 1 1 0 0 0
18 Region NIR (Negros Island Region) * n/a n/a 2 12 0
n/a no data
Source: SDC‐SES
Updated as of 23 February 2018
Dec‐16
* Revocation of EO No. 183 which created the Negros Island Region and transferring Negros
Occidental and Negros Oriental to Region VI (Western Visayas) and Region VII (Central Visayas)
respectively, per Executive Order No. 38, s. 2017 effective 07 August 2017
REGION Dec‐13 Dec‐14 Dec‐15

19. MICROFINANCE LOANS OUTSTANDING IN THE BANKING SYSTEM for periods indicated in million pesos
PHILIPPINES 8,701.24 11,372.82 11,255.62 13,740.80 17,110.93
1 NCR 658.70 2,049.81 367.12 630.39 909.84
2 CAR 5.89 0.47 1.05 0.77 1.36
3 Ilocos Region (I) 80.59 10.66 5.88 8.04 5.82
4 Cagayan Valley (II) 139.49 118.61 94.57 106.59 115.28
5 Central Luzon (III) 350.69 295.11 381.02 342.71 497.13
6 CALABARZON (IV‐A) 4,972.90 6,454.74 7,889.08 9,846.56 12,455.30
7 MIMAROPA (IV‐B) 30.82 34.71 35.59 35.13 23.99
8 Bicol Region (V) 189.83 218.72 261.68 328.60 337.79
9 Western Visayas (VI) 583.88 689.67 572.46 619.35 754.25
10 Central Visayas (VII) 318.82 317.88 352.59 404.17 431.93
11 Eastern Visayas (VIII) 15.54 18.32 17.98 20.28 21.74
12 Negros Island Region 90.19 91.02
13 Zamboanga Peninsula (IX) 330.86 323.31 290.62 388.17 562.49
14 Northern Mindanao (X) 159.27 243.05 285.73 288.85 332.44
15 Davao Region (XI) 122.19 113.46 134.52 169.01 179.14
16 SOCCSKSARGEN (XII) 82.11 87.31 101.98 104.02 122.15
17 Caraga 659.68 397.01 373.55 357.13 360.30
18 ARMM
Notes:
Regional grouping based on the location of bank's head office
Executive Order No. 183 (s. 2015) created the Negros Island Region.
Executive Order No. 38 (s. 2017) revoked Executive Order No. 183
Data Source: SDC‐ BSP
REGION 2015 2016 20172013 2014

20. MICROFINANCE BORROWERS IN THE BANKING SYSTEM for periods indicated
PHILIPPINES 1,049,988 1,229,825 1,471,896 1,686,152 1,956,276
1 NCR 19,043.0 36,421.0 31,066 30,423 27,595
2 CAR 255.0 39.0 85 51 53
3 Ilocos Region (I) 6,540.0 1,775.0 1,415 1,320 780
4 Cagayan Valley (II) 17,230.0 15,431.0 13,574 13,430 12,014
5 Central Luzon (III) 41,317.0 38,413.0 51,975 58,077 62,143
6 CALABARZON (IV‐A) 615,395.0 824,417.0 1,070,179 1,288,983 1,553,541
7 MIMAROPA (IV‐B) 2,485.0 3,079.0 3,228 3,467 2,881
8 Bicol Region (V) 34,449.0 26,047.0 29,050 30,901 28,520
9 Western Visayas (VI) 64,157.0 72,913.0 64,550 66,803 72,467
10 Central Visayas (VII) 34,592.0 31,530.0 25,983 26,593 34,675
11 Eastern Visayas (VIII) 2,391.0 1,484.0 1,402 1,325 1,352
12 Negros Island Region 7,697 8,445
13 Zamboanga Peninsula (IX) 45,212.0 39,617.0 37,901 35,207 41,471
14 Northern Mindanao (X) 29,524.0 27,428.0 26,715 21,971 21,635
15 Davao Region (XI) 8,790.0 8,275.0 8,668 8,598 8,409
16 SOCCSKSARGEN (XII) 15,673.0 17,201.0 17,750 16,517 16,681
17 Caraga 112,935.0 85,755.0 80,658 74,041 72,059
18 ARMM
Notes: Regional grouping based on the location of bank's head officeExecutive Order No. 183 (s. 2015) created the Negros Island Region. Executive Order No. 38 (s. 2017) revoked Executive Order No. 183.
REGION 2015 2016 20172013 2014