Embed Size (px)
Citation preview

IN THIS ISSUE
THE CONNECTICUT
ECONOMIC DIGESTVVVVVol.4 No.3ol.4 No.3ol.4 No.3ol.4 No.3ol.4 No.3 A joint publication of the Connecticut Department of Labor & the Connecticut Department of Economic and Community DevelopmentA joint publication of the Connecticut Department of Labor & the Connecticut Department of Economic and Community DevelopmentA joint publication of the Connecticut Department of Labor & the Connecticut Department of Economic and Community DevelopmentA joint publication of the Connecticut Department of Labor & the Connecticut Department of Economic and Community DevelopmentA joint publication of the Connecticut Department of Labor & the Connecticut Department of Economic and Community Development
●●●●●
MARCH 1999
IndustrIndustrIndustrIndustrIndustry Clustersy Clustersy Clustersy Clustersy Clusters ........................................................................................................................ 33333Housing UpdateHousing UpdateHousing UpdateHousing UpdateHousing Update ............................................................................................................................. 33333Leading & Coincident Indicators 5Leading & Coincident Indicators 5Leading & Coincident Indicators 5Leading & Coincident Indicators 5Leading & Coincident Indicators 5Economic IndicatorsEconomic IndicatorsEconomic IndicatorsEconomic IndicatorsEconomic Indicators ................................................................................ 6-86-86-86-86-8ComparComparComparComparComparativativativativative Regional Datae Regional Datae Regional Datae Regional Datae Regional Data ........................................ 99999Economic Indicator Economic Indicator Economic Indicator Economic Indicator Economic Indicator TTTTTrendsrendsrendsrendsrends .................... 10-1310-1310-1310-1310-13NonfNonfNonfNonfNonfarararararm Empl.m Empl.m Empl.m Empl.m Empl. Estimates Estimates Estimates Estimates Estimates ......................... 14-1914-1914-1914-1914-19Labor FLabor FLabor FLabor FLabor Force Estimatesorce Estimatesorce Estimatesorce Estimatesorce Estimates ...................................................................... 2020202020Hours and EarHours and EarHours and EarHours and EarHours and Earningsningsningsningsnings .......................................................................................... 2121212121Housing PHousing PHousing PHousing PHousing Pererererermit Activitymit Activitymit Activitymit Activitymit Activity ........................................ 21-2221-2221-2221-2221-22TTTTTechnical Notesechnical Notesechnical Notesechnical Notesechnical Notes ........................................................................................................................ 2323232323At a GlanceAt a GlanceAt a GlanceAt a GlanceAt a Glance ........................................................................................................................................................... 2424242424
●●●●●
By J. Charles Joo, Research Analyst
1998 Economy: At Full Speed
NNNNN
THE CONNECTICUT ECONOMIC DIGESTMarch 1999
■■■■■ Last yLast yLast yLast yLast year’ear’ear’ear’ear’s job gs job gs job gs job gs job grororororowth wwth wwth wwth wwth wasasasasasthe strongest since thethe strongest since thethe strongest since thethe strongest since thethe strongest since thecurrent recovery began incurrent recovery began incurrent recovery began incurrent recovery began incurrent recovery began in1992. (article, pp.1-4)1992. (article, pp.1-4)1992. (article, pp.1-4)1992. (article, pp.1-4)1992. (article, pp.1-4)
■■■■■ Industry clusters: leanIndustry clusters: leanIndustry clusters: leanIndustry clusters: leanIndustry clusters: leanmanufacturing to bemanufacturing to bemanufacturing to bemanufacturing to bemanufacturing to bepromoted.promoted.promoted.promoted.promoted. (p.3) (p.3) (p.3) (p.3) (p.3)
■■■■■ Employment rose in Janu-Employment rose in Janu-Employment rose in Janu-Employment rose in Janu-Employment rose in Janu-ary by 200, and 29,100ary by 200, and 29,100ary by 200, and 29,100ary by 200, and 29,100ary by 200, and 29,100above a year ago. (p.6)above a year ago. (p.6)above a year ago. (p.6)above a year ago. (p.6)above a year ago. (p.6)
■■■■■ Unemployment rate in Janu-Unemployment rate in Janu-Unemployment rate in Janu-Unemployment rate in Janu-Unemployment rate in Janu-ary: 3.0 percent, down fromary: 3.0 percent, down fromary: 3.0 percent, down fromary: 3.0 percent, down fromary: 3.0 percent, down from3.2 percent in December3.2 percent in December3.2 percent in December3.2 percent in December3.2 percent in December.....(p.6)(p.6)(p.6)(p.6)(p.6)
■■■■■ JJJJJanananananuaruaruaruaruary’y’y’y’y’s nes nes nes nes new housingw housingw housingw housingw housingpermits were up 1.6 percentpermits were up 1.6 percentpermits were up 1.6 percentpermits were up 1.6 percentpermits were up 1.6 percentooooovvvvver the yer the yer the yer the yer the yearearearearear..... (p (p (p (p (p.7).7).7).7).7)
■■■■■ Initial unemployment claimsInitial unemployment claimsInitial unemployment claimsInitial unemployment claimsInitial unemployment claimsrose from last Jrose from last Jrose from last Jrose from last Jrose from last Janananananuaruaruaruaruaryyyyy..... (p (p (p (p (p.7).7).7).7).7)
■■■■■ Hartford help wanted index:Hartford help wanted index:Hartford help wanted index:Hartford help wanted index:Hartford help wanted index:down from a year ago. (p.6)down from a year ago. (p.6)down from a year ago. (p.6)down from a year ago. (p.6)down from a year ago. (p.6)
ot only did it not sink lastyear, Connecticut’s
economic ship continued to ridethe wave of economic recovery atfull speed. Among positive eco-nomic indicators, the number ofnew auto registrations processedreached 212,060, an all time highin the 36-year history of record-keeping for this indicator. Newhousing permit figures rose in1998 to a new high since 1989,finally breaking the 10,000 markin the current recovery. Thenumber of initial claims for unem-ployment, which has been declin-ing since 1992, was at its lowestlevel in a decade. The number ofcommercial airline passengers,increasing in the last five consecu-tive years, finished the 1989-1998period at a new high. And since1992, Connecticut personalincome has been growing strong,consistently outpacing the infla-tion rate; last year�s rise in incomeexceeded the rise in the cost ofliving by nearly three percentagepoints. (See page 4 for a full page
of economic indicators for the pastdecade.)
Strongest Job Growth Connecticut ended 1998 with atwo percent employment gain, thestrongest job growth since thecurrent recovery began in 1992.Last year�s annual average in-crease of 32,400 nonfarm jobs wasmore than the revised figure of29,000 jobs gained the yearbefore. The Nutmeg State now hasregained nine out of every ten jobslost during the 1989-92 recession.Although the nation�s employmentgrew faster, 2.6 percent over theyear, our State now appearspoised to exceed the fringes ofrecovery and move into full-fledgedexpansion! The newlybenchmarked unemployment ratefor 1998 dropped to 3.4 percentfrom 5.1 percent the year before,making it the lowest rate since thepre-recession year of 1988 (3.0%).This was well below the nation�s4.5 percent unemployment ratelast year.
Employment Changes By Major Industry Division: 1997 To 1998
Mfg.
Finance,Insur.,
Real Est.
RetailtradeConst.
Transp. &Pub. Util.
Govt.
Wholesaletrade
Services
0
5,000
10,000
15,000
20,000
THE CONNECTICUT ECONOMIC DIGEST●●●●●22222 March 1999
ECONOMIC DIGEST
ConnecticutDepartment of Labor
THE CONNECTICUT
The Connecticut Economic Digest The Connecticut Economic Digest The Connecticut Economic Digest The Connecticut Economic Digest The Connecticut Economic Digest ispublished monthly by the ConnecticutDepartment of Labor, Office of Research andthe Connecticut Department of Economic andCommunity Development, Public andGovernment Relations Division. Its purpose isto regularly provide users with a compre-hensive source for the most current, up-to-datedata available on the workforce and economyof the state, within perspectives of the regionand nation.
The views expressed by authors are theirsalone and do not necessarily reflect those ofthe Departments of Labor or Economic andCommunity Development.
To receive this publication free of charge writeto: The Connecticut Economic DigestThe Connecticut Economic DigestThe Connecticut Economic DigestThe Connecticut Economic DigestThe Connecticut Economic Digest,Connecticut Department of Labor, Office ofResearch, 200 Folly Brook Boulevard,Wethersfield, CT 06109-1114; or call: (860)263-6275. Current subscribers who do not wishto continue receiving the publication or whohave a change of address are asked to fill outthe information on the back cover and return itto the above address.
Contributing DOL Staff:Contributing DOL Staff:Contributing DOL Staff:Contributing DOL Staff:Contributing DOL Staff: Salvatore DiPillo,Lincoln S. Dyer, Arthur Famiglietti, NoreenPassardi and Joseph Slepski. ManagingManagingManagingManagingManagingEditorEditorEditorEditorEditor::::: J. Charles Joo. Contr Contr Contr Contr Contribibibibibuting DECDuting DECDuting DECDuting DECDuting DECDStaff:Staff:Staff:Staff:Staff: Todd Bentsen, Kolie Chang, RobertDamroth and Mark Prisloe. We would also liketo thank our associates at the ConnecticutCenter for Economic Analysis, University ofConnecticut, for their contributions to theDigest.
James F. Abromaitis, CommissionerRita Zangari, Deputy Commissioner
Public and Government Relations DivisionResearch Unit505 Hudson StreetHartford, CT 06106-2502Phone: (860) 270-8165Fax: (860) 270-8188E-Mail: [email protected]
Connecticut Departmentof Economic andCommunity Development
James P. Butler, CommissionerJean E. Zurbrigen, Deputy Commissioner
Roger F. Therrien, DirectorOffice of Research200 Folly Brook BoulevardWethersfield, CT 06109-1114Phone: (860) 263-6275Fax: (860) 263-6263E-Mail: [email protected]
RESEARCH
DECD
1998-99 1998-99 1998-99 1998-99 1998-99 TTTTTooooown Profileswn Profileswn Profileswn Profileswn Profiles Released Released Released Released ReleasedThe Connecticut Connecticut Connecticut Connecticut Connecticut TTTTTooooown Profiles 1998-99wn Profiles 1998-99wn Profiles 1998-99wn Profiles 1998-99wn Profiles 1998-99 are completed, and are available from the ResearchSection of the Public and Government Relations Division of the Department of Economic andCommunity Development. Up to five profiles can be sent out at no cost. A book with all 169 townprofiles plus regional profiles and maps can be obtained for $40 plus tax. County profiles areavailable for $10 plus tax per county. To request individual town profiles or an order form, callAnnette at (860) 270-8165, or e-mail her at [email protected].
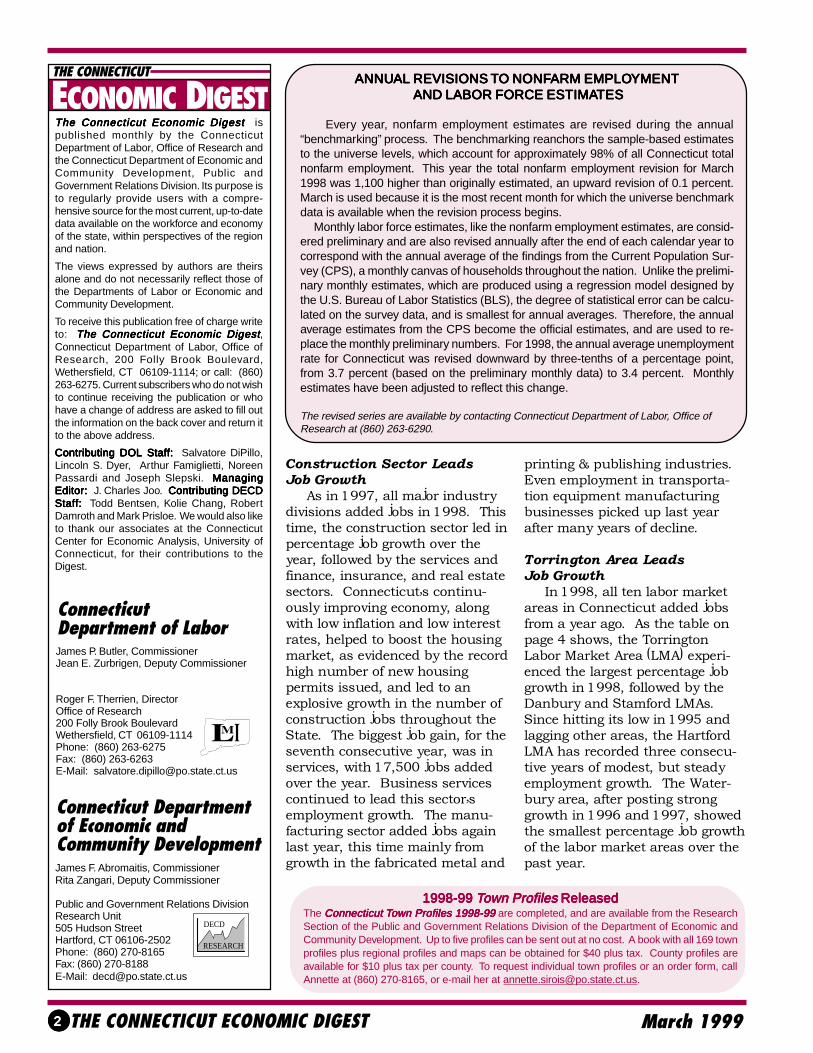
Construction Sector LeadsJob Growth As in 1997, all major industrydivisions added jobs in 1998. Thistime, the construction sector led inpercentage job growth over theyear, followed by the services andfinance, insurance, and real estatesectors. Connecticut�s continu-ously improving economy, alongwith low inflation and low interestrates, helped to boost the housingmarket, as evidenced by the recordhigh number of new housingpermits issued, and led to anexplosive growth in the number ofconstruction jobs throughout theState. The biggest job gain, for theseventh consecutive year, was inservices, with 17,500 jobs addedover the year. Business servicescontinued to lead this sector�semployment growth. The manu-facturing sector added jobs againlast year, this time mainly fromgrowth in the fabricated metal and
printing & publishing industries.Even employment in transporta-tion equipment manufacturingbusinesses picked up last yearafter many years of decline.
Torrington Area LeadsJob Growth In 1998, all ten labor marketareas in Connecticut added jobsfrom a year ago. As the table onpage 4 shows, the TorringtonLabor Market Area (LMA) experi-enced the largest percentage jobgrowth in 1998, followed by theDanbury and Stamford LMAs.Since hitting its low in 1995 andlagging other areas, the HartfordLMA has recorded three consecu-tive years of modest, but steadyemployment growth. The Water-bury area, after posting stronggrowth in 1996 and 1997, showedthe smallest percentage job growthof the labor market areas over thepast year.
ANNUANNUANNUANNUANNUAL REVISIONS AL REVISIONS AL REVISIONS AL REVISIONS AL REVISIONS TTTTTO NONFO NONFO NONFO NONFO NONFARM EMPLOARM EMPLOARM EMPLOARM EMPLOARM EMPLOYMENTYMENTYMENTYMENTYMENT AND LABOR FORCE ESTIMA AND LABOR FORCE ESTIMA AND LABOR FORCE ESTIMA AND LABOR FORCE ESTIMA AND LABOR FORCE ESTIMATESTESTESTESTES
Every year, nonfarm employment estimates are revised during the annual“benchmarking” process. The benchmarking reanchors the sample-based estimatesto the universe levels, which account for approximately 98% of all Connecticut totalnonfarm employment. This year the total nonfarm employment revision for March1998 was 1,100 higher than originally estimated, an upward revision of 0.1 percent.March is used because it is the most recent month for which the universe benchmarkdata is available when the revision process begins. Monthly labor force estimates, like the nonfarm employment estimates, are consid-ered preliminary and are also revised annually after the end of each calendar year tocorrespond with the annual average of the findings from the Current Population Sur-vey (CPS), a monthly canvas of households throughout the nation. Unlike the prelimi-nary monthly estimates, which are produced using a regression model designed bythe U.S. Bureau of Labor Statistics (BLS), the degree of statistical error can be calcu-lated on the survey data, and is smallest for annual averages. Therefore, the annualaverage estimates from the CPS become the official estimates, and are used to re-place the monthly preliminary numbers. For 1998, the annual average unemploymentrate for Connecticut was revised downward by three-tenths of a percentage point,from 3.7 percent (based on the preliminary monthly data) to 3.4 percent. Monthlyestimates have been adjusted to reflect this change.
The revised series are available by contacting Connecticut Department of Labor, Office ofResearch at (860) 263-6290.

THE CONNECTICUT ECONOMIC DIGEST ●●●●●33333March 1999
Lean ManufacturingTo Be Promoted
he Manufacturing ClusterAdvisory Board in its
Industry Clusters
ommissioner James F.Abromaitis of the Connecticut
January Housing Permits Up 1.6%CCCCC
HOUSING UPDATE
For morFor morFor morFor morFor more infore infore infore infore information on housing permation on housing permation on housing permation on housing permation on housing permits, see tables on pages 21-22.mits, see tables on pages 21-22.mits, see tables on pages 21-22.mits, see tables on pages 21-22.mits, see tables on pages 21-22.
TTTTT
Rabbit, Run In the Chinese calendar, 1999is the Year of the Rabbit, and likethe rabbit in the famous race withthe turtle, Connecticut is off to agood start. The State has gainedanother 200 jobs in January of1999, providing the economy with29,100 more jobs than a year ago.But with ever-increasing uncer-tainties in the national and globaleconomies, and with businesscycle fluctuations being almost as
certain as deathand taxes, will theState�s 1999economy take anap in the race tobe globally com-petitive? One signof the rabbit losingits edge is that thelabor force in theState dropped lastyear, following twoyears of increases.
Also the Hartford help wantedindex stayed the same, after risingfor the last six years. Moreover,the State Labor Department�srecord of new business startsshowed a decline, while the num-ber of business terminationsincreased in 1998. So lest theslow, but constantly competitiveturtle sneak up on us, it is impor-tant Connecticut keep its paceand, borrowing from Updike, runRabbit, Run. n
Connec t i cu tConnec t i cu tSpri ng Job Fai rsSpri ng Job Fai rs
Call the Call the Job Fair Hotline at (860)263-6306Job Fair Hotline at (860)263-6306 or visit our or visit ourWeb site at Web site at www.www.ctdolctdol.state..state.ctct.us.us for on-line registration. for on-line registration.
MANCHESTER
Eastern Connecticut State University
March 25th, 9:00 a.m. - 1:30 p.m.
Manchester Comm-Tech College
March 27th, 9:00 a.m. - 1:00 p.m.
St. Paul�s High School
April 22nd, 9:00 a.m. - 1:00 p.m.
WILLIMANTIC
BRISTOLinitial recommendations calledfor a �Manufacturing ResourceCenter� to enhance smallermanufacturers in their ability toface increased national andinternational challenges. TheConnecticut Technology Exten-sion Program, CONN/STEP wasdesignated as the lead organiza-tion in this initiative.
Working closely with industrycluster representatives, a three-year business plan was finalizedand Industry Cluster representa-tives have been placed on theBoard of CONN/STEP to overseethe plan�s implementation. Acost-sharing system for first timeusers of the ManufacturingResource Center has been estab-lished to reduce the cost andincrease the affordability tosmaller firms.
The Center will promote theadoption of �lean manufacturing�a philosophy and approach tomanufacturing operations thatinvolves re-engineering withemployee involvement, changesin plant layout, just-in-timeinventory, cellular manufactur-ing, product design changes, andother aspects of continuousimprovement in process. Ulti-mately the changes lead toimproved operational and finan-cial performance.
Over the last two years, morethan 30 Connecticut manufactur-ers have benefited from an on-site simulation of lean manufac-turing practices demonstrated byCONN/STEP. The Department ofEconomic and CommunityDevelopment is providing fundingmatched by federal and otherresources available to CONN/STEP.
Department of Economic andCommunity Development an-nounced that Connecticut com-munities authorized 749 newhousing units in January 1999, a1.6 percent increase compared toJanuary of 1998 when 737 wereauthorized. �The Connecticut housingmarket continues to showstrength,� CommissionerAbromaitis said. �The increase inhousing starts, especially in NewHaven County, is particularlynoteworthy.� Reports from municipalofficials throughout the state
indicate that New Haven Countywith 261.8 percent showed thegreatest percentage increase inJanuary compared to the samemonth a year ago. TollandCounty followed with an 18.8percent increase. New Haven County docu-mented the largest number ofnew, authorized units in Januarywith 369. Hartford Countyfollowed with 117 units andFairfield County had 110 units.City of New Haven led all Con-necticut communities with 195units, followed by Milford with112 and Glastonbury with 21. n

THE CONNECTICUT ECONOMIC DIGEST●●●●●44444 March 1999
INDICATOR \ YEAR 1989 1990 1991 1992 1993 1994 1995 1996 1997 1998 1997-98EMPLOYMENT (000s) Statewide Total Industries 1,665.6 1,623.5 1,555.2 1,526.2 1,531.1 1,543.7 1,561.5 1,583.6 1,612.6 1,645.0 2.0% Construction & Mining 76.2 62.9 52.2 48.3 48.6 50.0 51.1 53.1 57.1 59.4 4.0% Construction 75.1 61.9 51.4 47.4 47.6 49.3 50.4 52.4 56.3 58.6 4.1% Mining 1.1 1.0 0.8 0.9 0.9 0.7 0.7 0.7 0.8 0.8 0.0% Manufacturing 359.3 341.0 322.5 305.7 294.1 285.1 279.0 274.8 276.1 278.5 0.9% Durable 267.9 252.0 235.9 221.5 210.6 201.4 196.3 193.7 194.1 195.9 0.9% Nondurable 91.5 89.0 86.5 84.2 83.6 83.7 82.8 81.1 82.1 82.6 0.6% Transportation & Public Utilities 72.4 72.4 70.0 68.0 69.5 70.4 71.3 73.7 75.0 75.5 0.7% Trade 375.7 360.3 339.5 331.3 330.3 335.4 341.0 347.0 351.5 355.7 1.2% Wholesale 89.7 86.0 81.6 77.5 75.3 76.1 77.9 80.5 82.4 83.3 1.1% Retail 286.0 274.3 257.9 253.8 255.0 259.3 263.1 266.6 269.2 272.4 1.2% Finance, Insurance, Real Estate 151.7 151.6 147.5 142.4 139.8 135.6 132.5 130.2 132.1 136.0 3.0% Services 422.7 425.0 415.9 423.1 438.1 449.9 465.7 482.0 495.0 512.5 3.5% Government 207.7 210.4 207.6 207.4 210.7 217.2 220.9 222.8 225.7 227.4 0.8% Labor Market Areas - Total Industries Bridgeport LMA 198.2 192.1 181.7 176.0 175.7 178.0 178.9 179.8 184.3 186.9 1.4% Danbury LMA 85.5 84.9 81.6 81.3 81.8 82.8 83.2 83.8 85.8 88.3 2.9% Danielson LMA 19.2 18.7 17.9 17.8 18.2 18.8 19.6 20.3 19.9 20.3 2.0% Hartford LMA 652.8 639.9 607.8 588.3 585.5 586.5 584.5 590.2 597.8 604.3 1.1% Lower River LMA 9.2 8.9 8.7 8.3 8.6 8.7 8.7 9.3 9.3 9.5 2.2% New Haven LMA 261.3 254.6 241.7 237.0 238.4 238.9 241.0 244.7 249.4 254.4 2.0% New London LMA 129.7 126.1 120.4 121.7 124.1 128.4 131.6 132.6 136.2 138.0 1.3% Stamford LMA 196.9 189.8 181.9 179.3 183.6 185.2 190.4 196.1 201.5 206.3 2.4% Torrington LMA 28.2 28.0 27.1 26.6 27.0 27.1 27.6 27.6 28.6 29.5 3.1% Waterbury LMA 87.9 84.5 82.0 79.6 80.1 80.5 82.0 83.9 85.8 86.5 0.8%
UNEMPLOYMENT Labor Force (000s) 1,761.0 1,833.2 1,841.4 1,819.5 1,784.4 1,737.3 1,711.1 1,718.5 1,723.3 1,709.3 -0.8% Employed (000s) 1,697.0 1,738.7 1,716.2 1,680.8 1,672.6 1,640.6 1,616.9 1,619.8 1,635.4 1,651.9 1.0% Unemployed (000s) 64.0 94.5 125.1 138.7 111.8 96.8 94.3 98.7 87.9 57.4 -34.7% Unemployment Rate* 3.7% 5.2% 6.8% 7.6% 6.3% 5.6% 5.5% 5.7% 5.1% 3.4% -1.7 Average Weekly Initial Claims 4,233 5,428 6,673 6,094 5,335 4,998 4,795 4,345 3,902 3,743 -4.1% Hartford Help Wanted (1987=100) 58 34 21 25 29 33 34 35 36 36 0.0% Insured Unemployment Rate* 1.88% 2.86% 3.96% 3.91% 3.53% 3.39% 3.10% 2.80% 2.31% 2.06% -0.25
MANUFACTURING ACTIVITY Average Weekly Hours 42.2 42.0 41.8 41.7 42.1 42.8 42.8 42.5 42.6 42.7 0.2% Average Hourly Earnings $11.21 $11.53 $11.99 $12.46 $13.01 $13.53 $13.71 $14.01 $14.46 $14.83 2.6% Average Weekly Earnings $473.06 $484.26 $501.18 $519.58 $547.72 $579.08 $586.79 $595.43 $616.00 $633.24 2.8% Output Index (1982=100) 121.2 115.7 114.7 115.2 118.3 117.7 117.2 117.7 120.9 124.6 3.1%
INCOME (mil.$) Personal Income $83,421 $87,002 $87,837 $92,749 $95,588 $98,966 $104,777 $110,550 $117,565 $122,871 4.5% UI Covered Wages $45,564 $46,932 $47,217 $49,122 $50,082 $51,624 $54,197 $57,194 $61,771 $66,328 7.4%
BUSINESS ACTIVITY New Housing Permits 12,464 7,804 7,702 8,259 8,969 9,443 8,307 7,714 9,054 11,541 27.5% Electric Sales (mil kWh) 26,966 26,828 26,776 26,742 26,931 27,887 27,851 28,387 28,352 NA NA Retail Sales (bil.$) $28.58 $27.05 $26.75 $27.01 $28.47 $29.96 $31.24 $34.36 $36.41 NA NA Construction Contracts (1980=100) NA 191.5 188.2 180.1 203.3 203.5 216.2 236.8 256.7 217.5 -15.3% New Auto Registrations 128,997 106,157 95,870 139,225 176,372 211,724 189,962 177,464 178,599 212,060 18.7% Air Cargo Tons 88,018 91,243 104,416 110,508 117,930 127,454 115,040 130,536 135,294 141,825 4.8% Business Starts, Avg (DOL) 871 783 706 697 742 826 810 833 868 831 -4.3% Business Terminations, Avg (DOL) 954 999 1,020 1,003 996 976 953 1,056 969 1,019 5.2%
Annual Connecticut Economic Indicators: 1989-98
STATE TAX COLLECTIONS (Fiscal Year Totals, mil.$) Total All Taxes $4,683.4 $5,125.1 $4,865.4 $5,934.0 $6,493.1 $6,818.5 $7,299.7 $7,778.8 $8,115.3 $8,747.9 7.8% Corporate Tax $869.0 $792.5 $667.6 $640.3 $713.4 $701.9 $723.5 $746.2 $675.1 $659.9 -2.3% Personal Income Tax NA NA NA $1,935.0 $2,384.8 $2,509.6 $2,587.4 $2,877.8 $3,109.3 $3,595.8 15.6% Real Estate Conveyance Tax $65.6 $59.3 $48.6 $50.2 $53.7 $60.5 $62.6 $63.2 $74.1 $91.2 23.1% Sales & Use Tax $2,098.0 $2,479.1 $2,418.3 $2,080.0 $2,056.2 $2,181.6 $2,367.2 $2,461.1 $2,611.5 $2,775.1 6.3%
TOURISM AND TRAVEL Tourism Inquiries NA 76,924 105,795 97,772 173,912 290,344 332,612 373,985 293,467 265,626 -9.5% Info Center Visitors NA NA NA NA NA 397,296 538,535 545,026 550,958 605,939 10.0% Major Attraction Visitors (000s) NA NA NA 1,844.8 1,843.1 1,856.7 1,930.1 1,648.9 1,752.4 1,655.1 -5.6% Hotel-Motel Occupancy* NA NA NA 57.6% 58.9% 63.6% 70.5% 70.4% 74.0% 73.7% -0.3 Air Passenger Count (000s) 4,778.9 4,889.8 4,453.3 4,579.5 4,570.7 4,662.5 4,998.0 5,377.8 5,421.9 5,636.5 4.0%*1997-98 change is in percentage point; NA: Not Available

THE CONNECTICUT ECONOMIC DIGEST ●●●●●55555March 1999
LEADING AND COINCIDENT INDICATORSLEADING INDEXLEADING INDEXLEADING INDEXLEADING INDEXLEADING INDEX COINCIDENT INDEXCOINCIDENT INDEXCOINCIDENT INDEXCOINCIDENT INDEXCOINCIDENT INDEX
Source:Source:Source:Source:Source: Connecticut Center f Connecticut Center f Connecticut Center f Connecticut Center f Connecticut Center for Economic Analysisor Economic Analysisor Economic Analysisor Economic Analysisor Economic Analysis, Univ, Univ, Univ, Univ, University of Connecticut.ersity of Connecticut.ersity of Connecticut.ersity of Connecticut.ersity of Connecticut. De De De De Devvvvveloped beloped beloped beloped beloped by Py Py Py Py Pami Dua [Economic Cycleami Dua [Economic Cycleami Dua [Economic Cycleami Dua [Economic Cycleami Dua [Economic CycleResearch CenterResearch CenterResearch CenterResearch CenterResearch Center;;;;; NY NY NY NY NY, NY] and Stephen M., NY] and Stephen M., NY] and Stephen M., NY] and Stephen M., NY] and Stephen M. Miller [(860) 486-3853, Storrs Campus]. Miller [(860) 486-3853, Storrs Campus]. Miller [(860) 486-3853, Storrs Campus]. Miller [(860) 486-3853, Storrs Campus]. Miller [(860) 486-3853, Storrs Campus]. Kathr Kathr Kathr Kathr Kathryn E.yn E.yn E.yn E.yn E. P P P P Parr and Hulyarr and Hulyarr and Hulyarr and Hulyarr and Hulya a a a a VVVVVarol [(860) 486-arol [(860) 486-arol [(860) 486-arol [(860) 486-arol [(860) 486-3022, Storrs Campus] provided research support.3022, Storrs Campus] provided research support.3022, Storrs Campus] provided research support.3022, Storrs Campus] provided research support.3022, Storrs Campus] provided research support.
The distance from peak to trough, indicated by the shaded areas, measures the duration of an employment cycle recession. The vertical scale in bothcharts is an index with 1987=100.
Connecticut And Nation End Year OnStrong Positive Note
he Connecticut coincidentemployment indexTTTTT
moved much higher, and to anew peak, with the release of(preliminary) December data, inlarge part due to the fall in theunemployment rate from 3.8 to3.1 percent. The coincident indexhas now reached a level not seensince March 1990. The leadingemployment index also movedhigher in December, primarily aresult of the decline in initialclaims for unemployment insur-ance and the increase in housingpermits. Compared to its priorlevels over the last year, theleading index now exceeds theselevels in six of the twelve monthsand falls short of them in theother six. We have carefullymonitored the leading index overthe past year because its move-ments have raised some concernabout the possibility of an im-pending downturn in the Con-necticut economy. The Decembernumber provides some breathingroom from such concerns and
allows us to continue to call foran expansion through 1999. Events at the national andinternational levels, which pro-vide a key component to thefuture of the Connecticuteconomy, continue to offersurprises to analysts and pun-dits. The most recent unexpect-edly robust growth in U.S. realGDP in the fourth quarter of1998 sends a positive signalabout the strength and durabilityof the current expansion. Thisexpansion is now approachingthe longest peace-time one onrecord. The Asian crisis and thelaunching of the Euro in theEuropean Union, however, bothadd some uncertainty to fore-casts about future economicactivity. Moreover, the stockmarkets around the globe re-spond quickly to rumors andrumors of rumors (for example,will the Fed raise interest rates atits next meeting?). To date,however, few analysts foresee adownturn in the U.S. economy inthe near term.
In summary, the coincidentemployment index rose from 93.5in December 1997 to 98.4 inDecember 1998. All four compo-nents of the index, once again,point in a positive direction on ayear-over-year basis with highernonfarm employment, highertotal employment, a lower in-sured unemployment rate, and alower total unemployment rate. The leading employmentindex increased from 89.0 inDecember 1997 to 90.7 in De-cember 1998. Four of the fiveindex components sent positivesignals on a year-over-year basiswith a lower short-duration (lessthan 15 weeks) unemploymentrate, lower initial claims forunemployment insurance, alonger average work week ofmanufacturing production work-ers, and higher total housingpermits. The other componentsent a negative signal on a year-over-year basis with lower Hart-ford help-wanted advertising. n
20
40
60
80
100
120
70 72 74 76 78 80 82 84 86 88 90 92 94 96 98
75
80
85
90
95
100
105
70 72 74 76 78 80 82 84 86 88 90 92 94 96 98
Peak
12/69
Trough
10/71
Peak05/74
Trough
09/75
Peak03/80
Trough01/83
Peak
02/89
Trough
06/92

THE CONNECTICUT ECONOMIC DIGEST●●●●●66666 March 1999
EMPLOEMPLOEMPLOEMPLOEMPLOYMENT BY MAJOR INDUSTRYMENT BY MAJOR INDUSTRYMENT BY MAJOR INDUSTRYMENT BY MAJOR INDUSTRYMENT BY MAJOR INDUSTRY DIVISIONY DIVISIONY DIVISIONY DIVISIONY DIVISION
INCOME (QuarINCOME (QuarINCOME (QuarINCOME (QuarINCOME (Quarterterterterterly)ly)ly)ly)ly)
The unemployment rate
dropped as the labor force
rose from a year ago.
However, the number of
initial claims increased
over the year.
UNEMPLOUNEMPLOUNEMPLOUNEMPLOUNEMPLOYMENTYMENTYMENTYMENTYMENT
Both production worker
weekly earnings and
output declined from a
year ago.
MANUFMANUFMANUFMANUFMANUFAAAAACTURING ACTURING ACTURING ACTURING ACTURING ACTIVITYCTIVITYCTIVITYCTIVITYCTIVITY
ECONOMIC INDICATORS OF EMPLOYMENT
Total employment in-
creased by 29,100 over
the year, or 1.8 percent.
The finance, insurance, &
real estate sector experi-
enced the biggest percent
job growth from last year.
Personal income for
second quarter 1999 is
forecasted to increase 4.5
percent from a year
earlier.
Source: Connecticut Department of Labor
Sources: Connecticut Department of Labor; The Conference Board
Source: Connecticut Department of Labor*Seasonally adjusted
Source: Bureau of Economic Analysis: January 1999 release*Forecasted by Connecticut Department of LaborNA= Not Available
Note: This year, the annual revisions to the National Income and Product Accounts (NIPA) in July included theredefinition of the Dividends, Interest, and Rent (DIR) component of Personal Income (PI). The DIR componenthas been redefined to exclude capital gains distributions from mutual funds. With the October 1998 release,Connecticut's Quarterly PI (QPI) Series reflected this change. Consequently, Connecticut's QPI has beensignificantly revised for some periods. The Connecticut Labor Department has prepared a summary paperexplaining the changes and their impact on the Connecticut QPI Series. For a copy, please contact the Office ofResearch, at (860) 263-6268.
JAN JAN CHANGE DEC(Seasonally adjusted; 000s) 1999 1998 NO. % 1998TOTAL NONFARM 1,660.5 1,631.4 29.1 1.8 1,660.3 Private Sector 1,430.9 1,406.1 24.8 1.8 1,430.6 Construction and Mining 61.7 59.6 2.1 3.5 61.3 Manufacturing 276.8 279.1 -2.3 -0.8 275.6 Transportation, Public Utilities 76.2 75.6 0.6 0.8 76.2 Wholesale, Retail Trade 357.4 353.0 4.4 1.2 358.9 Finance, Insurance & Real Estate 138.8 133.8 5.0 3.7 138.5 Services 520.0 505.0 15.0 3.0 520.1 Government 229.6 225.3 4.3 1.9 229.7
JAN JAN CHANGE DEC(Not seasonally adjusted) 1999 1998 NO. % 1998Average Weekly Hours 41.8 42.7 -0.9 -2.1 43.2Average Hourly Earnings $14.99 $14.68 $0.31 2.1 $15.01Average Weekly Earnings $626.58 $626.84 -0.25 0.0 $648.43Mfg. Output Index (1982=100)* 121.9 124.8 -2.9 -2.3 123.7 Production Worker Hours (000s) 6,668 6,920 -252 -3.6 6,955 Productivity Index (1982=100)* 191.3 188.8 2.5 1.3 192.4
JAN JAN CHANGE DEC(Seasonally adjusted) 1999 1998 NO. % 1998Unemployment Rate, resident (%) 3.0 3.8 -0.8 --- 3.2Labor Force, resident (000s) 1,729.2 1,706.3 22.9 1.3 1,722.0 Employed (000s) 1,677.4 1,641.0 36.4 2.2 1,666.9 Unemployed (000s) 51.8 65.3 -13.5 -20.7 55.1Average Weekly Initial Claims 4,252 3,450 802 23.2 3,394Help Wanted Index -- Htfd. (1987=100 33 35 -2 -5.7 35Avg. Insured Unemp. Rate (%) 2.15 2.28 -0.13 --- 2.04
(Seasonally adjusted) 2Q* 2Q CHANGE 1Q*
(Annualized; $ Millions) 1999 1998 NO. % 1999
Personal Income $127,531 $122,060 $5,471 4.5 $126,605
UI Covered Wages $70,226 $65,298 $4,928 7.5 $69,531

THE CONNECTICUT ECONOMIC DIGEST ●●●●●77777March 1999
TTTTTOURISM AND OURISM AND OURISM AND OURISM AND OURISM AND TRATRATRATRATRAVELVELVELVELVEL
ECONOMIC INDICATORS
BBBBBUSINESS AUSINESS AUSINESS AUSINESS AUSINESS ACTIVITYCTIVITYCTIVITYCTIVITYCTIVITY Air cargo tons were up 4.8
percent through the twelve
months ending December
1998. Retail sales increased
by 6.1 percent through
November.
Air passenger traffic was up
4.0 percent last year. Welcome
center visitors increased 11.5
percent in January of this year.
BBBBBUSINESS STUSINESS STUSINESS STUSINESS STUSINESS STARARARARARTS AND TS AND TS AND TS AND TS AND TERMINATERMINATERMINATERMINATERMINATIONSTIONSTIONSTIONSTIONS Net business formations as
measured by starts minus
stops registered with the
Secretary of the State were
1,469 for January.
Overall tax collections were up
3.4 percent through the fiscal
year to January. The largest
gains were the real estate
conveyance tax, up 13.0
percent, and personal income
tax, up 7.4 percent.
STSTSTSTSTAAAAATE TE TE TE TE TTTTTAX COLLECTIONSAX COLLECTIONSAX COLLECTIONSAX COLLECTIONSAX COLLECTIONS
Sources: Department of Economic and Community Development; U.S. Department of Energy, Energy InformationAdministration; Connecticut Department of Revenue Services; F.W. Dodge; Connecticut Department ofMotor Vehicles; Connecticut Department of Transportation, Bureau of Aviation and Ports
Sources: Connecticut Secretary of the State -- corporations and other legal entitiesConnecticut Department of Labor -- unemployment insurance program registrations
Source: Connecticut Department of Revenue Services*Includes all sources of tax revenue; Only selected taxes are displayed.
Sources: Connecticut Department of Transportation, Bureau of Aviation and Ports; ConnecticutDepartment of Economic and Community Development; Connecticut Lodging &Attractions Association
*Hotel-Motel Occupancy rate changes are in percentage points.
JAN % CHANGE %1999 M/M Y/Y CURRENT PRIOR CHG
STARTS Secretar y of the Stat e 1,824 -8.1 -1.1 1,824 1,845 -1.1 Department of Labor 736 18.1 -4.3 736 769 -4.3TERMINATIONS Secretar y of the Stat e 355 -60.5 1.7 355 349 1.7 Department of Labor 1,461 177.2 10.8 1,461 1,318 10.8
YEAR TO DATE
JAN JAN % % (Millions of dollars) 1999 1998 CHG 1998-99 1997-98 CHGTOTAL ALL TAXES* 935.8 940.1 -0.5 4,309.4 4,168.7 3.4 Corporate Tax 20.8 22.4 -7.1 236.0 240.2 -1.7 Personal Income Tax 472.5 446.1 5.9 1,821.1 1,695.2 7.4 Real Estate Conv. Ta x 7.7 7.0 0.7 62.6 55.4 13.0 Sales & Use Tax 332.6 309.0 7.6 1,499.1 1,412.3 6.1
FISCAL YEAR TOTAL S
Y/Y % YEAR TO DATE % MONTH LEVEL CHG CURRENT PRIOR CHG
New Housing Permits JAN 1999 749 1.6 749 737 1.6Electricity Sales (mil kWh) NOV 1998 2,253 -3.4 26,236 25,829 1.6Retail Sales (Bil. $ ) NOV 1998 2.91 7.8 32.89 31.00 6.1Construction Contracts Index (1980=100) DEC 1998 190.5 9.7 --- --- ---New Auto Registrations JAN 1999 24,372 17.4 24,372 20,753 17.4Air Cargo Tons DEC 1998 13,782 -3.1 141,825 135,294 4.8
Y/Y % YEAR TO DATE % MONTH LEVEL CHG CURRENT PRIOR CHG
Tourism Inquiries JAN 1999 5,153 -1.5 5,153 5,234 -1.5Info Center Visitors JAN 1999 20,752 11.5 20,752 18,615 11.5Major Attraction Visitors JAN 1999 48,483 -7.1 48,483 52,185 -7.1Hotel-Motel Occupancy* DEC 1998 58.8 0.0 73.7 74.0 -0.3Air Passenger Count DEC 1998 487,092 10.5 5,636,541 5,421,873 4.0

THE CONNECTICUT ECONOMIC DIGEST●●●●●88888 March 1999
CONSUMER NEWSCONSUMER NEWSCONSUMER NEWSCONSUMER NEWSCONSUMER NEWS
EMPLOEMPLOEMPLOEMPLOEMPLOYMENT COST INDEX (QuarYMENT COST INDEX (QuarYMENT COST INDEX (QuarYMENT COST INDEX (QuarYMENT COST INDEX (Quarterterterterterly)ly)ly)ly)ly)Compensation costs for
the nation rose 3.5 percent
over the year, while the
Northeast’s increased by
3.3 percent.
Interest rates were uni-
formly lower than their
year-ago levels including a
prime rate of 7.75 and a
6.79 percent 30-year
conventional mortgage
rate.
INTEREST RAINTEREST RAINTEREST RAINTEREST RAINTEREST RATESTESTESTESTES
ECONOMIC INDICATORS
The U.S. inflation rate for
January was 1.7 percent,
with a matching increase
in the Boston index.
Consumer confidence for
New England increased
17.1 percent from its year-
ago level.
Source: U.S. Department of Labor, Bureau of Labor Statistics
*The Boston CPI can be used as a proxy for New England and is measured every other month.Sources: U.S. Department of Labor, Bureau of Labor Statistics; The Conference Board
Sources: Federal Reserve; Federal Home Loan Mortgage Corp.
JAN DEC JAN % CHG(Not seasonally adjusted) 1999 1998 1998 M/M Y/YCONSUMER PRICE INDEX (1982-1984=100)
All Urban Consumers U.S. City Average 164.3 163.9 161.6 0.2 1.7 Purchasing Power of Consumer Dollar: (1982-84=$1.00) $0.609 $0.610 $0.619 -0.2 -1.6
Northeast Region 171.4 170.0 171.2 0.8 0.1 NY-Northern NJ-Long Island 175.0 173.6 174.7 0.8 0.2 Boston-Brockton-Nashua* 174.1 --- 171.2 1.7Urban Wage Earners and Clerical Workers U.S. City Average 161.0 159.7 160.7 0.8 0.2
CONSUMER CONFIDENCE (1985=100) U.S. 127.6 126.7 128.3 0.7 -0.5 New England 132.3 121.0 113.0 9.3 17.1
JAN DEC JAN(Percent) 1999 1998 1998Prime 7.75 7.75 8.50Federal Funds 4.63 4.68 5.56
3 Month Treasury Bill 4.34 4.42 5.096 Month Treasury Bill 4.36 4.43 5.071 Year Treasury Bill 4.51 4.52 5.243 Year Treasury Note 4.61 4.48 5.385 Year Treasury Note 4.60 4.45 5.42
7 Year Treasury Note 4.80 4.65 5.5310 Year Treasury Note 4.72 4.65 5.5430 Year Teasury Bond 5.16 5.06 5.81Conventional Mortgage 6.79 6.72 6.99
Seasonally Adjusted Not Seasonally Adjuste dPrivate Industry Workers DEC SEP 3-Mo DEC DEC 12-Mo(June 1989=100) 1998 1998 % Chg 1998 1997 % ChgUNITED STATES TOTAL 139.7 138.7 0.7 139.8 135.1 3.5 Wages and Salaries 137.6 136.6 0.7 137.4 132.3 3.9 Benefit Costs 145.1 144.2 0.6 145.2 141.8 2.4
NORTHEAST TOTAL --- --- --- 139.5 135.0 3.3 Wages and Salaries --- --- --- 136.4 131.6 3.6

THE CONNECTICUT ECONOMIC DIGEST ●●●●●99999March 1999
UNEMPLOUNEMPLOUNEMPLOUNEMPLOUNEMPLOYMENT RAYMENT RAYMENT RAYMENT RAYMENT RATESTESTESTESTES
LABOR FORCELABOR FORCELABOR FORCELABOR FORCELABOR FORCE
NONFNONFNONFNONFNONFARM EMPLOARM EMPLOARM EMPLOARM EMPLOARM EMPLOYMENTYMENTYMENTYMENTYMENT
All states in the region
posted lower unemploy-
ment rates than last
year.
Maine led the region
with the strongest job
growth over the year.
Connecticut’s labor force
grew 1.3 percent from
the past year, while the
nation’s rose by 1.5
percent.
COMPARATIVE REGIONAL DATA
Source: U.S. Department of Labor, Bureau of Labor Statistics
Source: U.S. Department of Labor, Bureau of Labor Statistics
Source: U.S. Department of Labor, Bureau of Labor Statistics
JAN JAN CHANGE DEC(Seasonally adjusted; 000s) 1999 1998 NO. % 1998Connecticut 1,660.5 1,631.4 29.1 1.8 1,660.3Maine 578.5 560.2 18.3 3.3 577.1Massachusetts 3,193.0 3,146.2 46.8 1.5 3,198.5New Hampshire 594.2 582.5 11.7 2.0 591.5New Jersey 3,830.1 3,776.5 53.6 1.4 3,833.2New York 8,303.5 8,164.6 138.9 1.7 8,311.4Pennsylvania 5,523.2 5,466.1 57.1 1.0 5,526.4Rhode Island 457.9 453.4 4.5 1.0 461.2Vermont 289.3 282.4 6.9 2.4 288.6United States 127,347.0 124,640.0 2,707.0 2.2 127,102.0
JAN JAN CHANGE DEC(Seasonally adjusted; 000s) 1999 1998 NO. % 1998Connecticut 1,729.2 1,706.3 22.9 1.3 1,722.0Maine 660.4 648.0 12.4 1.9 664.7Massachusetts 3,263.1 3,278.4 -15.3 -0.5 3,259.5New Hampshire 669.6 649.0 20.6 3.2 666.5New Jersey 4,213.6 4,163.9 49.7 1.2 4,193.7New York 8,856.9 8,880.1 -23.2 -0.3 8,874.4Pennsylvania 5,947.0 5,959.1 -12.1 -0.2 5,930.2Rhode Island 498.6 499.5 -0.9 -0.2 500.7Vermont 335.7 327.5 8.2 2.5 335.8United States 139,347.0 137,288.0 2,059.0 1.5 138,547.0
JAN JAN DEC(Seasonally adjusted) 1999 1998 CHANGE 1998Connecticut 3.0 3.8 -0.8 3.2Maine 3.4 5.2 -1.8 3.8Massachusetts 3.1 3.6 -0.5 3.1New Hampshire 2.7 3.1 -0.4 2.8New Jersey 4.4 4.7 -0.3 4.4New York 5.2 6.0 -0.8 5.4Pennsylvania 4.3 4.9 -0.6 4.4Rhode Island 4.4 5.3 -0.9 4.1Vermont 3.1 3.7 -0.6 3.0United States 4.3 4.6 -0.3 4.3
THE CONNECTICUT ECONOMIC DIGEST●●●●●1010101010 March 1999
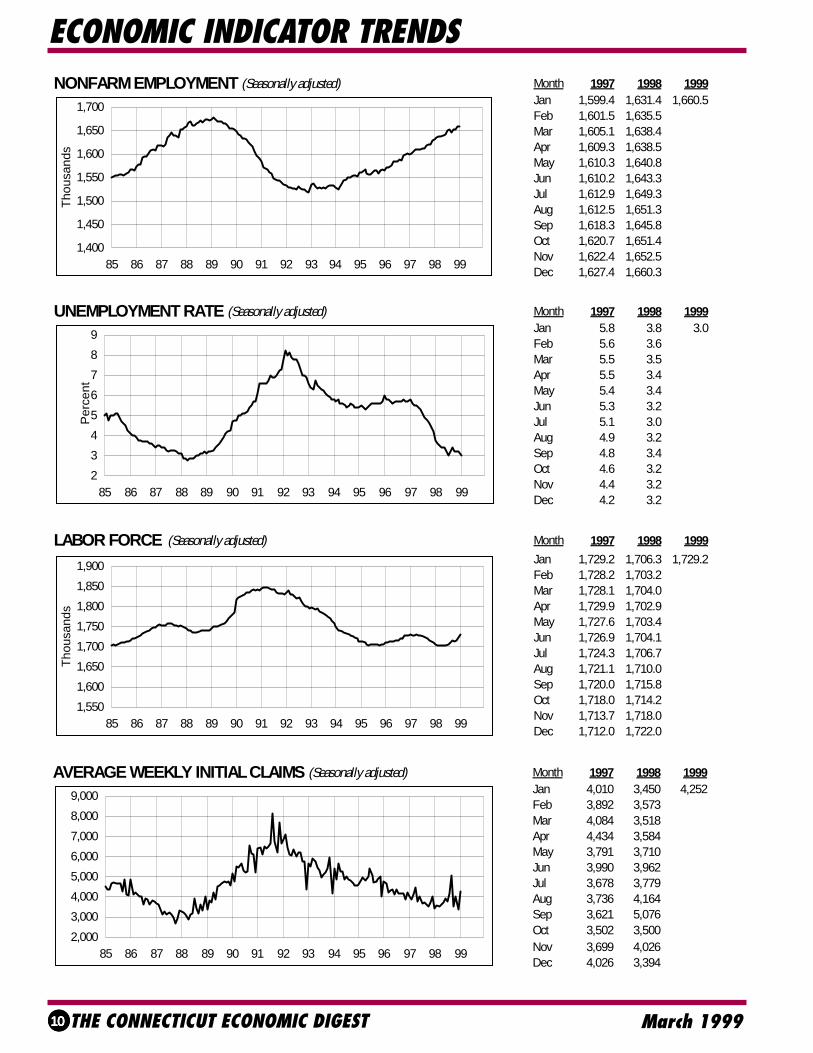
ECONOMIC INDICATOR TRENDSNONFARM EMPLOYMENT (Seasonally adjusted) Month 1997 1998 1999
Jan 1,599.4 1,631.4 1,660.5Feb 1,601.5 1,635.5Mar 1,605.1 1,638.4Apr 1,609.3 1,638.5May 1,610.3 1,640.8Jun 1,610.2 1,643.3Jul 1,612.9 1,649.3Aug 1,612.5 1,651.3Sep 1,618.3 1,645.8Oct 1,620.7 1,651.4Nov 1,622.4 1,652.5Dec 1,627.4 1,660.3
UNEMPLOYMENT RATE (Seasonally adjusted) Month 1997 1998 1999Jan 5.8 3.8 3.0Feb 5.6 3.6Mar 5.5 3.5Apr 5.5 3.4May 5.4 3.4Jun 5.3 3.2Jul 5.1 3.0Aug 4.9 3.2Sep 4.8 3.4Oct 4.6 3.2Nov 4.4 3.2Dec 4.2 3.2
LABOR FORCE (Seasonally adjusted) Month 1997 1998 1999
Jan 1,729.2 1,706.3 1,729.2Feb 1,728.2 1,703.2Mar 1,728.1 1,704.0Apr 1,729.9 1,702.9May 1,727.6 1,703.4Jun 1,726.9 1,704.1Jul 1,724.3 1,706.7Aug 1,721.1 1,710.0Sep 1,720.0 1,715.8Oct 1,718.0 1,714.2Nov 1,713.7 1,718.0Dec 1,712.0 1,722.0
2
3
4
5
6
7
8
9
85 86 87 88 89 90 91 92 93 94 95 96 97 98 99
Per
cent
1,400
1,450
1,500
1,550
1,600
1,650
1,700
85 86 87 88 89 90 91 92 93 94 95 96 97 98 99
Tho
usan
ds
1,550
1,600
1,650
1,700
1,750
1,800
1,850
1,900
85 86 87 88 89 90 91 92 93 94 95 96 97 98 99
Tho
usan
ds
AVERAGE WEEKLY INITIAL CLAIMS (Seasonally adjusted) Month 1997 1998 1999Jan 4,010 3,450 4,252Feb 3,892 3,573Mar 4,084 3,518Apr 4,434 3,584May 3,791 3,710Jun 3,990 3,962Jul 3,678 3,779Aug 3,736 4,164Sep 3,621 5,076Oct 3,502 3,500Nov 3,699 4,026Dec 4,026 3,394
2,000
3,000
4,000
5,000
6,000
7,000
8,000
9,000
85 86 87 88 89 90 91 92 93 94 95 96 97 98 99

THE CONNECTICUT ECONOMIC DIGEST ●●●●●1111111111March 1999
ECONOMIC INDICATOR TRENDSREAL AVG MANUFACTURING HOURLY EARNINGS (Not seasonally adjusted) Month 1997 1998 1999
Jan $9.09 $9.27 $9.31Feb 9.06 9.26Mar 9.08 9.29Apr 9.09 9.26May 9.13 9.25Jun 9.14 9.27Jul 9.26 9.32Aug 9.20 9.24Sep 9.24 9.35Oct 9.22 9.27Nov 9.26 9.30Dec 9.32 9.34
AVG MANUFACTURING WEEKLY HOURS (Not seasonally adjusted) Month 1997 1998 1999Jan 42.7 42.7 41.8Feb 42.1 42.9Mar 42.4 42.7Apr 42.5 42.5May 42.4 42.9Jun 42.5 42.9Jul 41.9 42.2Aug 42.0 42.1Sep 43.0 41.9Oct 42.8 42.8Nov 43.1 43.2Dec 43.4 43.2
HARTFORD HELP WANTED INDEX (Seasonally adjusted) Month 1997 1998 1999Jan 35 35 33Feb 36 38Mar 34 37Apr 36 37May 36 40Jun 38 39Jul 35 36Aug 34 35Sep 36 32Oct 35 33Nov 37 34Dec 36 35
38
39
40
41
42
43
44
45
85 86 87 88 89 90 91 92 93 94 95 96 97 98 99
8.4
8.6
8.8
9.0
9.2
9.4
9.6
85 86 87 88 89 90 91 92 93 94 95 96 97 98 99
1982
-84
Dol
lars
0
20
40
60
80
100
120
85 86 87 88 89 90 91 92 93 94 95 96 97 98 99
1987
=10
0
DOL NEWLY REGISTERED EMPLOYERS (12-month moving average) Month 1997 1998 1999Jan 833 868 831Feb 840 870Mar 856 846Apr 849 878May 856 861Jun 848 836Jul 856 849Aug 862 841Sep 854 838Oct 859 845Nov 859 836Dec 852 832
500
600
700
800
900
1,000
1,100
85 86 87 88 89 90 91 92 93 94 95 96 97 98 99

THE CONNECTICUT ECONOMIC DIGEST●●●●●1212121212 March 1999
ECONOMIC INDICATOR TRENDS
GOVERNMENT EMPLOYMENT* (Seasonally adjusted) Month 1997 1998 1999Jan 226.0 225.3 229.6Feb 226.2 225.3Mar 225.5 226.2Apr 225.2 226.2May 225.4 226.4Jun 225.0 226.8Jul 226.4 227.8Aug 226.9 228.4Sep 226.7 230.5Oct 225.6 229.1Nov 225.0 228.6Dec 225.2 229.7
*Includes Indian tribal government employment
170
180
190
200
210
220
230
240
85 86 87 88 89 90 91 92 93 94 95 96 97 98 99
Tho
usan
ds
DEPOSITORY BANKING (SIC 60) EMPLOYMENT (Not seasonally adjusted) Month 1997 1998 1999Jan 26.2 25.1 25.6Feb 25.8 24.8Mar 25.7 25.1Apr 25.6 24.8May 25.5 24.5Jun 25.6 25.0Jul 25.4 25.4Aug 25.3 25.4Sep 25.0 25.0Oct 24.7 24.9Nov 24.6 25.1Dec 24.9 25.3
INSURANCE CARRIERS (SIC 63) EMPLOYMENT (Not seasonally adjusted) Month 1997 1998 1999Jan 57.1 57.4 59.0Feb 57.9 57.6Mar 58.4 57.9Apr 59.1 57.6May 59.7 57.8Jun 58.8 58.6Jul 58.0 59.7Aug 58.4 60.0Sep 58.5 59.6Oct 58.2 59.4Nov 58.2 59.4Dec 58.8 59.6
OTHER FIN., INS., REAL EST. EMPLOYMENT (Not seasonally adjusted) Month 1997 1998 1999Jan 46.7 50.1 53.2Feb 47.2 50.6Mar 47.7 51.4Apr 47.9 51.2May 48.4 51.8Jun 48.8 52.8Jul 48.7 53.3Aug 48.7 53.5Sep 48.3 53.0Oct 48.7 53.0Nov 49.2 53.0Dec 49.9 53.8
404244464850525456
85 86 87 88 89 90 91 92 93 94 95 96 97 98 99
Tho
usan
ds
20
25
30
35
40
45
85 86 87 88 89 90 91 92 93 94 95 96 97 98 99
Tho
usan
ds
52
56
60
64
68
72
76
85 86 87 88 89 90 91 92 93 94 95 96 97 98 99
Tho
usan
ds

THE CONNECTICUT ECONOMIC DIGEST ●●●●●1313131313March 1999
ECONOMIC INDICATOR TRENDSNEW AUTO REGISTRATIONS PROCESSED (Not seasonally adjusted) Month 1997 1998 1999
Jan 12,436 20,753 24,372
Feb 14,401 12,604
Mar 23,952 16,313
Apr 18,038 23,500
May 16,364 17,300
Jun 16,464 19,813
Jul 10,386 12,812
Aug 11,210 14,992
Sep 11,485 24,688
Oct 14,563 14,106
Nov 13,884 15,806
Dec 15,416 19,373
NEW HOUSING PERMITS (Not seasonally adjusted) Month 1997 1998 1999
Jan 427 737 749
Feb 520 647
Mar 911 747
Apr 1,036 928
May 836 1,051
Jun 886 1,203
Jul 871 1,297
Aug 792 976
Sep 740 984
Oct 852 1,025
Nov 561 817
Dec 622 1,129
CONSTRUCTION CONTRACTS INDEX (12-month moving average) Month 1997 1998 1999
Jan 236.8 256.7
Feb 242.8 258.2
Mar 246.1 258.4
Apr 242.9 262.7
May 233.5 255.2
Jun 236.2 252.1
Jul 249.3 242.3
Aug 247.0 238.7
Sep 239.9 246.0
Oct 235.5 241.4
Nov 248.7 223.0
Dec 252.5 216.1
160
180
200
220
240
260
280
85 86 87 88 89 90 91 92 93 94 95 96 97 98 99
1980
=10
0
0
5,000
10,000
15,000
20,000
25,000
30,000
85 86 87 88 89 90 91 92 93 94 95 96 97 98 99
0
500
1,000
1,500
2,000
2,500
3,000
3,500
4,000
85 86 87 88 89 90 91 92 93 94 95 96 97 98 99
ELECTRICITY SALES (12-month moving average) Month 1997 1998 1999
Jan 2,366 2,363
Feb 2,364 2,354
Mar 2,348 2,354
Apr 2,346 2,361
May 2,344 2,362
Jun 2,338 2,373
Jul 2,342 2,376
Aug 2,355 2,381
Sep 2,350 2,399
Oct 2,349 2,407
Nov 2,352
Dec 2,354
1,800
1,900
2,000
2,100
2,200
2,300
2,400
2,500
85 86 87 88 89 90 91 92 93 94 95 96 97 98 99
Mill
ions
of k
ilow
att h
ours

THE CONNECTICUT ECONOMIC DIGEST●●●●●1414141414 March 1999
Not Seasonally Adjusted
JAN JAN CHANGE DEC1999 1998 NO. % 1998
TOTAL NONFARM EMPLOYMENT . . . . . . . 1,631,800 1,602,400 29,400 1.8 1,684,100 GOODS PRODUCING INDUSTRIES . . . . . 331,300 332,200 -900 -0.3 337,300 CONSTRUCTION & MINING . . . . . . . . . 54,800 53,200 1,600 3.0 60,400 MANUFACTURING . . . . . . . . . . . . . . . . 276,500 279,000 -2,500 -0.9 276,900 Durable . . . . . . . . . . . . . . . . . . . . . . . 195,000 196,300 -1,300 -0.7 194,900 Lumber & Furniture . . . . . . . . . . . . . . . . . . . . . 5,200 5,200 0 0.0 5,200 Stone, Clay & Glass . . . . . . . . . . . . . . . . . . . . . 2,800 2,700 100 3.7 2,800 Primary Metals . . . . . . . . . . . . . . . . . . . . . . . . . 9,400 9,300 100 1.1 9,400 Fabricated Metals . . . . . . . . . . . . . . . . . . . . . . . 35,600 35,300 300 0.8 35,400 Machinery & Computer Equipment . . . . . . . . . 34,700 35,400 -700 -2.0 34,700 Electronic & Electrical Equipment . . . . . . . . . 28,700 29,100 -400 -1.4 28,800 Transportation Equipment . . . . . . . . . . . . . . . . 50,200 50,500 -300 -0.6 50,100 Instruments . . . . . . . . . . . . . . . . . . . . . . . . . . . . 22,000 22,200 -200 -0.9 22,100 Miscellaneous Manufacturing . . . . . . . . . . . . . 6,400 6,600 -200 -3.0 6,400 Nondurable . . . . . . . . . . . . . . . . . . . . 81,500 82,700 -1,200 -1.5 82,000 Food . . . . . . . . . . . . . . . . . . . . . . . . . . . . . . . . . 7,900 7,900 0 0.0 7,900 Textiles. . . . . . . . . . . . . . . . . . . . . . . . . . . . . . . 2,000 2,000 0 0.0 2,000 Apparel . . . . . . . . . . . . . . . . . . . . . . . . . . . . . . . 4,000 4,500 -500 -11.1 4,200 Paper . . . . . . . . . . . . . . . . . . . . . . . . . . . . . . . . . 7,700 8,100 -400 -4.9 7,700 Printing & Publishing . . . . . . . . . . . . . . . . . . . . 26,200 26,700 -500 -1.9 26,400 Chemicals . . . . . . . . . . . . . . . . . . . . . . . . . . . . . 21,100 20,600 500 2.4 21,000 Rubber & Plastics . . . . . . . . . . . . . . . . . . . . . . 10,600 10,700 -100 -0.9 10,700 Other Nondurable Manufacturing . . . . . . . . . . . 2,000 2,200 -200 -9.1 2,100 SERVICE PRODUCING INDUSTRIES . . . . 1,300,500 1,270,200 30,300 2.4 1,346,800 TRANS., COMM. & UTILITIES . . . . . . . . 75,600 74,600 1,000 1.3 76,700 Transportation . . . . . . . . . . . . . . . . . . . . . . . . . . . 43,800 43,400 400 0.9 44,900 Motor Freight & Warehousing . . . . . . . . . . . . . 11,800 11,800 0 0.0 12,300 Other Transportation . . . . . . . . . . . . . . . . . . . . 32,000 31,600 400 1.3 32,600 Communications . . . . . . . . . . . . . . . . . . . . . . . . 19,600 18,800 800 4.3 19,600 Utilities . . . . . . . . . . . . . . . . . . . . . . . . . . . . . . . . 12,200 12,400 -200 -1.6 12,200 TRADE . . . . . . . . . . . . . . . . . . . . . . . . 353,300 348,600 4,700 1.3 372,300 Wholesale . . . . . . . . . . . . . . . . . . . . . . . . . . . . . . 82,600 81,400 1,200 1.5 84,100 Retail . . . . . . . . . . . . . . . . . . . . . . . . . . . . . . . . . . 270,700 267,200 3,500 1.3 288,200 General Merchandise . . . . . . . . . . . . . . . . . . . . 27,400 28,000 -600 -2.1 31,400 Food Stores . . . . . . . . . . . . . . . . . . . . . . . . . . . 52,800 51,700 1,100 2.1 53,800 Auto Dealers & Gas Stations . . . . . . . . . . . . . . 27,000 26,400 600 2.3 27,300 Restaurants . . . . . . . . . . . . . . . . . . . . . . . . . . . . 73,100 73,000 100 0.1 77,900 Other Retail Trade . . . . . . . . . . . . . . . . . . . . . . 90,400 88,100 2,300 2.6 97,800 FINANCE, INS. & REAL ESTATE. . . . . . . 137,800 132,600 5,200 3.9 138,700 Finance . . . . . . . . . . . . . . . . . . . . . . . . . . . . . . . . 51,800 48,700 3,100 6.4 51,800 Banking . . . . . . . . . . . . . . . . . . . . . . . . . . . . . . . 25,600 25,100 500 2.0 25,300 Insurance . . . . . . . . . . . . . . . . . . . . . . . . . . . . . . 70,200 68,400 1,800 2.6 70,900 Insurance Carriers . . . . . . . . . . . . . . . . . . . . . . 59,000 57,400 1,600 2.8 59,600 Real Estate . . . . . . . . . . . . . . . . . . . . . . . . . . . . . 15,800 15,500 300 1.9 16,000 SERVICES . . . . . . . . . . . . . . . . . . . . . 508,000 492,800 15,200 3.1 523,800 Hotels & Lodging Places . . . . . . . . . . . . . . . . . 10,900 10,200 700 6.9 11,500 Personal Services . . . . . . . . . . . . . . . . . . . . . . 19,000 18,800 200 1.1 18,800 Business Services . . . . . . . . . . . . . . . . . . . . . . 106,800 102,000 4,800 4.7 110,200 Health Services . . . . . . . . . . . . . . . . . . . . . . . . 157,400 156,100 1,300 0.8 159,400 Legal & Engineering Services . . . . . . . . . . . . . 55,400 52,100 3,300 6.3 55,800 Educational Services . . . . . . . . . . . . . . . . . . . . 41,500 40,300 1,200 3.0 44,500 Other Services . . . . . . . . . . . . . . . . . . . . . . . . . 117,000 113,300 3,700 3.3 123,600
CONNECTICUTCONNECTICUTCONNECTICUTCONNECTICUTCONNECTICUT
NONFARM EMPLOYMENT ESTIMATES
Current month’s data are preliminary. Prior months’ data have been revised. All data are benchmarked to March 1998. *Total excludes workers idled due to labor-management disputes. **Includes Indian tribal government employment.
GOVERNMENT . . . . . . . . . . . . . . . . . . 225,800 221,600 4,200 1.9 235,300 Federal . . . . . . . . . . . . . . . . . . . . . . . . . . . . . . . . 22,000 22,100 -100 -0.5 22,900 **State, Local & Other Government . . . . . . . . . . . 203,800 199,500 4,300 2.2 212,400

THE CONNECTICUT ECONOMIC DIGEST ●●●●●1515151515March 1999
Not Seasonally Adjusted
JAN JAN CHANGE DEC1999 1998 NO. % 1998
TOTAL NONFARM EMPLOYMENT . . . . . . . 86,800 86,100 700 0.8 91,000 GOODS PRODUCING INDUSTRIES . . . . . 23,100 23,100 0 0.0 23,500 CONSTRUCTION & MINING . . . . . . . . . . 3,700 3,400 300 8.8 4,000 MANUFACTURING . . . . . . . . . . . . . . . . . 19,400 19,700 -300 -1.5 19,500 Durable Goods . . . . . . . . . . . . . . . . . . . . . . . . . . . . 10,700 10,500 200 1.9 10,700 Machinery & Electric Equipment . . . . . . . . . . . . 5,600 5,600 0 0.0 5,600 Instruments . . . . . . . . . . . . . . . . . . . . . . . . . . . . . . 2,800 2,600 200 7.7 2,800 Nondurable Goods. . . . . . . . . . . . . . . . . . . . . . . . . 8,700 9,200 -500 -5.4 8,800 Printing & Publishing . . . . . . . . . . . . . . . . . . . . . . 2,500 2,700 -200 -7.4 2,600 Chemicals . . . . . . . . . . . . . . . . . . . . . . . . . . . . . . . 3,400 3,500 -100 -2.9 3,500 SERVICE PRODUCING INDUSTRIES . . . . 63,700 63,000 700 1.1 67,500 TRANS., COMM. & UTILITIES . . . . . . . . . 2,700 2,700 0 0.0 3,000 TRADE . . . . . . . . . . . . . . . . . . . . . . . . . 21,300 21,600 -300 -1.4 23,400 Wholesale . . . . . . . . . . . . . . . . . . . . . . . . . . . . . . . 3,600 3,600 0 0.0 3,600 Retail . . . . . . . . . . . . . . . . . . . . . . . . . . . . . . . . . . 17,700 18,000 -300 -1.7 19,800 FINANCE, INS. & REAL ESTATE. . . . . . . . 4,900 4,500 400 8.9 4,900 SERVICES . . . . . . . . . . . . . . . . . . . . . . 24,600 24,400 200 0.8 25,300 GOVERNMENT . . . . . . . . . . . . . . . . . . . 10,200 9,800 400 4.1 10,900 Federal . . . . . . . . . . . . . . . . . . . . . . . . . . . . . . . . . . 800 800 0 0.0 900 State & Local . . . . . . . . . . . . . . . . . . . . . . . . . . . . . 9,400 9,000 400 4.4 10,000
Not Seasonally Adjusted
JAN JAN CHANGE DEC1999 1998 NO. % 1998
TOTAL NONFARM EMPLOYMENT . . . . . . . 184,600 184,400 200 0.1 191,800 GOODS PRODUCING INDUSTRIES . . . . . 44,500 45,400 -900 -2.0 45,600 CONSTRUCTION & MINING . . . . . . . . . . 5,800 5,700 100 1.8 6,800 MANUFACTURING . . . . . . . . . . . . . . . . . 38,700 39,700 -1,000 -2.5 38,800 Durable Goods . . . . . . . . . . . . . . . . . . . . . . . . . . . . 31,400 32,400 -1,000 -3.1 31,500 Fabricated Metals . . . . . . . . . . . . . . . . . . . . . . . . . 4,500 4,600 -100 -2.2 4,500 Industrial Machinery . . . . . . . . . . . . . . . . . . . . . . . 6,300 6,400 -100 -1.6 6,300 Electronic Equipment . . . . . . . . . . . . . . . . . . . . . . 6,100 6,200 -100 -1.6 6,100 Transportation Equipment . . . . . . . . . . . . . . . . . . 8,300 8,800 -500 -5.7 8,300 Nondurable Goods. . . . . . . . . . . . . . . . . . . . . . . . . 7,300 7,300 0 0.0 7,300 Printing & Publishing . . . . . . . . . . . . . . . . . . . . . . 2,000 2,000 0 0.0 2,100 SERVICE PRODUCING INDUSTRIES . . . . 140,100 139,000 1,100 0.8 146,200 TRANS., COMM. & UTILITIES . . . . . . . . . 7,000 7,000 0 0.0 7,100 TRADE . . . . . . . . . . . . . . . . . . . . . . . . . 41,800 42,000 -200 -0.5 43,900 Wholesale . . . . . . . . . . . . . . . . . . . . . . . . . . . . . . . 10,300 10,300 0 0.0 10,400 Retail . . . . . . . . . . . . . . . . . . . . . . . . . . . . . . . . . . 31,500 31,700 -200 -0.6 33,500 FINANCE, INS. & REAL ESTATE. . . . . . . . 10,600 10,300 300 2.9 10,700 SERVICES . . . . . . . . . . . . . . . . . . . . . . 59,700 58,400 1,300 2.2 63,300 Business Services . . . . . . . . . . . . . . . . . . . . . . . . 14,500 14,200 300 2.1 15,700 Health Services . . . . . . . . . . . . . . . . . . . . . . . . . . 19,800 19,600 200 1.0 20,000 GOVERNMENT . . . . . . . . . . . . . . . . . . . 21,000 21,300 -300 -1.4 21,200 Federal . . . . . . . . . . . . . . . . . . . . . . . . . . . . . . . . . . 2,100 2,100 0 0.0 2,100 State & Local . . . . . . . . . . . . . . . . . . . . . . . . . . . . . 18,900 19,200 -300 -1.6 19,100
DDDDDANBANBANBANBANBURURURURURY LMAY LMAY LMAY LMAY LMA
BRIDGEPORBRIDGEPORBRIDGEPORBRIDGEPORBRIDGEPORT LMAT LMAT LMAT LMAT LMA
NONFARM EMPLOYMENT ESTIMATES
Current month’s data are preliminary. Prior months’ data have been revised. All data are benchmarked to March 1998. *Total excludes workers idled due to labor-management disputes.
For further information on the Bridgeport Labor Market Area contact Arthur Famiglietti at (860) 263-6297.
For further information on the Danbury Labor Market Area contact Arthur Famiglietti at (860) 263-6297.

THE CONNECTICUT ECONOMIC DIGEST●●●●●1616161616 March 1999
Not Seasonally Adjusted
JAN JAN CHANGE DEC1999 1998 NO. % 1998
TOTAL NONFARM EMPLOYMENT . . . . . . . 596,100 589,800 6,300 1.1 615,100 GOODS PRODUCING INDUSTRIES . . . . . 113,100 113,700 -600 -0.5 116,000 CONSTRUCTION & MINING . . . . . . . . . . 18,200 18,100 100 0.6 20,300 MANUFACTURING . . . . . . . . . . . . . . . . . 94,900 95,600 -700 -0.7 95,700 Durable Goods . . . . . . . . . . . . . . . . . . . . . . . . . . . . 74,900 75,500 -600 -0.8 75,200 Primary & Fabricated Metals . . . . . . . . . . . . . . . 18,700 18,400 300 1.6 18,700 Industrial Machinery . . . . . . . . . . . . . . . . . . . . . . . 14,100 14,600 -500 -3.4 14,500 Electronic Equipment . . . . . . . . . . . . . . . . . . . . . . 6,300 6,600 -300 -4.5 6,300 Transportation Equipment . . . . . . . . . . . . . . . . . . 27,400 27,300 100 0.4 27,300 Nondurable Goods. . . . . . . . . . . . . . . . . . . . . . . . . 20,000 20,100 -100 -0.5 20,500 Printing & Publishing . . . . . . . . . . . . . . . . . . . . . . 8,700 8,900 -200 -2.2 8,900 SERVICE PRODUCING INDUSTRIES . . . . 483,000 476,100 6,900 1.4 499,100 TRANS., COMM. & UTILITIES . . . . . . . . . 26,800 26,200 600 2.3 27,200 Transportation . . . . . . . . . . . . . . . . . . . . . . . . . . . . 15,500 15,300 200 1.3 15,900 Communications & Utilities . . . . . . . . . . . . . . . . . 11,300 10,900 400 3.7 11,300 TRADE . . . . . . . . . . . . . . . . . . . . . . . . . 122,800 122,500 300 0.2 128,000 Wholesale . . . . . . . . . . . . . . . . . . . . . . . . . . . . . . . 29,500 29,200 300 1.0 29,800 Retail . . . . . . . . . . . . . . . . . . . . . . . . . . . . . . . . . . 93,300 93,300 0 0.0 98,200 FINANCE, INS. & REAL ESTATE. . . . . . . . 70,200 69,500 700 1.0 71,300 Deposit & Nondeposit Institutions . . . . . . . . . . . . 11,800 11,800 0 0.0 11,700 Insurance Carriers . . . . . . . . . . . . . . . . . . . . . . . . 45,500 44,700 800 1.8 46,700 SERVICES . . . . . . . . . . . . . . . . . . . . . . 171,000 168,900 2,100 1.2 176,200 Business Services . . . . . . . . . . . . . . . . . . . . . . . . 33,200 32,600 600 1.8 33,800 Health Services . . . . . . . . . . . . . . . . . . . . . . . . . . . 57,900 58,800 -900 -1.5 58,900 GOVERNMENT . . . . . . . . . . . . . . . . . . . 92,200 89,000 3,200 3.6 96,400 Federal . . . . . . . . . . . . . . . . . . . . . . . . . . . . . . . . . . 7,800 8,000 -200 -2.5 8,000 State & Local . . . . . . . . . . . . . . . . . . . . . . . . . . . . . 84,400 81,000 3,400 4.2 88,400
Not Seasonally Adjusted
JAN JAN CHANGE DEC1999 1998 NO. % 1998
TOTAL NONFARM EMPLOYMENT . . . . . . . 20,000 19,900 100 0.5 20,300 GOODS PRODUCING INDUSTRIES . . . . . 6,400 6,500 -100 -1.5 6,600 CONSTRUCTION & MINING . . . . . . . . . . 700 800 -100 -12.5 900 MANUFACTURING . . . . . . . . . . . . . . . . . 5,700 5,700 0 0.0 5,700 Durable Goods . . . . . . . . . . . . . . . . . . . . . . . . . . . . 2,300 2,400 -100 -4.2 2,300 Nondurable Goods. . . . . . . . . . . . . . . . . . . . . . . . . 3,400 3,300 100 3.0 3,400 SERVICE PRODUCING INDUSTRIES . . . . 13,600 13,400 200 1.5 13,700 TRANS., COMM. & UTILITIES . . . . . . . . . 500 500 0 0.0 500 TRADE . . . . . . . . . . . . . . . . . . . . . . . . . 4,900 4,700 200 4.3 4,900 Wholesale . . . . . . . . . . . . . . . . . . . . . . . . . . . . . . . 900 800 100 12.5 900 Retail . . . . . . . . . . . . . . . . . . . . . . . . . . . . . . . . . . 4,000 3,900 100 2.6 4,000 FINANCE, INS. & REAL ESTATE. . . . . . . . 600 600 0 0.0 600 SERVICES . . . . . . . . . . . . . . . . . . . . . . 4,600 4,400 200 4.5 4,700 GOVERNMENT . . . . . . . . . . . . . . . . . . . 3,000 3,200 -200 -6.3 3,000 Federal . . . . . . . . . . . . . . . . . . . . . . . . . . . . . . . . . . 100 100 0 0.0 100 State & Local . . . . . . . . . . . . . . . . . . . . . . . . . . . . . 2,900 3,100 -200 -6.5 2,900
HARHARHARHARHARTFORD LMATFORD LMATFORD LMATFORD LMATFORD LMA
DDDDDANIELSON LMAANIELSON LMAANIELSON LMAANIELSON LMAANIELSON LMA
NONFARM EMPLOYMENT ESTIMATES
Current month’s data are preliminary. Prior months’ data have been revised. All data are benchmarked to March 1998. *Total excludes workers idled due to labor-management disputes.
For further information on the Danielson Labor Market Area contact Noreen Passardi at (860) 263-6299.
For further information on the Hartford Labor Market Area contact Arthur Famiglietti at (860) 263-6297.

THE CONNECTICUT ECONOMIC DIGEST ●●●●●1717171717March 1999
Not Seasonally Adjusted
JAN JAN CHANGE DEC1999 1998 NO. % 1998
TOTAL NONFARM EMPLOYMENT . . . . . . . 253,700 248,600 5,100 2.1 259,900 GOODS PRODUCING INDUSTRIES . . . . . 49,300 48,200 1,100 2.3 50,200 CONSTRUCTION & MINING . . . . . . . . . . 9,000 8,600 400 4.7 9,900 MANUFACTURING . . . . . . . . . . . . . . . . . 40,300 39,600 700 1.8 40,300 Durable Goods . . . . . . . . . . . . . . . . . . . . . . . . . . . . 25,800 25,100 700 2.8 25,800 Primary & Fabricated Metals . . . . . . . . . . . . . . . 6,800 6,700 100 1.5 6,700 Electronic Equipment . . . . . . . . . . . . . . . . . . . . . . 5,300 5,100 200 3.9 5,300 Nondurable Goods. . . . . . . . . . . . . . . . . . . . . . . . . 14,500 14,500 0 0.0 14,500 Paper, Printing & Publishing . . . . . . . . . . . . . . . . 5,300 5,300 0 0.0 5,200 Chemicals & Allied . . . . . . . . . . . . . . . . . . . . . . . 5,400 5,400 0 0.0 5,400 SERVICE PRODUCING INDUSTRIES . . . . 204,400 200,400 4,000 2.0 209,700 TRANS., COMM. & UTILITIES . . . . . . . . . 16,700 16,200 500 3.1 17,000 Communications & Utilities . . . . . . . . . . . . . . . . . 8,900 8,600 300 3.5 9,000 TRADE . . . . . . . . . . . . . . . . . . . . . . . . . 52,800 51,900 900 1.7 55,100 Wholesale . . . . . . . . . . . . . . . . . . . . . . . . . . . . . . . 13,600 13,100 500 3.8 14,000 Retail . . . . . . . . . . . . . . . . . . . . . . . . . . . . . . . . . . 39,200 38,800 400 1.0 41,100 Eating & Drinking Places . . . . . . . . . . . . . . . . . . . 10,600 10,600 0 0.0 11,400 FINANCE, INS. & REAL ESTATE. . . . . . . . 13,800 13,400 400 3.0 13,700 Finance . . . . . . . . . . . . . . . . . . . . . . . . . . . . . . . . . 4,200 4,200 0 0.0 4,100 Insurance . . . . . . . . . . . . . . . . . . . . . . . . . . . . . . . 7,500 7,200 300 4.2 7,500 SERVICES . . . . . . . . . . . . . . . . . . . . . . 90,400 88,100 2,300 2.6 92,300 Business Services . . . . . . . . . . . . . . . . . . . . . . . . 12,600 12,700 -100 -0.8 13,100 Health Services . . . . . . . . . . . . . . . . . . . . . . . . . . 28,700 28,700 0 0.0 28,700 GOVERNMENT . . . . . . . . . . . . . . . . . . . 30,700 30,800 -100 -0.3 31,600 Federal . . . . . . . . . . . . . . . . . . . . . . . . . . . . . . . . . . 5,200 5,500 -300 -5.5 5,600 State & Local . . . . . . . . . . . . . . . . . . . . . . . . . . . . . 25,500 25,300 200 0.8 26,000
Not Seasonally Adjusted
JAN JAN CHANGE DEC1999 1998 NO. % 1998
TOTAL NONFARM EMPLOYMENT . . . . . . . 9,600 9,100 500 5.5 9,700 GOODS PRODUCING INDUSTRIES . . . . . 3,300 3,300 0 0.0 3,300 CONSTRUCTION & MINING . . . . . . . . . . 400 300 100 33.3 400 MANUFACTURING . . . . . . . . . . . . . . . . . 2,900 3,000 -100 -3.3 2,900 Durable Goods . . . . . . . . . . . . . . . . . . . . . . . . . . . . 2,300 2,400 -100 -4.2 2,300 Electronic Equipment . . . . . . . . . . . . . . . . . . . . . . 700 800 -100 -12.5 700 Other Durable Goods . . . . . . . . . . . . . . . . . . . . . . 1,600 1,600 0 0.0 1,600 Nondurable Goods. . . . . . . . . . . . . . . . . . . . . . . . . 600 600 0 0.0 600 Rubber & Plastics . . . . . . . . . . . . . . . . . . . . . . . . 300 300 0 0.0 300 Other Nondurable Goods . . . . . . . . . . . . . . . . . . . 300 300 0 0.0 300 SERVICE PRODUCING INDUSTRIES . . . . 6,300 5,800 500 8.6 6,400 TRANS., COMM. & UTILITIES . . . . . . . . . 400 300 100 33.3 400 TRADE . . . . . . . . . . . . . . . . . . . . . . . . . 2,100 1,900 200 10.5 2,100 Wholesale . . . . . . . . . . . . . . . . . . . . . . . . . . . . . . . 400 400 0 0.0 400 Retail . . . . . . . . . . . . . . . . . . . . . . . . . . . . . . . . . . 1,700 1,500 200 13.3 1,700 FINANCE, INS. & REAL ESTATE. . . . . . . . 400 300 100 33.3 400 SERVICES . . . . . . . . . . . . . . . . . . . . . . 2,600 2,500 100 4.0 2,600 GOVERNMENT . . . . . . . . . . . . . . . . . . . 800 800 0 0.0 900 Federal . . . . . . . . . . . . . . . . . . . . . . . . . . . . . . . . . . 0 0 0 0.0 0 State & Local . . . . . . . . . . . . . . . . . . . . . . . . . . . . . 800 800 0 0.0 900
LO LO LO LO LOWER RIVER LMAWER RIVER LMAWER RIVER LMAWER RIVER LMAWER RIVER LMA
NEW HA NEW HA NEW HA NEW HA NEW HAVEN LMAVEN LMAVEN LMAVEN LMAVEN LMA
NONFARM EMPLOYMENT ESTIMATES
Current month’s data are preliminary. Prior months’ data have been revised. All data are benchmarked to March 1998. *Total excludes workers idled due to labor-management disputes.
For further information on the Lower River Labor Market Area contact Noreen Passardi at (860) 263-6299.
For further information on the New Haven Labor Market Area contact J. Charles Joo at (860) 263-6293.

THE CONNECTICUT ECONOMIC DIGEST●●●●●1818181818 March 1999
Not Seasonally Adjusted
JAN JAN CHANGE DEC1999 1998 NO. % 1998
TOTAL NONFARM EMPLOYMENT . . . . . . . 203,500 200,400 3,100 1.5 209,600 GOODS PRODUCING INDUSTRIES . . . . . 32,000 33,400 -1,400 -4.2 32,800 CONSTRUCTION & MINING . . . . . . . . . . 5,600 5,400 200 3.7 6,000 MANUFACTURING . . . . . . . . . . . . . . . . . 26,400 28,000 -1,600 -5.7 26,800 Durable Goods . . . . . . . . . . . . . . . . . . . . . . . . . . . . 14,000 14,700 -700 -4.8 14,400 Industrial Machinery . . . . . . . . . . . . . . . . . . . . . . . 3,600 3,800 -200 -5.3 3,600 Electronic Equipment . . . . . . . . . . . . . . . . . . . . . . 2,300 2,500 -200 -8.0 2,300 Nondurable Goods. . . . . . . . . . . . . . . . . . . . . . . . . 12,400 13,300 -900 -6.8 12,400 Paper, Printing & Publishing . . . . . . . . . . . . . . . . 6,100 6,500 -400 -6.2 5,900 Chemicals & Allied . . . . . . . . . . . . . . . . . . . . . . . 3,100 3,300 -200 -6.1 3,100 Other Nondurable . . . . . . . . . . . . . . . . . . . . . . . . . 3,200 3,500 -300 -8.6 3,400 SERVICE PRODUCING INDUSTRIES . . . . 171,500 167,000 4,500 2.7 176,800 TRANS., COMM. & UTILITIES . . . . . . . . . 10,100 10,400 -300 -2.9 10,500 Communications & Utilities . . . . . . . . . . . . . . . . . 2,800 3,200 -400 -12.5 3,000 TRADE . . . . . . . . . . . . . . . . . . . . . . . . . 43,800 43,700 100 0.2 46,100 Wholesale . . . . . . . . . . . . . . . . . . . . . . . . . . . . . . . 11,300 11,300 0 0.0 11,500 Retail . . . . . . . . . . . . . . . . . . . . . . . . . . . . . . . . . . 32,500 32,400 100 0.3 34,600 FINANCE, INS. & REAL ESTATE. . . . . . . . 25,300 24,300 1,000 4.1 25,400 SERVICES . . . . . . . . . . . . . . . . . . . . . . 74,600 71,100 3,500 4.9 76,700 Business Services . . . . . . . . . . . . . . . . . . . . . . . . 22,100 21,200 900 4.2 23,200 Engineering & Mgmnt. Services . . . . . . . . . . . . . 11,200 10,500 700 6.7 11,100 Other Services . . . . . . . . . . . . . . . . . . . . . . . . . . . 41,300 39,400 1,900 4.8 42,400 GOVERNMENT . . . . . . . . . . . . . . . . . . . 17,700 17,500 200 1.1 18,100 Federal . . . . . . . . . . . . . . . . . . . . . . . . . . . . . . . . . . 2,000 1,900 100 5.3 2,100 State & Local . . . . . . . . . . . . . . . . . . . . . . . . . . . . . 15,700 15,600 100 0.6 16,000
Not Seasonally Adjusted
JAN JAN CHANGE DEC1999 1998 NO. % 1998
TOTAL NONFARM EMPLOYMENT . . . . . . . 136,900 134,900 2,000 1.5 140,200 GOODS PRODUCING INDUSTRIES . . . . . 28,400 28,800 -400 -1.4 29,000 CONSTRUCTION & MINING . . . . . . . . . . 4,400 4,300 100 2.3 4,900 MANUFACTURING . . . . . . . . . . . . . . . . . 24,000 24,500 -500 -2.0 24,100 Durable Goods . . . . . . . . . . . . . . . . . . . . . . . . . . . . 14,100 14,700 -600 -4.1 14,100 Primary & Fabricated Metals . . . . . . . . . . . . . . . 2,300 2,300 0 0.0 2,300 Other Durable Goods . . . . . . . . . . . . . . . . . . . . . . 11,800 12,400 -600 -4.8 11,800 Nondurable Goods. . . . . . . . . . . . . . . . . . . . . . . . . 9,900 9,800 100 1.0 10,000 Paper & Allied . . . . . . . . . . . . . . . . . . . . . . . . . . . 800 1,000 -200 -20.0 900 Other Nondurable Goods . . . . . . . . . . . . . . . . . . . 7,800 7,400 400 5.4 7,800 SERVICE PRODUCING INDUSTRIES . . . . 108,500 106,100 2,400 2.3 111,200 TRANS., COMM. & UTILITIES . . . . . . . . . 6,500 6,500 0 0.0 6,700 TRADE . . . . . . . . . . . . . . . . . . . . . . . . . 27,500 27,000 500 1.9 29,000 Wholesale . . . . . . . . . . . . . . . . . . . . . . . . . . . . . . . 2,600 2,500 100 4.0 2,700 Retail . . . . . . . . . . . . . . . . . . . . . . . . . . . . . . . . . . 24,900 24,500 400 1.6 26,300 Eating & Drinking Places . . . . . . . . . . . . . . . . . . . 6,900 6,900 0 0.0 7,500 Other Retail . . . . . . . . . . . . . . . . . . . . . . . . . . . . . . 18,000 17,600 400 2.3 18,800 FINANCE, INS. & REAL ESTATE. . . . . . . . 3,800 3,700 100 2.7 3,700 SERVICES . . . . . . . . . . . . . . . . . . . . . . 34,700 33,900 800 2.4 35,500 Personal & Business Services . . . . . . . . . . . . . . 6,300 6,400 -100 -1.6 6,400 Health Services . . . . . . . . . . . . . . . . . . . . . . . . . . 11,800 11,500 300 2.6 11,900 GOVERNMENT . . . . . . . . . . . . . . . . . . . 36,000 35,000 1,000 2.9 36,300 Federal . . . . . . . . . . . . . . . . . . . . . . . . . . . . . . . . . . 2,700 2,700 0 0.0 2,700 State & Local . . . . . . . . . . . . . . . . . . . . . . . . . . . . . 33,300 32,300 1,000 3.1 33,600 **Local . . . . . . . . . . . . . . . . . . . . . . . . . . . . . . . . . . 29,000 28,200 800 2.8 29,200
STSTSTSTSTAMFORD LMAAMFORD LMAAMFORD LMAAMFORD LMAAMFORD LMA
NONFARM EMPLOYMENT ESTIMATESNEW LONDON LMANEW LONDON LMANEW LONDON LMANEW LONDON LMANEW LONDON LMA
Current month’s data are preliminary. Prior months’ data have been revised. All data are benchmarked to March 1998. *Total excludes workers idled due to labor-management disputes.
For further information on the New London Labor Market Area contact Lincoln Dyer at (860) 263-6292.
For further information on the Stamford Labor Market Area contact Joseph Slepski at (860) 263-6278.

THE CONNECTICUT ECONOMIC DIGEST ●●●●●1919191919March 1999
Not Seasonally Adjusted
JAN JAN CHANGE DEC 1999 1998 NO. % 1998
TOTAL NONFARM EMPLOYMENT . . . . . . . 85,500 84,500 1,000 1.2 88,100 GOODS PRODUCING INDUSTRIES . . . . . 21,700 21,900 -200 -0.9 22,100 CONSTRUCTION & MINING . . . . . . . . . . 3,100 3,000 100 3.3 3,500 MANUFACTURING . . . . . . . . . . . . . . . . . 18,600 18,900 -300 -1.6 18,600 Durable Goods . . . . . . . . . . . . . . . . . . . . . . . . . . . . 14,600 14,700 -100 -0.7 14,500 Primary Metals . . . . . . . . . . . . . . . . . . . . . . . . . . . 800 800 0 0.0 800 Fabricated Metals . . . . . . . . . . . . . . . . . . . . . . . . . 6,400 6,500 -100 -1.5 6,400 Machinery & Electric Equipment . . . . . . . . . . . . 4,800 4,900 -100 -2.0 4,900 Nondurable Goods. . . . . . . . . . . . . . . . . . . . . . . . . 4,000 4,200 -200 -4.8 4,100 Paper, Printing & Publishing . . . . . . . . . . . . . . . . 1,300 1,200 100 8.3 1,300 SERVICE PRODUCING INDUSTRIES . . . . 63,800 62,600 1,200 1.9 66,000 TRANS., COMM. & UTILITIES . . . . . . . . . 3,700 3,700 0 0.0 3,700 TRADE . . . . . . . . . . . . . . . . . . . . . . . . . 18,500 17,800 700 3.9 19,300 Wholesale . . . . . . . . . . . . . . . . . . . . . . . . . . . . . . . 3,100 3,100 0 0.0 3,100 Retail . . . . . . . . . . . . . . . . . . . . . . . . . . . . . . . . . . 15,400 14,700 700 4.8 16,200 FINANCE, INS. & REAL ESTATE. . . . . . . . 3,600 3,600 0 0.0 3,600 SERVICES . . . . . . . . . . . . . . . . . . . . . . 26,100 25,700 400 1.6 27,100 Personal & Business . . . . . . . . . . . . . . . . . . . . . . 6,800 6,700 100 1.5 7,200 Health Services . . . . . . . . . . . . . . . . . . . . . . . . . . 10,500 10,500 0 0.0 10,700 GOVERNMENT . . . . . . . . . . . . . . . . . . . 11,900 11,800 100 0.8 12,300 Federal . . . . . . . . . . . . . . . . . . . . . . . . . . . . . . . . . . 800 800 0 0.0 800 State & Local . . . . . . . . . . . . . . . . . . . . . . . . . . . . . 11,100 11,000 100 0.9 11,500
Not Seasonally Adjusted
JAN JAN CHANGE DEC 1999 1998 NO. % 1998
TOTAL NONFARM EMPLOYMENT . . . . . . . 29,100 28,600 500 1.7 30,100 GOODS PRODUCING INDUSTRIES . . . . . 8,100 8,100 0 0.0 8,400 CONSTRUCTION & MINING . . . . . . . . . . 1,800 1,900 -100 -5.3 2,100 MANUFACTURING . . . . . . . . . . . . . . . . . 6,300 6,200 100 1.6 6,300 Durable Goods . . . . . . . . . . . . . . . . . . . . . . . . . . . . 4,400 4,300 100 2.3 4,400 Primary & Fabricated Metals . . . . . . . . . . . . . . . 700 600 100 16.7 600 Industrial Machinery . . . . . . . . . . . . . . . . . . . . . . . 1,100 1,200 -100 -8.3 1,200 Electronic Equipment . . . . . . . . . . . . . . . . . . . . . . 500 400 100 25.0 500 Other Durable Goods . . . . . . . . . . . . . . . . . . . . . . 2,100 2,100 0 0.0 2,100 Nondurable Goods. . . . . . . . . . . . . . . . . . . . . . . . . 1,900 1,900 0 0.0 1,900 Rubber & Plastics . . . . . . . . . . . . . . . . . . . . . . . . 1,000 900 100 11.1 1,000 Other Nondurable Goods . . . . . . . . . . . . . . . . . . . 900 1,000 -100 -10.0 900 SERVICE PRODUCING INDUSTRIES . . . . 21,000 20,500 500 2.4 21,700 TRANS., COMM. & UTILITIES . . . . . . . . . 900 800 100 12.5 900 TRADE . . . . . . . . . . . . . . . . . . . . . . . . . 6,400 6,200 200 3.2 6,700 Wholesale . . . . . . . . . . . . . . . . . . . . . . . . . . . . . . . 700 700 0 0.0 700 Retail . . . . . . . . . . . . . . . . . . . . . . . . . . . . . . . . . . 5,700 5,500 200 3.6 6,000 FINANCE, INS. & REAL ESTATE. . . . . . . . 800 900 -100 -11.1 800 SERVICES . . . . . . . . . . . . . . . . . . . . . . 9,500 9,300 200 2.2 9,900 GOVERNMENT . . . . . . . . . . . . . . . . . . . 3,400 3,300 100 3.0 3,400 Federal . . . . . . . . . . . . . . . . . . . . . . . . . . . . . . . . . . 200 200 0 0.0 200 State & Local . . . . . . . . . . . . . . . . . . . . . . . . . . . . . 3,200 3,100 100 3.2 3,200
TTTTTORRINGTORRINGTORRINGTORRINGTORRINGTON LMAON LMAON LMAON LMAON LMA
WWWWWAAAAATERBTERBTERBTERBTERBURURURURURY LMAY LMAY LMAY LMAY LMA
NONFARM EMPLOYMENT ESTIMATES
Current month’s data are preliminary. Prior months’ data have been revised. All data are benchmarked to March 1998. *Total excludes workers idled due to labor-management disputes.
For further information on the Torrington Labor Market Area contact Joseph Slepski at (860) 263-6278.
For further information on the Waterbury Labor Market Area contact Joseph Slepski at (860) 263-6278.

THE CONNECTICUT ECONOMIC DIGEST●●●●●2020202020 March 1999
LABOR FORCE ESTIMATES
Current month’s data are preliminary. Prior months’ data have been revised. All data are benchmarked to March 1998.
EMPLOYMENT JAN JAN CHANG E DEC(Not seasonally adjusted) STATUS 1999 1998 NO. % 1998
CONNECTICUT Civilian Labor Force 1,701,200 1,679,900 21,300 1.3 1,706,700Employed 1,640,500 1,605,700 34,800 2.2 1,659,000
Unemployed 60,800 74,200 -13,400 -18.1 47,700Unemployment Rate 3.6 4.4 -0.8 --- 2.8
BRIDGEPORT LMA Civilian Labor Force 217,300 216,800 500 0.2 219,600Employed 208,000 205,800 2,200 1.1 212,200
Unemployed 9,300 11,000 -1,700 -15.5 7,500Unemployment Rate 4.3 5.1 -0.8 --- 3.4
DANBURY LMA Civilian Labor Force 108,500 107,200 1,300 1.2 110,900Employed 105,700 104,000 1,700 1.6 108,900
Unemployed 2,800 3,200 -400 -12.5 2,100Unemployment Rate 2.6 2.9 -0.3 --- 1.9
DANIELSON LMA Civilian Labor Force 32,200 32,500 -300 -0.9 31,800Employed 30,600 30,300 300 1.0 30,600
Unemployed 1,600 2,200 -600 -27.3 1,200Unemployment Rate 4.9 6.7 -1.8 --- 3.9
HARTFORD LMA Civilian Labor Force 577,300 570,800 6,500 1.1 579,400Employed 555,600 544,000 11,600 2.1 562,900
Unemployed 21,800 26,800 -5,000 -18.7 16,600Unemployment Rate 3.8 4.7 -0.9 --- 2.9
LOWER RIVER LMA Civilian Labor Force 12,100 11,600 500 4.3 11,900Employed 11,700 11,200 500 4.5 11,700
Unemployed 300 400 -100 -25.0 300Unemployment Rate 2.9 3.8 -0.9 --- 2.3
NEW HAVEN LMA Civilian Labor Force 272,400 266,600 5,800 2.2 271,300Employed 263,200 255,400 7,800 3.1 263,700
Unemployed 9,300 11,200 -1,900 -17.0 7,600Unemployment Rate 3.4 4.2 -0.8 --- 2.8
NEW LONDON LMA Civilian Labor Force 151,600 150,100 1,500 1.0 150,900Employed 145,800 142,500 3,300 2.3 146,300
Unemployed 5,800 7,600 -1,800 -23.7 4,500Unemployment Rate 3.8 5.1 -1.3 --- 3.0
STAMFORD LMA Civilian Labor Force 192,100 188,600 3,500 1.9 192,700Employed 187,600 183,400 4,200 2.3 188,900
Unemployed 4,500 5,200 -700 -13.5 3,800Unemployment Rate 2.3 2.8 -0.5 --- 2.0
TORRINGTON LMA Civilian Labor Force 38,600 38,100 500 1.3 39,000Employed 37,400 36,600 800 2.2 38,200
Unemployed 1,200 1,500 -300 -20.0 800Unemployment Rate 3.1 3.9 -0.8 --- 2.1
WATERBURY LMA Civilian Labor Force 115,300 113,700 1,600 1.4 115,400Employed 110,300 107,800 2,500 2.3 111,500
Unemployed 5,000 5,900 -900 -15.3 3,900Unemployment Rate 4.4 5.2 -0.8 --- 3.4
UNITED STATES Civilian Labor Force 137,943,000 135,951,000 1,992,000 1.5 138,297,000Employed 131,339,000 128,882,000 2,457,000 1.9 132,732,000
Unemployed 6,604,000 7,069,000 -465,000 -6.6 5,565,000Unemployment Rate 4.8 5.2 -0.4 --- 4.0

THE CONNECTICUT ECONOMIC DIGEST ●●●●●2121212121March 1999
MANUFACTURING HOURS AND EARNINGS
NEW HOUSING PERMITS
Current month’s data are preliminary. Prior months’ data have been revised. All data are benchmarked to March 1998.
AVG WEEKLY EARNINGS AVG WEEKLY HOURS AVG HOURLY EARNINGSJAN CHG DEC JAN CHG DEC JAN CHG DEC
(Not seasonally adjusted) 1999 1998 Y/Y 1998 1999 1998 Y/Y 1998 1999 1998 Y/Y 1998MANUFACTURING $626.58 $626.84 -$0.25 $648.43 41.8 42.7 -0.9 43.2 $14.99 $14.68 $0.31 $15.01 DURABLE GOODS 639.75 639.43 0.32 667.07 42.2 42.8 -0.6 43.8 15.16 14.94 0.22 15.23 Lumber & Furniture 494.77 462.38 32.40 519.72 41.3 41.1 0.2 42.6 11.98 11.25 0.73 12.20 Stone, Clay and Glass 583.42 596.88 -13.47 615.79 43.8 43.6 0.2 46.3 13.32 13.69 -0.37 13.30 Primary Metals 583.25 609.13 -25.87 637.55 43.3 44.3 -1.0 45.9 13.47 13.75 -0.28 13.89 Fabricated Metals 587.97 585.19 2.78 617.84 42.3 42.1 0.2 44.1 13.90 13.90 0.00 14.01 Machinery 687.60 697.50 -9.90 719.14 43.3 45.0 -1.7 45.4 15.88 15.50 0.38 15.84 Electrical Equipment 500.93 496.54 4.39 531.71 40.3 40.8 -0.5 41.9 12.43 12.17 0.26 12.69 Trans. Equipment 799.90 812.93 -13.03 833.36 42.1 43.8 -1.7 43.7 19.00 18.56 0.44 19.07 Instruments 602.07 591.14 10.93 604.34 42.7 41.6 1.1 42.8 14.10 14.21 -0.11 14.12 Miscellaneous Mfg 619.09 581.70 37.39 606.32 41.3 42.0 -0.7 41.7 14.99 13.85 1.14 14.54 NONDUR. GOODS 594.86 595.72 -0.86 602.57 40.8 42.4 -1.6 41.7 14.58 14.05 0.53 14.45 Food 517.47 535.37 -17.90 551.06 41.2 44.1 -2.9 43.7 12.56 12.14 0.42 12.61 Textiles 460.92 477.76 -16.84 496.17 39.7 41.4 -1.7 41.8 11.61 11.54 0.07 11.87 Apparel 333.90 333.41 0.49 342.05 37.9 38.5 -0.6 40.1 8.81 8.66 0.15 8.53 Paper 718.33 707.94 10.39 718.40 44.7 46.0 -1.3 44.9 16.07 15.39 0.68 16.00 Printing & Publishing 590.06 572.88 17.18 593.94 37.8 39.4 -1.6 38.0 15.61 14.54 1.07 15.63 Chemicals 777.24 806.79 -29.55 781.46 43.3 44.5 -1.2 44.2 17.95 18.13 -0.18 17.68 Rubber & Misc. Plast. 514.19 512.74 1.44 530.56 41.5 42.8 -1.3 43.1 12.39 11.98 0.41 12.31CONSTRUCTION 771.83 763.29 8.55 825.66 39.1 39.9 -0.8 41.7 19.74 19.13 0.61 19.80
LMAs AVG WEEKLY EARNINGS AVG WEEKLY HOURS AVG HOURLY EARNINGS JAN CHG DEC JAN CHG DEC JAN CHG DEC
MANUFACTURING 1999 1998 Y/Y 1998 1999 1998 Y/Y 1998 1999 1998 Y/Y 1998Bridgeport $631.89 $655.34 -$23.45 $655.78 41.3 43.2 -1.9 42.5 $15.30 $15.17 $0.13 $15.43Danbury 607.21 610.87 -3.66 631.18 40.4 42.1 -1.7 41.8 15.03 14.51 0.52 15.10Danielson 472.33 476.14 -3.81 500.40 39.1 40.8 -1.7 41.7 12.08 11.67 0.41 12.00Hartford 674.58 676.53 -1.95 703.48 42.4 42.9 -0.5 44.3 15.91 15.77 0.14 15.88Lower River 523.06 504.40 18.66 543.17 40.8 40.0 0.8 41.4 12.82 12.61 0.21 13.12New Haven 599.65 608.40 -8.75 639.84 41.1 41.7 -0.6 43.0 14.59 14.59 0.00 14.88New London 657.83 641.69 16.14 672.52 41.9 42.3 -0.4 43.0 15.70 15.17 0.53 15.64Stamford 546.62 550.20 -3.58 548.26 39.1 39.3 -0.2 39.7 13.98 14.00 -0.02 13.81Torrington 553.24 545.67 7.57 545.58 42.2 42.3 -0.1 42.0 13.11 12.90 0.21 12.99Waterbury 634.04 615.38 18.66 638.32 44.0 44.4 -0.4 44.7 14.41 13.86 0.55 14.28
JAN JAN CHANGE Y/Y YTD CHANGE YTD DEC1999 1998 UNITS 1999 1998 UNITS 1998
Connecticut 749 737 12 1.6 749 737 12 1.6 1,129Counties:Fairfield 110 165 -55 -33.3 110 165 -55 -33.3 374Hartford 117 297 -180 -60.6 117 297 -180 -60.6 186Litchfield 22 31 -9 -29.0 22 31 -9 -29.0 62Middlesex 43 39 4 10.3 43 39 4 10.3 118New Haven 369 102 267 261.8 369 102 267 261.8 147New London 38 52 -14 -26.9 38 52 -14 -26.9 74Tolland 38 32 6 18.8 38 32 6 18.8 57Windham 12 19 -7 -36.8 12 19 -7 -36.8 111

THE CONNECTICUT ECONOMIC DIGEST●●●●●2222222222 March 1999
HOUSING PERMIT ACTIVITY BY TOWNTOWN JAN YR TO DATE TOWN JAN YR TO DATE TOWN JAN YR TO DATE
1999 1999 1998 1999 1999 1998 1999 1999 1998
Andover 1 1 3 Griswold 1 1 1 Preston 0 0 2Ansonia 0 0 2 Groton 7 7 8 Prospect 4 4 0Ashford 1 1 4 Guilford 7 7 11 Putnam 1 1 0Avon 12 12 5 Haddam 0 0 1 Redding 0 0 4Barkhamsted 0 0 0 Hamden 3 3 9 Ridgefield 9 9 11Beacon Falls 4 4 0 Hampton 0 0 1 Rocky Hill 2 2 2Berlin 6 6 5 Hartford 4 4 13 Roxbur y 0 0 1Bethany 0 0 1 Hartland 0 0 0 Salem 1 1 1Bethel 2 2 3 Harwinton 0 0 1 Salisbur y 0 0 0Bethlehem 1 1 0 Hebron 5 5 4 Scotland 0 0 3
Bloomfield 2 2 5 Kent 0 0 0 Seymour 2 2 3Bolton 1 1 2 Killin gly 0 0 1 Sharon 0 0 1Bozrah 0 0 0 Killingworth 3 3 4 Shelton 15 15 19Branford 1 1 4 Lebanon 2 2 0 Sherman 4 4 1Bridgeport 0 0 17 Ledyard 1 1 4 Simsbury 6 6 7Brid gewater 0 0 0 Lisbon 2 2 2 Somers 1 1 1Bristol 3 3 2 Litchfield 0 0 0 South Windsor 7 7 13Brookfield 4 4 0 Lyme 0 0 0 Southbur y 0 0 7Brooklyn 2 2 0 Madison 3 3 12 Southington 11 11 8Burlin gton 2 2 2 Manchester 1 1 87 Sprague 0 0 0
Canaan 0 0 0 Mansfield 3 3 6 Stafford 2 2 1Canterbury 0 0 2 Marlborough 2 2 1 Stamford 7 7 5Canton 0 0 2 Meriden 4 4 2 Sterlin g 1 1 1Chaplin 1 1 1 Middlebury 1 1 2 Stonington 10 10 6Cheshire 1 1 3 Middlefield 2 2 1 Stratford 4 4 1Chester 0 0 0 Middletown 8 8 13 Suffield 2 2 100Clinton 4 4 4 Milford 112 112 3 Thomaston 1 1 2Colchester 3 3 4 Monroe 11 11 5 Thompson 1 1 3Colebrook 0 0 1 Montville 1 1 3 Tolland 10 10 7Columbia 0 0 1 Morris 0 0 0 Torrington 8 8 0
Cornwall 0 0 1 Naugatuck 1 1 3 Trumbull 3 3 18Coventr y 8 8 4 New Britain 0 0 0 Union 1 1 0Cromwell 2 2 3 New Canaan 1 1 3 Vernon 1 1 2Danbur y 8 8 13 New Fairfield 1 1 3 Voluntown 0 0 0Darien 0 0 0 New Hartford 0 0 1 Wallingford 9 9 16Deep River 0 0 1 New Haven 195 195 0 Warren 0 0 1Derby 2 2 2 New London 0 0 0 Washington 1 1 0Durham 4 4 2 New Milford 6 6 8 Waterbur y 5 5 5East Granby 1 1 1 Newington 5 5 1 Waterford 2 2 5East Haddam 2 2 4 Newtown 16 16 18 Watertown 3 3 11
East Hampton 5 5 2 Norfolk 0 0 0 West Hartford 0 0 0East Hartford 1 1 0 North Branford 3 3 4 West Haven 2 2 1East Haven 2 2 2 North Canaan 0 0 0 Westbrook 7 7 0East Lyme 4 4 5 North Haven 0 0 3 Weston 1 1 2East Windsor 0 0 2 No. Stonin gton 0 0 4 Westport 3 3 3Eastford 1 1 1 Norwalk 8 8 14 Wethersfield 6 6 15Easton 0 0 3 Norwich 2 2 6 Willin gton 0 0 0Ellington 5 5 1 Old Lyme 2 2 1 Wilton 2 2 4Enfield 4 4 2 Old Sa ybrook 1 1 0 Winchester 0 0 0Essex 4 4 4 Orange 1 1 0 Windham 2 2 0
Fairfield 4 4 12 Oxford 2 2 3 Windsor 4 4 4Farmin gton 11 11 7 Plainfield 1 1 2 Windsor Locks 0 0 0Franklin 0 0 0 Plainville 1 1 1 Wolcott 4 4 2Glastonbur y 21 21 9 Plymouth 1 1 2 Woodbrid ge 1 1 2Goshen 0 0 1 Pomfret 1 1 0 Woodbury 1 1 0Granby 3 3 3 Portland 1 1 0 Woodstock 0 0 0Greenwich 7 7 6

THE CONNECTICUT ECONOMIC DIGEST ●●●●●2323232323March 1999
TECHNICAL NOTESBUSINESS STBUSINESS STBUSINESS STBUSINESS STBUSINESS STARARARARARTS AND TERMINATS AND TERMINATS AND TERMINATS AND TERMINATS AND TERMINATIONSTIONSTIONSTIONSTIONSDOL newly registered employers are those businesses newly registered with the Labor Department’s unemployment insurance program(including reopened accounts) during the month. DOL discontinued employers are those accounts that are terminated due to inactivity (noemployees) or business closure. Registrations and terminations of business entities as recorded with the Secretary of the State are an indica-tion of new business formation and activity. These registrations include limited liability companies, limited liability partnerships, and foreign-owned (out-of-state) and domestic-owned (in-state) corporations.
CONSUMER PRICE INDEXCONSUMER PRICE INDEXCONSUMER PRICE INDEXCONSUMER PRICE INDEXCONSUMER PRICE INDEXThe Consumer Price Index (CPI), computed and published by the U.S. Bureau of Labor Statistics, is a measure of the average change in pricesover time in a fixed market basket of goods and services. It is based on prices of food, clothing, shelter, fuels, transportation fares, charges fordoctors’ and dentists’ services, drugs and other goods and services that people buy for their day-to-day living. The Northeast region is com-prised of the New England states, New York, New Jersey and Pennsylvania. There is no separate consumer price index for Connecticut or anyarea within the state.
EMPLOYMENT COST INDEXEMPLOYMENT COST INDEXEMPLOYMENT COST INDEXEMPLOYMENT COST INDEXEMPLOYMENT COST INDEXThe Employment Cost Index (ECI) covers both wages and salaries and employer costs for employee benefits for all occupations and establish-ments in both the private nonfarm sector and state and local government. The ECI measures employers’ labor costs free from the influences ofemployment shifts among industries and occupations. The base period for all data is June 1989 when the ECI is 100.
HOURS AND EARNINGS ESTIMAHOURS AND EARNINGS ESTIMAHOURS AND EARNINGS ESTIMAHOURS AND EARNINGS ESTIMAHOURS AND EARNINGS ESTIMATESTESTESTESTESProduction worker earnings and hours estimates include full- and part-time employees working within manufacturing industries. Hoursworked and earnings data are computed based on payroll figures for the week including the 12th of the month. Average hourly earnings areaffected by such factors as premium pay for overtime and shift differential as well as changes in basic hourly and incentive rates of pay.Average weekly earnings are the product of weekly hours worked and hourly earnings.
INITIAL CLAIMSINITIAL CLAIMSINITIAL CLAIMSINITIAL CLAIMSINITIAL CLAIMSAverage weekly initial claims are calculated by dividing the total number of new claims for unemployment insurance received in the month bythe number of weeks in the month. A minor change in methodology took effect with data published in the March 1997 issue of the DIGEST.Data have been revised back to January 1980.
INSURED UNEMPLOYMENT RAINSURED UNEMPLOYMENT RAINSURED UNEMPLOYMENT RAINSURED UNEMPLOYMENT RAINSURED UNEMPLOYMENT RATETETETETEPrimarily a measure of unemployment insurance program activity, the insured unemployment rate is the 13-week average of the number ofpeople claiming unemployment benefits divided by the number of workers covered by the unemployment insurance system.
LABOR FORCE ESTIMALABOR FORCE ESTIMALABOR FORCE ESTIMALABOR FORCE ESTIMALABOR FORCE ESTIMATESTESTESTESTESLabor force estimates are a measure of the work status of people who live in Connecticut. Prepared under the direction of the U.S. Bureau ofLabor Statistics, the statewide estimates are the product of a multiple variable coefficient regression model, which uses results from theCurrent Population Survey (CPS), a monthly survey of Connecticut households, counts of claimants for unemployment benefits, and establish-ment employment estimates. Due to the small size of the sample taken in Connecticut, the CPS results are subject to significant sampling errorand produce considerable month-to-month fluctuations in estimates derived from the sample. In general, the CPS estimates, at the 90 percentconfidence level, have an error range of about 1.5 percentage points on a rate of 6.0 percent. An accepted method for calculating the error rangefor model estimates is currently not available. Labor force data, reflecting persons employed by place of residence, are not directly comparableto the place-of-work industry employment series. In the labor force estimates, workers involved in labor disputes are counted as employed. Thelabor force data also includes agricultural workers, unpaid family workers, domestics and the self-employed. Because of these conceptualdifferences, total labor force employment is almost always different from nonfarm wage and salary employment.
LABOR MARKET AREASLABOR MARKET AREASLABOR MARKET AREASLABOR MARKET AREASLABOR MARKET AREASAll Labor Market Areas in Connecticut except three are federally designated areas for developing labor statistics. Industry employment data forthe Danielson, Lower River and Torrington Labor Market Areas are prepared exclusively by the Connecticut Department of Labor, following thesame statistical procedures used to prepare estimates for the other Labor Market Areas, which are developed in cooperation with the U.S.Department of Labor, Bureau of Labor Statistics.
The Bureau of Labor Statistics has identified the five towns of Canaan, Kent, North Canaan, Salisbury and Sharon as a separate area forreporting labor force data. For the convenience of our data users, data for these towns are included in the Torrington Labor Market Area. Forthe same purpose, data for the town of Thompson, which is officially part of the Worcester Metropolitan Statistical Area, are included in theDanielson Labor Market Area. Also, data for Hopkinton and Westerly, Rhode Island are included in the New London Labor Market Area.
LEADING AND COINCIDENT EMPLOYMENT INDICESLEADING AND COINCIDENT EMPLOYMENT INDICESLEADING AND COINCIDENT EMPLOYMENT INDICESLEADING AND COINCIDENT EMPLOYMENT INDICESLEADING AND COINCIDENT EMPLOYMENT INDICESThe leading employment index is a composite of five individual employment-related series -the average workweek of manufacturing productionworkers, Hartford help-wanted advertising, short-duration (less than 15 weeks) unemployment rate, initial claims for unemployment insuranceand total housing permits. While not an employment-sector variable, housing permits are closely related to construction employment. Thecoincident employment index is a composite indicator of four individual employment-related series -the total unemployment rate, nonfarmemployment (employer survey), total employment (household survey) and the insured unemployment rate. All data are seasonally adjusted andcome from the Connecticut Labor Department and from the Federal Reserve Bank of Boston.
NONFNONFNONFNONFNONFARM EMPLOYMENT ESTIMAARM EMPLOYMENT ESTIMAARM EMPLOYMENT ESTIMAARM EMPLOYMENT ESTIMAARM EMPLOYMENT ESTIMATESTESTESTESTESNonfarm employment estimates are derived from a survey of businesses to measure jobs by industry. The estimates include all full- and part-time wage and salary employees who worked during or received pay for the pay period which includes the 12th of the month. Excluded fromthese estimates are proprietors, self-employed workers, private household employees and unpaid family workers. In some cases, due to spaceconstraints, all industry estimates are not shown. Call (860) 263-6275 for a more comprehensive breakout of nonfarm employment estimates.
UI COVERED WUI COVERED WUI COVERED WUI COVERED WUI COVERED WAGESAGESAGESAGESAGESUI covered wages is the total amount paid to those employees who are covered under the Connecticut’s Unemployment Insurance (UI) law forservices performed during the quarter. The fluctuations in the 1992-93 period reflect the effect of the changes in the tax law and the massiverestructuring in the state’s economy.

ECONOMIC DIGESTTHE CONNECTICUT
❑ If you wish to have your name removed from our mailing list, please
check here and return this page to the address at left.
❑ If your address has changed, please check here, make the necessary
changes to your address label and return this page to the address at left.
❑ If you receive more than one copy of this publication, please check hereand return this page from the duplicate copy to the address at left.
ECONOMIC INDICATORS AT A GLANCE
Leading Employment IndexLeading Employment IndexLeading Employment IndexLeading Employment IndexLeading Employment Index .................................................. +1.9+1.9+1.9+1.9+1.9Coincident Employment IndexCoincident Employment IndexCoincident Employment IndexCoincident Employment IndexCoincident Employment Index ......................... +5.2+5.2+5.2+5.2+5.2
TTTTTotal Nonfotal Nonfotal Nonfotal Nonfotal Nonfarararararm Emplom Emplom Emplom Emplom Employmentymentymentymentyment .................................................. +1.8+1.8+1.8+1.8+1.8
UnemploymentUnemploymentUnemploymentUnemploymentUnemployment ....................................................................................................................................... -0.8*-0.8*-0.8*-0.8*-0.8* Labor Force ................................... +1.3 Employed ....................................... +2.2 Unemployed ................................. -20.7
AAAAAvvvvverererererage age age age age WWWWWeekly Initial Claimseekly Initial Claimseekly Initial Claimseekly Initial Claimseekly Initial Claims .................... +23.2+23.2+23.2+23.2+23.2Help Help Help Help Help WWWWWanted Indeanted Indeanted Indeanted Indeanted Index -- Harx -- Harx -- Harx -- Harx -- Hartftftftftfordordordordord ................................... -5.7-5.7-5.7-5.7-5.7AAAAAvvvvverererererage Insage Insage Insage Insage Ins..... Unempl. Unempl. Unempl. Unempl. Unempl. Rate Rate Rate Rate Rate ............................................. -0.13*-0.13*-0.13*-0.13*-0.13*
AAAAAvvvvverererererage age age age age WWWWWeekly Hourseekly Hourseekly Hourseekly Hourseekly Hours, Mfg, Mfg, Mfg, Mfg, Mfg .................................................. -2.1-2.1-2.1-2.1-2.1AAAAAvvvvverererererage Hourage Hourage Hourage Hourage Hourly Early Early Early Early Earningsningsningsningsnings, Mfg, Mfg, Mfg, Mfg, Mfg .............................. +2.1+2.1+2.1+2.1+2.1AAAAAvvvvverererererage age age age age WWWWWeekly Eareekly Eareekly Eareekly Eareekly Earningsningsningsningsnings, Mfg, Mfg, Mfg, Mfg, Mfg ................................... 0.00.00.00.00.0Manufacturing OutputManufacturing OutputManufacturing OutputManufacturing OutputManufacturing Output ............................................................................................... -2.3-2.3-2.3-2.3-2.3 Production Worker Hours ................ -3.6 Productivity .................................... +1.3
Personal IncomePersonal IncomePersonal IncomePersonal IncomePersonal Income .................................................................................................................................. +4.5+4.5+4.5+4.5+4.5UI CoUI CoUI CoUI CoUI Covvvvvered ered ered ered ered WWWWWagesagesagesagesages ................................................................................................................... +7.5+7.5+7.5+7.5+7.5
Business ActivityBusiness ActivityBusiness ActivityBusiness ActivityBusiness Activity New Housing Permits .................... +1.6 Electricity Sales............................... -3.4 Retail Sales ................................... +7.8 Construction Contracts Index ......... +9.7 New Auto Registrations ................ +17.4 Air Cargo Tons ................................ -3.1
Business StarBusiness StarBusiness StarBusiness StarBusiness Startststststs Secretary of the State ..................... -1.1 Dept. of Labor ................................. -4.3
Business Business Business Business Business TTTTTerererererminationsminationsminationsminationsminations Secretary of the State .................... +1.7 Dept. of Labor .............................. +10.8
State State State State State TTTTTax Collectionsax Collectionsax Collectionsax Collectionsax Collections .................................................................................................... -0.5-0.5-0.5-0.5-0.5 Corporate Tax .................................. -7.1 Personal Income Tax ...................... +5.9 Real Estate Conveyance Tax .......... +0.7 Sales & Use Tax ............................. +7.6
TTTTTourourourourourism and ism and ism and ism and ism and TTTTTrrrrraaaaavvvvvelelelelel Tourism Inquiries ............................. -1.5 Tourism Info Centers .................... +11.5 Attraction Visitors ............................ -7.1 Hotel-Motel Occupancy ................... 0.0* Air Passenger Count ................... +10.5
EmploEmploEmploEmploEmployment Cost Indeyment Cost Indeyment Cost Indeyment Cost Indeyment Cost Index (Ux (Ux (Ux (Ux (U.S.S.S.S.S.).).).).) Total ............................................... +3.5 Wages & Salaries .......................... +3.9 Benefit Costs ................................. +2.4
Consumer PrConsumer PrConsumer PrConsumer PrConsumer Price Indeice Indeice Indeice Indeice Indexxxxx U.S. City Average ........................... +1.7 Northeast Region ........................... +0.1 NY-NJ-Long Island ......................... +0.2 Boston-Brockton-Nashua ............... +1.7Consumer ConfidenceConsumer ConfidenceConsumer ConfidenceConsumer ConfidenceConsumer Confidence U.S. ................................................ -0.5 New England .............................. +17.1
Interest RatesInterest RatesInterest RatesInterest RatesInterest Rates Prime ........................................... -0.75* Conventional Mortgage ................ -0.20*
A joint publication of The Connecticut Departments of Labor and Economic and Community Development
Mailing address:
Connecticut Economic DigestConnecticut Economic DigestConnecticut Economic DigestConnecticut Economic DigestConnecticut Economic DigestConnecticut DeparConnecticut DeparConnecticut DeparConnecticut DeparConnecticut Department of Labortment of Labortment of Labortment of Labortment of Labor
Office of ResearchOffice of ResearchOffice of ResearchOffice of ResearchOffice of Research200 F200 F200 F200 F200 Folly Brook Bouleolly Brook Bouleolly Brook Bouleolly Brook Bouleolly Brook Boulevvvvvardardardardard
WWWWWethersfield, CT 06109-1114ethersfield, CT 06109-1114ethersfield, CT 06109-1114ethersfield, CT 06109-1114ethersfield, CT 06109-1114
THE CONNECTICUT ECONOMIC DIGEST
*Percentage point change; **Less than 0.05 percent; NA = Not Available
The Connecticut Economic Digest is available on the internet at:http://wwwhttp://wwwhttp://wwwhttp://wwwhttp://www.ctdol.state.ctdol.state.ctdol.state.ctdol.state.ctdol.state.ct.us.ct.us.ct.us.ct.us.ct.us
orhttp://wwwhttp://wwwhttp://wwwhttp://wwwhttp://www.state.state.state.state.state.ct.us/ecd/research.ct.us/ecd/research.ct.us/ecd/research.ct.us/ecd/research.ct.us/ecd/research
March 1999
(P(P(P(P(Percent change from prercent change from prercent change from prercent change from prercent change from prior yior yior yior yior yearearearearear;;;;; see pages 5-9 f see pages 5-9 f see pages 5-9 f see pages 5-9 f see pages 5-9 for refor refor refor refor reference months)erence months)erence months)erence months)erence months)
First Class MailFirst Class MailFirst Class MailFirst Class MailFirst Class Mail
U.S. PostageU.S. PostageU.S. PostageU.S. PostageU.S. Postage
PPPPPAIDAIDAIDAIDAIDPERMIT # 5PERMIT # 5PERMIT # 5PERMIT # 5PERMIT # 5
BLOOMFIELD, CTBLOOMFIELD, CTBLOOMFIELD, CTBLOOMFIELD, CTBLOOMFIELD, CT