Embed Size (px)
Citation preview
Usefulness for Identifying
IDPH Office of Women’s Health and Family Services
What is Economic Disadvantage?
Economic disadvantage, also commonly called “c
for the economic strength of a community. While it is similar to measuring poverty, it encompasses
more than just income level to determin
concentrated disadvantage include poverty, use of publ
security, and food stamps), unemployment, female
literature has shown that these factors are highly associat
approximate the level of economic disadvantage
How is Economic Disadvantage Calculated?
Economic disadvantage is calculated at the county or census tract level based on five variables collected
in the U.S. Census and American Community
• % of families under the poverty line
• % of persons living in households receiving public assistance (cash assistance, SSI, SNAP)
• % of individuals 16 and older in the labor force who are unemployed
• % of households headed by single females
• % of persons under 18 years of age
For this analysis, 2010 Census and 2008
was used as the standard for comparing level of disadvantage across communities. In doing this, one
can identify the communities with the highest levels of disadvantage.
economic disadvantage at the county
census tract level within counties that were identified as high disadvantage counties
Why is Economic Disadvantage Important for Health?
Within a community, concentrated disadvantage can impact health through indicate reduced access to
health care, social services, resources, skills, work, education, technology, nutrition, and safety
Economic disadvantage has also been shown in the literature to be associated with many health
outcomes across the lifespan. In Illinois, we assessed the relationship of economic disadvantage
several birth outcomes and markers of service use or ris
poor birth outcomes are shown in table
Because economic disadvantage is such a strong marker for health outcomes, it may be a useful
indicator for identifying target communities for public health
data is available at more specific geographic areas than what is available for many health outcomes, so it
can be particularly useful for determining how to allocate resources and programs within a county or
within a city.
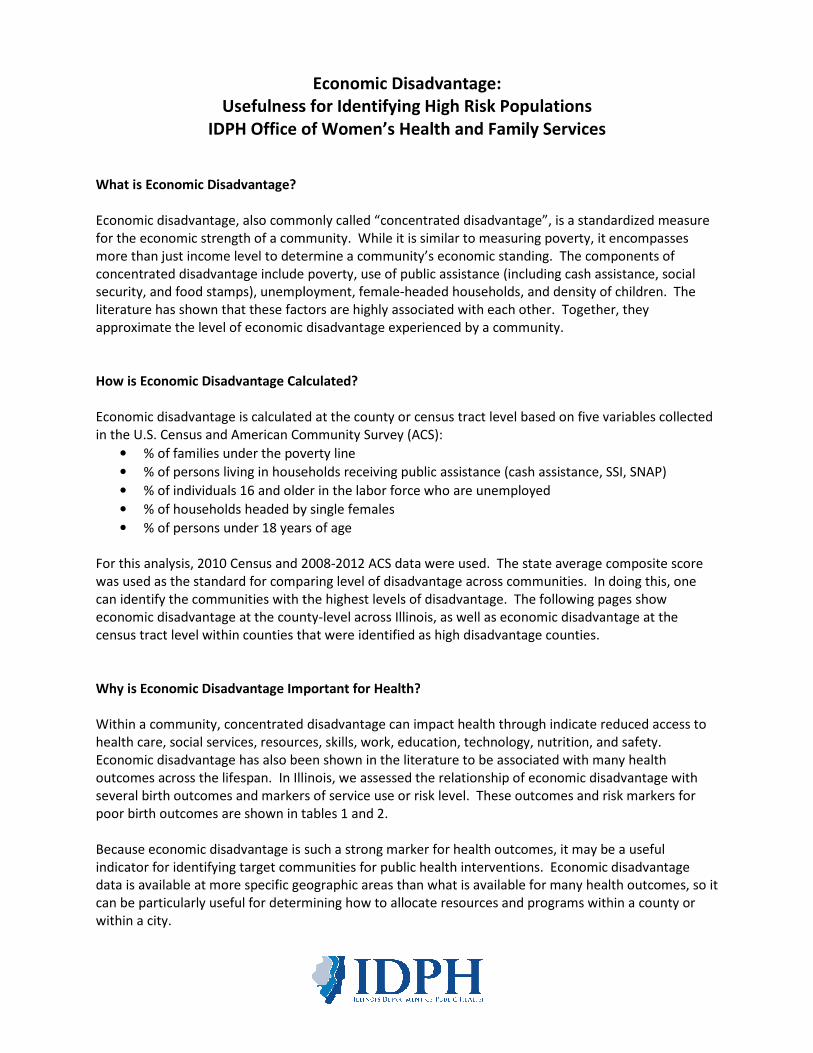
Economic Disadvantage:
Usefulness for Identifying High Risk Populations
IDPH Office of Women’s Health and Family Services
Economic disadvantage, also commonly called “concentrated disadvantage”, is a standard
for the economic strength of a community. While it is similar to measuring poverty, it encompasses
more than just income level to determine a community’s economic standing. The components of
concentrated disadvantage include poverty, use of public assistance (including cash assistance, social
and food stamps), unemployment, female-headed households, and density of children. The
literature has shown that these factors are highly associated with each other. Together, they
e level of economic disadvantage experienced by a community.
How is Economic Disadvantage Calculated?
Economic disadvantage is calculated at the county or census tract level based on five variables collected
in the U.S. Census and American Community Survey (ACS):
% of families under the poverty line
% of persons living in households receiving public assistance (cash assistance, SSI, SNAP)
% of individuals 16 and older in the labor force who are unemployed
% of households headed by single females
persons under 18 years of age
For this analysis, 2010 Census and 2008-2012 ACS data were used. The state average composite score
was used as the standard for comparing level of disadvantage across communities. In doing this, one
ties with the highest levels of disadvantage. The following pages show
economic disadvantage at the county-level across Illinois, as well as economic disadvantage at the
census tract level within counties that were identified as high disadvantage counties.
Why is Economic Disadvantage Important for Health?
Within a community, concentrated disadvantage can impact health through indicate reduced access to
health care, social services, resources, skills, work, education, technology, nutrition, and safety
Economic disadvantage has also been shown in the literature to be associated with many health
In Illinois, we assessed the relationship of economic disadvantage
several birth outcomes and markers of service use or risk level. These outcomes and risk markers for
are shown in tables 1 and 2.
Because economic disadvantage is such a strong marker for health outcomes, it may be a useful
indicator for identifying target communities for public health interventions. Economic disadvantage
data is available at more specific geographic areas than what is available for many health outcomes, so it
can be particularly useful for determining how to allocate resources and programs within a county or
is a standardized measure
for the economic strength of a community. While it is similar to measuring poverty, it encompasses
The components of
(including cash assistance, social
headed households, and density of children. The
. Together, they
Economic disadvantage is calculated at the county or census tract level based on five variables collected
% of persons living in households receiving public assistance (cash assistance, SSI, SNAP)
2012 ACS data were used. The state average composite score
was used as the standard for comparing level of disadvantage across communities. In doing this, one
The following pages show
level across Illinois, as well as economic disadvantage at the
Within a community, concentrated disadvantage can impact health through indicate reduced access to
health care, social services, resources, skills, work, education, technology, nutrition, and safety.
Economic disadvantage has also been shown in the literature to be associated with many health
In Illinois, we assessed the relationship of economic disadvantage with
and risk markers for
Because economic disadvantage is such a strong marker for health outcomes, it may be a useful
interventions. Economic disadvantage
data is available at more specific geographic areas than what is available for many health outcomes, so it
can be particularly useful for determining how to allocate resources and programs within a county or

Top 10 Disadvantaged Counties
A: Winnebago County
B: Cook County
C: Kankakee County
D: Vermilion County
E: Macon County
F: Marion County
G: St. Clair County
H: Saline County
I: Alexander County
J: Pulaski County
A
B
C
D
E
F
G
H
I J
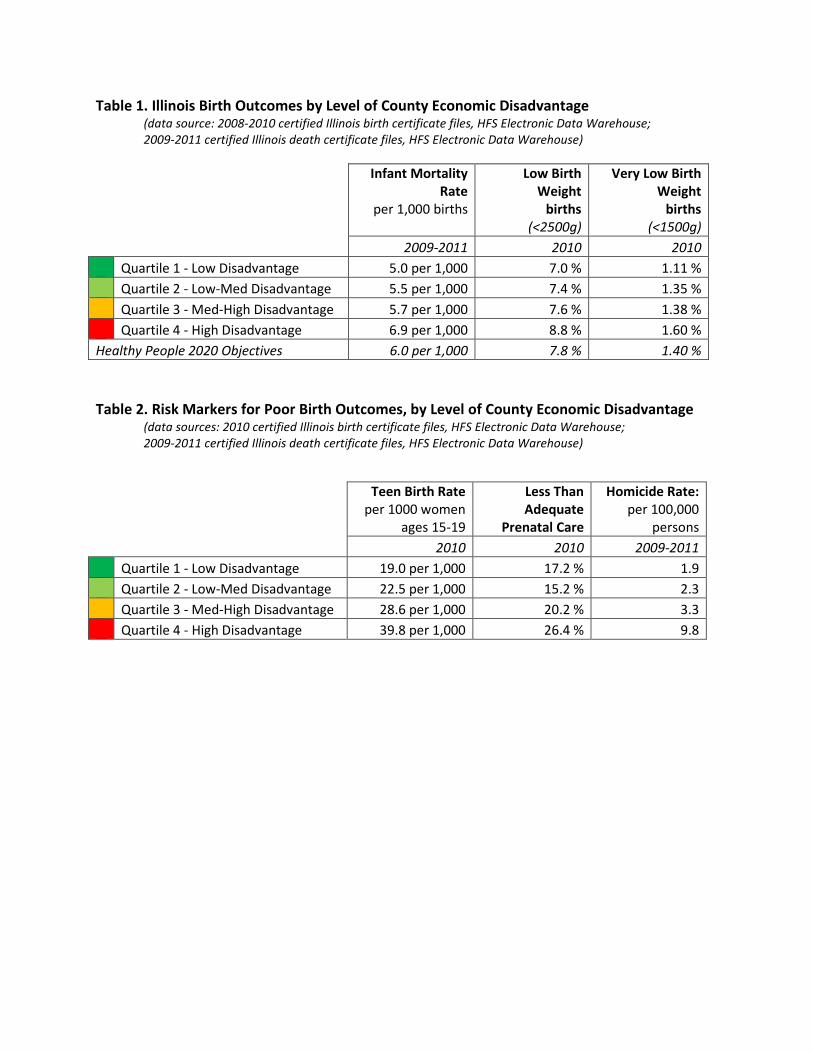
Table 1. Illinois Birth Outcomes by Level of County Economic Disadvantage (data source: 2008-2010 certified Illinois birth certificate files, HFS Electronic Data Warehouse;
2009-2011 certified Illinois death certificate files, HFS Electronic Data Warehouse)
Table 2. Risk Markers for Poor Birth Outcomes, by Level of County Economic Disadvantage (data sources: 2010 certified Illinois birth certificate files, HFS Electronic Data Warehouse;
2009-2011 certified Illinois death certificate files, HFS Electronic Data Warehouse)
Infant Mortality
Rate
per 1,000 births
Low Birth
Weight
births
(<2500g)
Very Low Birth
Weight
births
(<1500g)
2009-2011 2010 2010
Quartile 1 - Low Disadvantage 5.0 per 1,000 7.0 % 1.11 %
Quartile 2 - Low-Med Disadvantage 5.5 per 1,000 7.4 % 1.35 %
Quartile 3 - Med-High Disadvantage 5.7 per 1,000 7.6 % 1.38 %
Quartile 4 - High Disadvantage 6.9 per 1,000 8.8 % 1.60 %
Healthy People 2020 Objectives 6.0 per 1,000 7.8 % 1.40 %
Teen Birth Rate
per 1000 women
ages 15-19
Less Than
Adequate
Prenatal Care
Homicide Rate:
per 100,000
persons
2010 2010 2009-2011
Quartile 1 - Low Disadvantage 19.0 per 1,000 17.2 % 1.9
Quartile 2 - Low-Med Disadvantage 22.5 per 1,000 15.2 % 2.3
Quartile 3 - Med-High Disadvantage 28.6 per 1,000 20.2 % 3.3
Quartile 4 - High Disadvantage 39.8 per 1,000 26.4 % 9.8