Embed Size (px)
Citation preview
Phot
o by
Mic
hael
Rau
ner
Phot
ogra
phy
Economic Effects of Traffic Calming on Urban Small Businesses
Emily Drennen Department of Public Administration
San Francisco State University December, 2003
Table of Contents
List of Tables................................................................................................iv
List of Figures................................................................................................v
Abstract ........................................................................................................ 1
Introduction ................................................................................................. 2 Aim of this Study............................................................................................................. 2 Definition of Traffic Calming.......................................................................................... 2 Public Participation in Traffic Calming Projects............................................................. 3 Small Businesses and Traffic Calming............................................................................ 4
Economic Benefits of Traffic Calming .................................................... 5 Traffic Calming Benefits for Urban Small Businesses.................................................... 7
Economic Revitalization and Property Values .......................................................... 8 Attractiveness and Safety......................................................................................... 12 Sales and Attracting Customers ............................................................................... 15 Parking ..................................................................................................................... 22 Impact on Employees............................................................................................... 24 Construction and Costs ............................................................................................ 26
Background/Methodology of the Valencia Street Bike Lane Merchant Survey ....................................................................................28 Valencia Street Bike Lane Project Background ............................................................ 28
Neighborhood Demographics .................................................................................. 28 Valencia Street Bike Lane Project ........................................................................... 29
Valencia Street Bike Lane Merchant Survey Methodology and Participants ............... 31 Research Techniques in the Literature..................................................................... 31 Methodology for the Valencia Street Bike Lane Merchant Survey......................... 34
Results of the Valencia Street Bike Lane Merchant Survey.............45 Economic Revitalization and Property Values .............................................................. 47 Attractiveness and Safety............................................................................................... 49 Sales and Attracting Customers ...................................................................................... 54 Parking........................................................................................................................... 59 Impact on Employees..................................................................................................... 62 Construction and Costs .................................................................................................. 63 Summary Questions....................................................................................................... 64
Economic Effects of Traffic Calming on Urban Small Businesses Page iii
Discussion...................................................................................................66 Economic Revitalization and Property Values .............................................................. 66 Attractiveness and Safety............................................................................................... 67
Making the Street Attractive.................................................................................... 67 Reducing Auto Speed .............................................................................................. 67 Increasing Safety...................................................................................................... 68
Sales and Attracting Customers ...................................................................................... 69 Increased Sales......................................................................................................... 69 More Walking and Biking Customers ..................................................................... 69 More Customers from Within and Outside the Neighborhood................................ 70
Parking........................................................................................................................... 71 Customer Parking..................................................................................................... 71 Deliveries ................................................................................................................. 72
Impact on Employees..................................................................................................... 72 Construction and Costs .................................................................................................. 73 Summary Questions....................................................................................................... 73
General Impact on Business and Sales .................................................................... 73 Support more Traffic Calming on Valencia Street .................................................. 73
Next Steps..................................................................................................75
Appendix 1 — Summary of Responses..................................................77
Endnotes .....................................................................................................80
Bibliography................................................................................................81
Credits.........................................................................................................84
Economic Effects of Traffic Calming on Urban Small Businesses Page iv
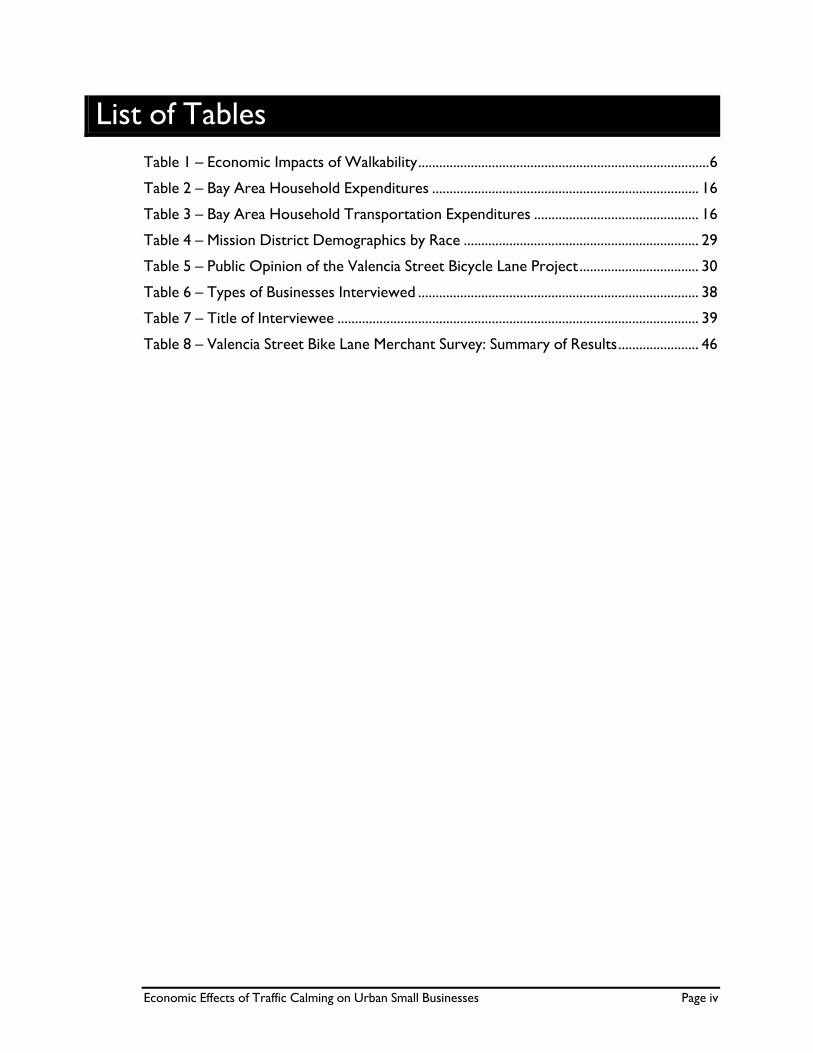
List of Tables Table 1 — Economic Impacts of Walkability...................................................................................6 Table 2 — Bay Area Household Expenditures ............................................................................ 16 Table 3 — Bay Area Household Transportation Expenditures ............................................... 16 Table 4 — Mission District Demographics by Race ................................................................... 29 Table 5 — Public Opinion of the Valencia Street Bicycle Lane Project .................................. 30 Table 6 — Types of Businesses Interviewed ................................................................................ 38 Table 7 — Title of Interviewee ....................................................................................................... 39 Table 8 — Valencia Street Bike Lane Merchant Survey: Summary of Results....................... 46
Economic Effects of Traffic Calming on Urban Small Businesses Page v
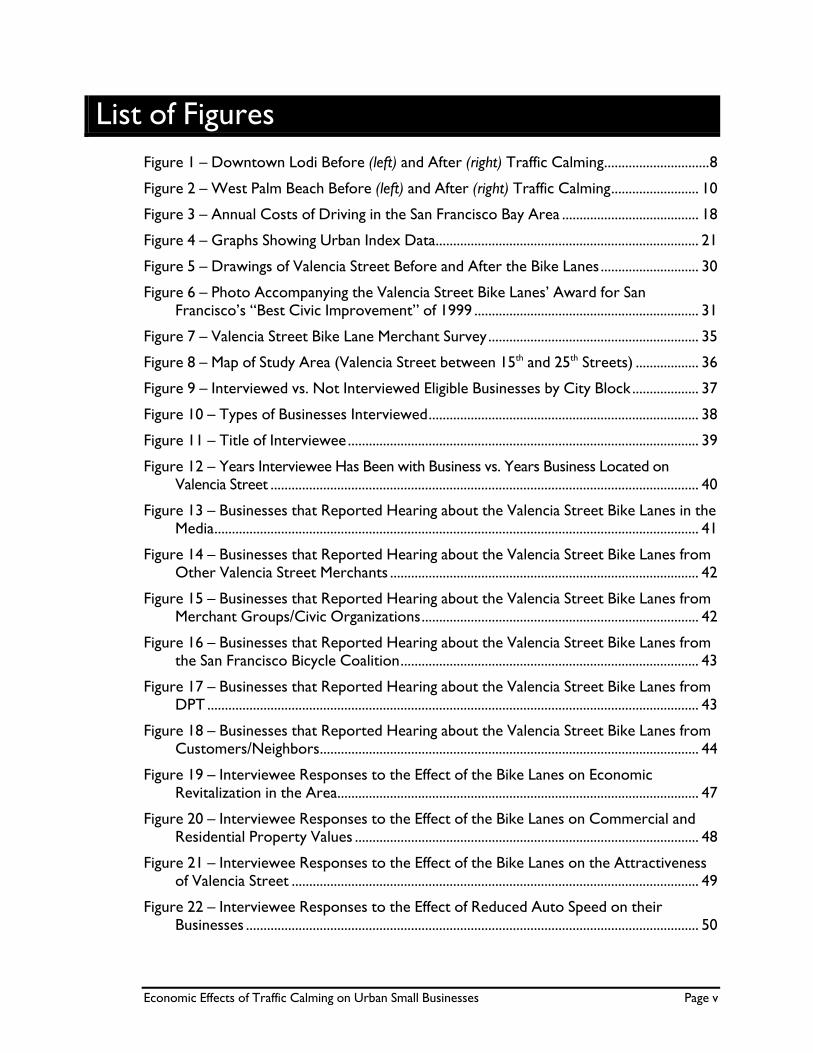
List of Figures Figure 1 — Downtown Lodi Before (left) and After (right) Traffic Calming..............................8 Figure 2 — West Palm Beach Before (left) and After (right) Traffic Calming......................... 10 Figure 3 — Annual Costs of Driving in the San Francisco Bay Area ....................................... 18 Figure 4 — Graphs Showing Urban Index Data........................................................................... 21 Figure 5 — Drawings of Valencia Street Before and After the Bike Lanes............................ 30 Figure 6 — Photo Accompanying the Valencia Street Bike Lanes’ Award for San
Francisco’s “Best Civic Improvement” of 1999 ................................................................ 31 Figure 7 — Valencia Street Bike Lane Merchant Survey............................................................ 35 Figure 8 — Map of Study Area (Valencia Street between 15th and 25th Streets) .................. 36 Figure 9 — Interviewed vs. Not Interviewed Eligible Businesses by City Block................... 37 Figure 10 — Types of Businesses Interviewed............................................................................. 38 Figure 11 — Title of Interviewee.................................................................................................... 39 Figure 12 — Years Interviewee Has Been with Business vs. Years Business Located on
Valencia Street .......................................................................................................................... 40 Figure 13 — Businesses that Reported Hearing about the Valencia Street Bike Lanes in the
Media.......................................................................................................................................... 41 Figure 14 — Businesses that Reported Hearing about the Valencia Street Bike Lanes from
Other Valencia Street Merchants ........................................................................................ 42 Figure 15 — Businesses that Reported Hearing about the Valencia Street Bike Lanes from
Merchant Groups/Civic Organizations............................................................................... 42 Figure 16 — Businesses that Reported Hearing about the Valencia Street Bike Lanes from
the San Francisco Bicycle Coalition..................................................................................... 43 Figure 17 — Businesses that Reported Hearing about the Valencia Street Bike Lanes from
DPT ............................................................................................................................................ 43 Figure 18 — Businesses that Reported Hearing about the Valencia Street Bike Lanes from
Customers/Neighbors............................................................................................................ 44 Figure 19 — Interviewee Responses to the Effect of the Bike Lanes on Economic
Revitalization in the Area....................................................................................................... 47 Figure 20 — Interviewee Responses to the Effect of the Bike Lanes on Commercial and
Residential Property Values .................................................................................................. 48 Figure 21 — Interviewee Responses to the Effect of the Bike Lanes on the Attractiveness
of Valencia Street .................................................................................................................... 49 Figure 22 — Interviewee Responses to the Effect of Reduced Auto Speed on their
Businesses ................................................................................................................................. 50
Economic Effects of Traffic Calming on Urban Small Businesses Page vi
Figure 23 — Interviewee Responses to the Effect of Increased Traffic Congestion on Valencia Street on their Businesses..................................................................................... 51
Figure 24 — Interviewee Responses to the Effect of Increased Traffic Congestion on Nearby Streets on their Businesses .................................................................................... 52
Figure 25 — Interviewee Responses to the Effect of the Bike Lanes on Pedestrian Safety 53 Figure 26 — Interviewee Responses to the Effect of the Bike Lanes on Sales...................... 54 Figure 27 — Interviewee Responses to the Effect of the Bike Lanes on Pedestrian Activity
..................................................................................................................................................... 55 Figure 28 — Interviewee Responses to the Effect of the Bike Lanes on the Number of
their Customers who Ride Bicycles .................................................................................... 56 Figure 29 — Interviewee Responses to the Effect of the Bike Lanes on Helping Area
Residents Shop Locally........................................................................................................... 57 Figure 30 — Interviewee Responses to the Effect of the Bike Lanes on Bringing New
Customers to the Area.......................................................................................................... 58 Figure 31 — Interviewee Responses to the Effect of the Bike Lanes on Customer Parking
..................................................................................................................................................... 59 Figure 32 — Interviewee Responses to the Effect of the Bike Lanes on Delivery Truck
Access........................................................................................................................................ 60 Figure 33 — Interviewee Responses to the Effect of Using the Middle Lane for Double
Parking ....................................................................................................................................... 61 Figure 34 — Interviewee Responses to the Effect of the Bike Lanes on Convenience for
their Employees ....................................................................................................................... 62 Figure 35 — Interviewee Responses to the Effect of the Bike Lane Construction on their
Businesses ................................................................................................................................. 63 Figure 36 — Interviewee Responses to the General Impact the Bike Lanes Have Had on
their Businesses ....................................................................................................................... 64 Figure 37 — Interviewee Responses to Whether They Would Support More Traffic
Calming on Valencia Street ................................................................................................... 65
Economic Effects of Traffic Calming on Urban Small Businesses Page 1
Abstract This study investigates how changes to the streets and sidewalks in urban areas to
make them safer, more attractive, and more livable (“traffic calming”) affect retailers in
highly urbanized areas. For this study, twenty-seven merchants located in the Mission
District of San Francisco were interviewed about what impact the Valencia Street bicycle
lanes have had on their businesses. Four and a half years after the bike lanes were built,
the vast majority of the interviewees expressed support for the bike lanes. Sixty-six
percent of the merchants believe that the bike lanes have had a generally positive impact
on their business and/or sales, and the same percentage would support more traffic
calming on Valencia Street. The results from this study will be used to develop outreach
materials about traffic calming for urban small businesses.
Economic Effects of Traffic Calming on Urban Small Businesses Page 2
Introduction
Aim of this Study This study investigates how changes to the streets and sidewalks in urban areas to
make them safer, more attractive, and more livable (“traffic calming”) affect small
businesses in highly urbanized areas. Background information on traffic calming is
presented, followed by a discussion detailing the economic impacts of traffic calming and
other smart growth projects. Six reasons about why traffic calming projects benefit small
businesses are presented as hypotheses. Twenty-seven interviews were conducted with
merchants from San Francisco’s Mission District about how the Valencia Street bicycle
lanes have affected their businesses. The results of this case study are presented in
relation to the six hypotheses mentioned above.
With this information, it will be easier to develop neighborhood outreach
campaigns and tools that will fully address the concerns of small businesses when traffic
calming is proposed for an area. More effective outreach campaigns and tools for small
businesses will hopefully lead to traffic calming projects that cost less and require less
time for implementation.
Definition of Traffic Calming Traffic calming aims to reclaim public space through engineering tools that
reduce auto speed and create safer streets for pedestrians, bicyclists, transit riders, and
other road users. A subcommittee of the Institute of Transportation Engineers developed
a formal definition of traffic calming (Litman, 1997, p. 22): “Traffic calming is the
combination of mainly physical measures that reduce the negative effects of motor
Economic Effects of Traffic Calming on Urban Small Businesses Page 3
vehicle use, alter driver behavior, and improve conditions for non-motorized street
users.”
Traffic calming began in Europe in the 1960’s and 1970’s as a fledging concept
and was introduced to a few US cities in the late 1970’s to 1980’s (Ewing, 1999). Traffic
calming is part of a new movement in transportation engineering that is more multi-
modal in focus (buses, bikes, pedestrians, etc.) and less auto-centric than previous
engineering trends. Common traffic calming techniques and tools include speed bumps,
crosswalk narrowing for pedestrians, better signals or signs, new street trees or
landscaping, bike lanes, removing a lane of auto traffic, and reconfiguring or narrowing
streets.
Some of the goals of traffic calming, as identified by Lockwood (1997, p. 23) and
Lockwood and Stillings (1998, p. 3), are to:
Achieve slow speeds for motor vehicles Attract investment, redevelopment, and new businesses Create aesthetically beautiful streets Create safe and attractive streets Encourage water infiltration into the ground Enhance the street environment Improve social links Meet the needs of people working, playing, and residing in an area Increase access for all modes of transportation Increase the safety and the perception of safety for non-motorized street users Promote pedestrian, bicycle, and transit use Raise property values Reduce collision frequency and severity Reduce cut-through auto traffic Reduce the need for traffic enforcement Reduce the negative effects of motor vehicles on the environment
Public Participation in Traffic Calming Projects Members of the public have strong opinions about what happens on their streets
and in their neighborhoods. Because traffic calming is a new concept, members of the
Economic Effects of Traffic Calming on Urban Small Businesses Page 4
public are wary of change. Typically, a large percentage of residents (50-70%) must
initially approve the concept of introducing traffic calming devices in their
neighborhoods before any traffic devices are laid in the pavement (Ewing, 1999, p. 164).
Voiced opposition can effectively stop a traffic calming project in its tracks.
Small Businesses and Traffic Calming Small business owners can be the most vocal opponents of traffic calming
projects because they fear losing revenue due to changes to the streetscape. Politicians
and government officials are often reluctant to move ahead with a project because it is
politically risky to be anything but strongly supportive of small businesses. Small
business support can be a significant factor in whether a traffic calming project is
abandoned or approved.
Some research suggests that traffic calming projects can actually improve
business conditions and raise revenues for small businesses (Lockwood, 1998). In fact,
business owners in areas that have previously received traffic calming measures can
become some of the most vocal champions of this work. However, business owners in
areas being studied for traffic calming are often not aware of how well these measures
have worked for their counterparts across town and in other jurisdictions. If
transportation engineers, city planners, and advocates were able to provide empirical data
showing how traffic calming measures have improved small business conditions, traffic
calming projects might be approved with fewer impediments and more community
support.
Economic Effects of Traffic Calming on Urban Small Businesses Page 5
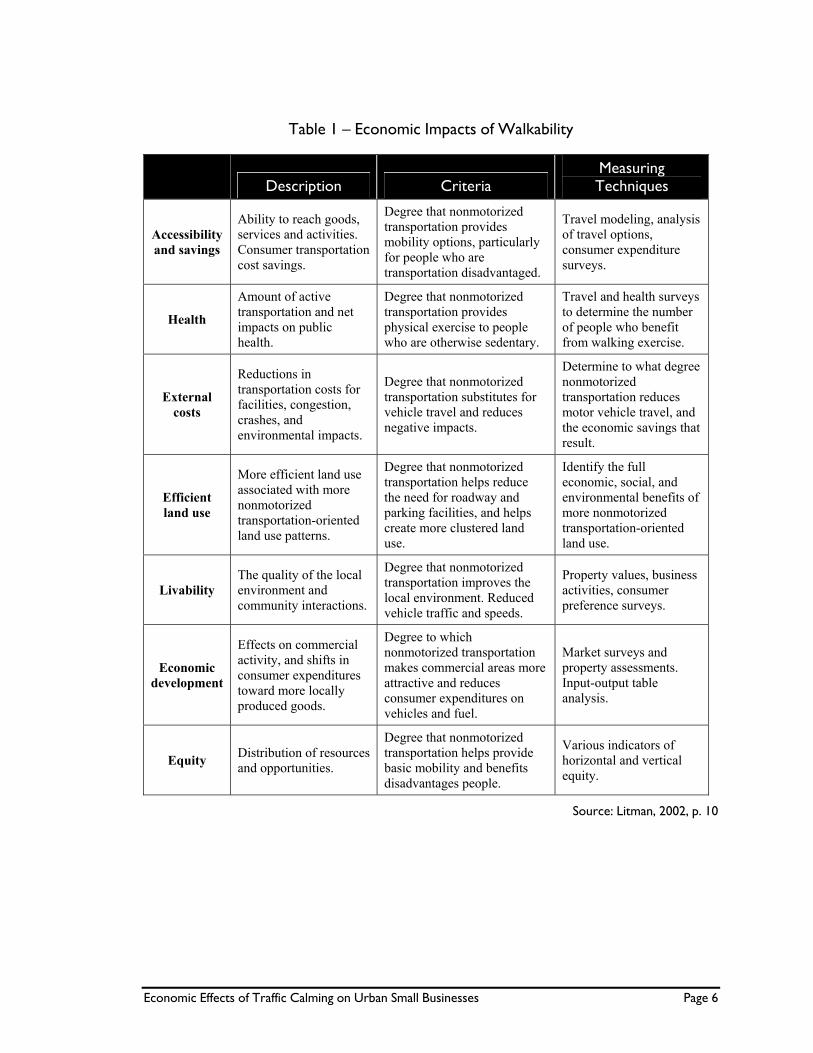
Economic Benefits of Traffic Calming Bringing traffic calming to an area can have many different impacts on travelers,
residents, businesses, and neighborhoods. Litman (2002, p. 10) summarized some of the
most significant effects of making a community more walkable in Table 1. In this paper, I
will focus on all of the factors in the left-most column of the chart except “Health” and
“Equity”. More specifically, I will focus my discussion on ways that traffic calming
measures can benefit urban retail businesses.
Economic Effects of Traffic Calming on Urban Small Businesses Page 6
Table 1 — Economic Impacts of Walkability
Description Criteria
Measuring Techniques
Accessibility and savings
Ability to reach goods, services and activities. Consumer transportation cost savings.
Degree that nonmotorized transportation provides mobility options, particularly for people who are transportation disadvantaged.
Travel modeling, analysis of travel options, consumer expenditure surveys.
Health
Amount of active transportation and net impacts on public health.
Degree that nonmotorized transportation provides physical exercise to people who are otherwise sedentary.
Travel and health surveys to determine the number of people who benefit from walking exercise.
External costs
Reductions in transportation costs for facilities, congestion, crashes, and environmental impacts.
Degree that nonmotorized transportation substitutes for vehicle travel and reduces negative impacts.
Determine to what degree nonmotorized transportation reduces motor vehicle travel, and the economic savings that result.
Efficient land use
More efficient land use associated with more nonmotorized transportation-oriented land use patterns.
Degree that nonmotorized transportation helps reduce the need for roadway and parking facilities, and helps create more clustered land use.
Identify the full economic, social, and environmental benefits of more nonmotorized transportation-oriented land use.
Livability The quality of the local environment and community interactions.
Degree that nonmotorized transportation improves the local environment. Reduced vehicle traffic and speeds.
Property values, business activities, consumer preference surveys.
Economic development
Effects on commercial activity, and shifts in consumer expenditures toward more locally produced goods.
Degree to which nonmotorized transportation makes commercial areas more attractive and reduces consumer expenditures on vehicles and fuel.
Market surveys and property assessments. Input-output table analysis.
Equity Distribution of resources and opportunities.
Degree that nonmotorized transportation helps provide basic mobility and benefits disadvantages people.
Various indicators of horizontal and vertical equity.
Source: Litman, 2002, p. 10
Economic Effects of Traffic Calming on Urban Small Businesses Page 7
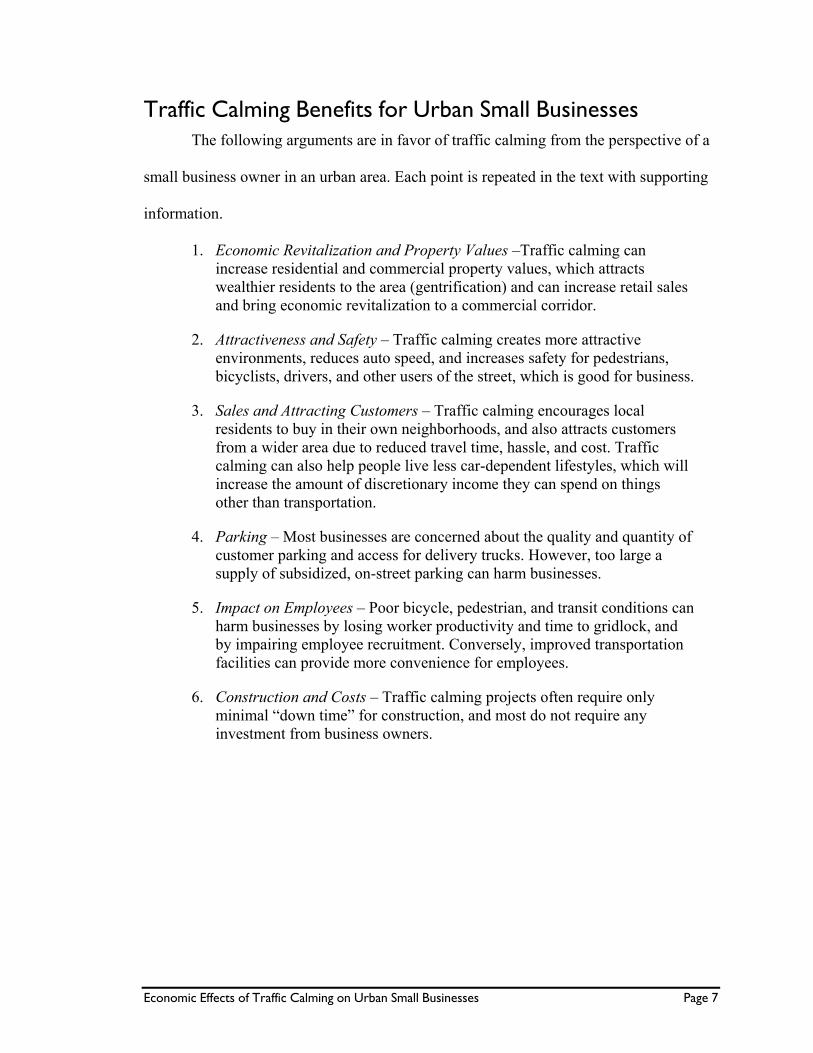
Traffic Calming Benefits for Urban Small Businesses The following arguments are in favor of traffic calming from the perspective of a
small business owner in an urban area. Each point is repeated in the text with supporting
information.
1. Economic Revitalization and Property Values –Traffic calming can increase residential and commercial property values, which attracts wealthier residents to the area (gentrification) and can increase retail sales and bring economic revitalization to a commercial corridor.
2. Attractiveness and Safety – Traffic calming creates more attractive environments, reduces auto speed, and increases safety for pedestrians, bicyclists, drivers, and other users of the street, which is good for business.
3. Sales and Attracting Customers – Traffic calming encourages local residents to buy in their own neighborhoods, and also attracts customers from a wider area due to reduced travel time, hassle, and cost. Traffic calming can also help people live less car-dependent lifestyles, which will increase the amount of discretionary income they can spend on things other than transportation.
4. Parking – Most businesses are concerned about the quality and quantity of customer parking and access for delivery trucks. However, too large a supply of subsidized, on-street parking can harm businesses.
5. Impact on Employees – Poor bicycle, pedestrian, and transit conditions can harm businesses by losing worker productivity and time to gridlock, and by impairing employee recruitment. Conversely, improved transportation facilities can provide more convenience for employees.
6. Construction and Costs – Traffic calming projects often require only minimal “down time” for construction, and most do not require any investment from business owners.
Economic Effects of Traffic Calming on Urban Small Businesses Page 8
Economic Revitalization and Property Values
Consumers prefer to live and shop
in areas that are pedestrian-friendly.
Households consider many things, including
population characteristics, housing costs,
and transportation costs, when choosing a
place to live (Sermons and Seredich, 2001).
In one study, homebuyers were willing to pay a $20,000 premium for homes in
pedestrian-friendly areas over areas that were not (Local Government Commission’s
Center for Livable Communities, 2000, p. 1). It also found that reduced vehicle traffic
could increase property values through improved walking safety and comfort.
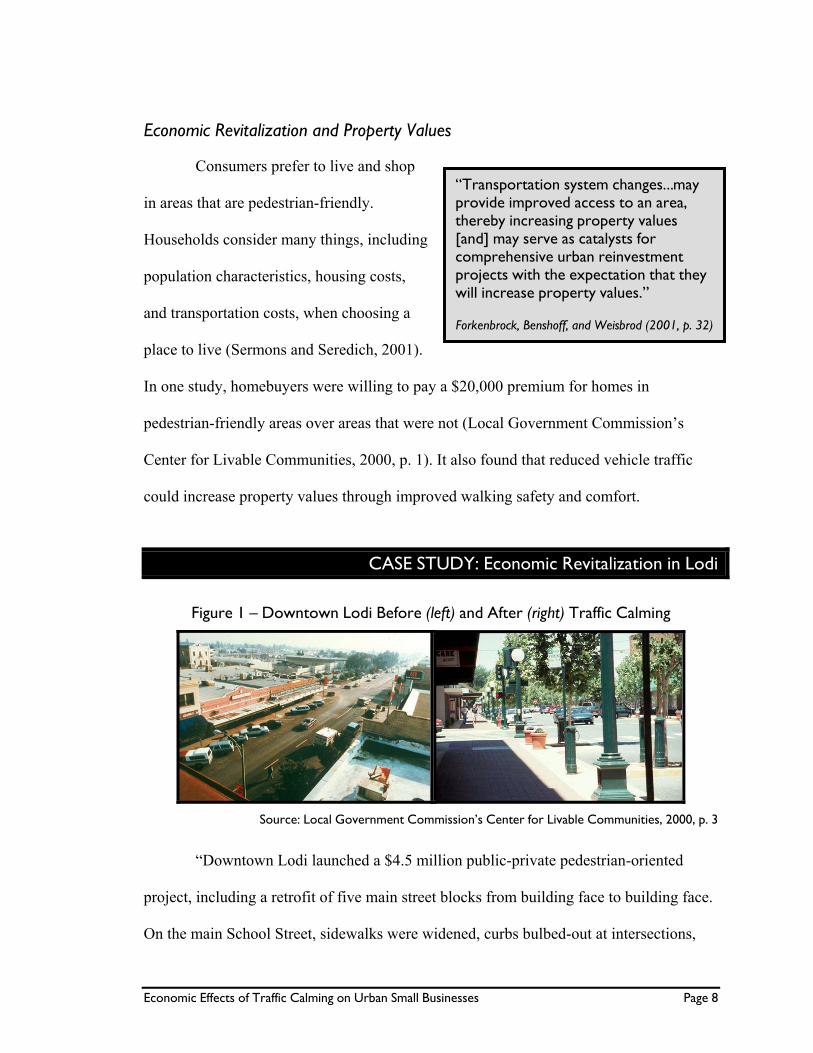
CASE STUDY: Economic Revitalization in Lodi
Figure 1 — Downtown Lodi Before (left) and After (right) Traffic Calming
Source: Local Government Commission’s Center for Livable Communities, 2000, p. 3
“Downtown Lodi launched a $4.5 million public-private pedestrian-oriented
project, including a retrofit of five main street blocks from building face to building face.
On the main School Street, sidewalks were widened, curbs bulbed-out at intersections,
“Transportation system changes…may provide improved access to an area, thereby increasing property values [and] may serve as catalysts for comprehensive urban reinvestment projects with the expectation that they will increase property values.”
Forkenbrock, Benshoff, and Weisbrod (2001, p. 32)
Economic Effects of Traffic Calming on Urban Small Businesses Page 9
and colored paving stones laid in the new sidewalks and street. A striking gateway was
installed, as well as 140 street trees, lighting, benches, and other streetscape amenities.
The city credits the pedestrian improvements, as well as economic development
incentives, with the 60 new businesses, the drop in the vacancy rate from 18% to 6%, and
the 30% increase in downtown sales tax revenues since work was completed in 1997”
(Local Government Commission’s Center for Livable Communities, 2000, p. 3).
Cities and regions can also benefit economically from becoming less auto-
dependent. The Local Government Commission’s Center for Livable Communities
(2000) also reported that a study of 46 international cities found that large cities with a
compact layout, good accessibility, and an efficient transportation infrastructure were
among the most productive of all urban settlements. They also found that real estate
values over the next 25 years will rise the most in communities that incorporate a mix of
residential and commercial districts and a pedestrian-friendly configuration. “One study
found that a 5 to 10 mph reduction in traffic speeds increased adjacent property values by
roughly 20%. Another study found that traffic restraints that reduced volumes on
residential streets by several hundred cars per day increased home values by an average
of 18%” (Local Government Commission’s Center for Livable Communities, 2000, p. 1).
Economic Effects of Traffic Calming on Urban Small Businesses Page 10
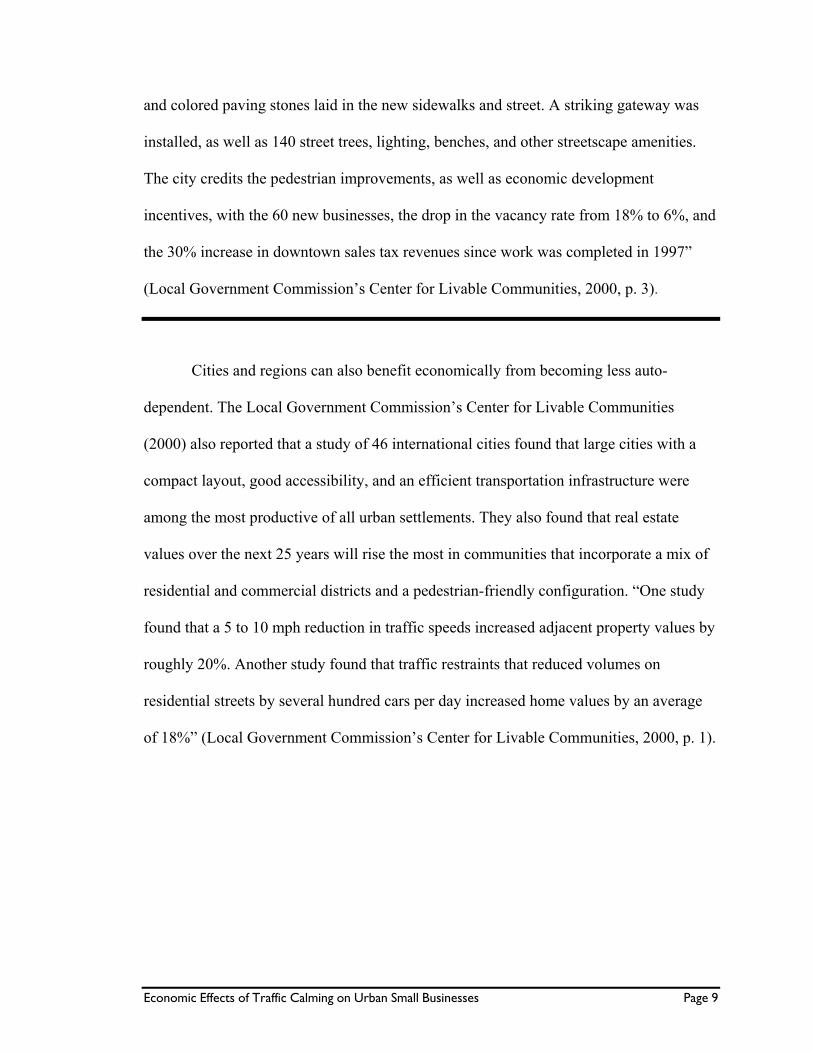
CASE STUDY: Traffic Calming In West Palm Beach
Figure 2 — West Palm Beach Before (left) and After (right) Traffic Calming
Source: Local Government Commission’s Center for Livable Communities, 2000, p. 4
The Local Government Commission’s Center for Livable Communities’ report
(2000, p. 4) also provides an interesting case study of how traffic calming efforts can
bring positive changes to a neighborhood beyond street changes. West Palm Beach
experienced increased neighborhood pride, private investment, and business in their
downtown as a result of their efforts. Motor vehicle users began to behave differently,
which helped create a better urban environment. “The city is thriving with an intensity
and energy that seems limitless,” said city transportation planner, Ian Lockwood. “It’s
about reducing speeds, and safety, but it’s really economic-development driven. It has
paid for itself, easily.”
Five years after beginning a major project, commercial vacancy rates in the area
decreased from 70% to 20%, while commercial rents rose from $6/sq. ft. to $30/sq. ft.
Property values increased from a range of $10-$40/sq. ft to $50-$100/sq. ft. The project
attracted approximately $350 million in private investment. All of this was achieved
while maintaining the same motor vehicle traffic volumes.
Economic Effects of Traffic Calming on Urban Small Businesses Page 11
Similarly, a study of California’s “Main Streets Program” (Eichenfeld and
Associates and the Local Government Commission, 2002) found that the average town
participating in the program saw:
Retail sales increase 105% Commercial property values increase 167% Storefront vacancy rates decline 76% Retail and office rental rates increase 65% and 71%, respectively $1 invested in the program yield $7.13 in public and private improvements 1
Traffic calming can bring increases in economic productivity, employment,
business activity, investment, and other kinds of economic development. Consumers
place a premium on high-quality pedestrian environments such as retail malls, suburban
office campuses, and pedestrian-oriented
resort communities. Retail and employment
centers, especially in urban areas, may
become more economically competitive if
walking conditions improve. Pedestrianized
commercial districts can be important for urban revitalization because they can help
create a lively and friendly environment that attracts residents and visitors (Litman, 2002).
Traffic calming measures can also directly benefit small businesses. For instance,
most traffic calming measures (such as café seating on sidewalks, widened sidewalks,
and trees planted near storefronts) can immediately make a storefront appear more
attractive to pedestrians/potential customers.
Community Cohesion and Vitality:
A pedestrian-friendly environment encourages and facilitates social
interaction and local economic vitality.
6th Principle of Toronto’s Pedestrian Charter Toronto City Council (2002)
Economic Effects of Traffic Calming on Urban Small Businesses Page 12
Attractiveness and Safety
Making the Street Attractive
Traffic calming can create a “sense of place” where there wasn’t a well-developed
sense of one before, which is vital for attracting new customers. The success of a
commercial corridor fundamentally depends on
its ability to be good for pedestrians. This can
be accomplished by making pedestrians feel
comfortable enough to shop, providing them
with interesting things to see, and doing things that will generate pedestrian activity.
Businesses should aim to have “people buy more, enjoy themselves, and return with their
friends” (Kohl, 1999, p. 1).
For better walking conditions and for attracting higher volumes of pedestrians in
commercial districts, sidewalk widths should be set between 8-12 feet. Large downtowns
require wider sidewalks to be successful (between 20-30 feet). The most successful
downtowns and the best pedestrian settings call for 50/50 ratio of street and sidewalk
width, including edge treatments (Burden, 2001). Additionally, Kohl (1999, pp. 1-2) has
identified the following to help generate and sustain pedestrian activity in a commercial
corridor:
Making pedestrians comfortable
Wide sidewalks – Sidewalks need to have enough room for friends to walk side by side. Shade and shelter – Shoppers need shelter from the summer sun and rain. Spatial enclosure – Buildings need to be near the sidewalk to create a
“sense of place.”
First fix the streets, then thepeople and business will follow.
Dan Burden Local Government Commission’s
Center for Livable Communities (2000, p. 1)
Economic Effects of Traffic Calming on Urban Small Businesses Page 13
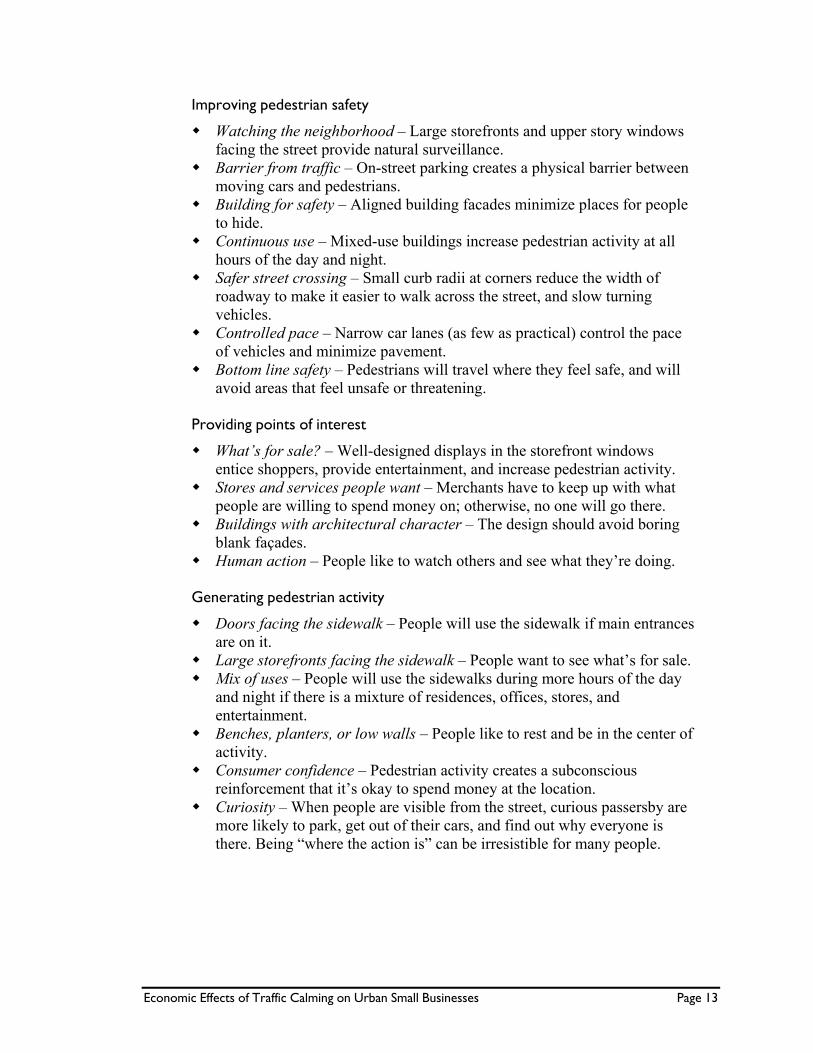
Improving pedestrian safety
Watching the neighborhood – Large storefronts and upper story windows facing the street provide natural surveillance. Barrier from traffic – On-street parking creates a physical barrier between
moving cars and pedestrians. Building for safety – Aligned building facades minimize places for people
to hide. Continuous use – Mixed-use buildings increase pedestrian activity at all
hours of the day and night. Safer street crossing – Small curb radii at corners reduce the width of
roadway to make it easier to walk across the street, and slow turning vehicles. Controlled pace – Narrow car lanes (as few as practical) control the pace
of vehicles and minimize pavement. Bottom line safety – Pedestrians will travel where they feel safe, and will
avoid areas that feel unsafe or threatening.
Providing points of interest
What’s for sale? – Well-designed displays in the storefront windows entice shoppers, provide entertainment, and increase pedestrian activity. Stores and services people want – Merchants have to keep up with what
people are willing to spend money on; otherwise, no one will go there. Buildings with architectural character – The design should avoid boring
blank façades. Human action – People like to watch others and see what they’re doing.
Generating pedestrian activity
Doors facing the sidewalk – People will use the sidewalk if main entrances are on it. Large storefronts facing the sidewalk – People want to see what’s for sale. Mix of uses – People will use the sidewalks during more hours of the day
and night if there is a mixture of residences, offices, stores, and entertainment. Benches, planters, or low walls – People like to rest and be in the center of
activity. Consumer confidence – Pedestrian activity creates a subconscious
reinforcement that it’s okay to spend money at the location. Curiosity – When people are visible from the street, curious passersby are
more likely to park, get out of their cars, and find out why everyone is there. Being “where the action is” can be irresistible for many people.
Economic Effects of Traffic Calming on Urban Small Businesses Page 14
Reducing Auto Speed
To ensure safety, to create an environment people find conducive to walking and
shopping, and to minimize noise, traffic volume should be maximized in retail areas,
while keeping average speeds around 18 mph, but below 19-25 mph (Tumlin, 2003;
Nozzi, 2002). Excessive traffic speeds can reduce quality of life and property values,
while increasing the number and severity of auto collisions with pedestrians and
bicyclists (Burden, 2001).
Ideally, Main Streets should be no more than one lane in each direction 2 and have
heavy (but continually moving) traffic. It is important to keep traffic moving because air
emissions are reduced as the number of automobile stops and starts are eliminated.
Another major reason to keep traffic moving is that motorists would rather move
continuously at a slow pace than be repeatedly stopped by traffic signals, stop signs, and
other delays. Measures to keep traffic moving can offset reductions in speed to achieve
the same overall trip times as before traffic was calmed.
Lowering traffic speeds can also solve some of the biggest traffic-related
problems around shopping centers, such as excess vehicle noise, speed, and congestion
(Nozzi, 2002). Retail businesses also need slower speeds so that drivers can see inside
storefronts and decide to pull over safely if they choose to go shopping.3 In an attempt to
help their retail areas thrive, the state of Western Australia has set both minimum and
maximum congestion level goals for retail commercial streets. In the end, it is a balancing
act to achieve the “right” speed, since either too much or too little speed can be
problematic. It is also vital that only traffic calming measures appropriate to retail areas
are used. (For instance, projects that install speed humps or displace traffic to parallel
streets would likely hurt local businesses.)
Economic Effects of Traffic Calming on Urban Small Businesses Page 15
Increasing Safety
Bicyclists and pedestrians also benefit from measures that keep motorists in
motion because they generally prefer lower auto speeds (Burden, 2001). Lowering travel
speed can reduce injuries 30-70% and greatly enhance walking, transit, bicycling, and
other modes of travel (Burden, 2001).
Sales and Attracting Customers
Having More Discretionary Income to Spend
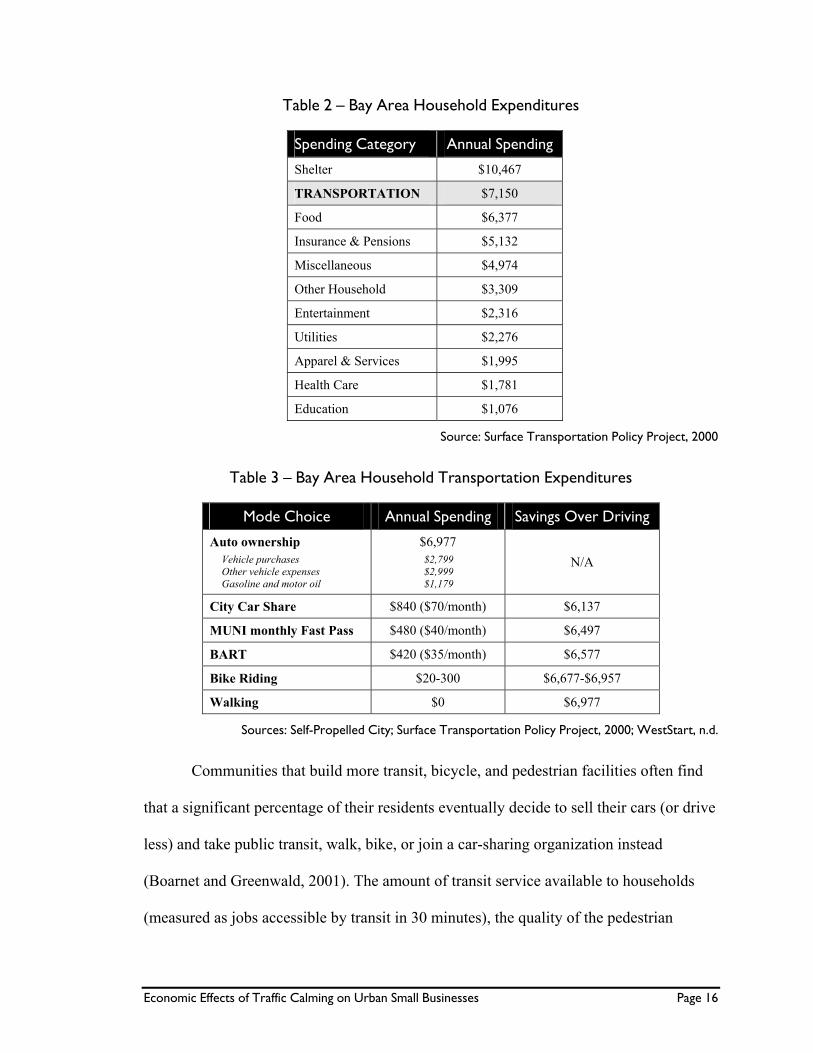
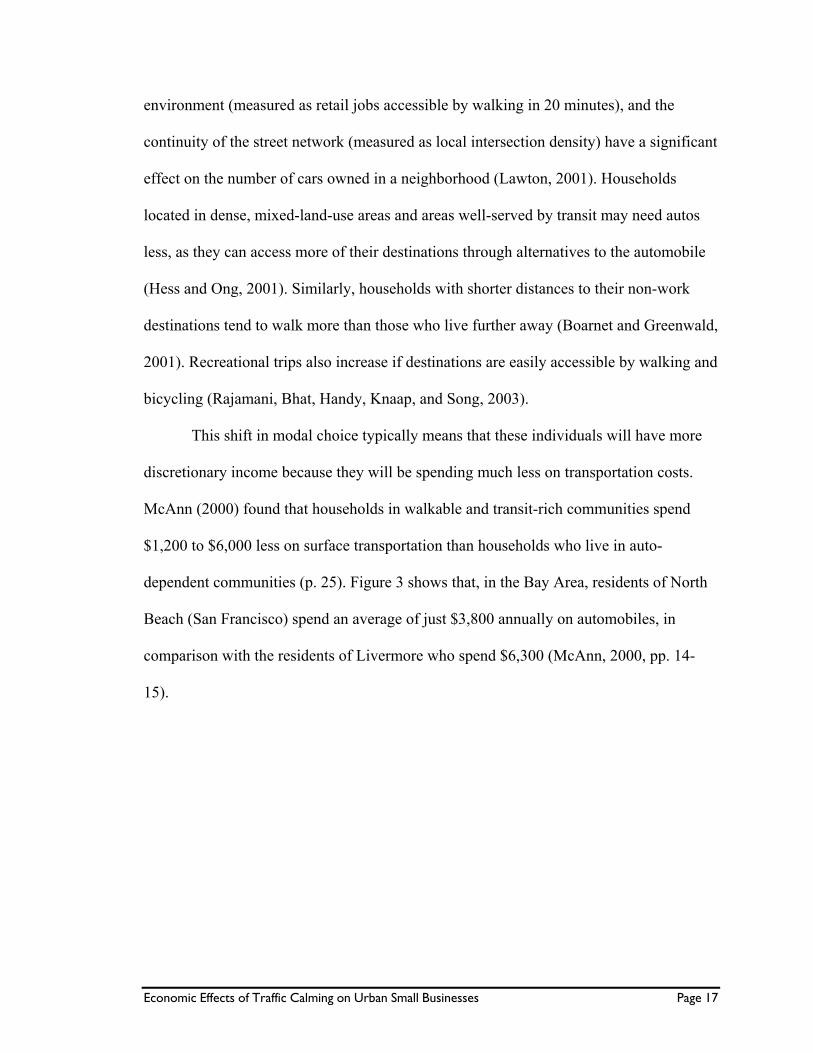
The Surface Transportation Policy Project’s (2000) report on average Bay Area
household expenditures, including transportation expenses, has been adapted into Table 2
and Table 3. They found that Bay Area residents spend more on transportation than on
any other expenditure category except shelter, amounting to $20 billion on transportation
expenditures each year. The average Bay Area resident annually spends between $6000
($500/month) and $6977 ($581.42/month) to own a car (Surface Transportation Policy
Project, 2000; WestStart, n.d). An adult MUNI Fast Pass costs $40/month, and the
average City Car Share bill is $70/month (WestStart, n.d.). In a year of riding MUNI and
using City Car Share, the Bay Area resident would save $4,680-$5,657 over owning a
car. The Self-Propelled City website reports that the typical cost for a commuter to own
and operate a bicycle in the U.S. is $20-$300/year. A Bay Area bike commuter could
save between $6677-$6957 per year over owning a car.
Economic Effects of Traffic Calming on Urban Small Businesses Page 16
Table 2 — Bay Area Household Expenditures
Spending Category Annual Spending
Shelter $10,467
TRANSPORTATION $7,150
Food $6,377
Insurance & Pensions $5,132
Miscellaneous $4,974
Other Household $3,309
Entertainment $2,316
Utilities $2,276
Apparel & Services $1,995
Health Care $1,781
Education $1,076
Source: Surface Transportation Policy Project, 2000
Table 3 — Bay Area Household Transportation Expenditures
Mode Choice Annual Spending Savings Over Driving
Auto ownership Vehicle purchases Other vehicle expenses Gasoline and motor oil
$6,977 $2,799 $2,999 $1,179
N/A
City Car Share $840 ($70/month) $6,137
MUNI monthly Fast Pass $480 ($40/month) $6,497
BART $420 ($35/month) $6,577
Bike Riding $20-300 $6,677-$6,957
Walking $0 $6,977
Sources: Self-Propelled City; Surface Transportation Policy Project, 2000; WestStart, n.d.
Communities that build more transit, bicycle, and pedestrian facilities often find
that a significant percentage of their residents eventually decide to sell their cars (or drive
less) and take public transit, walk, bike, or join a car-sharing organization instead
(Boarnet and Greenwald, 2001). The amount of transit service available to households
(measured as jobs accessible by transit in 30 minutes), the quality of the pedestrian
Economic Effects of Traffic Calming on Urban Small Businesses Page 17
environment (measured as retail jobs accessible by walking in 20 minutes), and the
continuity of the street network (measured as local intersection density) have a significant
effect on the number of cars owned in a neighborhood (Lawton, 2001). Households
located in dense, mixed-land-use areas and areas well-served by transit may need autos
less, as they can access more of their destinations through alternatives to the automobile
(Hess and Ong, 2001). Similarly, households with shorter distances to their non-work
destinations tend to walk more than those who live further away (Boarnet and Greenwald,
2001). Recreational trips also increase if destinations are easily accessible by walking and
bicycling (Rajamani, Bhat, Handy, Knaap, and Song, 2003).
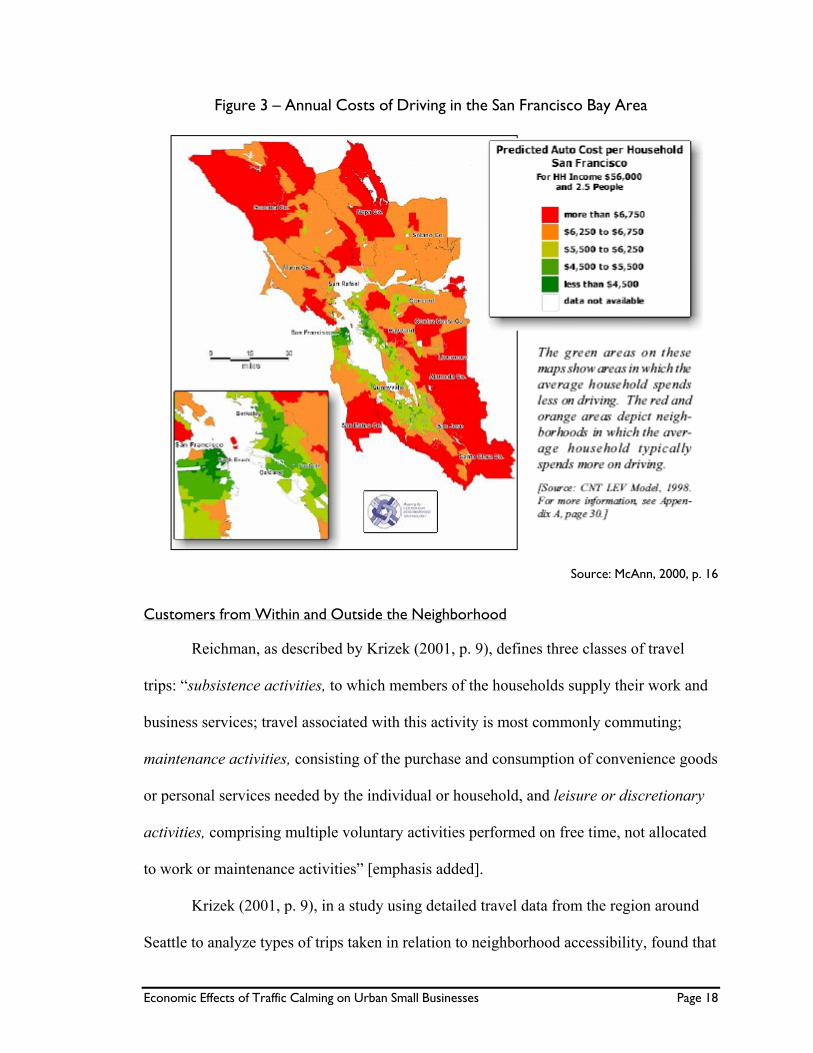
This shift in modal choice typically means that these individuals will have more
discretionary income because they will be spending much less on transportation costs.
McAnn (2000) found that households in walkable and transit-rich communities spend
$1,200 to $6,000 less on surface transportation than households who live in auto-
dependent communities (p. 25). Figure 3 shows that, in the Bay Area, residents of North
Beach (San Francisco) spend an average of just $3,800 annually on automobiles, in
comparison with the residents of Livermore who spend $6,300 (McAnn, 2000, pp. 14-
15).
Economic Effects of Traffic Calming on Urban Small Businesses Page 18
Figure 3 — Annual Costs of Driving in the San Francisco Bay Area
Source: McAnn, 2000, p. 16
Customers from Within and Outside the Neighborhood
Reichman, as described by Krizek (2001, p. 9), defines three classes of travel
trips: “subsistence activities, to which members of the households supply their work and
business services; travel associated with this activity is most commonly commuting;
maintenance activities, consisting of the purchase and consumption of convenience goods
or personal services needed by the individual or household, and leisure or discretionary
activities, comprising multiple voluntary activities performed on free time, not allocated
to work or maintenance activities” [emphasis added].
Krizek (2001, p. 9), in a study using detailed travel data from the region around
Seattle to analyze types of trips taken in relation to neighborhood accessibility, found that
Economic Effects of Traffic Calming on Urban Small Businesses Page 19
households that lived in neighborhoods with better walking, biking, and transit conditions
tended to take the highest number of subsistence trips and maintenance trips. They also
traveled shorter distances for their maintenance-type errands. Those in the very most
accessible neighborhoods (top decile) visited maintenance services available within
3.2 km of home for 20% of their maintenance trips. This is in contrast to those in
neighborhoods with less accessibility (lower half), for who only 1.7 % of their
maintenance services were close to home (Krizek, 2001, p. 17). Boarnet and Sarmiento
(1996) also found that people partly choose their residential locations based on their
desired travel behavior. This can be interpreted to mean that a significant percentage of
residents who live in an urban core would be at least receptive, if not supportive, of
traffic calming measures.
Lawton (2001, p. 203), by analyzing the data from a survey about household
activity and travel administered in the Portland metropolitan area in the mid-1990s, found
that people in denser, inner-city, mixed-use areas drove significantly fewer miles by
substituting slower modes such as walking, bicycling, and transit. Since the streets that
serve these inner city dwellers tend to prioritize these slower modes of transportation,
they have some congestion so that car mobility (expressed as speed) is sharply reduced.
However, people were found to spend about the same amount of time traveling as those
in less dense areas (Lawton, 2001).
As part of this study, Lawton (2001) developed the Urban Index, which is “a
combination index using the number of retail jobs within a mile of the household
combined with the number of local street intersections within [part of] a mile” (p. 208).
Economic Effects of Traffic Calming on Urban Small Businesses Page 20
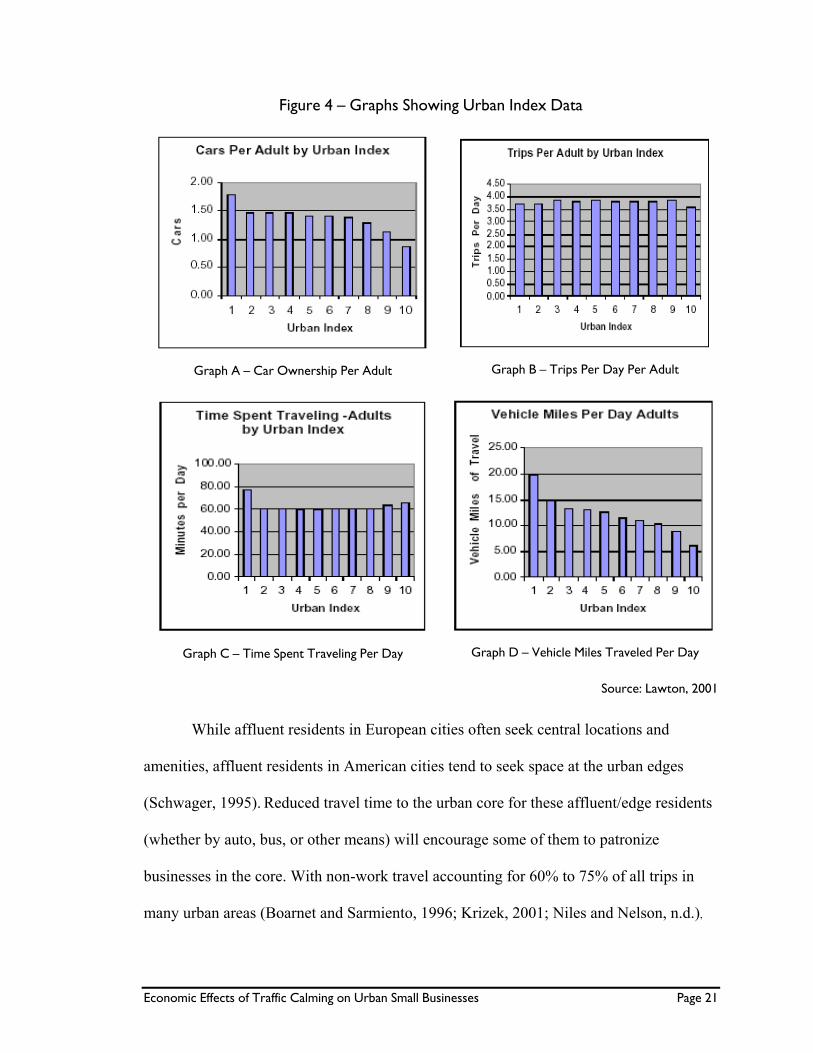
Higher Urban Index scores indicate areas that are more urbanized. Figure 4, developed by
Lawton (2001), displays several variables in relation to the Urban Index:
Graph A (p. 214) shows that car ownership falls in more urbanized areas.
Graph B (p. 217) shows the average number of trips made by an adult each day. Adults in urban areas with cars and without cars make approximately the same number of trips.
Graph C (p. 225) shows that the average amount of time adults spent traveling per day was more or less constant from areas with low levels of urbanization to those with high urbanization.
Graph D (p. 218) shows the average Vehicle Miles Traveled (VMT) per adult each day. The number of miles traveled declines in more urbanized areas. Because the number of trips and the time spent traveling is the same across areas, but the number of miles traveled falls in more urbanized areas, one can surmise that people in more urbanized areas are making more of their trips in their local areas.
Economic Effects of Traffic Calming on Urban Small Businesses Page 21
Figure 4 — Graphs Showing Urban Index Data
Graph A — Car Ownership Per Adult
Graph B — Trips Per Day Per Adult
Graph C — Time Spent Traveling Per Day
Graph D — Vehicle Miles Traveled Per Day
Source: Lawton, 2001
While affluent residents in European cities often seek central locations and
amenities, affluent residents in American cities tend to seek space at the urban edges
(Schwager, 1995). Reduced travel time to the urban core for these affluent/edge residents
(whether by auto, bus, or other means) will encourage some of them to patronize
businesses in the core. With non-work travel accounting for 60% to 75% of all trips in
many urban areas (Boarnet and Sarmiento, 1996; Krizek, 2001; Niles and Nelson, n.d.),
Economic Effects of Traffic Calming on Urban Small Businesses Page 22
businesses have an incentive to make their area more pedestrian-friendly, thereby
attracting a larger portion of these trips (Krizek, 2001; Niles and Hibshoosh , 2001; Niles
and Nelson, n.d.).
CASE STUDY: Walkability as a Tourist Magnet
“Tourists coming to Vermont to walk and bicycle in the scenic, human-scale
towns and compact, pedestrian-friendly town centers have proved to be an economic boon.
In 1992, an estimated 32,500 visiting cyclists spent $13.1 million in Vermont – about
twice the amount of money generated by Vermont’s maple syrup producers in a good
year” (Local Government Commission’s Center for Livable Communities, 2000, p. 2).
Parking
Parking spaces that are provided at no-cost (subsidized) are often an inefficient
use of street space. With parallel parking, very few cars can use this amenity over a
period of time, especially if controls are not introduced to limit the amount of time cars
can be parked at that location.
When many more people wish to park in an area than they currently can, the
situation is often made much worse by efforts to build additional subsidized parking. This
is because demand for this extra parking often rises faster than it can be supplied. Parking
expansion programs often lead to an even greater mismatch between the demand for
parking and the amount of available parking (“If you build it, they will come to park…”).
It can also create “spill-over” parking, which can cause strife between businesses and
institutions and nearby neighborhoods over the extra parkers on residential lots and
streets (Merriman, 1997).
Economic Effects of Traffic Calming on Urban Small Businesses Page 23
While meters can dissuade potential customers from driving to a location, they
can also be a boon for merchants. Meters help get the most efficient use of the parking
space by discouraging long-term parking and perhaps reducing the number of spill-over
parkers because they lower the potential benefit from finding a subsidized space
(Merriman, 1997). This helps merchants because an efficiently used parking space is
short-term and has high turn-over, which means that more of the merchants’ customers
can use this resource. Merriman (1997) also found that, to ensure even greater efficiency,
owners should instruct their employees to park a few blocks away so that customers can
freely access “prime” parking spaces (either subsidized or metered).
Parking can be an effective tool for traffic calming, if it is implemented
appropriately and with sensitivity to the urban environment. It can serve as a physical
buffer between the sidewalk and the street, which provides a sense of physical safety for
pedestrians. Short-term parking can also create a sense of liveliness to an area that is
attractive to pedestrians. It is vital to provide a safe and attractive pedestrian environment
not only for those who came to an area by bus, walking, or bike, but also those who drove
there, because they become pedestrians once they step out of their cars.
A system-wide perspective reveals that retail businesses may experience an
indirect negative impact by providing subsidized parking for their customers. As
mentioned above, residents who do not own a car have more discretionary income that
could be spent at local shops. By helping to wean people off dependency on their cars for
every trip, a commercial corridor might benefit from increased sales due to this mode
shift. Nozzi (2002, para. 19) writes, “Free parking that ‘leverages’ car commuting may
benefit car dealers, mechanics, and gas stations, but it disadvantages the bus system,
Economic Effects of Traffic Calming on Urban Small Businesses Page 24
bicycle shops, and other businesses where consumers spend money they save from less
expensive transportation: housing contractors, restaurants, clothing stores, etc.”
Impact on Employees
Employees who have to battle their way through congestion every day are less
productive and more likely to change jobs than those who have an easy commute.
Nationally, the average American spent 443 hours behind the wheel of a car, or 55 eight-
hour workdays. In a 1999 study of 68 cities, it was estimated that the total congestion
“bill” for those areas came to $78 billion, which was the value of 4.5 billion hours of
delay and 6.8 billion gallons of excess fuel consumed (Missouri Department of Economic
Development, n.d.).
In California, the Department of Transportation has estimated that more than
197,000 worker hours are lost each day due to traffic congestion (with a value of $2
million per day). San Francisco’s Bay Area Economic Forum estimates losses to area
businesses while their employees are stuck in traffic at $2 billion per year (Local
Government Commission’s Center for Livable Communities, 2000, p. 2). Overall, areas
with good accessibility between jobs and housing, well-functioning transportation
systems, and large numbers of nearby employable residents appear to have some
economic advantages over other areas (Cervero, 2000).
Somewhat paradoxically, it has also been found that cities and regions with the
worst freeway congestion can be the best economic performers. This is likely because
freeway congestion is a product of economically active and vibrant cities. Internationally,
a study on 46 world cities has shown that the gross regional product per capita was
generally higher in cities that were less auto-dependent (Cervero, 2000).
Economic Effects of Traffic Calming on Urban Small Businesses Page 25
This conclusion, coupled with the congestion statistics above, may lead to the
finding that cities with better public transportation (cities that are less auto-dependent)
fare better economically than those who experience chronic auto congestion (Cervero,
2000). Collaborative Economics, as reported by Local Government Commission’s Center
for Livable Communities (2000), found that cities and towns with walkable downtowns
that have a mix of restaurants, offices, and housing compete better in the “new economy”
(which is knowledge-driven and service-oriented). This is likely the case because
walkable downtowns promote
interaction, which is key to an economy
that thrives on accessibility, networking,
and creativity (Local Government
Commission’s Center for Livable
Communities, 2000, p. 2).
Locally, a 1990 Bay Area study found San Francisco’s downtown to have some of
the highest worker productivity levels in the region (Cervero, 2000). The factor with the
largest influence on labor productivity was average commute speed, with an elasticity of
around 0.10. This means that for every 10% increase in commuting speed, there was a
1% increase in worker output (Cervero, 2000). It is possible that San Francisco’s
comprehensive public transportation system contributes to the high level of productivity.
In addition to lost productivity, businesses in areas that are not well-served by
transit may find it harder to recruit skilled workers. Employees are increasingly seeking
to live in areas with transportation options and affordable housing close to the workplace.
The Missouri Department of Economic Development (n.d.) found that businesses benefit
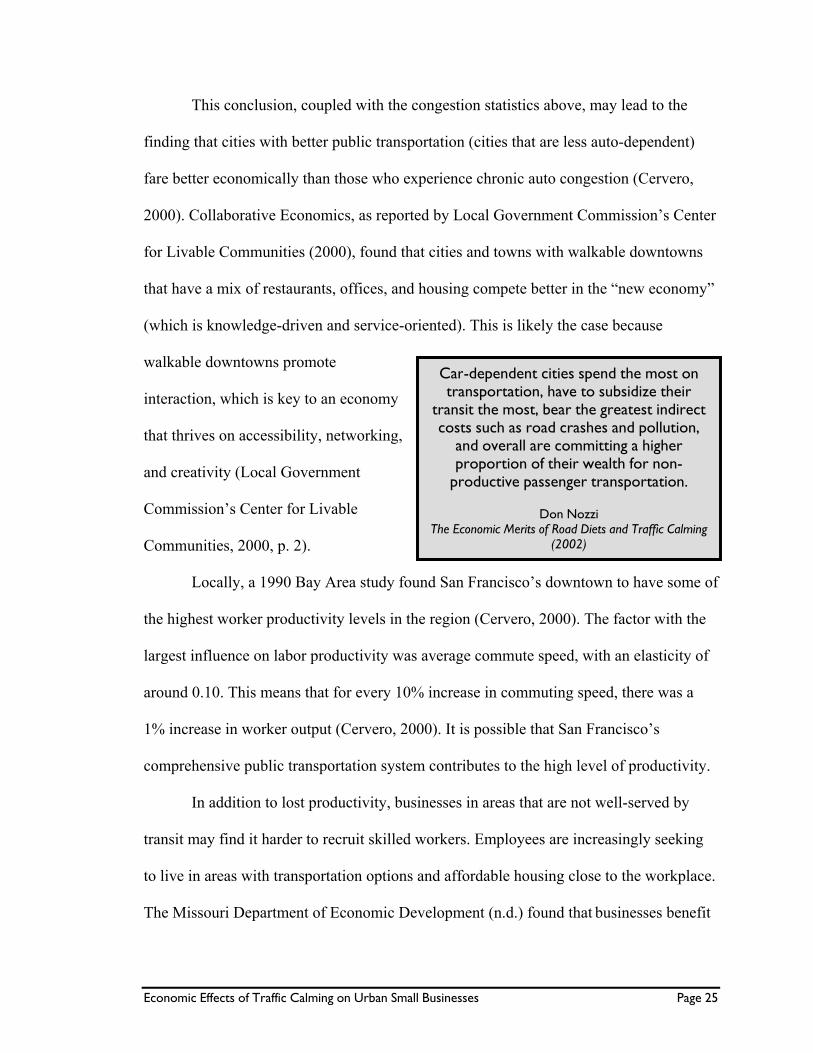
Car-dependent cities spend the most on transportation, have to subsidize their
transit the most, bear the greatest indirect costs such as road crashes and pollution,
and overall are committing a higher proportion of their wealth for non-
productive passenger transportation.
Don Nozzi The Economic Merits of Road Diets and Traffic Calming
(2002)
Economic Effects of Traffic Calming on Urban Small Businesses Page 26
when the public sector provides these amenities. However, Nozzi (2002, para. 5) reports
that businesses located in car-dependent areas bear greater overhead costs, such as having
to pay additional road taxes, increased costs for parking, and larger salaries to their
employees to meet the high cost of living. Litman, as reported by Nozzi (2002, para. 34),
wrote, “In general, policies and programs that reduce transportation costs increase
economic competitiveness and development...It represents a significant portion of total
costs in many resource-based industries, and so a modest change in transportation costs
can have a major impact on profitability.”
Construction and Costs
Construction
Traffic calming projects tend to be relatively easy and fast to construct (compared
to the undergrounding of power lines, for example). Projects can be completed within a
matter of days to weeks, depending on the intensity and complexity of the project, which
means that impacts on retail sales is generally minimal. This also means that these
projects can begin accruing benefits quickly (Lockwood and Stillings, 1998). However,
most of the research on the impacts of roadway construction focuses on traffic diversion
or road closures, rather than on how construction impacts neighborhoods or business
viability (Forkenbrock, Benshoff, and Weisbrod, 2001).
Costs
A city’s transportation department generally spearheads traffic calming efforts,
which are either paid for through government grants or through the city’s general fund. In
San Francisco, the “Livable Streets” division of the Department of Parking and Traffic’s
Economic Effects of Traffic Calming on Urban Small Businesses Page 27
has a FY 2004 budget of $2,200,000 (San Francisco Department of Parking and Traffic
FY 2004 Budget, 2003). They are responsible for providing traffic calming services to
the city. Projects that they coordinate require no investment by local businesses or
residents; however, private investments are often made into an area during or after a
project. San Francisco small businesses can also self-initiate traffic calming on their
streets, by participating in a low-cost tree planting program through Friends of the Urban
Forest, by requesting a free bicycle rack to be installed on the sidewalk in front of their
buildings, or by submitting an application for specific traffic calming projects.4
Economic Effects of Traffic Calming on Urban Small Businesses Page 28
Background/Methodology of the Valencia Street Bike Lane Merchant Survey
The Valencia Street bicycle lanes project provides a good example of how San
Francisco has implemented neighborhood traffic calming. The Valencia Street Bike Lane
Merchant Survey was used to ask merchants how the bike lanes have impacted their
businesses. The methodology and results from this survey are discussed, following brief
overviews of neighborhood demographics and the bike lane project.
Valencia Street Bike Lane Project Background
Neighborhood Demographics
Valencia Street is located in the Mission District, which, according to the Mission
Economic Development Association (MEDA), is San Francisco’s oldest neighborhood.
Currently, it is a primarily low-income, working-class, and immigrant neighborhood that
has a combination of residential, mixed-use, and commercial zoning. MEDA (1999)
compiled the following demographic statistics on the Mission District:
Population of 60,583 people 30,355 people per square mile 36% of annual household incomes are less than $25,000 83.9% of households are renters
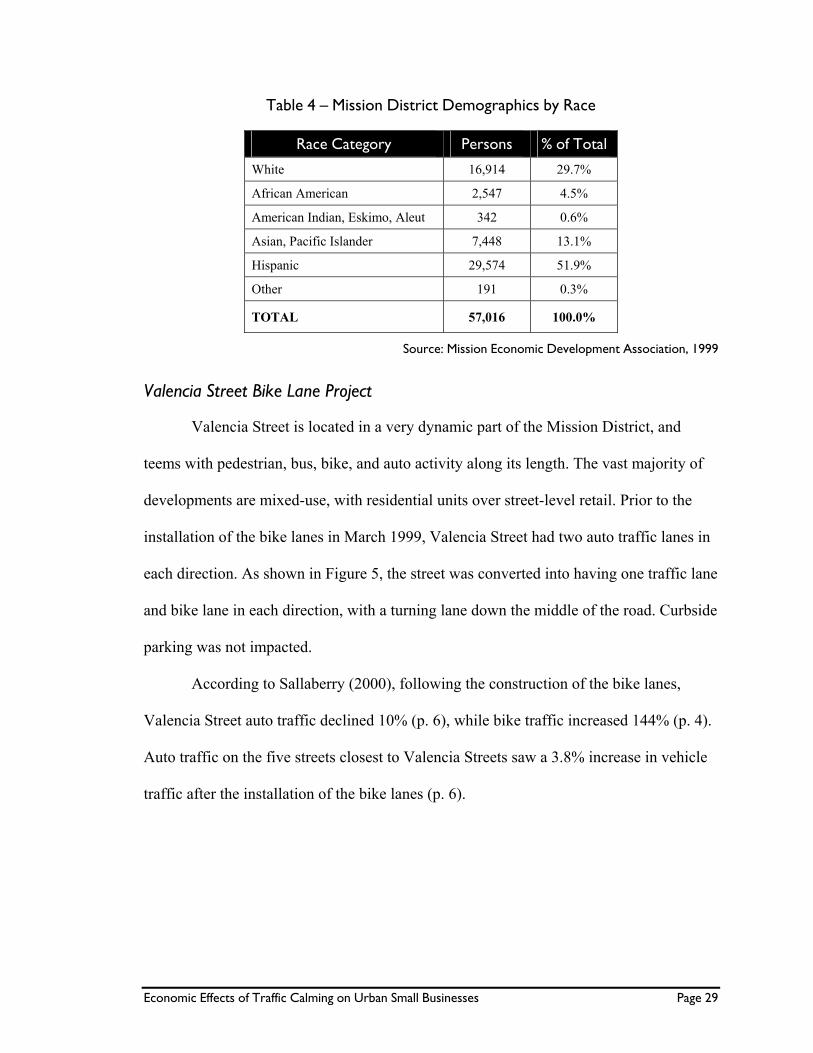
Table 4 shows the demographics of the Mission District by race, based on 1990 U.S.
Census data (MEDA, 1999).
Economic Effects of Traffic Calming on Urban Small Businesses Page 29
Table 4 — Mission District Demographics by Race
Race Category Persons % of Total
White 16,914 29.7%
African American 2,547 4.5%
American Indian, Eskimo, Aleut 342 0.6%
Asian, Pacific Islander 7,448 13.1%
Hispanic 29,574 51.9%
Other 191 0.3%
TOTAL 57,016 100.0%
Source: Mission Economic Development Association, 1999
Valencia Street Bike Lane Project
Valencia Street is located in a very dynamic part of the Mission District, and
teems with pedestrian, bus, bike, and auto activity along its length. The vast majority of
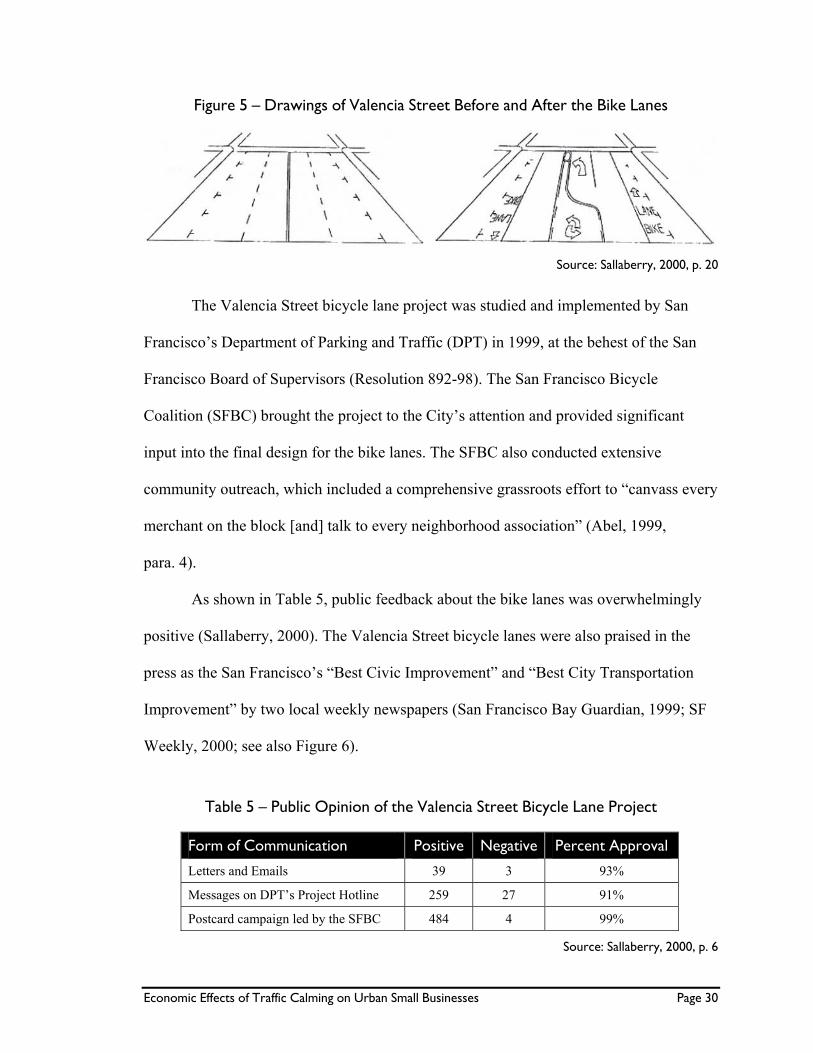
developments are mixed-use, with residential units over street-level retail. Prior to the
installation of the bike lanes in March 1999, Valencia Street had two auto traffic lanes in
each direction. As shown in Figure 5, the street was converted into having one traffic lane
and bike lane in each direction, with a turning lane down the middle of the road. Curbside
parking was not impacted.
According to Sallaberry (2000), following the construction of the bike lanes,
Valencia Street auto traffic declined 10% (p. 6), while bike traffic increased 144% (p. 4).
Auto traffic on the five streets closest to Valencia Streets saw a 3.8% increase in vehicle
traffic after the installation of the bike lanes (p. 6).
Economic Effects of Traffic Calming on Urban Small Businesses Page 30
Figure 5 — Drawings of Valencia Street Before and After the Bike Lanes
Source: Sallaberry, 2000, p. 20
The Valencia Street bicycle lane project was studied and implemented by San
Francisco’s Department of Parking and Traffic (DPT) in 1999, at the behest of the San
Francisco Board of Supervisors (Resolution 892-98). The San Francisco Bicycle
Coalition (SFBC) brought the project to the City’s attention and provided significant
input into the final design for the bike lanes. The SFBC also conducted extensive
community outreach, which included a comprehensive grassroots effort to “canvass every
merchant on the block [and] talk to every neighborhood association” (Abel, 1999,
para. 4).
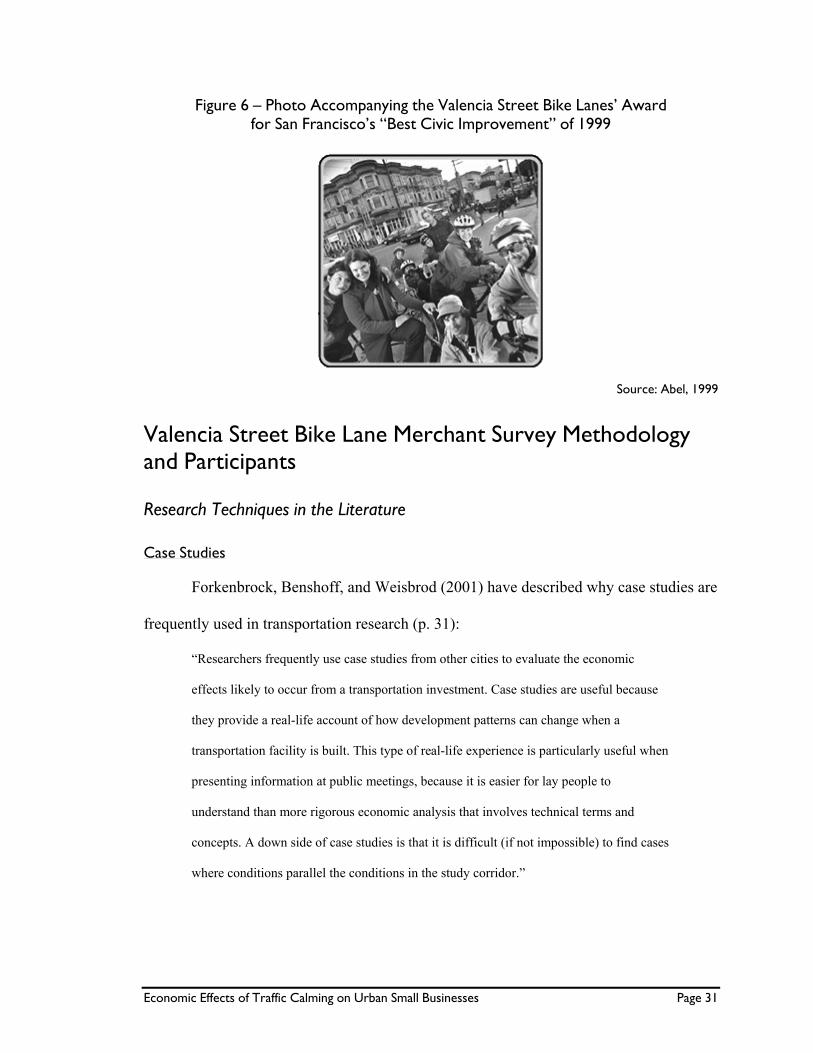
As shown in Table 5, public feedback about the bike lanes was overwhelmingly
positive (Sallaberry, 2000). The Valencia Street bicycle lanes were also praised in the
press as the San Francisco’s “Best Civic Improvement” and “Best City Transportation
Improvement” by two local weekly newspapers (San Francisco Bay Guardian, 1999; SF
Weekly, 2000; see also Figure 6).
Table 5 — Public Opinion of the Valencia Street Bicycle Lane Project
Form of Communication Positive Negative Percent Approval
Letters and Emails 39 3 93%
Messages on DPT’s Project Hotline 259 27 91%
Postcard campaign led by the SFBC 484 4 99%
Source: Sallaberry, 2000, p. 6
Economic Effects of Traffic Calming on Urban Small Businesses Page 31
Figure 6 — Photo Accompanying the Valencia Street Bike Lanes’ Award for San Francisco’s “Best Civic Improvement” of 1999
Source: Abel, 1999
Valencia Street Bike Lane Merchant Survey Methodology and Participants
Research Techniques in the Literature
Case Studies
Forkenbrock, Benshoff, and Weisbrod (2001) have described why case studies are
frequently used in transportation research (p. 31):
“Researchers frequently use case studies from other cities to evaluate the economic
effects likely to occur from a transportation investment. Case studies are useful because
they provide a real-life account of how development patterns can change when a
transportation facility is built. This type of real-life experience is particularly useful when
presenting information at public meetings, because it is easier for lay people to
understand than more rigorous economic analysis that involves technical terms and
concepts. A down side of case studies is that it is difficult (if not impossible) to find cases
where conditions parallel the conditions in the study corridor.”
Economic Effects of Traffic Calming on Urban Small Businesses Page 32
The Valencia Street Bike Lane Merchant Survey case study will be primarily used
for traffic calming education and outreach within San Francisco, so the concern that case
studies have only limited applicability to other locales is not relevant in this instance.
Business Interviews
Economic techniques such as input-output tables, hedonic pricing, and
cost/benefit analyses can be used to determine how traffic calming measures impact
consumer and business activity in a given area (Forkenbrock, Benshoff, and Weisbrod,
2001; Litman, 2002; Local Government Commission’s Center for Livable Communities,
2000). The degree to which traffic calming projects can create economic development
can be measured through market surveys, data on employment and new jobs creation,
property assessments, measures of commercial activity (such as retail sales or sales tax
revenues), consumer satisfaction, average rents and property values for commercial and
residential properties, vacancy rates for commercial structures, competitiveness, number
of new businesses in area, and public and private reinvestment in the area, including
returns on investment (Eichenfeld and Associates and the Local Government
Commission, 2002).
However, Forkenbrock, Benshoff, and Weisbrod (2001) report that not all of these
tools may be appropriate for studying smaller projects (such as the Valencia Street
bicycle lanes). “Most common economic development-related analyses attempt to
estimate the types and magnitudes of changes in employment, income, property values,
and business activity by sector resulting from reduced transportation costs…[but] such
models are not workable for analyzing the effects of comparatively small projects”
Economic Effects of Traffic Calming on Urban Small Businesses Page 33
(p. 39). Instead, business interviews may be a more useful approach for studying these
types of projects.
Business interviews have been widely used in transportation studies. In a study of
51 state Departments of Transportation (DOTs) and of 63 Metropolitan Planning
Organizations (MPOs) and Regional Planning Agencies (RPAs), Forkenbrock, Benshoff,
and Weisbrod (2001, p. 95) found that business interviews were “frequently” used by
25% of DOTs, but only by 6% of MPOs/RPAs. However, 22% percent of DOTs and 24%
of MPOs/RPAs reported “occasional” use of this technique.
The Valencia Street Bike Lane Merchant Survey uses business interviews to
gather qualitative information about the effects of the Valencia Street bicycle lanes on
small businesses in the area. The business interview methodology used in this study
closely mirrors the model described by Forkenbrock, Benshoff, and Weisbrod (2001,
p. 29), which uses qualitative data to measure impacts on businesses from transportation
changes in a corridor. This study’s methodology also incorporates many of the elements
used by De Solminihac and Harrison to quantify the economic impact of the construction
of a highway rehabilitation project on businesses (Forkenbrock, Benshoff, and Weisbrod,
2001). The De Solminihac and Harrison research team first canvassed and categorized
each business located along the study corridor, and then randomly selected more than
20% of the businesses in each retail category for participation in a comprehensive
business survey. Questions they asked included, “how long the business had been at the
location, whether they rented or owned, how they were notified about the
construction,…[if the project had any] effect on sales, other internal or external factors
that could affect business activities, effect on employees, efforts of the Texas Department
Economic Effects of Traffic Calming on Urban Small Businesses Page 34
of Transportation to ease adverse effects, and business strategies for mitigating these
effects” (Forkenbrock, Benshoff, and Weisbrod, 2001, p. 37).
Methodology for the Valencia Street Bike Lane Merchant Survey
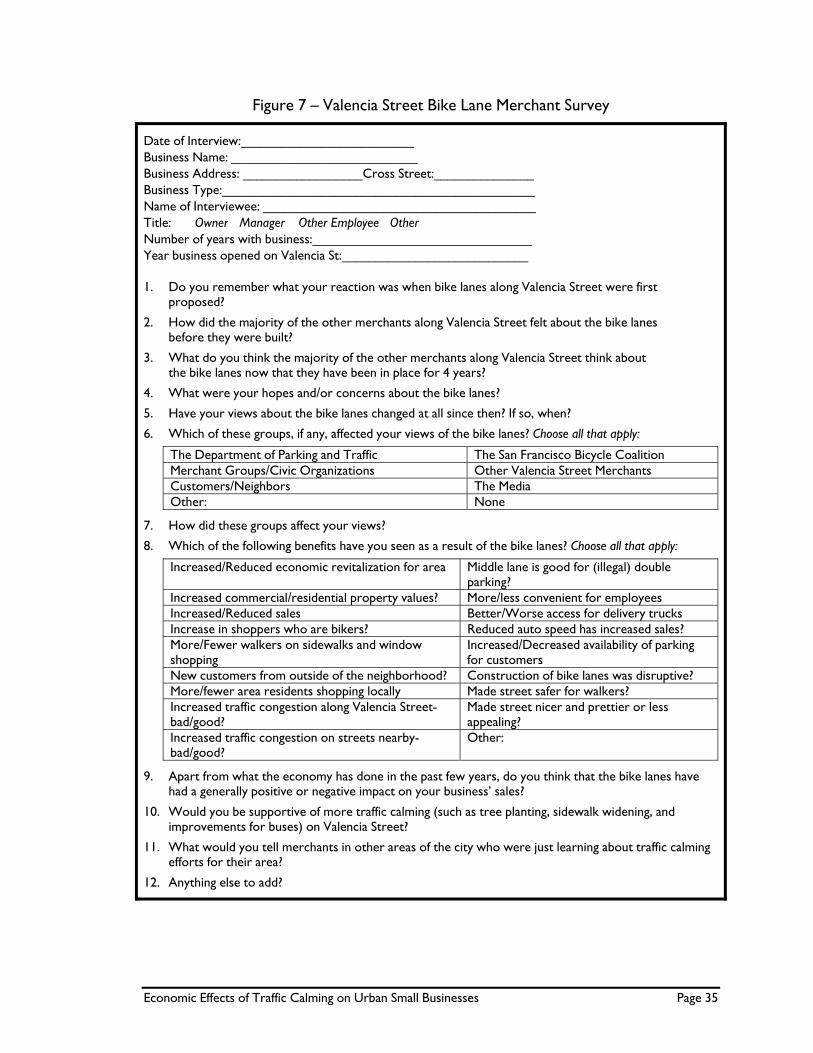
This project involved administering an in-person survey instrument (Figure 7) to
gather information from small businesses in the service, food, or retail sectors which
were located in the study area (Figure 8). Residential, office, industrial, and other
commercial establishments were excluded from this study. An on-street census of the
project area found a total of 122 eligible businesses, of which 27 were interviewed
(22.1%) as part of this study. The merchants were selected through a modified random
process 5 based on planning blocks assigned by the San Francisco Planning Department.
Economic Effects of Traffic Calming on Urban Small Businesses Page 35
Figure 7 — Valencia Street Bike Lane Merchant Survey
Date of Interview:__________________________ Business Name: ____________________________ Business Address: __________________Cross Street:_______________ Business Type:_______________________________________________ Name of Interviewee: _________________________________________ Title: Owner Manager Other Employee Other Number of years with business:_________________________________ Year business opened on Valencia St:____________________________ 1. Do you remember what your reaction was when bike lanes along Valencia Street were first
proposed?
2. How did the majority of the other merchants along Valencia Street felt about the bike lanes before they were built?
3. What do you think the majority of the other merchants along Valencia Street think about the bike lanes now that they have been in place for 4 years?
4. What were your hopes and/or concerns about the bike lanes?
5. Have your views about the bike lanes changed at all since then? If so, when?
6. Which of these groups, if any, affected your views of the bike lanes? Choose all that apply:
The Department of Parking and Traffic The San Francisco Bicycle Coalition Merchant Groups/Civic Organizations Other Valencia Street Merchants Customers/Neighbors The Media Other: None
7. How did these groups affect your views?
8. Which of the following benefits have you seen as a result of the bike lanes? Choose all that apply:
Increased/Reduced economic revitalization for area Middle lane is good for (illegal) double parking?
Increased commercial/residential property values? More/less convenient for employees Increased/Reduced sales Better/Worse access for delivery trucks Increase in shoppers who are bikers? Reduced auto speed has increased sales? More/Fewer walkers on sidewalks and window shopping
Increased/Decreased availability of parking for customers
New customers from outside of the neighborhood? Construction of bike lanes was disruptive? More/fewer area residents shopping locally Made street safer for walkers? Increased traffic congestion along Valencia Street- bad/good?
Made street nicer and prettier or less appealing?
Increased traffic congestion on streets nearby-bad/good?
Other:
9. Apart from what the economy has done in the past few years, do you think that the bike lanes have had a generally positive or negative impact on your business’ sales?
10. Would you be supportive of more traffic calming (such as tree planting, sidewalk widening, and improvements for buses) on Valencia Street?
11. What would you tell merchants in other areas of the city who were just learning about traffic calming efforts for their area?
12. Anything else to add?

Economic Effects of Traffic Calming on Urban Small Businesses Page 36
Figure 8 — Map of Study Area (Valencia Street between 15th and 25th Streets)
Source: Mapquest.com
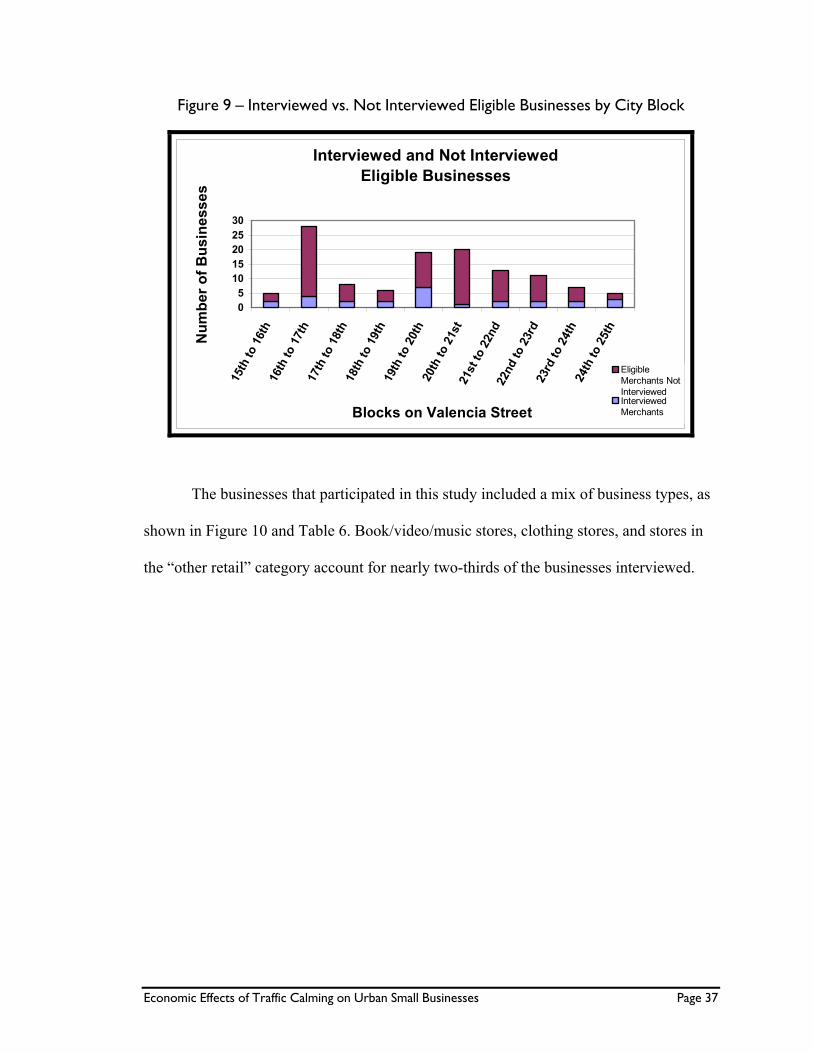
Figure 9 shows the distribution of eligible businesses by city block, and by
whether they were interviewed. The height of each bar represents the total number of
eligible businesses on that city block, composed of those interviewed and those not
interviewed. The numbers on the x-axis represent the names of the cross streets (15th
Street through 25th Street). The interviews ended up achieving some degree of geographic
dispersion, even though the businesses were chosen by a modified random process not
related to geography.
Economic Effects of Traffic Calming on Urban Small Businesses Page 37
Figure 9 — Interviewed vs. Not Interviewed Eligible Businesses by City Block
Interviewed and Not InterviewedEligible Businesses
05
1015202530
15th
to 1
6th
16th
to 1
7th
17th
to 1
8th
18th
to 1
9th
19th
to 2
0th
20th
to 2
1st
21st
to 2
2nd
22nd
to 2
3rd
23rd
to 2
4th
24th
to 2
5th
Blocks on Valencia Street
Num
ber o
f Bus
ines
ses
EligibleMerchants NotInterviewedInterviewedMerchants
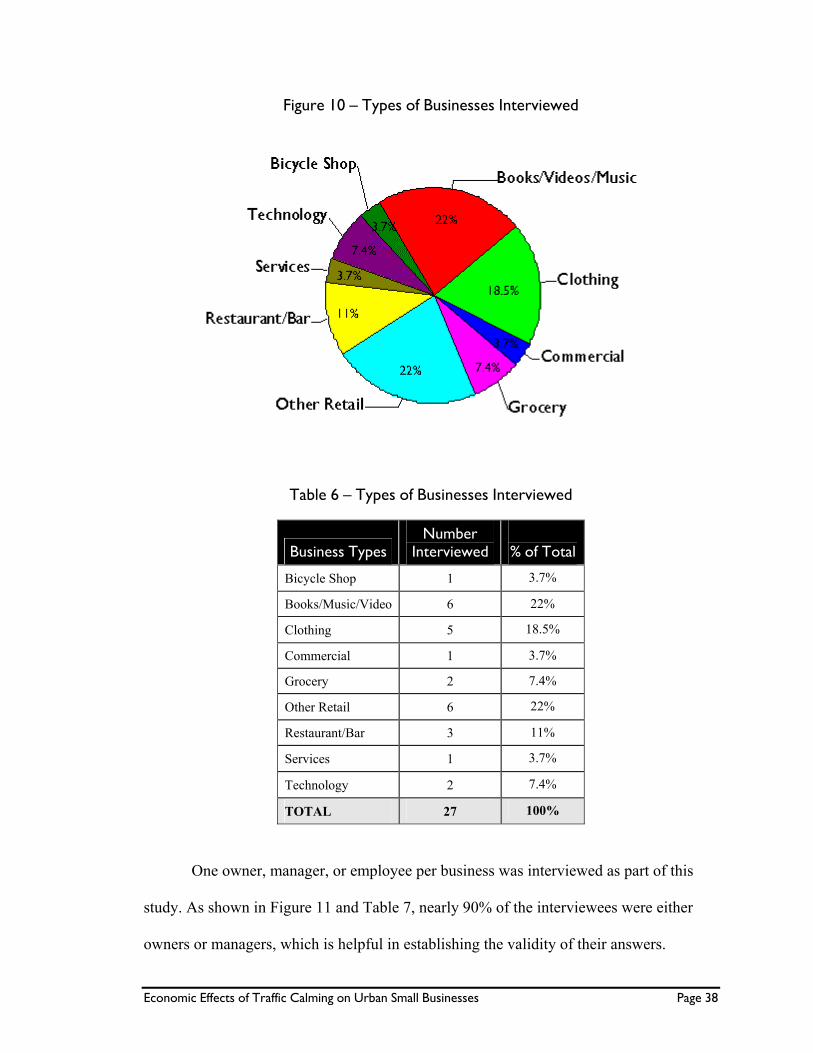
The businesses that participated in this study included a mix of business types, as
shown in Figure 10 and Table 6. Book/video/music stores, clothing stores, and stores in
the “other retail” category account for nearly two-thirds of the businesses interviewed.
Economic Effects of Traffic Calming on Urban Small Businesses Page 38
Figure 10 — Types of Businesses Interviewed
Table 6 — Types of Businesses Interviewed
Business Types Number
Interviewed
% of Total
Bicycle Shop 1 3.7%
Books/Music/Video 6 22%
Clothing 5 18.5%
Commercial 1 3.7%
Grocery 2 7.4%
Other Retail 6 22%
Restaurant/Bar 3 11%
Services 1 3.7%
Technology 2 7.4%
TOTAL 27 100%
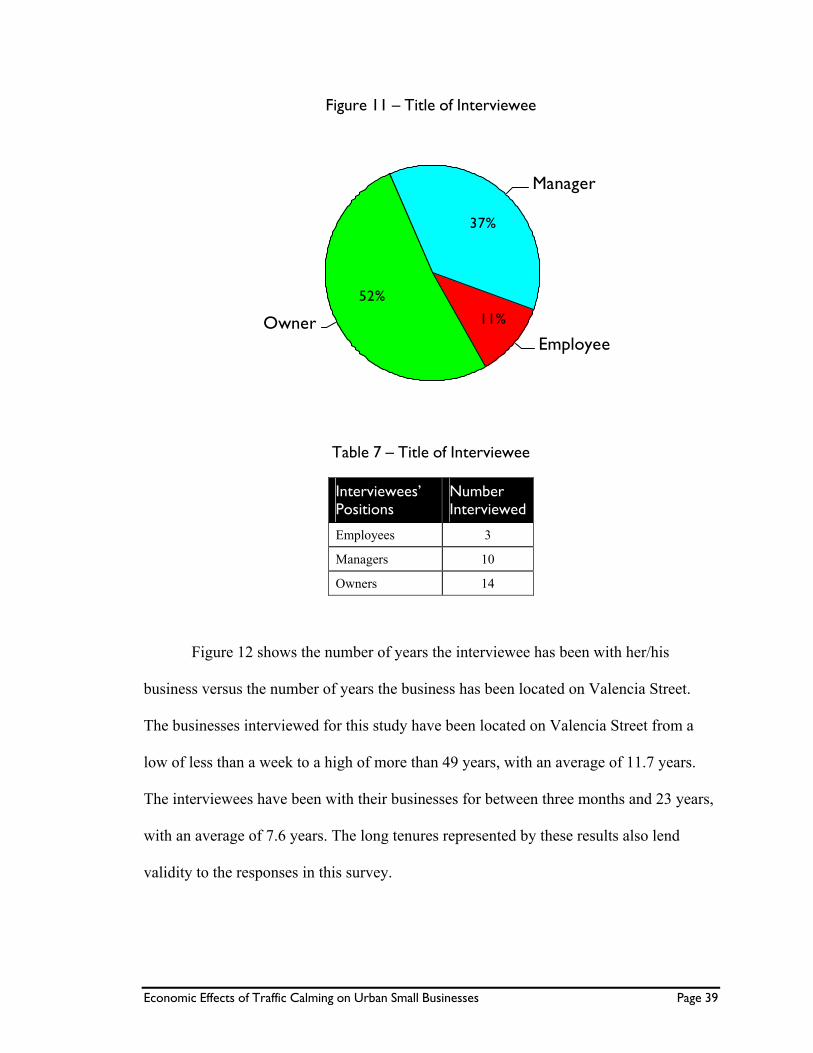
One owner, manager, or employee per business was interviewed as part of this
study. As shown in Figure 11 and Table 7, nearly 90% of the interviewees were either
owners or managers, which is helpful in establishing the validity of their answers.
Economic Effects of Traffic Calming on Urban Small Businesses Page 39
Figure 11 — Title of Interviewee
11%
37%
52%
Employee
Manager
Owner
Table 7 — Title of Interviewee
Interviewees’ Positions
Number Interviewed
Employees 3
Managers 10
Owners 14
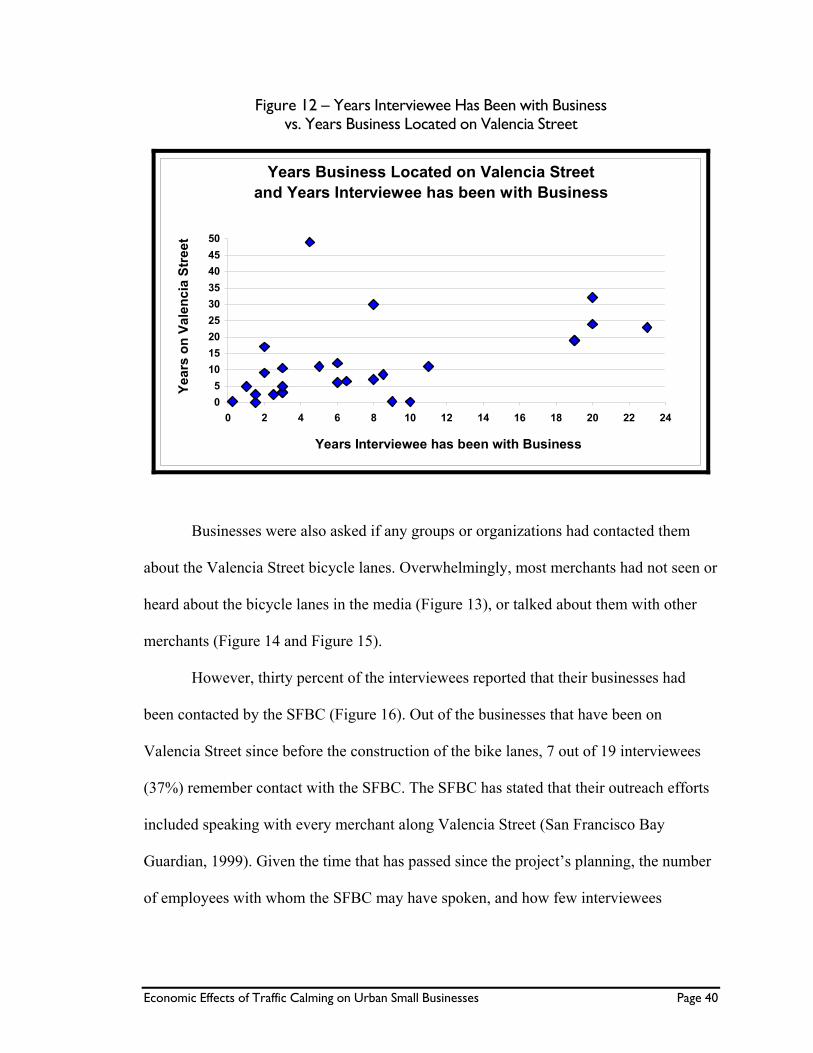
Figure 12 shows the number of years the interviewee has been with her/his
business versus the number of years the business has been located on Valencia Street.
The businesses interviewed for this study have been located on Valencia Street from a
low of less than a week to a high of more than 49 years, with an average of 11.7 years.
The interviewees have been with their businesses for between three months and 23 years,
with an average of 7.6 years. The long tenures represented by these results also lend
validity to the responses in this survey.
Economic Effects of Traffic Calming on Urban Small Businesses Page 40
Figure 12 — Years Interviewee Has Been with Business vs. Years Business Located on Valencia Street
Years Business Located on Valencia Street and Years Interviewee has been with Business
05
101520253035404550
0 2 4 6 8 10 12 14 16 18 20 22 24
Years Interviewee has been with Business
Year
s on
Val
enci
a St
reet
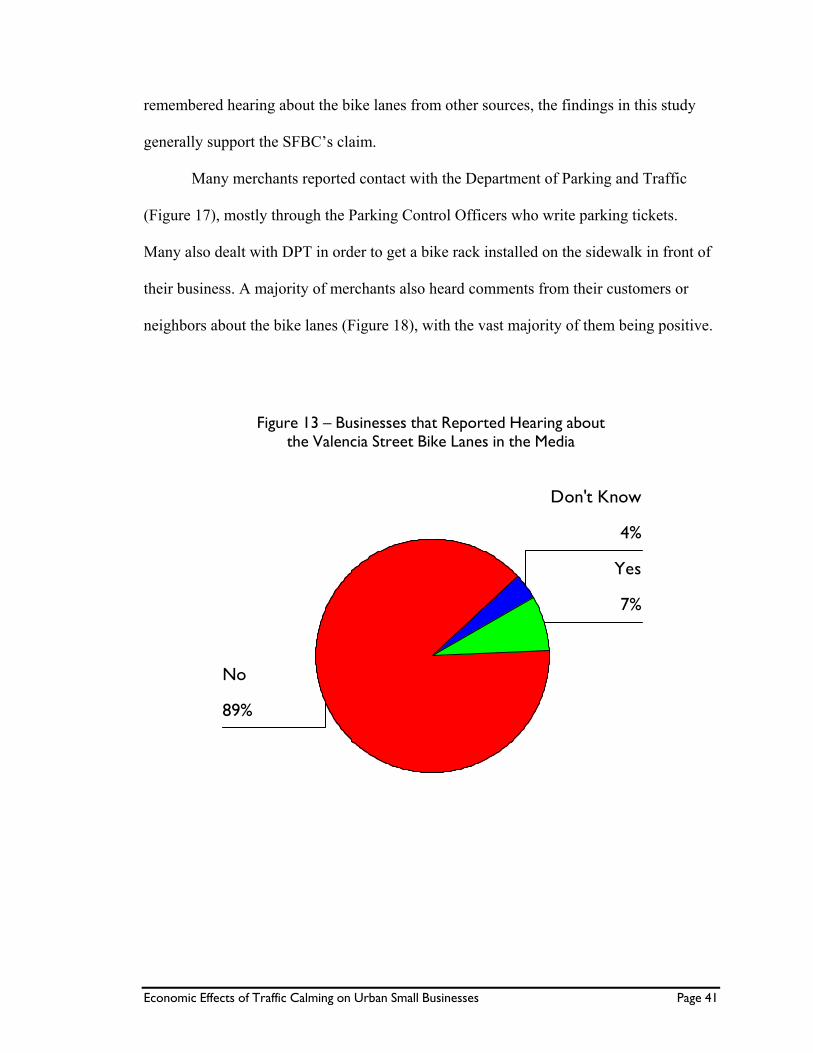
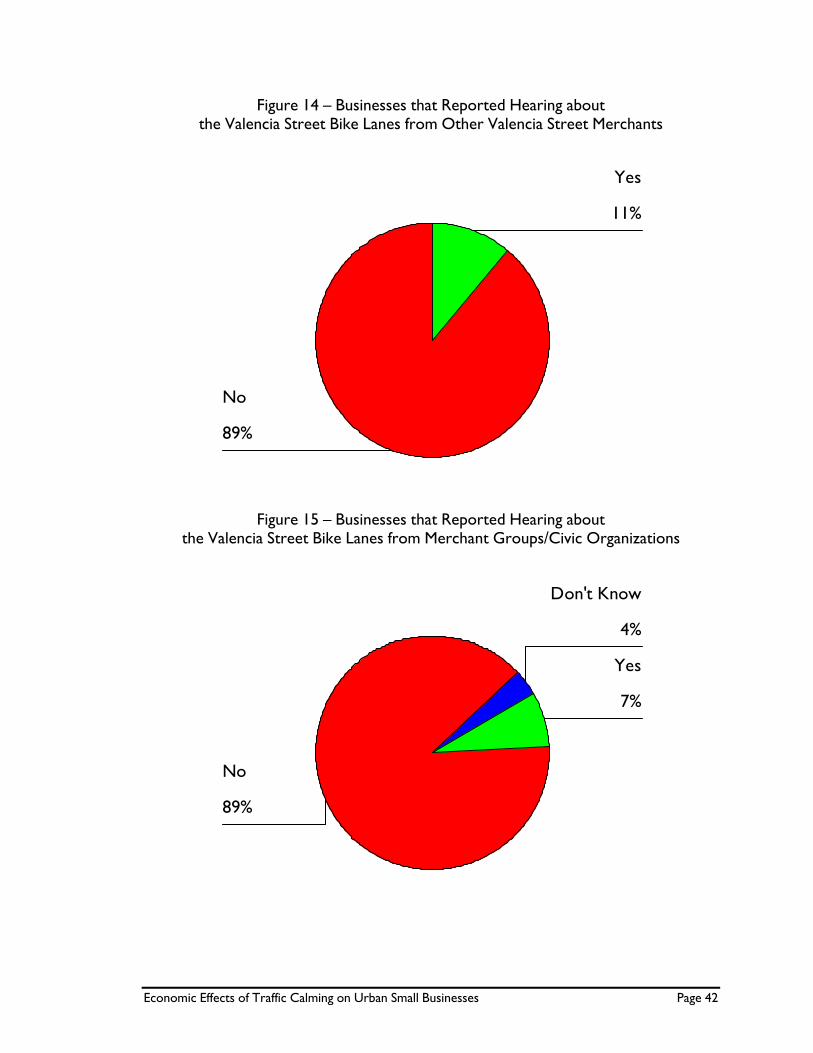
Businesses were also asked if any groups or organizations had contacted them
about the Valencia Street bicycle lanes. Overwhelmingly, most merchants had not seen or
heard about the bicycle lanes in the media (Figure 13), or talked about them with other
merchants (Figure 14 and Figure 15).
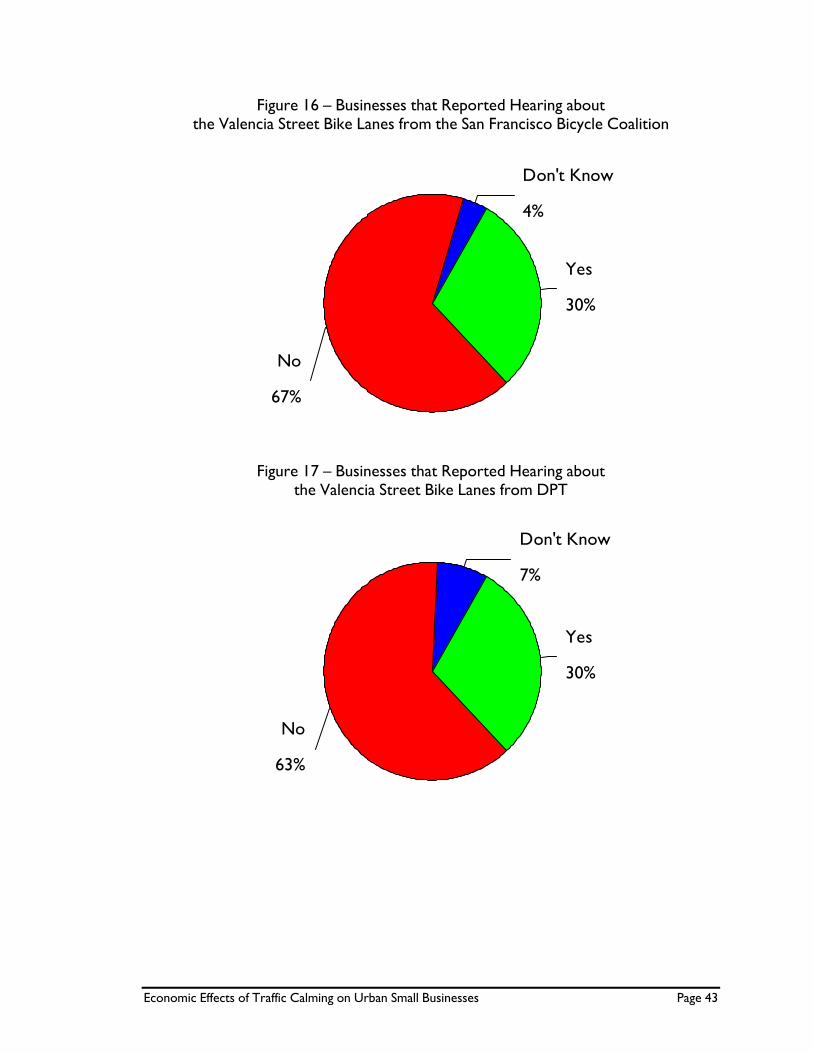
However, thirty percent of the interviewees reported that their businesses had
been contacted by the SFBC (Figure 16). Out of the businesses that have been on
Valencia Street since before the construction of the bike lanes, 7 out of 19 interviewees
(37%) remember contact with the SFBC. The SFBC has stated that their outreach efforts
included speaking with every merchant along Valencia Street (San Francisco Bay
Guardian, 1999). Given the time that has passed since the project’s planning, the number
of employees with whom the SFBC may have spoken, and how few interviewees
Economic Effects of Traffic Calming on Urban Small Businesses Page 41
remembered hearing about the bike lanes from other sources, the findings in this study
generally support the SFBC’s claim.
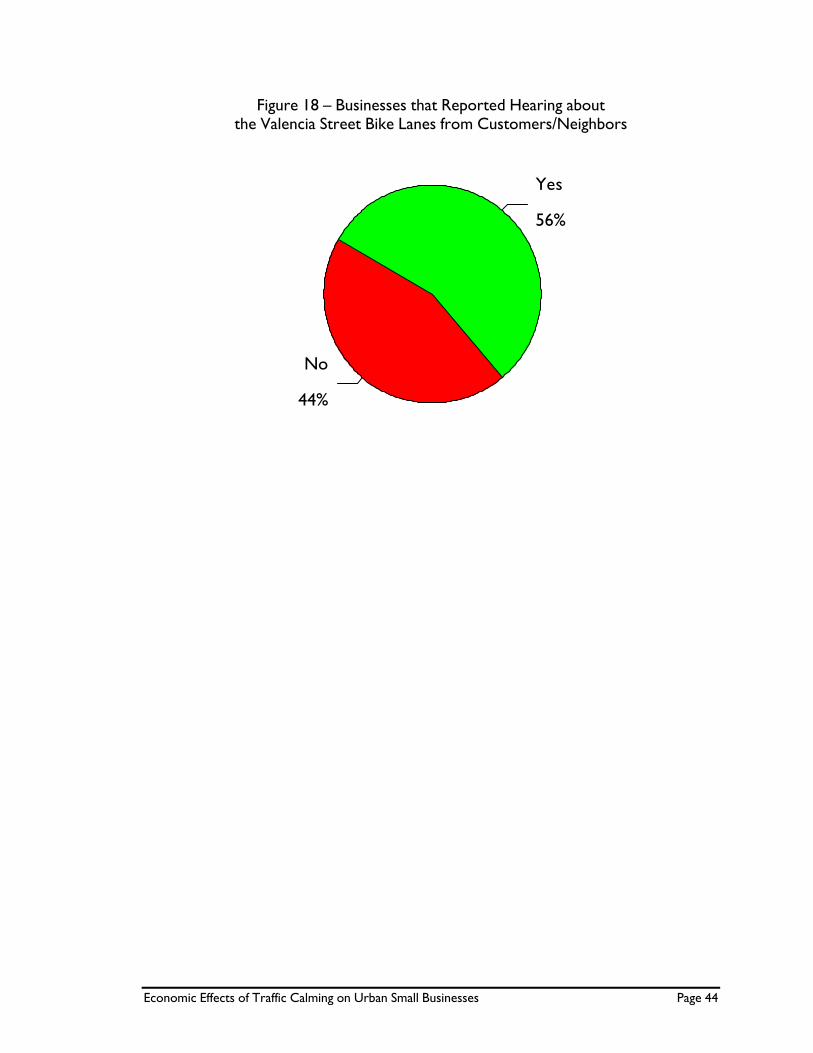
Many merchants reported contact with the Department of Parking and Traffic
(Figure 17), mostly through the Parking Control Officers who write parking tickets.
Many also dealt with DPT in order to get a bike rack installed on the sidewalk in front of
their business. A majority of merchants also heard comments from their customers or
neighbors about the bike lanes (Figure 18), with the vast majority of them being positive.
Figure 13 — Businesses that Reported Hearing about the Valencia Street Bike Lanes in the Media
4%
89%
7%
Don't Know
No
Yes
Economic Effects of Traffic Calming on Urban Small Businesses Page 42
Figure 14 — Businesses that Reported Hearing about the Valencia Street Bike Lanes from Other Valencia Street Merchants
89%
11%
No
Yes
Figure 15 — Businesses that Reported Hearing about the Valencia Street Bike Lanes from Merchant Groups/Civic Organizations
4%
89%
7%
Don't Know
No
Yes
Economic Effects of Traffic Calming on Urban Small Businesses Page 43
Figure 16 — Businesses that Reported Hearing about the Valencia Street Bike Lanes from the San Francisco Bicycle Coalition
4%
67%
30%
Don't Know
No
Yes
Figure 17 — Businesses that Reported Hearing about the Valencia Street Bike Lanes from DPT
7%
63%
30%
Don't Know
No
Yes
Economic Effects of Traffic Calming on Urban Small Businesses Page 44
Figure 18 — Businesses that Reported Hearing about the Valencia Street Bike Lanes from Customers/Neighbors
44%
56%
No
Yes
Economic Effects of Traffic Calming on Urban Small Businesses Page 45
Results of the Valencia Street Bike Lane Merchant Survey
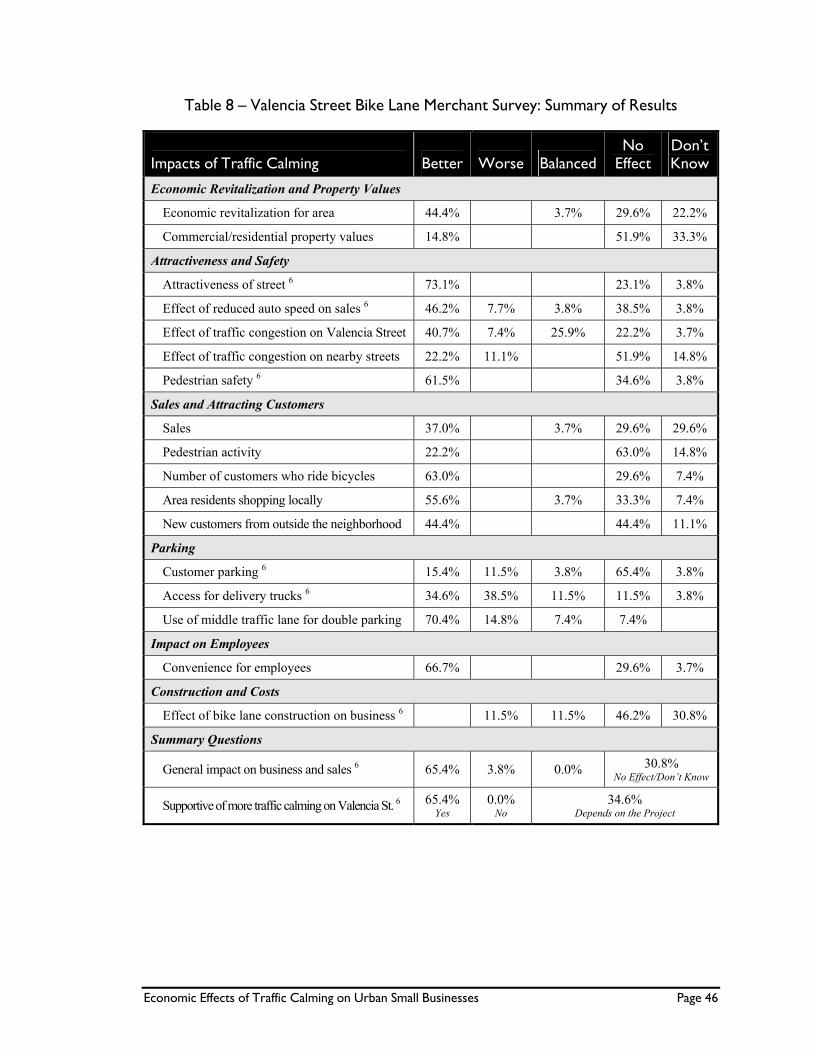
The results of the Valencia Street Bike Lane Merchant Survey are displayed in
Table 8. For ease of data analysis, the Valencia Street Bike Lane Merchant Survey
responses were recoded into standardized categories (where “Better” represents a
situation where a variable was beneficial, “Worse” where it had a negative impact,
“Balanced” where it had both positive and negative effects, “No Effect” where it had no
impact, and “Don’t Know”).
Economic Effects of Traffic Calming on Urban Small Businesses Page 46
Table 8 — Valencia Street Bike Lane Merchant Survey: Summary of Results
Impacts of Traffic Calming Better Worse Balanced No
Effect Don’t Know
Economic Revitalization and Property Values
Economic revitalization for area 44.4% 3.7% 29.6% 22.2%
Commercial/residential property values 14.8% 51.9% 33.3%
Attractiveness and Safety
Attractiveness of street 6 73.1% 23.1% 3.8%
Effect of reduced auto speed on sales 6 46.2% 7.7% 3.8% 38.5% 3.8%
Effect of traffic congestion on Valencia Street 40.7% 7.4% 25.9% 22.2% 3.7%
Effect of traffic congestion on nearby streets 22.2% 11.1% 51.9% 14.8%
Pedestrian safety 6 61.5% 34.6% 3.8%
Sales and Attracting Customers
Sales 37.0% 3.7% 29.6% 29.6%
Pedestrian activity 22.2% 63.0% 14.8%
Number of customers who ride bicycles 63.0% 29.6% 7.4%
Area residents shopping locally 55.6% 3.7% 33.3% 7.4%
New customers from outside the neighborhood 44.4% 44.4% 11.1%
Parking
Customer parking 6 15.4% 11.5% 3.8% 65.4% 3.8%
Access for delivery trucks 6 34.6% 38.5% 11.5% 11.5% 3.8%
Use of middle traffic lane for double parking 70.4% 14.8% 7.4% 7.4%
Impact on Employees
Convenience for employees 66.7% 29.6% 3.7%
Construction and Costs
Effect of bike lane construction on business 6 11.5% 11.5% 46.2% 30.8%
Summary Questions
General impact on business and sales 6 65.4% 3.8% 0.0% 30.8% No Effect/Don’t Know
Supportive of more traffic calming on Valencia St. 6 65.4%Yes
0.0% No
34.6% Depends on the Project
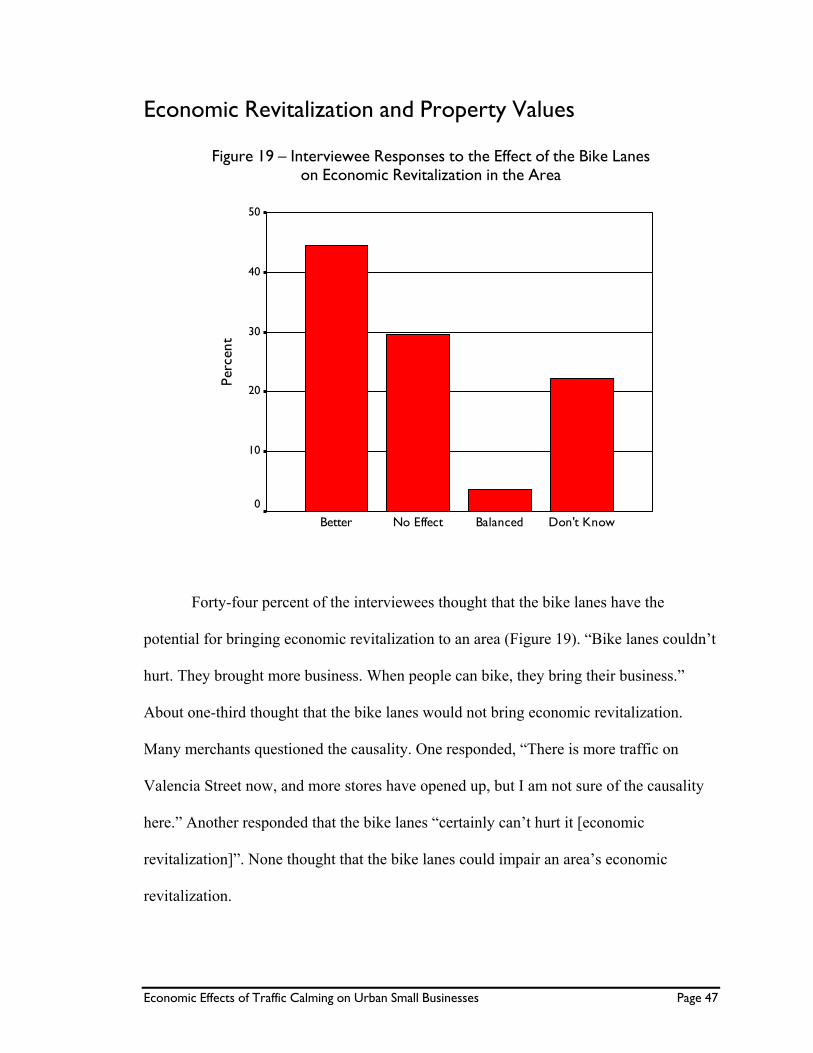
Economic Effects of Traffic Calming on Urban Small Businesses Page 47
Economic Revitalization and Property Values
Figure 19 — Interviewee Responses to the Effect of the Bike Lanes on Economic Revitalization in the Area
Don't KnowBalancedNo EffectBetter
Perc
ent
50
40
30
20
10
0
Forty-four percent of the interviewees thought that the bike lanes have the
potential for bringing economic revitalization to an area (Figure 19). “Bike lanes couldn’t
hurt. They brought more business. When people can bike, they bring their business.”
About one-third thought that the bike lanes would not bring economic revitalization.
Many merchants questioned the causality. One responded, “There is more traffic on
Valencia Street now, and more stores have opened up, but I am not sure of the causality
here.” Another responded that the bike lanes “certainly can’t hurt it [economic
revitalization]”. None thought that the bike lanes could impair an area’s economic
revitalization.
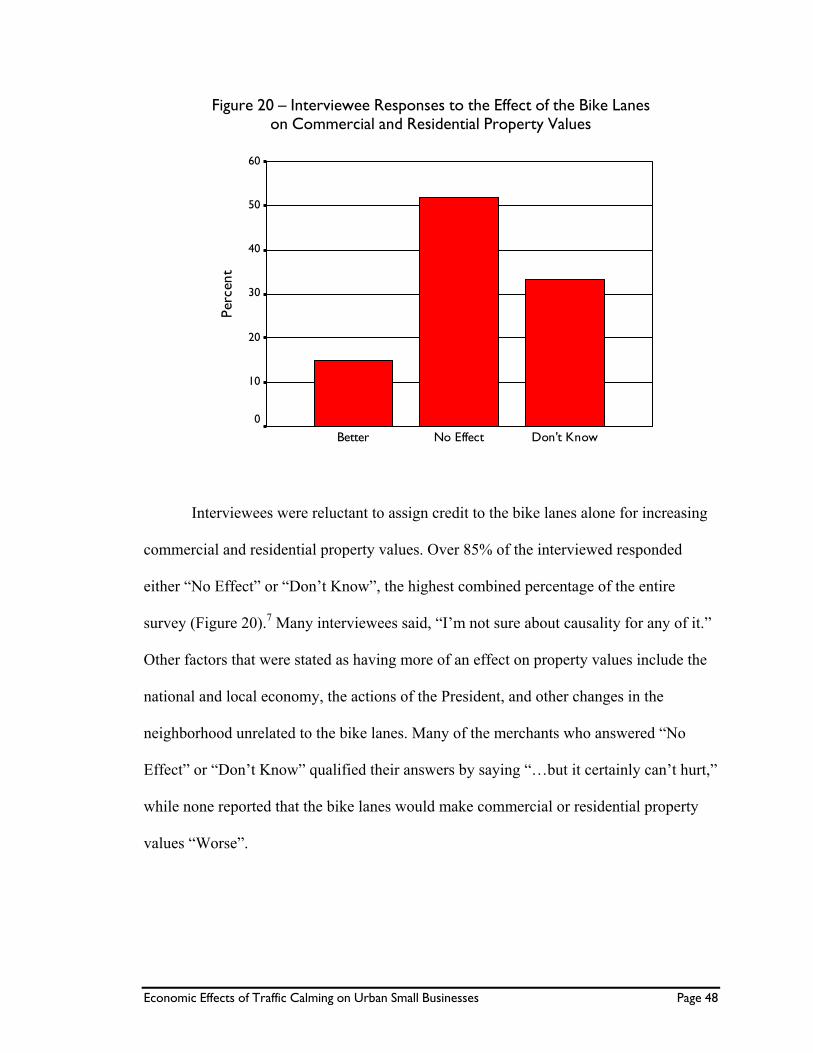
Economic Effects of Traffic Calming on Urban Small Businesses Page 48
Figure 20 — Interviewee Responses to the Effect of the Bike Lanes on Commercial and Residential Property Values
Don't KnowNo EffectBetter
Perc
ent
60
50
40
30
20
10
0
Interviewees were reluctant to assign credit to the bike lanes alone for increasing
commercial and residential property values. Over 85% of the interviewed responded
either “No Effect” or “Don’t Know”, the highest combined percentage of the entire
survey (Figure 20).7 Many interviewees said, “I’m not sure about causality for any of it.”
Other factors that were stated as having more of an effect on property values include the
national and local economy, the actions of the President, and other changes in the
neighborhood unrelated to the bike lanes. Many of the merchants who answered “No
Effect” or “Don’t Know” qualified their answers by saying “…but it certainly can’t hurt,”
while none reported that the bike lanes would make commercial or residential property
values “Worse”.
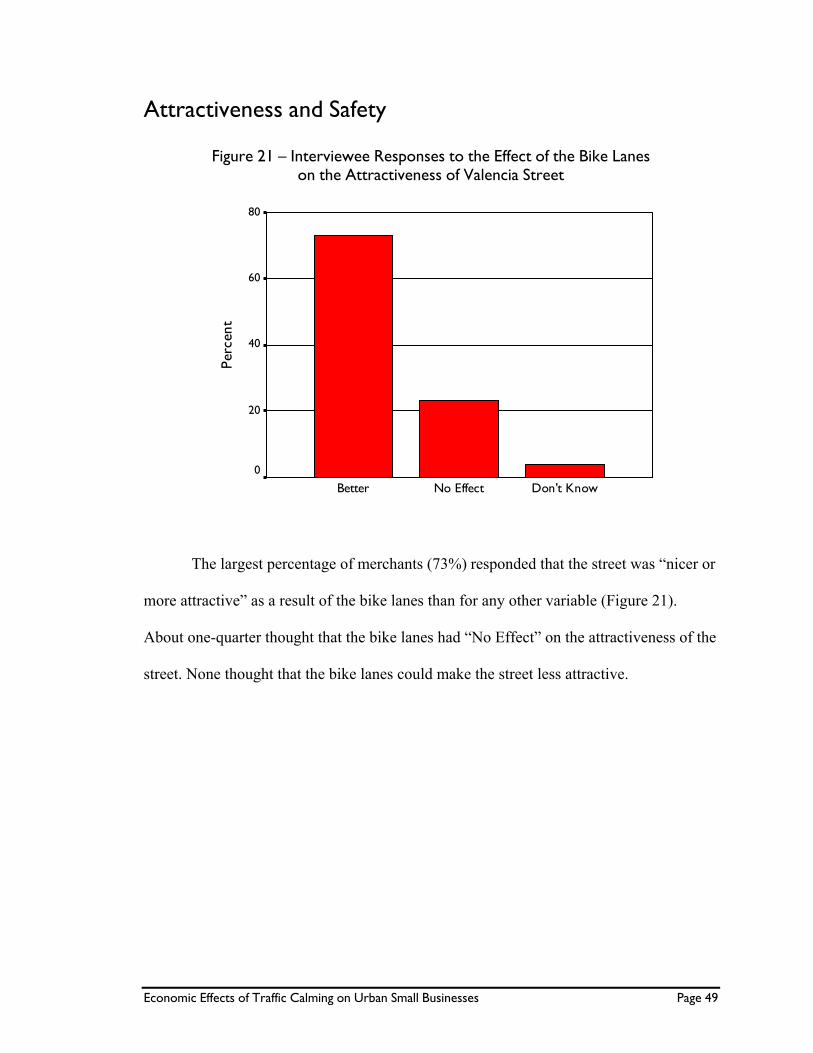
Economic Effects of Traffic Calming on Urban Small Businesses Page 49
Attractiveness and Safety
Figure 21 — Interviewee Responses to the Effect of the Bike Lanes on the Attractiveness of Valencia Street
Don't KnowNo EffectBetter
Perc
ent
80
60
40
20
0
The largest percentage of merchants (73%) responded that the street was “nicer or
more attractive” as a result of the bike lanes than for any other variable (Figure 21).
About one-quarter thought that the bike lanes had “No Effect” on the attractiveness of the
street. None thought that the bike lanes could make the street less attractive.
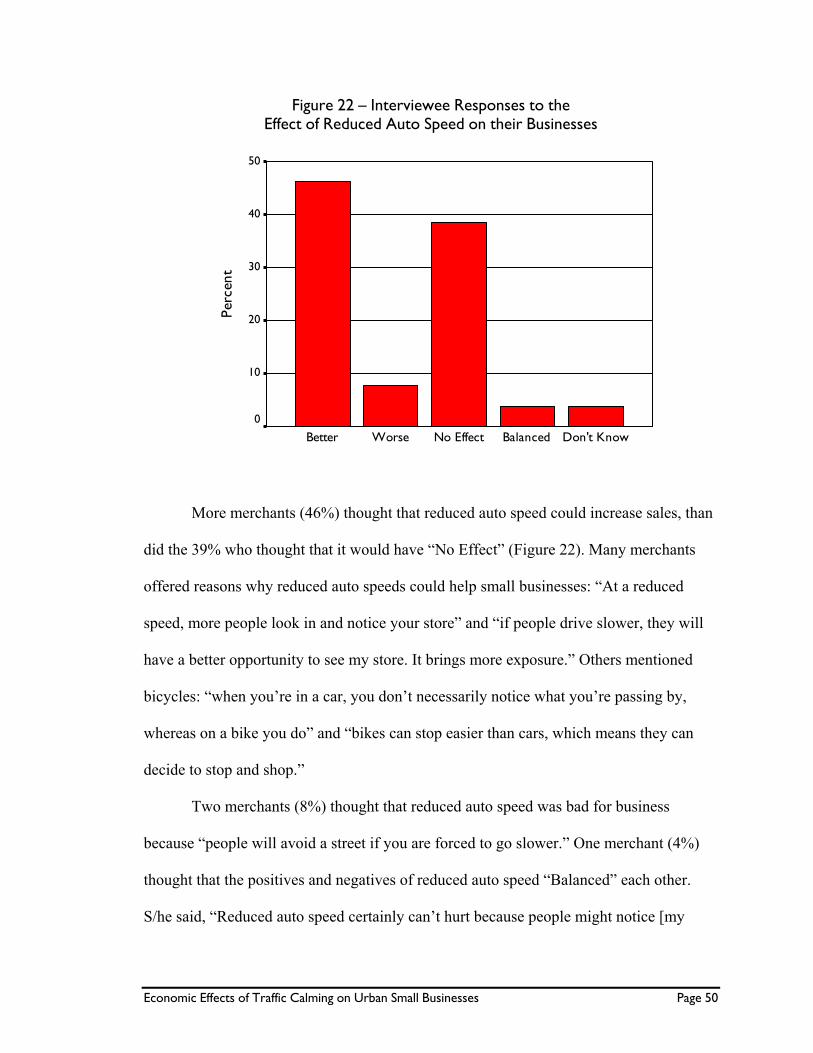
Economic Effects of Traffic Calming on Urban Small Businesses Page 50
Figure 22 — Interviewee Responses to the Effect of Reduced Auto Speed on their Businesses
Don't KnowBalancedNo EffectWorseBetter
Perc
ent
50
40
30
20
10
0
More merchants (46%) thought that reduced auto speed could increase sales, than
did the 39% who thought that it would have “No Effect” (Figure 22). Many merchants
offered reasons why reduced auto speeds could help small businesses: “At a reduced
speed, more people look in and notice your store” and “if people drive slower, they will
have a better opportunity to see my store. It brings more exposure.” Others mentioned
bicycles: “when you’re in a car, you don’t necessarily notice what you’re passing by,
whereas on a bike you do” and “bikes can stop easier than cars, which means they can
decide to stop and shop.”
Two merchants (8%) thought that reduced auto speed was bad for business
because “people will avoid a street if you are forced to go slower.” One merchant (4%)
thought that the positives and negatives of reduced auto speed “Balanced” each other.
S/he said, “Reduced auto speed certainly can’t hurt because people might notice [my
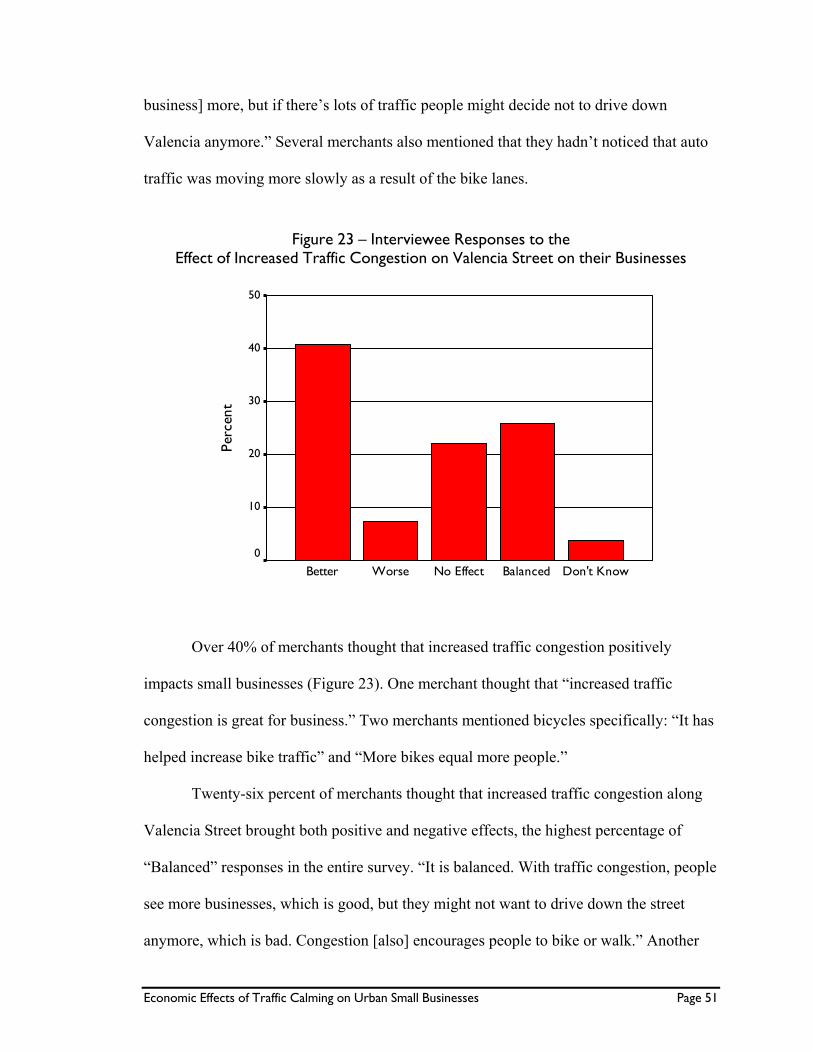
Economic Effects of Traffic Calming on Urban Small Businesses Page 51
business] more, but if there’s lots of traffic people might decide not to drive down
Valencia anymore.” Several merchants also mentioned that they hadn’t noticed that auto
traffic was moving more slowly as a result of the bike lanes.
Figure 23 — Interviewee Responses to the Effect of Increased Traffic Congestion on Valencia Street on their Businesses
Don't KnowBalancedNo EffectWorseBetter
Perc
ent
50
40
30
20
10
0
Over 40% of merchants thought that increased traffic congestion positively
impacts small businesses (Figure 23). One merchant thought that “increased traffic
congestion is great for business.” Two merchants mentioned bicycles specifically: “It has
helped increase bike traffic” and “More bikes equal more people.”
Twenty-six percent of merchants thought that increased traffic congestion along
Valencia Street brought both positive and negative effects, the highest percentage of
“Balanced” responses in the entire survey. “It is balanced. With traffic congestion, people
see more businesses, which is good, but they might not want to drive down the street
anymore, which is bad. Congestion [also] encourages people to bike or walk.” Another
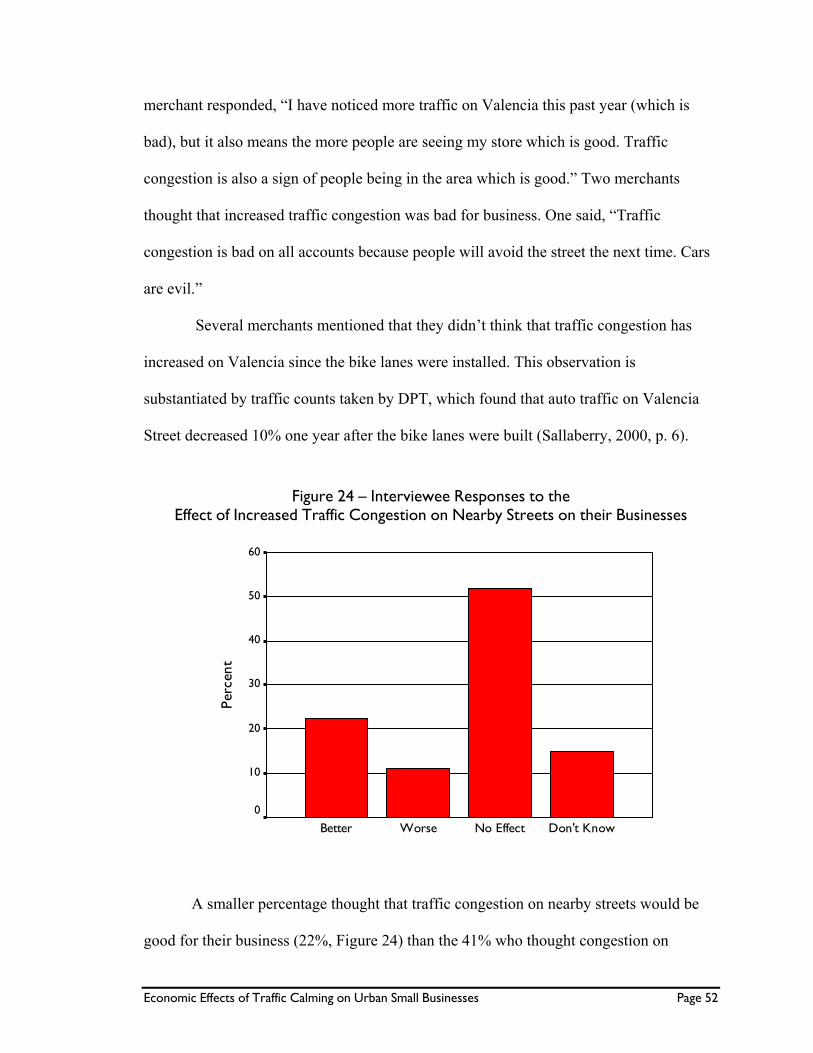
Economic Effects of Traffic Calming on Urban Small Businesses Page 52
merchant responded, “I have noticed more traffic on Valencia this past year (which is
bad), but it also means the more people are seeing my store which is good. Traffic
congestion is also a sign of people being in the area which is good.” Two merchants
thought that increased traffic congestion was bad for business. One said, “Traffic
congestion is bad on all accounts because people will avoid the street the next time. Cars
are evil.”
Several merchants mentioned that they didn’t think that traffic congestion has
increased on Valencia since the bike lanes were installed. This observation is
substantiated by traffic counts taken by DPT, which found that auto traffic on Valencia
Street decreased 10% one year after the bike lanes were built (Sallaberry, 2000, p. 6).
Figure 24 — Interviewee Responses to the Effect of Increased Traffic Congestion on Nearby Streets on their Businesses
Don't KnowNo EffectWorseBetter
Perc
ent
60
50
40
30
20
10
0
A smaller percentage thought that traffic congestion on nearby streets would be
good for their business (22%, Figure 24) than the 41% who thought congestion on
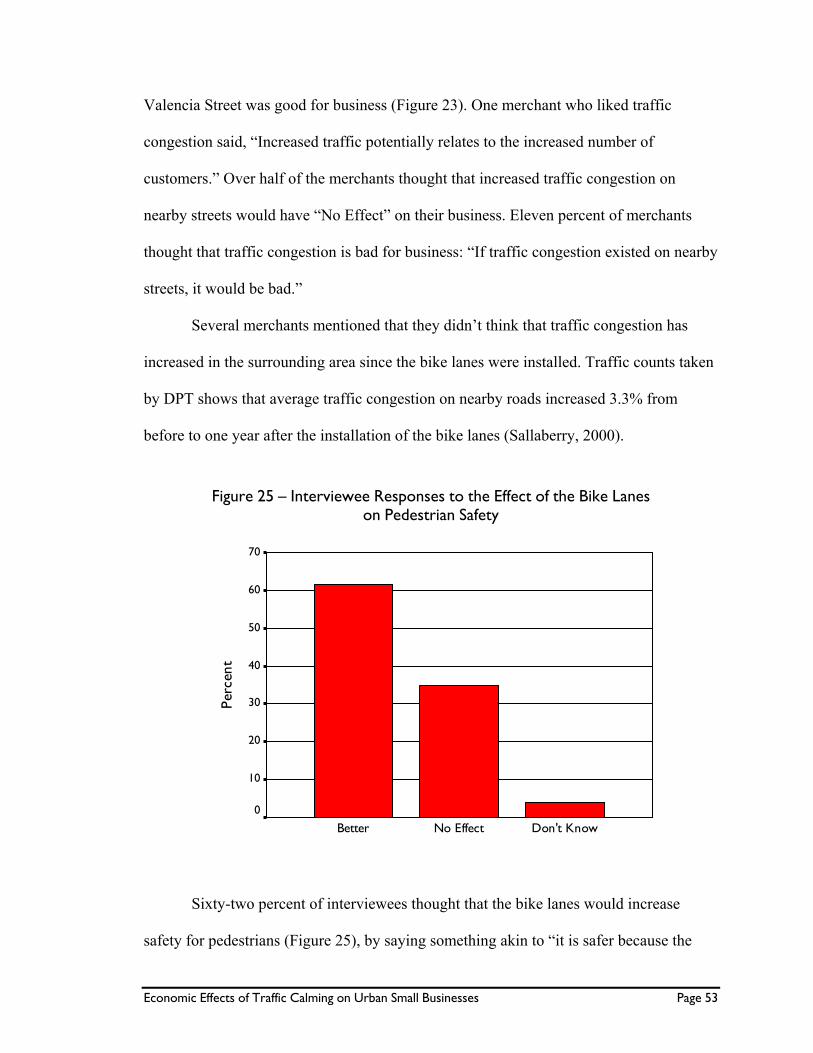
Economic Effects of Traffic Calming on Urban Small Businesses Page 53
Valencia Street was good for business (Figure 23). One merchant who liked traffic
congestion said, “Increased traffic potentially relates to the increased number of
customers.” Over half of the merchants thought that increased traffic congestion on
nearby streets would have “No Effect” on their business. Eleven percent of merchants
thought that traffic congestion is bad for business: “If traffic congestion existed on nearby
streets, it would be bad.”
Several merchants mentioned that they didn’t think that traffic congestion has
increased in the surrounding area since the bike lanes were installed. Traffic counts taken
by DPT shows that average traffic congestion on nearby roads increased 3.3% from
before to one year after the installation of the bike lanes (Sallaberry, 2000).
Figure 25 — Interviewee Responses to the Effect of the Bike Lanes on Pedestrian Safety
Don't KnowNo EffectBetter
Perc
ent
70
60
50
40
30
20
10
0
Sixty-two percent of interviewees thought that the bike lanes would increase
safety for pedestrians (Figure 25), by saying something akin to “it is safer because the
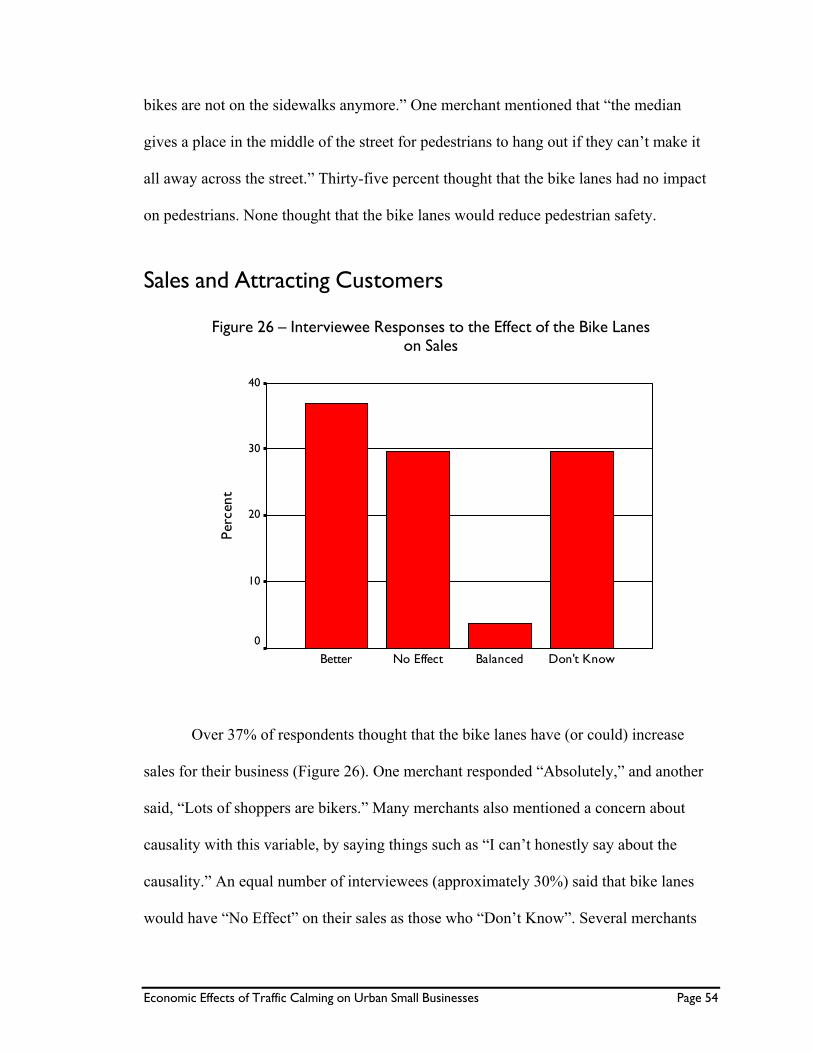
Economic Effects of Traffic Calming on Urban Small Businesses Page 54
bikes are not on the sidewalks anymore.” One merchant mentioned that “the median
gives a place in the middle of the street for pedestrians to hang out if they can’t make it
all away across the street.” Thirty-five percent thought that the bike lanes had no impact
on pedestrians. None thought that the bike lanes would reduce pedestrian safety.
Sales and Attracting Customers
Figure 26 — Interviewee Responses to the Effect of the Bike Lanes on Sales
Don't KnowBalancedNo EffectBetter
Perc
ent
40
30
20
10
0
Over 37% of respondents thought that the bike lanes have (or could) increase
sales for their business (Figure 26). One merchant responded “Absolutely,” and another
said, “Lots of shoppers are bikers.” Many merchants also mentioned a concern about
causality with this variable, by saying things such as “I can’t honestly say about the
causality.” An equal number of interviewees (approximately 30%) said that bike lanes
would have “No Effect” on their sales as those who “Don’t Know”. Several merchants
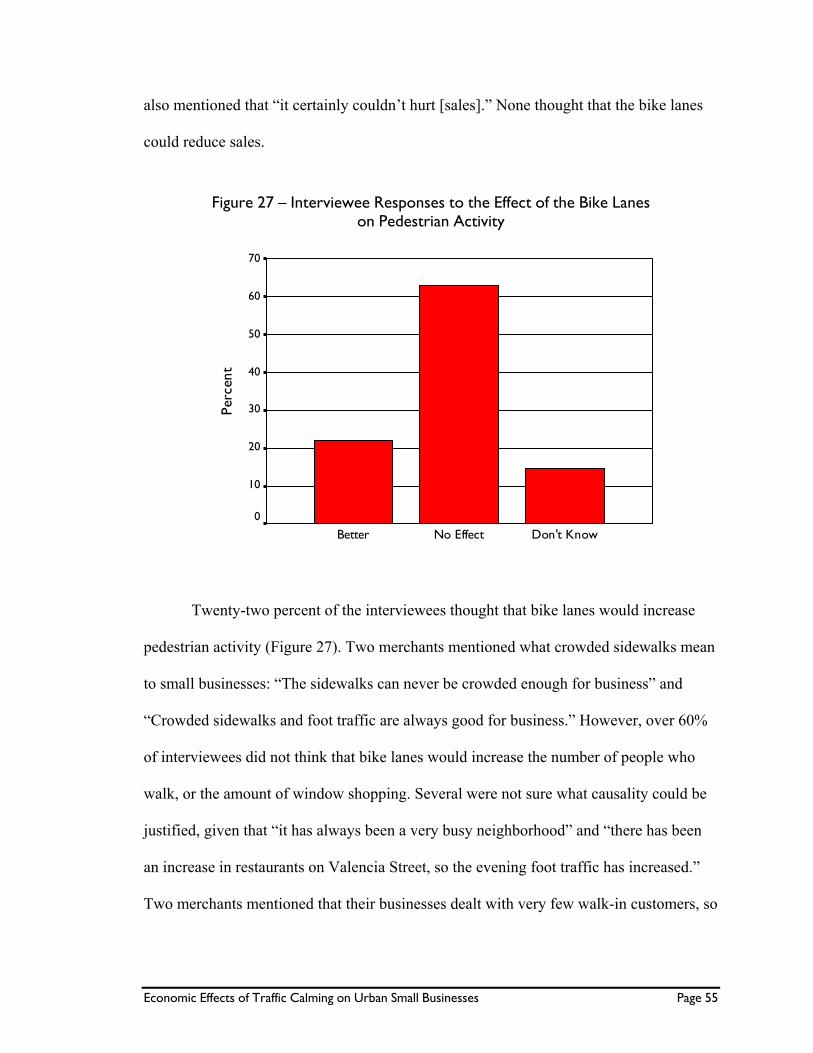
Economic Effects of Traffic Calming on Urban Small Businesses Page 55
also mentioned that “it certainly couldn’t hurt [sales].” None thought that the bike lanes
could reduce sales.
Figure 27 — Interviewee Responses to the Effect of the Bike Lanes on Pedestrian Activity
Don't KnowNo EffectBetter
Perc
ent
70
60
50
40
30
20
10
0
Twenty-two percent of the interviewees thought that bike lanes would increase
pedestrian activity (Figure 27). Two merchants mentioned what crowded sidewalks mean
to small businesses: “The sidewalks can never be crowded enough for business” and
“Crowded sidewalks and foot traffic are always good for business.” However, over 60%
of interviewees did not think that bike lanes would increase the number of people who
walk, or the amount of window shopping. Several were not sure what causality could be
justified, given that “it has always been a very busy neighborhood” and “there has been
an increase in restaurants on Valencia Street, so the evening foot traffic has increased.”
Two merchants mentioned that their businesses dealt with very few walk-in customers, so
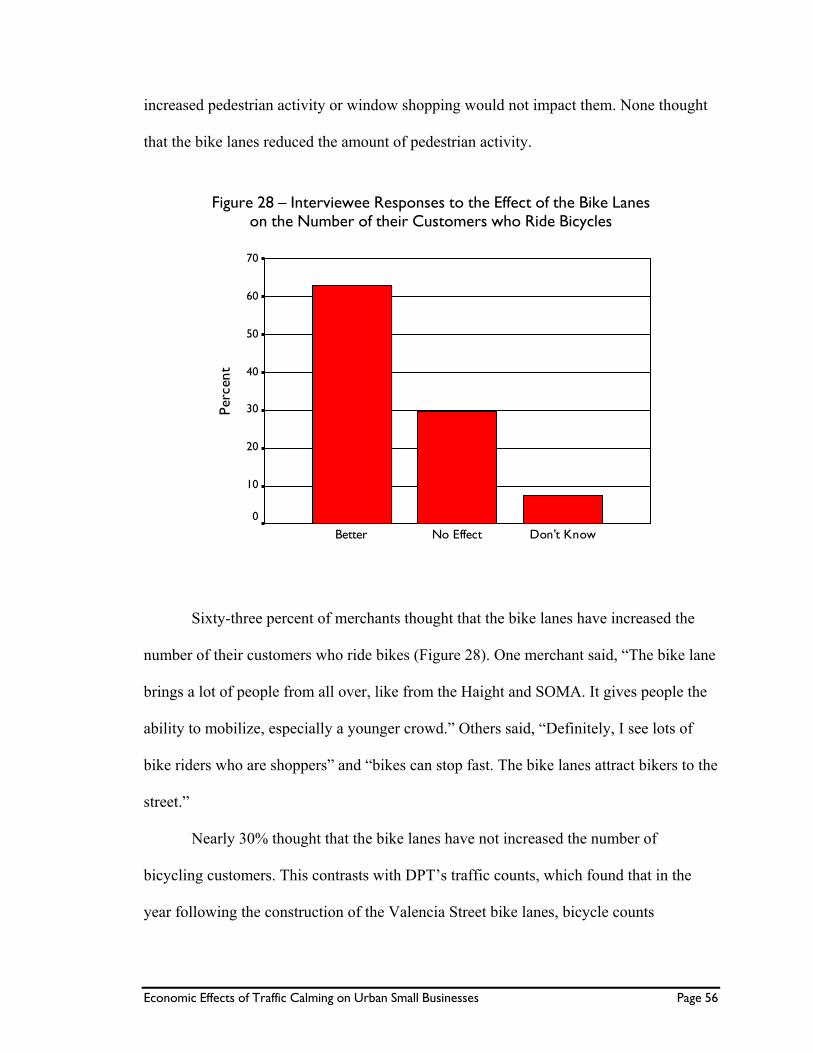
Economic Effects of Traffic Calming on Urban Small Businesses Page 56
increased pedestrian activity or window shopping would not impact them. None thought
that the bike lanes reduced the amount of pedestrian activity.
Figure 28 — Interviewee Responses to the Effect of the Bike Lanes on the Number of their Customers who Ride Bicycles
Don't KnowNo EffectBetter
Perc
ent
70
60
50
40
30
20
10
0
Sixty-three percent of merchants thought that the bike lanes have increased the
number of their customers who ride bikes (Figure 28). One merchant said, “The bike lane
brings a lot of people from all over, like from the Haight and SOMA. It gives people the
ability to mobilize, especially a younger crowd.” Others said, “Definitely, I see lots of
bike riders who are shoppers” and “bikes can stop fast. The bike lanes attract bikers to the
street.”
Nearly 30% thought that the bike lanes have not increased the number of
bicycling customers. This contrasts with DPT’s traffic counts, which found that in the
year following the construction of the Valencia Street bike lanes, bicycle counts
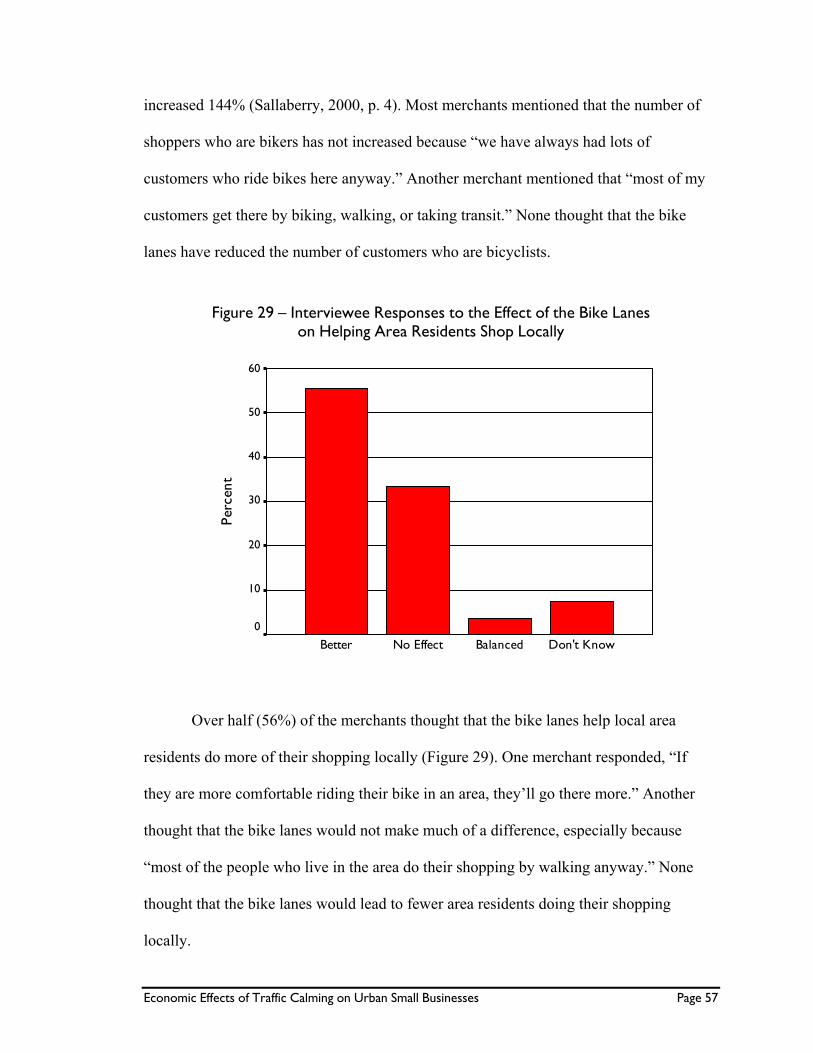
Economic Effects of Traffic Calming on Urban Small Businesses Page 57
increased 144% (Sallaberry, 2000, p. 4). Most merchants mentioned that the number of
shoppers who are bikers has not increased because “we have always had lots of
customers who ride bikes here anyway.” Another merchant mentioned that “most of my
customers get there by biking, walking, or taking transit.” None thought that the bike
lanes have reduced the number of customers who are bicyclists.
Figure 29 — Interviewee Responses to the Effect of the Bike Lanes on Helping Area Residents Shop Locally
Don't KnowBalancedNo EffectBetter
Perc
ent
60
50
40
30
20
10
0
Over half (56%) of the merchants thought that the bike lanes help local area
residents do more of their shopping locally (Figure 29). One merchant responded, “If
they are more comfortable riding their bike in an area, they’ll go there more.” Another
thought that the bike lanes would not make much of a difference, especially because
“most of the people who live in the area do their shopping by walking anyway.” None
thought that the bike lanes would lead to fewer area residents doing their shopping
locally.
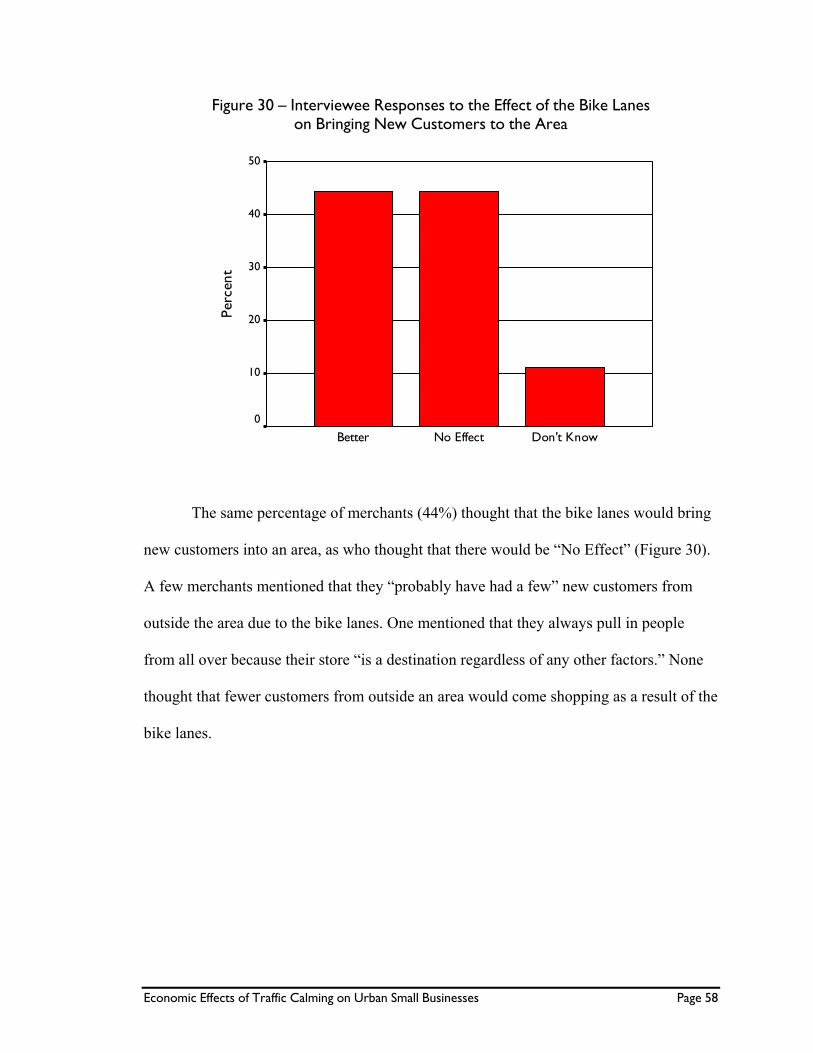
Economic Effects of Traffic Calming on Urban Small Businesses Page 58
Figure 30 — Interviewee Responses to the Effect of the Bike Lanes on Bringing New Customers to the Area
Don't KnowNo EffectBetter
Perc
ent
50
40
30
20
10
0
The same percentage of merchants (44%) thought that the bike lanes would bring
new customers into an area, as who thought that there would be “No Effect” (Figure 30).
A few merchants mentioned that they “probably have had a few” new customers from
outside the area due to the bike lanes. One mentioned that they always pull in people
from all over because their store “is a destination regardless of any other factors.” None
thought that fewer customers from outside an area would come shopping as a result of the
bike lanes.
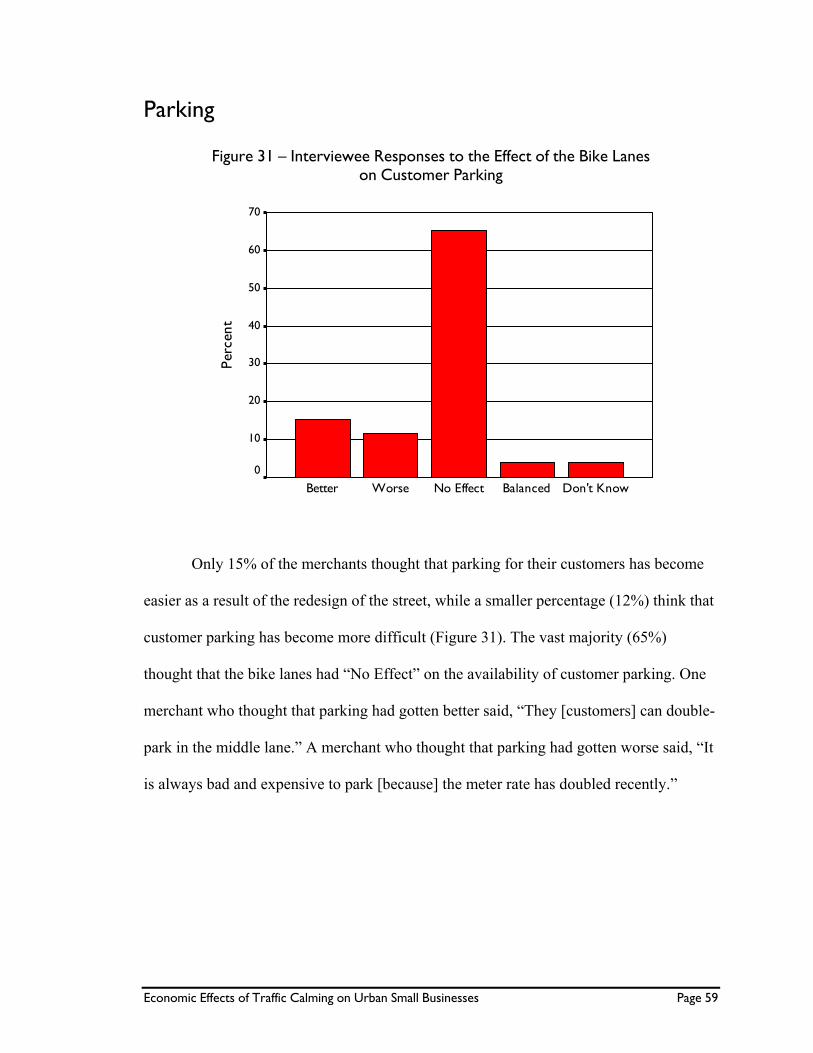
Economic Effects of Traffic Calming on Urban Small Businesses Page 59
Parking
Figure 31 — Interviewee Responses to the Effect of the Bike Lanes on Customer Parking
Don't KnowBalancedNo EffectWorseBetter
Perc
ent
70
60
50
40
30
20
10
0
Only 15% of the merchants thought that parking for their customers has become
easier as a result of the redesign of the street, while a smaller percentage (12%) think that
customer parking has become more difficult (Figure 31). The vast majority (65%)
thought that the bike lanes had “No Effect” on the availability of customer parking. One
merchant who thought that parking had gotten better said, “They [customers] can double-
park in the middle lane.” A merchant who thought that parking had gotten worse said, “It
is always bad and expensive to park [because] the meter rate has doubled recently.”
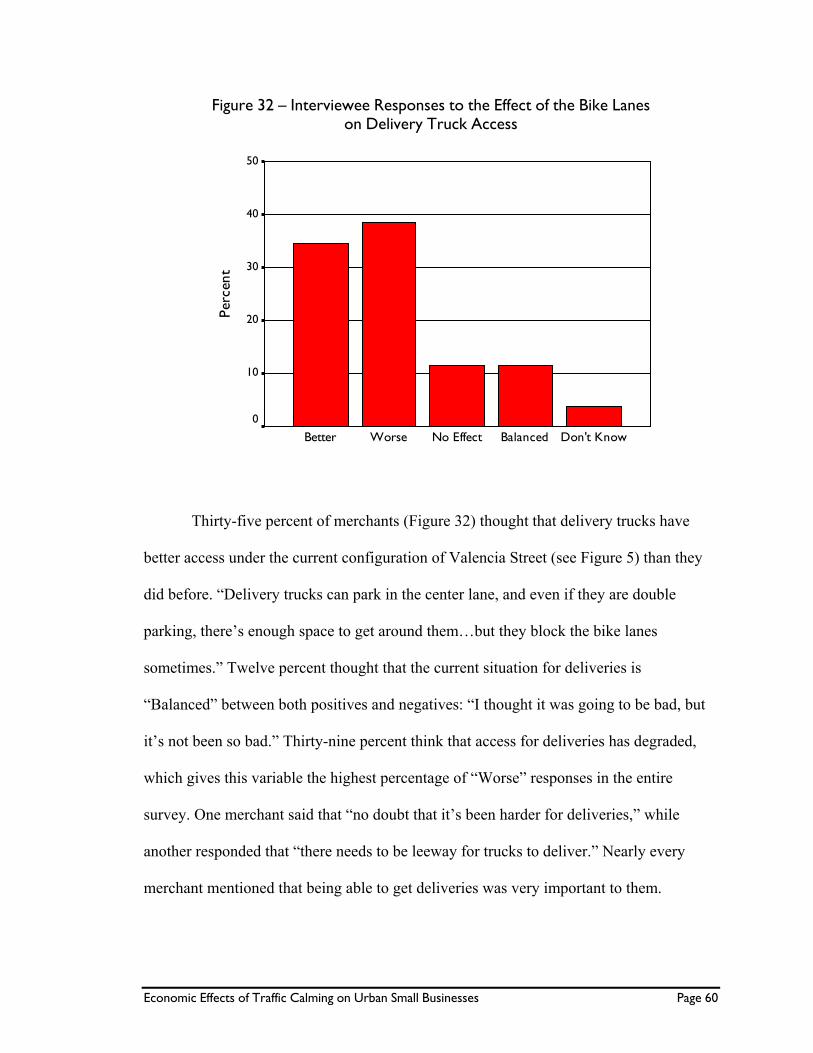
Economic Effects of Traffic Calming on Urban Small Businesses Page 60
Figure 32 — Interviewee Responses to the Effect of the Bike Lanes on Delivery Truck Access
Don't KnowBalancedNo EffectWorseBetter
Perc
ent
50
40
30
20
10
0
Thirty-five percent of merchants (Figure 32) thought that delivery trucks have
better access under the current configuration of Valencia Street (see Figure 5) than they
did before. “Delivery trucks can park in the center lane, and even if they are double
parking, there’s enough space to get around them…but they block the bike lanes
sometimes.” Twelve percent thought that the current situation for deliveries is
“Balanced” between both positives and negatives: “I thought it was going to be bad, but
it’s not been so bad.” Thirty-nine percent think that access for deliveries has degraded,
which gives this variable the highest percentage of “Worse” responses in the entire
survey. One merchant said that “no doubt that it’s been harder for deliveries,” while
another responded that “there needs to be leeway for trucks to deliver.” Nearly every
merchant mentioned that being able to get deliveries was very important to them.
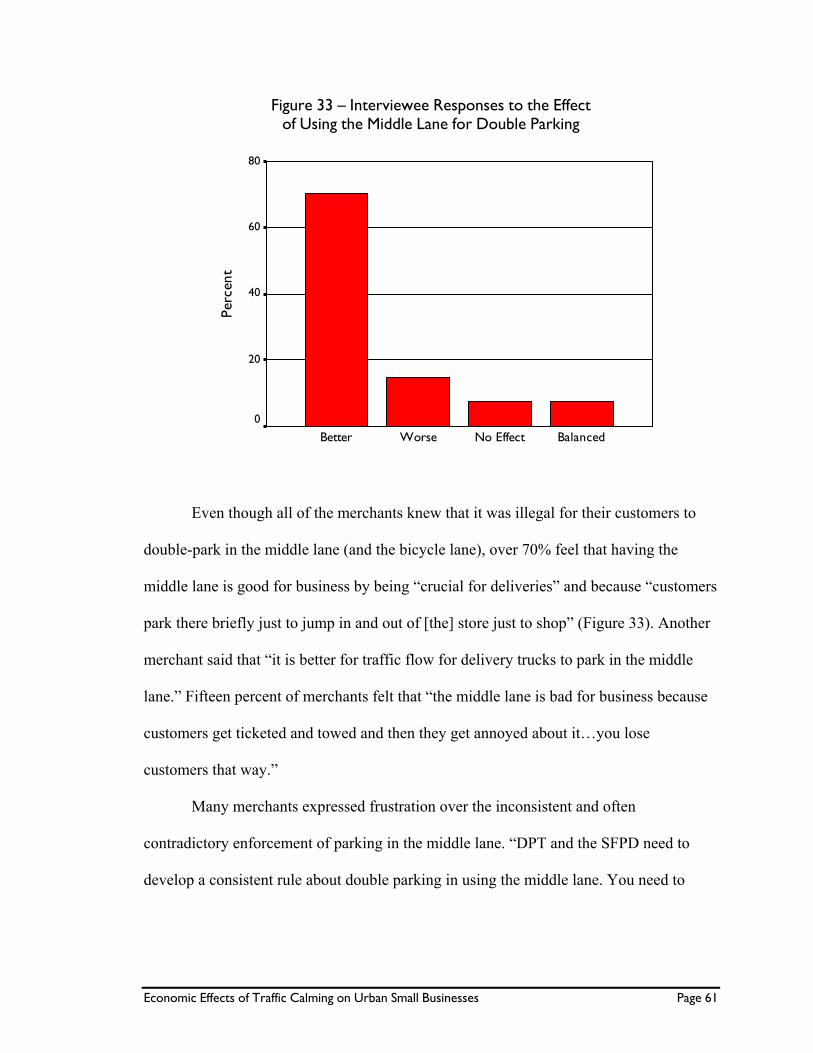
Economic Effects of Traffic Calming on Urban Small Businesses Page 61
Figure 33 — Interviewee Responses to the Effect of Using the Middle Lane for Double Parking
BalancedNo EffectWorseBetter
Perc
ent
80
60
40
20
0
Even though all of the merchants knew that it was illegal for their customers to
double-park in the middle lane (and the bicycle lane), over 70% feel that having the
middle lane is good for business by being “crucial for deliveries” and because “customers
park there briefly just to jump in and out of [the] store just to shop” (Figure 33). Another
merchant said that “it is better for traffic flow for delivery trucks to park in the middle
lane.” Fifteen percent of merchants felt that “the middle lane is bad for business because
customers get ticketed and towed and then they get annoyed about it…you lose
customers that way.”
Many merchants expressed frustration over the inconsistent and often
contradictory enforcement of parking in the middle lane. “DPT and the SFPD need to
develop a consistent rule about double parking in using the middle lane. You need to
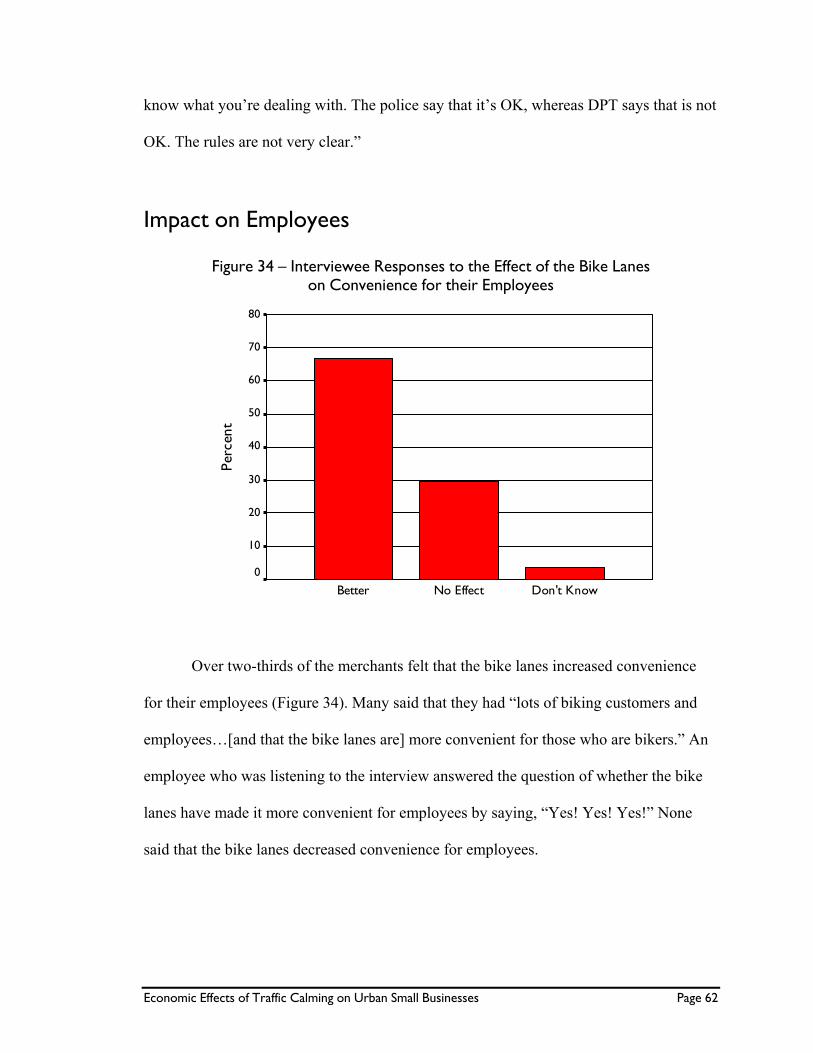
Economic Effects of Traffic Calming on Urban Small Businesses Page 62
know what you’re dealing with. The police say that it’s OK, whereas DPT says that is not
OK. The rules are not very clear.”
Impact on Employees
Figure 34 — Interviewee Responses to the Effect of the Bike Lanes on Convenience for their Employees
Don't KnowNo EffectBetter
Perc
ent
80
70
60
50
40
30
20
10
0
Over two-thirds of the merchants felt that the bike lanes increased convenience
for their employees (Figure 34). Many said that they had “lots of biking customers and
employees…[and that the bike lanes are] more convenient for those who are bikers.” An
employee who was listening to the interview answered the question of whether the bike
lanes have made it more convenient for employees by saying, “Yes! Yes! Yes!” None
said that the bike lanes decreased convenience for employees.
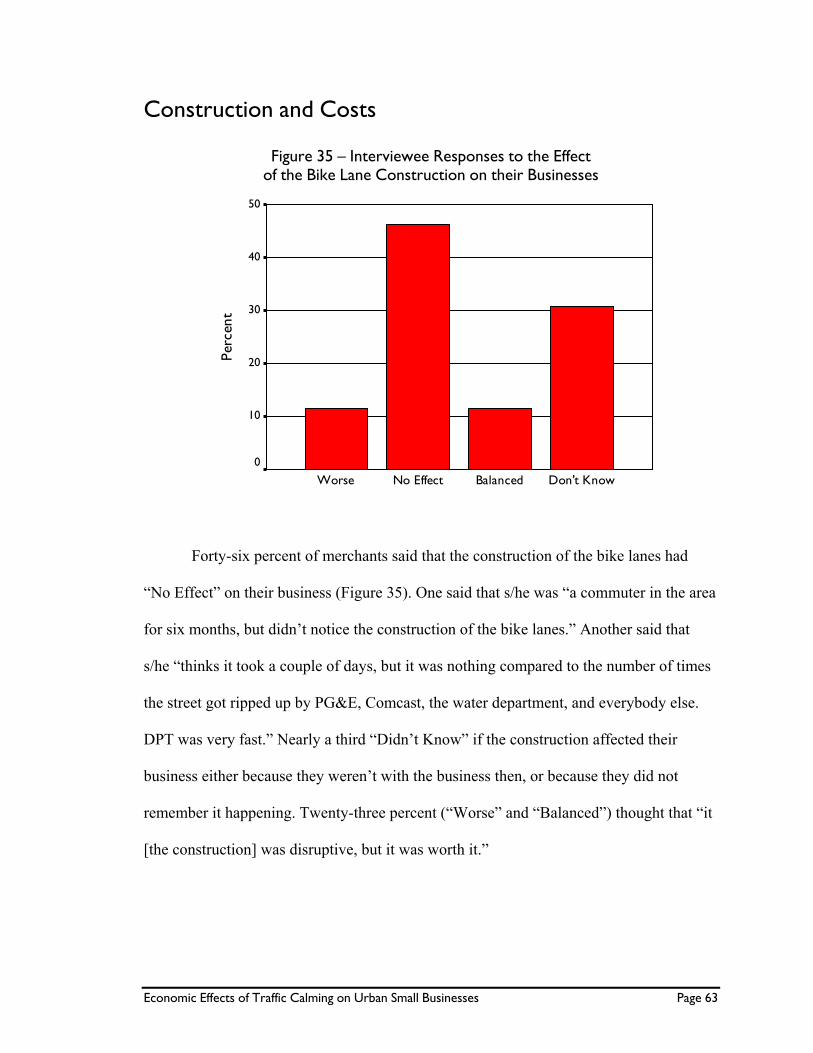
Economic Effects of Traffic Calming on Urban Small Businesses Page 63
Construction and Costs
Figure 35 — Interviewee Responses to the Effect of the Bike Lane Construction on their Businesses
Don't KnowBalancedNo EffectWorse
Perc
ent
50
40
30
20
10
0
Forty-six percent of merchants said that the construction of the bike lanes had
“No Effect” on their business (Figure 35). One said that s/he was “a commuter in the area
for six months, but didn’t notice the construction of the bike lanes.” Another said that
s/he “thinks it took a couple of days, but it was nothing compared to the number of times
the street got ripped up by PG&E, Comcast, the water department, and everybody else.
DPT was very fast.” Nearly a third “Didn’t Know” if the construction affected their
business either because they weren’t with the business then, or because they did not
remember it happening. Twenty-three percent (“Worse” and “Balanced”) thought that “it
[the construction] was disruptive, but it was worth it.”
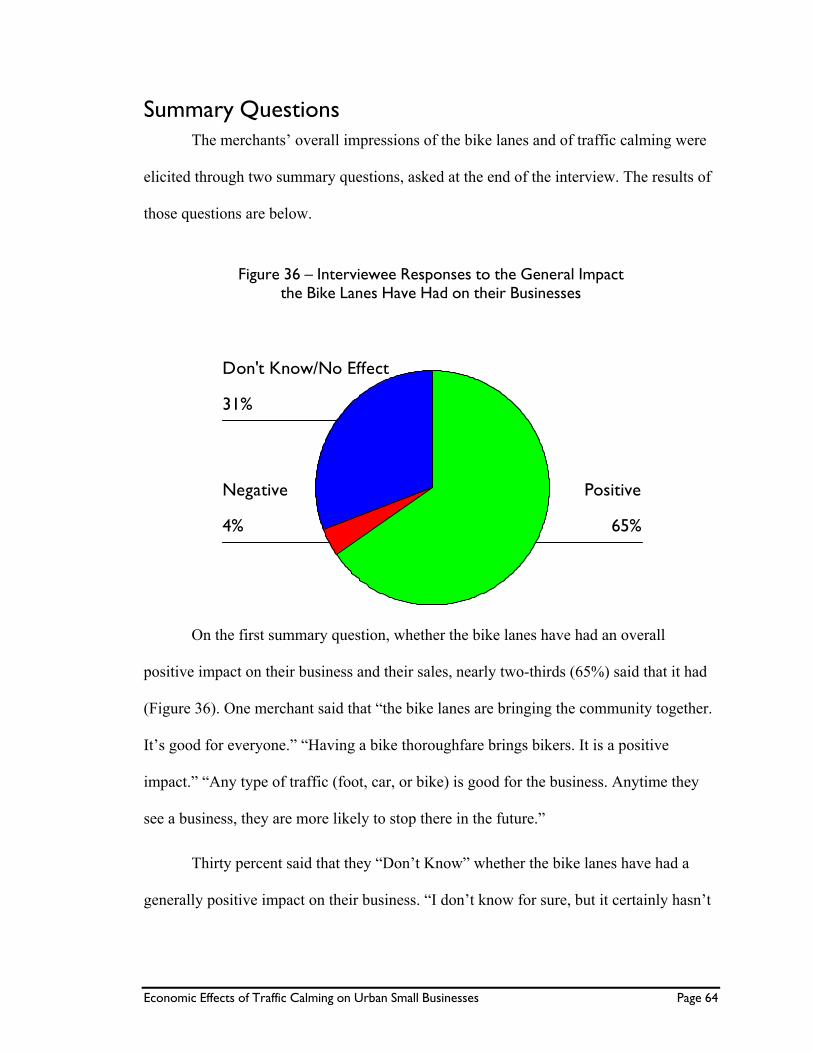
Economic Effects of Traffic Calming on Urban Small Businesses Page 64
Summary Questions The merchants’ overall impressions of the bike lanes and of traffic calming were
elicited through two summary questions, asked at the end of the interview. The results of
those questions are below.
Figure 36 — Interviewee Responses to the General Impact the Bike Lanes Have Had on their Businesses
31%
4% 65%
Don't Know/No Effect
Negative Positive
On the first summary question, whether the bike lanes have had an overall
positive impact on their business and their sales, nearly two-thirds (65%) said that it had
(Figure 36). One merchant said that “the bike lanes are bringing the community together.
It’s good for everyone.” “Having a bike thoroughfare brings bikers. It is a positive
impact.” “Any type of traffic (foot, car, or bike) is good for the business. Anytime they
see a business, they are more likely to stop there in the future.”
Thirty percent said that they “Don’t Know” whether the bike lanes have had a
generally positive impact on their business. “I don’t know for sure, but it certainly hasn’t
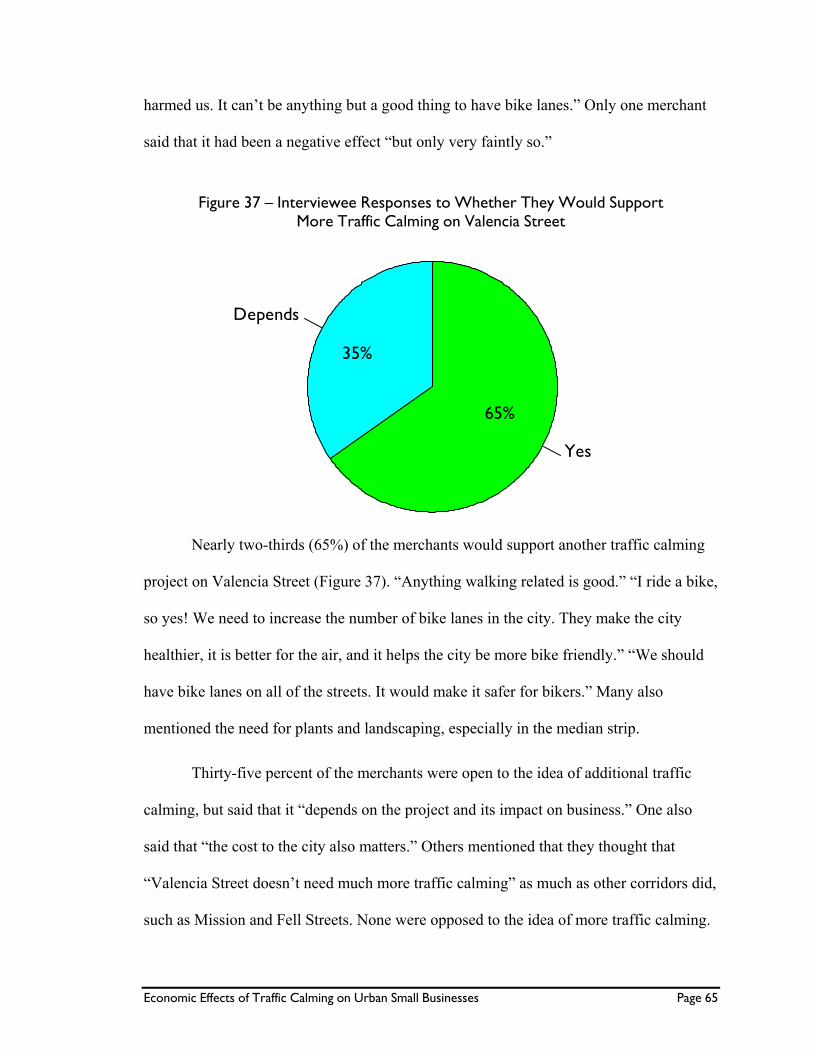
Economic Effects of Traffic Calming on Urban Small Businesses Page 65
harmed us. It can’t be anything but a good thing to have bike lanes.” Only one merchant
said that it had been a negative effect “but only very faintly so.”
Figure 37 — Interviewee Responses to Whether They Would Support More Traffic Calming on Valencia Street
35%
65%
Depends
Yes
Nearly two-thirds (65%) of the merchants would support another traffic calming
project on Valencia Street (Figure 37). “Anything walking related is good.” “I ride a bike,
so yes! We need to increase the number of bike lanes in the city. They make the city
healthier, it is better for the air, and it helps the city be more bike friendly.” “We should
have bike lanes on all of the streets. It would make it safer for bikers.” Many also
mentioned the need for plants and landscaping, especially in the median strip.
Thirty-five percent of the merchants were open to the idea of additional traffic
calming, but said that it “depends on the project and its impact on business.” One also
said that “the cost to the city also matters.” Others mentioned that they thought that
“Valencia Street doesn’t need much more traffic calming” as much as other corridors did,
such as Mission and Fell Streets. None were opposed to the idea of more traffic calming.
Economic Effects of Traffic Calming on Urban Small Businesses Page 66
Discussion
Economic Revitalization and Property Values While the literature suggests that traffic calming projects often lead to increased
commercial and residential property values (Local Government Commission’s Center for
Livable Communities, 2000; Eichenfeld and Associates and the Local Government
Commission, 2002), 85% of merchants along Valencia Street either didn’t know or didn’t
think that the bike lanes had any positive effect on property values. Many merchants still
questioned the causality, but 44% were willing to assign credit to the bike lanes with
economic revitalization. Even though many merchants didn’t know if the bike lanes
could bring increased property values or economic revitalization, most were certain that
they “couldn’t hurt” and none thought that they could harm economic conditions.
Several factors might explain these results, including that the Valencia Street
bicycle lane project was too limited in scope. In contrast, the case studies in the
California Main Streets Program, Lodi (CA), and West Palm Beach all incorporated
substantial street, sidewalk, and building façade changes, in addition to some sort of
incentives for economic development. Several merchants also mentioned a variety of
factors external to Valencia Street that they believed had more impact on the area than
the bike lanes, including the national and local economies, the policies of the federal
government, the terrorist attacks of 9/11/2001, and other changes in the neighborhood.
Perhaps if the traffic calming project were greater in scope and the local economy had not
been through a recent period of turbulence, more merchants might see a concrete
connection between the project and business conditions.
Economic Effects of Traffic Calming on Urban Small Businesses Page 67
Attractiveness and Safety
Making the Street Attractive
Valencia Street merchants agreed that attractiveness of a streetscape is important
for attracting business. Nearly three-quarters of the merchants thought that the bike lanes
succeeded in creating a “nicer and prettier” street. Valencia Street already had many of
the characteristics of a successful commercial district as defined in the literature (Burden,
2001; Kohl, 1999), including wide sidewalks, businesses located with entrances close to
the sidewalk, large storefronts that face the sidewalk and are contiguous to each other,
street parking (and now bike lanes) that provide a physical barrier between pedestrians
and the street, one narrow car lane in each direction (now), and a variety of architectural
styles to create interest. Also important is that Valencia Street is very densely populated,
located close to plentiful public transit, and very heavily mixed-use, with residential,
commercial, retail, and government uses next to each other. For these reasons, Valencia
Street was an appropriate location for additional traffic calming, such as the bike lanes.
Reducing Auto Speed
A surprising number of merchants felt that reduced auto speed (46%) and
increased congestion on Valencia Street (41%) were good for retail businesses, for many
of the same reasons mentioned in the literature (Burden, 2001; Nozzi, 2002; Tumlin,
2003). Many merchants (26%) also spoke of the trade-offs involved in increasing
congestion, which include benefits such as more people seeing the stores, drivers who
can more easily decide to pull over and go shopping in the spur of the moment, and
drivers who can better see what stores there are and what they are offering. Negatives
Economic Effects of Traffic Calming on Urban Small Businesses Page 68
include losing potential customers who will avoid traveling (and consequentially
shopping) along the traffic-calmed street altogether. Over half of the merchants (52%)
felt that increased congestion on nearby streets would have “no effect” on their business,
which may mean that most of the effects of traffic calming are highly localized.
If the merchants on Valencia Street are any indication, urban jurisdictions in the
United States might have surprisingly strong support from small businesses for setting
both maximum and minimum levels of congestion in commercial areas, as was done in
Western Australia. The nearly universally-accepted system of grading intersections based
on seconds of auto delay (Levels of Service, or LOS), would need to be retooled or
replaced for use in setting “ideal” congestion levels because it does not recognize any
benefits of increased congestion, including congestion that results from increasing access
for transit or other alternative forms of transportation (such as bike lanes).
Increasing Safety
Sixty-two percent of merchants felt that the bike lanes increased safety for
pedestrians, which supports what is in the literature (Burden, 2001). Many merchants
mentioned that the bike lanes specifically increased pedestrian safety because it got most
of the bicycles off of the sidewalks (although bikes on the sidewalks was identified as
remaining a problem). Data summarized by the Department of Parking and Traffic
indicates that pedestrian safety did increase following the installation of the bike lanes.
Although the results are not statistically significant,8 the trends include a 15% reduction
in pedestrian and injury collisions, as well as in the total number of collisions. Bicycle
collisions increased 19%, but that figure is outpaced by a 144% increase in bicycle usage
on Valencia Street (Sallaberry, 2000, pp. 4-5).
Economic Effects of Traffic Calming on Urban Small Businesses Page 69
Sales and Attracting Customers
Increased Sales
A little over a third (37%) of merchants believed that the bike lanes could increase
their businesses’ sales while a majority of merchants were unsure that the bike lanes
would have any positive effect on their sales (60% responded “No Effect” or “Don’t
Know”). Many interviewees mentioned that although they couldn’t definitively credit the
bike lanes with increasing sales, the bike lanes “certainly couldn’t hurt.” None of the
merchants thought that the bike lanes would have an overall damaging effect on their
sales. These results support findings from the California Main Streets Program
(Eichenfeld and Associates and the Local Government Commission, 2002) where retail
sales grew 105%; West Palm Beach (Local Government Commission’s Center for
Livable Communities, 2000), which saw business increase in their downtown; and Lodi,
CA (Local Government Commission’s Center for Livable Communities, 2000), which
saw a 30% increase in downtown sales tax revenues after their traffic calming/economic
revitalization projects were implemented. Econometric modeling based on existing data,
such as sales tax receipts, may be a more powerful tool than interviewing merchants for
learning whether traffic calming projects increase sales for small businesses.
More Walking and Biking Customers
While this survey did not study changes in discretionary income from reductions
in car ownership or shifts in transportation modes, many merchants thought that the bike
lanes did bring them increased numbers of biking (63%) and walking (22%) customers. A
few merchants mentioned that the bike lanes may have brought new cyclists to the street
Economic Effects of Traffic Calming on Urban Small Businesses Page 70
because Valencia Street now serves as a main north-south thoroughfare for bicyclists.
Several interviewees mentioned that their businesses “have always had many biking and
walking customers” due to the nature of the area and/or their businesses. Perhaps if the
bike lanes had been installed in an area that did not already have many of the attributes of
a successful commercial district (see the “Making the Street Attractive” section), more of
an increase in biking and walking customers might have been reported.
More Customers from Within and Outside the Neighborhood
Fifty-six percent of merchants felt that the bike lanes help local residents do more
of their shopping locally. This finding supports the literature (Lawton, 2001; Hess and
Ong, 2001; Krizek, 2001), which found that people who live in neighborhoods with more
transit, walking, and/or biking facilities make more of their shopping and other errand
trips close to home.
The same percentage of merchants (44%) thought that the bike lanes would bring
in new customers from outside the neighborhood as thought that there would be no effect.
A couple of the merchants described their stores as “destinations” which attract shoppers
from all over the city. In contrast, other merchants described their stores as primarily
“neighborhood-based” because a majority of their customers come from the immediate
area. The different types of businesses may impact how many new customers patronize a
store after a traffic calming project has been implemented.
Economic Effects of Traffic Calming on Urban Small Businesses Page 71
Parking
Customer Parking
The availability of customer parking is often another major concern for many
urban small businesses. Because the construction of the Valencia Street bicycle lanes did
not remove any parking, the vast majority of interviewees (65%) felt that the project had
not impacted parking. Of those that noticed a change, 15% thought that parking had
gotten easier, and 12% felt that it had gotten worse. Many merchants, even those who
thought that the parking situation had gotten better, expressed frustration over a chronic
need for more parking in the area.
The literature has found that building additional subsidized parking can often
make a bad situation worse by creating an even larger unmet demand for parking
(Merrimam, 1997). Metered or short-term parking spaces might serve the best interests of
urban small businesses by providing greater efficiency through higher turn-over of users
(which means more potential customers). The conflict between the conclusions of traffic
calming research and merchants’ almost universal desire for more subsidized parking
near their businesses will continue to be problematic until research is done to document
how adding and/or removing parking impacts parking demand, and by extension, urban
small businesses.
Seventy percent of merchants surveyed reported that that the middle turning lane
was vital for providing a temporary place for people to leave their cars while they
“popped in and out” of a store, and so that delivery trucks could be out of the path of
traffic during deliveries. Several merchants wanted DPT and the San Francisco Police
Department to provide more consistent parking enforcement of the middle turning lanes.
Economic Effects of Traffic Calming on Urban Small Businesses Page 72
One merchant thought that DPT should have taken the space currently used by the middle
turning lane to widen the sidewalks and to install angled parking along one side of the
street. Others thought the middle lane should be landscaped and made more attractive.
Deliveries
Although more merchants felt that it became more difficult to receive deliveries
after the bike lanes were installed (39%) than those who thought that deliveries had
gotten easier (35%), issues surrounding deliveries and delivery truck access surfaced in
nearly every interview. This universal concern could be likely because businesses of all
types and sizes receive deliveries. Any traffic calming project impacting urban small
businesses should make sure to factor delivery truck access into the street design, or risk
losing small business support.
Impact on Employees While the broader impacts of gridlock and congestion on employees were outside
the scope of the Valencia Street Bike Lane Merchant Survey, over two-thirds of
merchants (67%) felt that the bike lanes provided added convenience for their employees,
especially for those that ride bikes to work. The literature has suggested that cities with
accessible and comprehensive public transportation, like San Francisco, may fare
economically better than cities that experience chronic auto congestion (Cervero, 2000).
The Valencia Street bike lanes and other traffic calming projects that have the goal of
reducing auto-dependence and congestion should prove beneficial to urban small
businesses in their role as employers.
Economic Effects of Traffic Calming on Urban Small Businesses Page 73
Construction and Costs Most merchants (77%) either didn’t remember the construction of the Valencia
Street bicycle lanes, or thought that it did not have impact their businesses very much.
This finding supports the idea that certain traffic calming projects can be implemented
quickly. As well, the Valencia Street bicycle lanes were funded almost entirely through
city government (the San Francisco Bicycle Coalition used its own resources to conduct
extensive community outreach and organizing around this project).
Summary Questions
General Impact on Business and Sales
Nearly two-thirds of merchants (65%) reported that the Valencia Street bicycle
lanes have had an overall positive impact on their business and/or sales, while another
30% did not think that the bike lanes had any impact. Only one merchant thought that the
bike lanes had had an overall negative impact on their business (although only a “slightly
negative” impact).
This result, taken nearly four and a half years after the lanes were installed, is
encouraging because many more merchants often initially oppose a traffic calming
project than ended up opposing it after it had been in place for a substantial period of
time.
Support more Traffic Calming on Valencia Street
The same percentage of merchants who reported that the bike lanes had a positive
impact on their businesses (64%) also expressed a willingness to support other kinds of
traffic calming projects on Valencia Street, such as landscaping, planting street trees,
Economic Effects of Traffic Calming on Urban Small Businesses Page 74
widening sidewalks, and making improvements for transit. The other merchants (35%)
said that they would support more traffic calming on Valencia Street, depending on what
the projects were. Some of these merchants felt uncomfortable generalizing that they
would welcome all kinds of projects, whereas others wanted to find out how each project
would impact their business before they would decide about giving their support. From
their experience with the Valencia Street bicycle lanes, none of the merchants became
opposed to traffic calming as a concept or a practice. This result will be helpful to share
with merchants who are learning about a traffic calming project being proposed for their area.
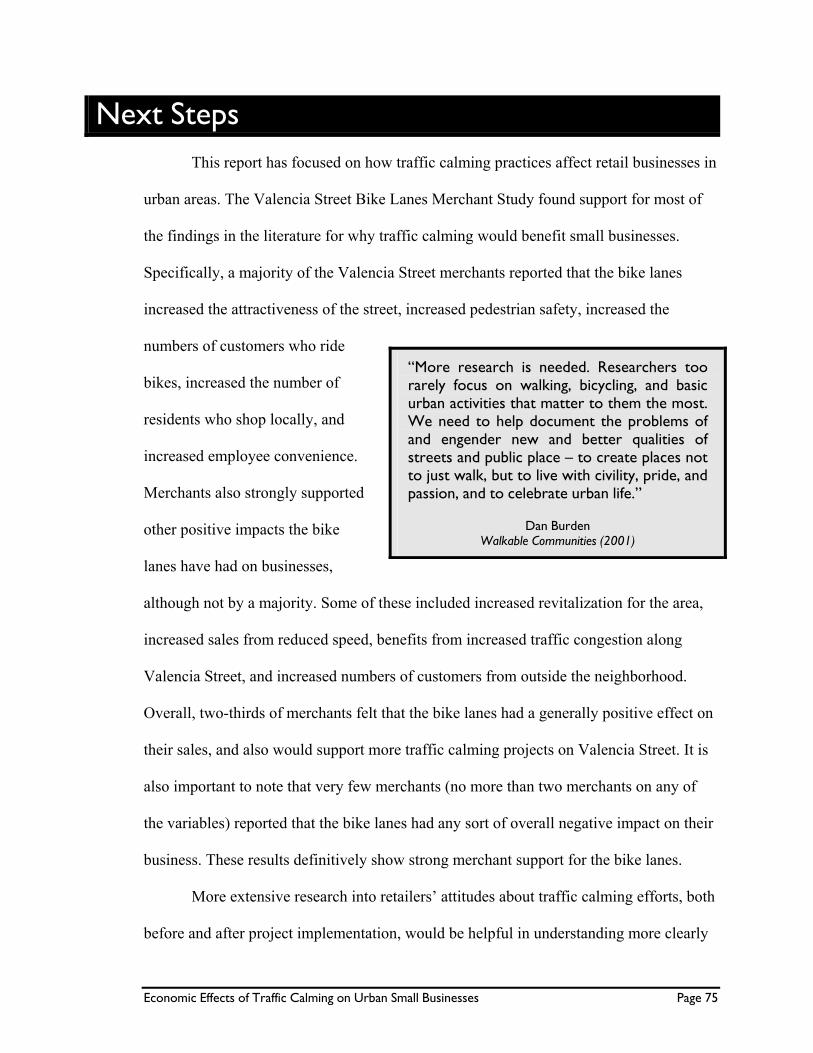
Economic Effects of Traffic Calming on Urban Small Businesses Page 75
Next Steps This report has focused on how traffic calming practices affect retail businesses in
urban areas. The Valencia Street Bike Lanes Merchant Study found support for most of
the findings in the literature for why traffic calming would benefit small businesses.
Specifically, a majority of the Valencia Street merchants reported that the bike lanes
increased the attractiveness of the street, increased pedestrian safety, increased the
numbers of customers who ride
bikes, increased the number of
residents who shop locally, and
increased employee convenience.
Merchants also strongly supported
other positive impacts the bike
lanes have had on businesses,
although not by a majority. Some of these included increased revitalization for the area,
increased sales from reduced speed, benefits from increased traffic congestion along
Valencia Street, and increased numbers of customers from outside the neighborhood.
Overall, two-thirds of merchants felt that the bike lanes had a generally positive effect on
their sales, and also would support more traffic calming projects on Valencia Street. It is
also important to note that very few merchants (no more than two merchants on any of
the variables) reported that the bike lanes had any sort of overall negative impact on their
business. These results definitively show strong merchant support for the bike lanes.
More extensive research into retailers’ attitudes about traffic calming efforts, both
before and after project implementation, would be helpful in understanding more clearly
“More research is needed. Researchers too rarely focus on walking, bicycling, and basic urban activities that matter to them the most. We need to help document the problems of and engender new and better qualities of streets and public place — to create places not to just walk, but to live with civility, pride, and passion, and to celebrate urban life.”
Dan Burden Walkable Communities (2001)
Economic Effects of Traffic Calming on Urban Small Businesses Page 76
what is important to small businesses and how best to meet their unique needs.
Econometric studies (especially based on annual tax receipts, assessed property values,
and rents for multiple jurisdictions) could perhaps more definitively determine what
benefits traffic calming brings to urban small businesses. This approach could be
especially helpful for the variables that the merchants in this study were reluctant to
credit the bike lanes for improving (such as property values and sales).
Outreach brochures and public presentations should be developed for an audience
of urban small businesses, which would provide general information about traffic
calming, information about how it has affected other merchants, and how the proposed
project will specifically impact their businesses. Business owners could then use this
information to make an informed decision about whether to support the project.
Hopefully, information of this kind will reduce initial opposition and increase community
support for traffic calming projects. This could, in turn, reduce the time and costs
required for project implementation, which could then increase the number and scope of
traffic calming projects a jurisdiction is able to complete. Community involvement in
transportation planning could also be positively impacted.
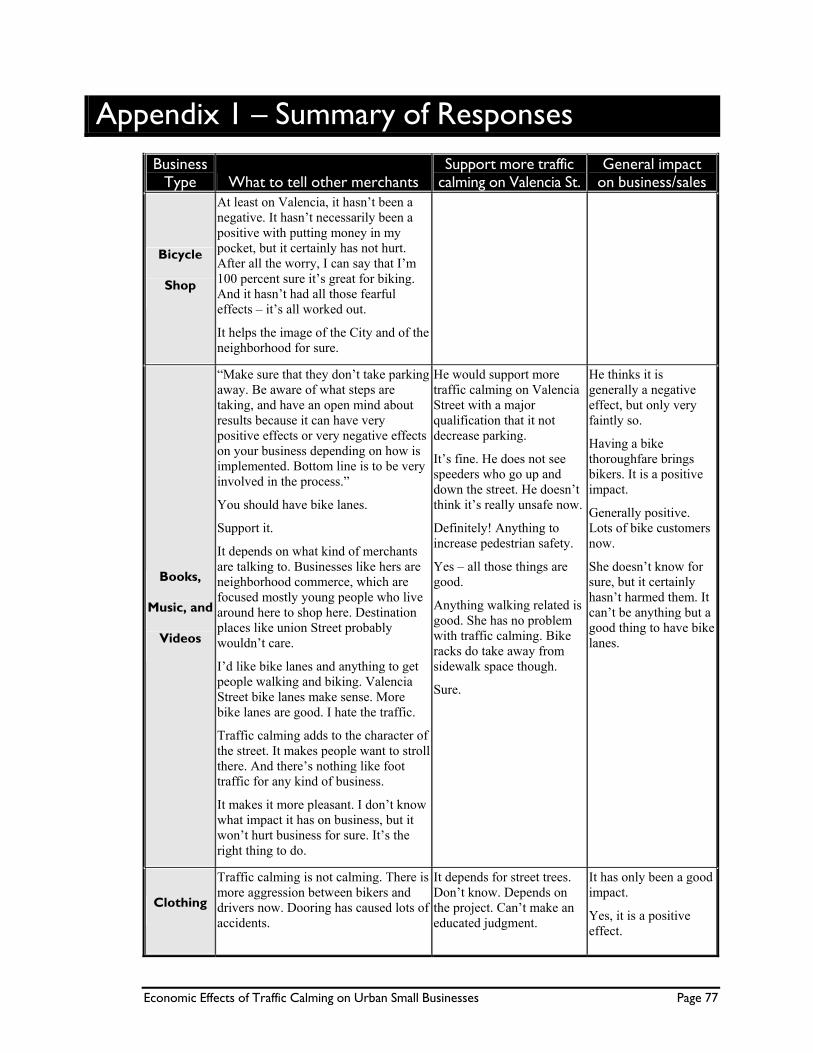
Economic Effects of Traffic Calming on Urban Small Businesses Page 77
Appendix 1 — Summary of Responses Business
Type What to tell other merchants Support more traffic
calming on Valencia St. General impact
on business/sales
Bicycle
Shop
At least on Valencia, it hasn’t been a negative. It hasn’t necessarily been a positive with putting money in my pocket, but it certainly has not hurt. After all the worry, I can say that I’m 100 percent sure it’s great for biking. And it hasn’t had all those fearful effects – it’s all worked out.
It helps the image of the City and of the neighborhood for sure.
Books,
Music, and
Videos
“Make sure that they don’t take parking away. Be aware of what steps are taking, and have an open mind about results because it can have very positive effects or very negative effects on your business depending on how is implemented. Bottom line is to be very involved in the process.”
You should have bike lanes.
Support it.
It depends on what kind of merchants are talking to. Businesses like hers are neighborhood commerce, which are focused mostly young people who live around here to shop here. Destination places like union Street probably wouldn’t care.
I’d like bike lanes and anything to get people walking and biking. Valencia Street bike lanes make sense. More bike lanes are good. I hate the traffic.
Traffic calming adds to the character of the street. It makes people want to stroll there. And there’s nothing like foot traffic for any kind of business.
It makes it more pleasant. I don’t know what impact it has on business, but it won’t hurt business for sure. It’s the right thing to do.
He would support more traffic calming on Valencia Street with a major qualification that it not decrease parking.
It’s fine. He does not see speeders who go up and down the street. He doesn’t think it’s really unsafe now.
Definitely! Anything to increase pedestrian safety.
Yes – all those things are good.
Anything walking related is good. She has no problem with traffic calming. Bike racks do take away from sidewalk space though.
Sure.
He thinks it is generally a negative effect, but only very faintly so.
Having a bike thoroughfare brings bikers. It is a positive impact.
Generally positive. Lots of bike customers now.
She doesn’t know for sure, but it certainly hasn’t harmed them. It can’t be anything but a good thing to have bike lanes.
Clothing
Traffic calming is not calming. There is more aggression between bikers and drivers now. Dooring has caused lots of accidents.
It depends for street trees. Don’t know. Depends on the project. Can’t make an educated judgment.
It has only been a good impact.
Yes, it is a positive effect.
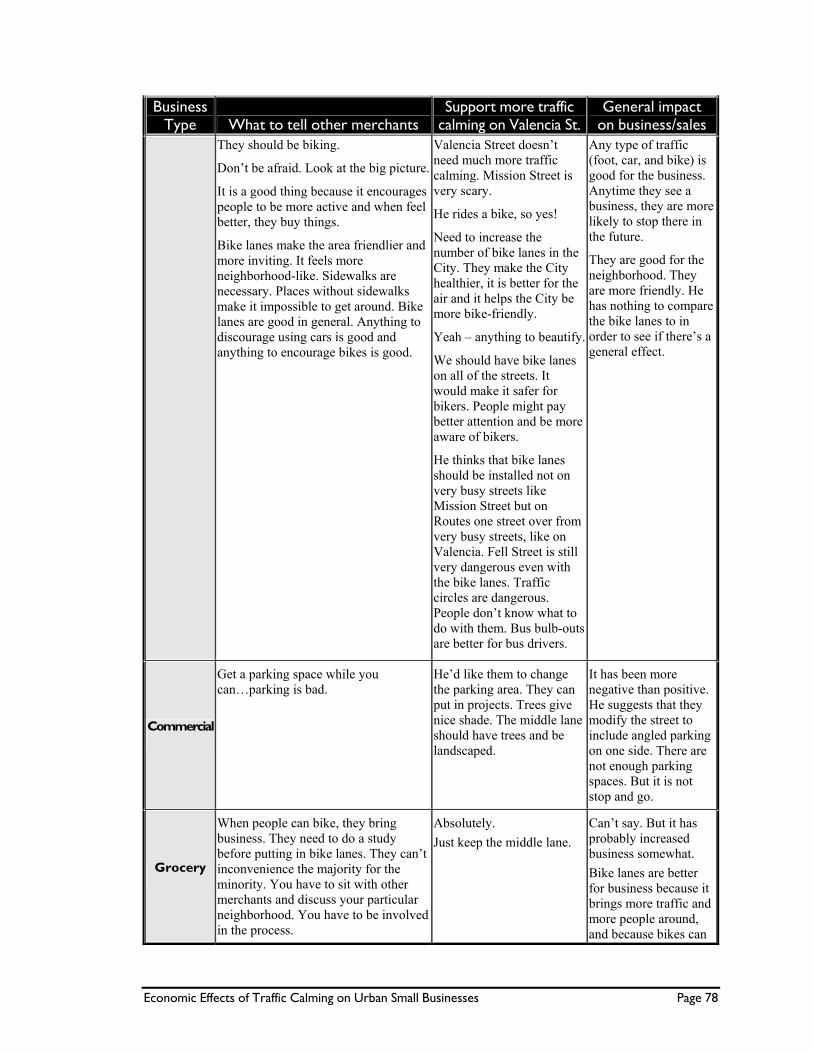
Economic Effects of Traffic Calming on Urban Small Businesses Page 78
Business Type What to tell other merchants
Support more traffic calming on Valencia St.
General impact on business/sales
They should be biking.
Don’t be afraid. Look at the big picture.
It is a good thing because it encourages people to be more active and when feel better, they buy things.
Bike lanes make the area friendlier and more inviting. It feels more neighborhood-like. Sidewalks are necessary. Places without sidewalks make it impossible to get around. Bike lanes are good in general. Anything to discourage using cars is good and anything to encourage bikes is good.
Valencia Street doesn’t need much more traffic calming. Mission Street is very scary.
He rides a bike, so yes!
Need to increase the number of bike lanes in the City. They make the City healthier, it is better for the air and it helps the City be more bike-friendly.
Yeah – anything to beautify.
We should have bike lanes on all of the streets. It would make it safer for bikers. People might pay better attention and be more aware of bikers.
He thinks that bike lanes should be installed not on very busy streets like Mission Street but on Routes one street over from very busy streets, like on Valencia. Fell Street is still very dangerous even with the bike lanes. Traffic circles are dangerous. People don’t know what to do with them. Bus bulb-outs are better for bus drivers.
Any type of traffic (foot, car, and bike) is good for the business. Anytime they see a business, they are more likely to stop there in the future.
They are good for the neighborhood. They are more friendly. He has nothing to compare the bike lanes to in order to see if there’s a general effect.
Commercial
Get a parking space while you can…parking is bad.
He’d like them to change the parking area. They can put in projects. Trees give nice shade. The middle lane should have trees and be landscaped.
It has been more negative than positive. He suggests that they modify the street to include angled parking on one side. There are not enough parking spaces. But it is not stop and go.
Grocery
When people can bike, they bring business. They need to do a study before putting in bike lanes. They can’t inconvenience the majority for the minority. You have to sit with other merchants and discuss your particular neighborhood. You have to be involved in the process.
Absolutely. Just keep the middle lane.
Can’t say. But it has probably increased business somewhat. Bike lanes are better for business because it brings more traffic and more people around, and because bikes can
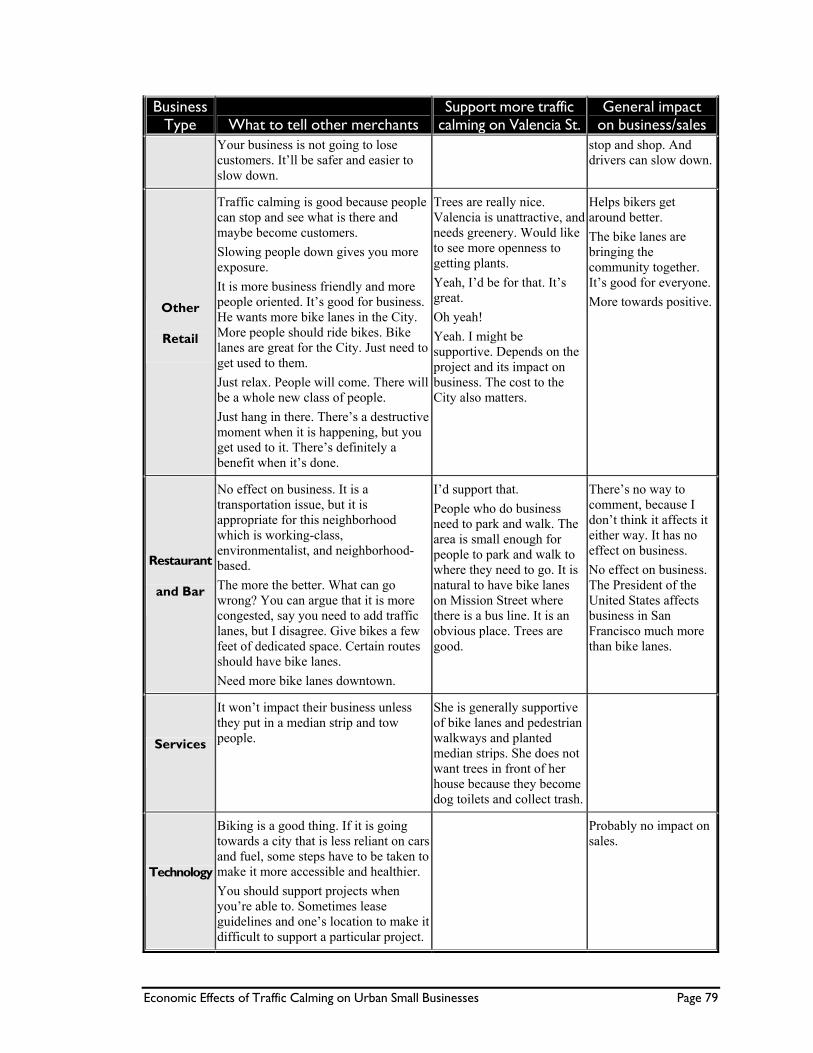
Economic Effects of Traffic Calming on Urban Small Businesses Page 79
Business Type What to tell other merchants
Support more traffic calming on Valencia St.
General impact on business/sales
Your business is not going to lose customers. It’ll be safer and easier to slow down.
stop and shop. And drivers can slow down.
Other
Retail
Traffic calming is good because people can stop and see what is there and maybe become customers. Slowing people down gives you more exposure. It is more business friendly and more people oriented. It’s good for business. He wants more bike lanes in the City. More people should ride bikes. Bike lanes are great for the City. Just need to get used to them. Just relax. People will come. There will be a whole new class of people. Just hang in there. There’s a destructive moment when it is happening, but you get used to it. There’s definitely a benefit when it’s done.
Trees are really nice. Valencia is unattractive, and needs greenery. Would like to see more openness to getting plants. Yeah, I’d be for that. It’s great. Oh yeah! Yeah. I might be supportive. Depends on the project and its impact on business. The cost to the City also matters.
Helps bikers get around better. The bike lanes are bringing the community together. It’s good for everyone. More towards positive.
Restaurant
and Bar
No effect on business. It is a transportation issue, but it is appropriate for this neighborhood which is working-class, environmentalist, and neighborhood-based. The more the better. What can go wrong? You can argue that it is more congested, say you need to add traffic lanes, but I disagree. Give bikes a few feet of dedicated space. Certain routes should have bike lanes. Need more bike lanes downtown.
I’d support that. People who do business need to park and walk. The area is small enough for people to park and walk to where they need to go. It is natural to have bike lanes on Mission Street where there is a bus line. It is an obvious place. Trees are good.
There’s no way to comment, because I don’t think it affects it either way. It has no effect on business. No effect on business. The President of the United States affects business in San Francisco much more than bike lanes.
Services
It won’t impact their business unless they put in a median strip and tow people.
She is generally supportive of bike lanes and pedestrian walkways and planted median strips. She does not want trees in front of her house because they become dog toilets and collect trash.
Technology
Biking is a good thing. If it is going towards a city that is less reliant on cars and fuel, some steps have to be taken to make it more accessible and healthier. You should support projects when you’re able to. Sometimes lease guidelines and one’s location to make it difficult to support a particular project.
Probably no impact on sales.
Economic Effects of Traffic Calming on Urban Small Businesses Page 80
Endnotes 1 The Main Street Program encompasses more than just traffic calming, so it is impossible to tell which part of these gains/losses is
due to traffic calming alone. 2 If a street is too wide, pedestrians can’t see the storefronts on the other side, which effectively makes the street act as two separate
streets rather than as a single retail environment. 3 Human perception studies have found that we can recognize human faces, process complex information about the surrounding
landscape, and suffer only minor injuries in a crash up to 18 mph. At faster than 18 mph, our ability to absorb information about our surroundings rapidly diminishes to the point where giant billboards are all we can take in.
4 Livable Streets: www.livablestreets.org; Friends of the Urban Forest: www.fuf.org; San Francisco Parking and Traffic’s Bicycle Program: http://bicycle.sfgov.org/site/dptbike_index.asp.
5 Random selection was ensured through selecting planning blocks through use of a random number generator. In certain cases when the planning block selected did not include a business eligible for this study, nearby businesses were substituted.
6 For these questions, the sample size was n=26 because one merchant was unable to finish the interview. 7 The question about the construction of the bike lanes affecting business also had a very high percentage of “No Effect” and “Don’t
Know” combined. However, the meaning of “No Effect” is slightly different in the construction question, as it refers to a potentially problematic variable having no effect (which is different from a potentially positive variable having no effect.)
8 The results are not statistically significant due to the short time span of the “after” period (one year) and a lack of substantial “before” data.
Economic Effects of Traffic Calming on Urban Small Businesses Page 81
Bibliography Abel, Heather. July 28, 1999. Best of the Bay 1999 Local Heroes: San Francisco Bicycle Coalition. San
Francisco Bay Guardian. Retrieved November 5, 2003, from www.bestofthebay.com/1999/bike.html.
Aspelin, Karen. 1998. Recruiting Private Help for a Public Demonstration Project: Taking the Hump Out of Traffic Calming. Presented at the Institute of Transportation Engineers International Conference, Washington, DC.
Boarnet, Marlon and S. Sarmiento. December 1, 1996. Can Land Use Policy Really Affect Travel Behavior? A Study of the Link Between Non-Work Travel and Land Use Characteristics. Center for Activity Systems Analysis. Retrieved September 28, 2002, from http://repositories.cdlib.org/itsirvine/casa/ UCI-ITS-AS-WP-96-5.
Boarnet, Marlon and Michael J. Greenwald. July 1, 2001. The Built Environment as a Determinant of Walking Behavior: Analyzing Non-Work Pedestrian Travel Behavior in Portland, Oregon. Center for Activity Systems Analysis. Retrieved September 27, 2002, from http://repositories.cdlib.org/itsirvine/casa/ UCI-ITS-AS-WP-01-4.
Burden, Dan. January 8, 2001. Building Communities with Transportation. Online Distinguished Lecture Presentation from the Transportation Research Board. Retrieved October 7, 2002, from www.lgc.org/freepub/land_use/presentations/burden_01_08_2001/.
Cervero, Robert. 2000. Efficient Urbanization: Economic Performance and the Shape of the Metropolis. Lincoln Institute of Land Policy. Retrieved December 1, 2002, from www.lincolninst.edu/pubs/pub-detail.asp?id=88.
Crane, Randall and Richard Crepeau. January 1998. Does Neighborhood Design Influence Travel?: Behavioral Analysis of Travel Diary and GIS Data. The University of California Transportation Center. Retrieved October 16, 2002, http://repositories.cdlib.org/itsirvine/casa/UCI-ITS-AS-WP-98-4/.
Eichenfeld and Associates and the Local Government Commission. July 2002. Strategies for Revitalizing Our Downtowns and Neighborhoods: Evaluating California Main Street Programs. Retrieved October 12, 2002, from www.lgc.org/freepub/PDF/Land_Use/reports/evaluating_main_street1.pdf.
Edwards, J. D. 1996. Downtown Traffic and Parking Needs Related to Downtown Economic Trends. Transportation Research Record, 1552:107-111.
Ewing, Reid. 1999. Traffic Calming: State of the Practice. Institute of Transportation Engineers/U.S. Federal Highway Administration. Retrieved December 6, 2003, from www.ite.org/traffic/tcstate.htm#tcsop.
Forkenbrock, David J., Shauna Benshoff, and Glen Weisbrod. February, 2001. Assessing the Social and Economic Effects of Transportation Projects. NCHRP Web Document 31 (Project B25-19). Retrieved December 4, 2003, from http://gulliver.trb.org/publications/nchrp/nchrp_rpt_456-a.pdf.
Goodwin, P. B. September 13-17, 1993. New Transport Policies: What Can Go Wrong? Transport Policy and its Implementation. Presented at the PTRC European Transport, Highways and Planning 21st Summer Annual Meeting, UMIST. Manchester, England. www.cts.ucl.ac.uk/pbgcv98.htm#conf.
Goodwin, P. B. March 24-25, 1994. Outward Bound. Presented at the Car Free Cities conference, Amsterdam. www.cts.ucl.ac.uk/pbgcv98.htm.
Hass-Klau, C. 1993. Impact of Pedestrianization and Traffic Calming on Retailing: A Review of the Evidence from Germany and the UK. Transport Policy, 1(1):21-31.
Hess, Daniel and Paul M. Ong. July 2001. Traditional Neighborhoods and Auto Ownership. The Ralph and Goldy Lewis Center for Regional Policy Studies. Retrieved November 1, 2002, from http://repositories.cdlib.org/lewis/wps/37/.
Economic Effects of Traffic Calming on Urban Small Businesses Page 82
Krizek, Kevin J. December 2001. Neighborhood Services, Trip Purpose, and Tour-Based Travel. Transportation. Retreived December 8, 2003 from www.hhh.umn.edu/people/kkrizek/Trip%20Tours,%20Transportation.pdf.
Kohl, Joseph. June 5, 1999. Transforming Main Street Retail. Summary of plenary speech of the Congress for the New Urbanism. Retrieved November 7, 2002, from www.cnu.org/pdf/Kohl.pdf.
Lawton, T. Keith. 2001. The Urban Structure and Personal Travel: An Analysis of Portland, Oregon Data and Some National and International Data. Supplementary Materials: Papers and Analyses for the E-Vision 2000 Conference. Retrieved November 6, 2002, from www.rand.org/scitech/stpi/Evision/Supplement/.
Litman, Todd. July 29, 2002. Economic Value of Walkability. Victoria Transport Policy Institute. Retrieved September 23, 2002, from www.vtpi.org/walkability.pdf.
Local Government Commission’s Center for Livable Communities. 2000. The Economic Benefits of Walkable Communities. Retrieved September 23, 2002, from www.lgc.org/freepub/PDF/land_use/focus/walk_to_money.pdf.
Lockwood, Ian. July, 1997. ITE Traffic Calming Definition. ITE Journal, 67:22-24.
Lockwood, Ian and Timothy Stillings. 1998. Traffic Calming for Crime Reduction and Neighborhood Revitalization. Retreived April 6, 2003, from www.ite.org/traffic/documents/AHA98A19.pdf.
McAnn, Barbara. March 19, 2000. Driven to Spend: The Impact of Sprawl on Household Transportation Expenses. Retrieved December 5, 2003 from www.transact.org/report.asp?id=36.
Merriman, David. 1997. Subsidized Parking and Neighborhood Nuisances. Journal of Urban Economics, 41:198-201.
Missouri Department of Economic Development. n.d. Transportation and Economic Prosperity. Retrieved November 17, 2003, from www.ded.mo.gov.
Niles, John and Dick Nelson. 1999. Measuring the Success of Transit-Oriented Development: Retail Market Dynamics and Other Key Determinants. Presented at the APA National Planning Conference. Seattle, WA. Retrieved January 28, 2003, from www.asu.edu/caed/proceedings99/NILES/NILES.HTM.
Nelson, D., J. Niles, and A. Hibshoosh. September, 2001. A New Planning Template for Transit-Oriented Development. Mineta Transportation Institute. Retrieved October 12, 2002, from www.globaltelematics.com/mineta/Nelson-Niles_TOD_planning_template_Executive_Summary.pdf.
Nozzi, Dom. In praise of traffic calming. Retrieved December 5, 2003 from http://user.gru.net/domz/calm1.htm.
Nozzi, Dom. June, 2002. The economic merits of road diets and traffic calming. Retrieved December 5, 2003, from http://user.gru.net/domz/diet.htm.
Rajamani, Jayanthi, Chandra Bhat, Susan Handy, Gerritt Knaap, and Yan Song. 2003. Assessing the impact of urban form measures in nonwork trip mode choice after controlling for demographic and level-of-service effects. Transportation Research Board. Retrieved May 10, 2003, from www.its.berkeley.edu/publications/ITSReviewonline/ spring2003/trb2003/handy-assessing.pdf.
Roberts, J. 1990. The Greening of Urban Transport: Planning for Walking and Cycling in Western Cities. London: Belhaven.
Sallaberry, Mike. 2001. Valencia Street Bike Lane Study. San Francisco Department of Parking and Traffic.
Best of the Bay 1999 Editor’s Picks. July 28, 1999. San Francisco Bay Guardian. Retrieved November 5, 2003, from www.bestofthebay.com/1999/urban.html.
San Francisco Bicycle Coalition. 1999. Annual Report. Retrieved October 24, 2003, from www.sfbike.org.
San Francisco Department of Parking and Traffic. May 1, 2003. San Francisco Department of Parking and Traffic FY 2004 Budget. Retrieved October 2, 2003, from http://sfgov.org/budanalyst/dpt/execsum.htm
Economic Effects of Traffic Calming on Urban Small Businesses Page 83
Sermons, M. and Seredich, N. November, 2001. Assessing traveller responsiveness to land and location based accessibility and mobility solutions. Transportation Research Part D: Transport and Environment Volume 6, Issue 6, pp. 417-428.
Best City Transportation Improvement. May 17, 2000. SF Weekly. Retreived November 28, 2003 from www.sfweekly.com.
Schwager, Dianne S. June, 1995. An Evaluation of the Relationships Between Transit and Urban Form. Transit Cooperative Research Program Sponsored by the Federal Transit Administration. Retrieved December 1, 2002, from gulliver.trb.org/publications/tcrp/tcrp_rrd_07.pdf.
Driven to Spend: The Impact of Sprawl on Household Transportation Expenses. March 19, 2000. Surface Transportation Policy Project online report. Retrieved February 7, 2003, from http://transact.org/states/metro.asp?s=california.
Toronto City Council. May 21, 2002. Toronto Pedestrian Charter. Retrieved April 2, 2003, from www.city.toronto.on.ca/pedestrian/pdf/charter.pdf.
Tumlin, Jeffrey. 2003. Informal conservation with author.
Transportation Cost and Benefit Analysis – Evaluating Criticism of Transportation Costing. October, 2002. Victoria Transport Policy Institute. Retrieved November 29, 2002, from www.vpti.org.
Economic Effects of Traffic Calming on Urban Small Businesses Page 84
Credits I would like to thank the Public Administration Program at San Francisco State
University for providing me with a solid understanding of government from “the inside
out”. I hope that I will be able to put this knowledge into good use by working with
government from “the outside in” as an elected official.
Specifically, the following people deserve special acknowledgement for their
contributions to this project. As Faculty Advisors to this project, Dr. Genie Stowers and
Dr. Dick LeGates provided helpful assistance and direction. Mr. Jeffrey Tumlin,
Principal with Nelson\Nygaard Consulting, provided key feedback on the first draft of
this paper. Mr. Michael Sallaberry, of San Francisco’s Department of Parking and
Traffic, provided useful technical details and background information on the Valencia
Street Bicycle Lane project. Many thanks also go to Mr. Gerard Palmieri for consistently
being there to “talk transit” with me. Thanks also to the organizers of California
Walk/Bike 2003 for providing me with an opportunity to present this information to the
alternative transportation community.
I would also like to thank the organizations who provided financial support for
my graduate education: AmeriCorps, Associated Students, Inc. of San Francisco State
University, the California Society of Municipal Finance Officers, the San Francisco State
University Financial Aid Office, the San Francisco State University Alumni Association,
and the State Compensation and Insurance Fund.
And lastly, my biggest thanks goes to my partner, Lindasusan Ulrich, who not
only kept me sane throughout this project, but also helped me conceptualize difficult
parts of the project, and lent her expertise as a technical writer by proofreading, editing,
and developing the format for this paper. A thousand thanks!