Embed Size (px)
Citation preview
Economic Evaluation of Soils
Vala Ragnarsdottir
QuickTime™ and a decompressor
are needed to see this picture.

All data from Stijn Reinhart, Wageningen
The method: basic design• Cost Benefit Analysis• Define alternatives• Compare measures with non-action scenario• Quantify the effects of measures• Valuation based on soil functions
QuickTime™ and a decompressor
are needed to see this picture.
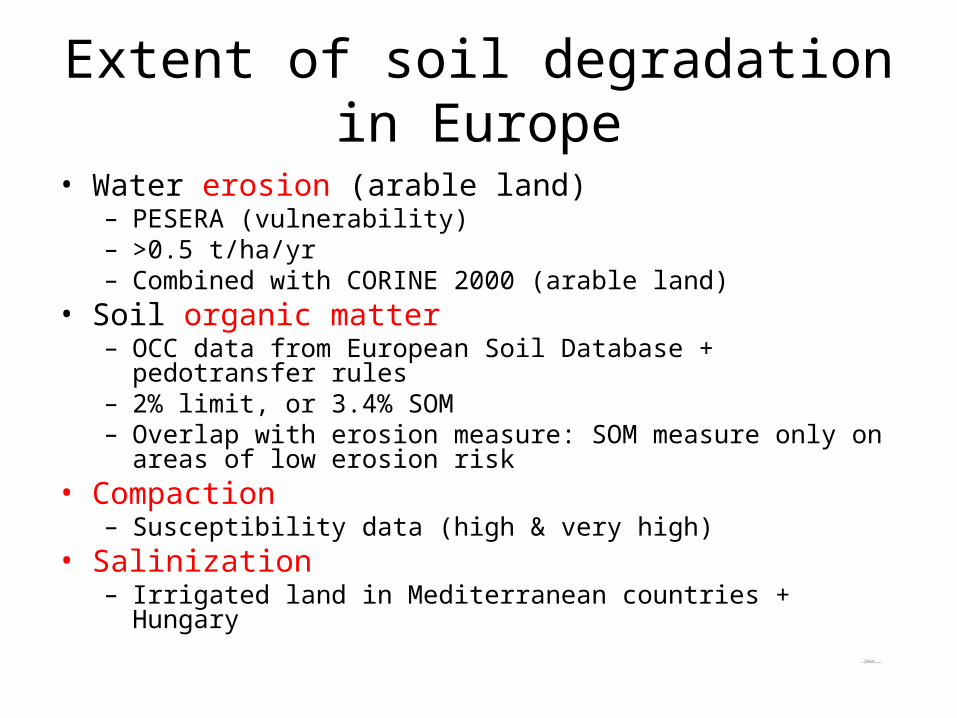
Extent of soil degradation in Europe
• Water erosion (arable land)– PESERA (vulnerability) – >0.5 t/ha/yr– Combined with CORINE 2000 (arable land)
• Soil organic matter– OCC data from European Soil Database + pedotransfer rules – 2% limit, or 3.4% SOM– Overlap with erosion measure: SOM measure only on areas of low
erosion risk• Compaction
– Susceptibility data (high & very high)• Salinization
– Irrigated land in Mediterranean countries + Hungary
QuickTime™ and a decompressor
are needed to see this picture.

• Forestry– Combination of PESERA & CORINE/forest– Calculation of total area harvested per year: 8.2%
• Construction– Combination of PESERA & CORINE/building sites– Correction factors according to extent of urban area– Roads not included
Extent of soil degradation (forestry & construction)
QuickTime™ and a decompressor
are needed to see this picture.

Areas of application package area to be
covered by package (million ha)
total area at risk (EU-25, m ha)
1 farming: serious erosion (>10 t/ha/yr) 8.1 10.1
2 farming: moderate to serious erosion 22.7 27.3
3 farming: moderate erosion (0.5-2 t/ha/yr) 31.3 37.7
low erosion (<0.5 t/ha/yr)
74.4
4 farming: SOM loss (OCC <2%) 30.5 35.0
5 farming: compaction 40.4 124.1
6 farming: salinization 7.15 14.3
7 forestry (>0.5 t/ha/yr erosion risk) 1.2 75.1
8 construction (>2 t/ha/yr erosion risk) 0.011 37.4
QuickTime™ and a
decompressorare needed to see this picture.

On-site costs
• Based on agri-environment schemes– (subsidy must cover difference between farmer’s
benefit and total cost)– Add on-site benefit
• On literature• Calculated per hectare:
– Cost/ha * area of application = total cost
QuickTime™ and a decompressor
are needed to see this picture.

Areas of applicationPackage Practice Threat at which it
is aimed Cost per ha per year (€)
Share in package
Cost per ha/y for package
conversion of arable land into forest
erosion, SOM loss 299 8%
conversion of arable land into pasture
erosion, SOM loss 155 8%
terracing (construction) erosion 893 0.5% terracing (maintenance) erosion 200 10% buffer strips erosion 230 74% residue management erosion, SOM loss 44 59% conservation tillage erosion, SOM loss 59 42% cover crop erosion, SOM loss,
compaction 57 25%
contour ploughing erosion 20 50% residue management erosion, SOM loss 44 70% conservation tillage erosion, SOM loss 59 50%
1. serious erosion (>10 t/ha/yr)
cover crop erosion, SOM loss, compaction
57 30%
296

On-site benefits• Erosion effect on productivity: local studies, but difficult to
generalize– Rooting depth– Water retention– Loss of nutrients– Conclusion: on-site benefits in Europe must be low
• Comparison of different figures in literature– Educated guess of average impact in affected areas
• Cumulative discounted benefit (erosion effect incremental)– 20 years for erosion and SOM, 4 years for compaction– 4% discount rate
QuickTime™ and a decompressor
are needed to see this picture.

Off-site benefits• Erosion:
– Based on EEA figure of € 32/ha/year– transformed into tonnes of sediment– Benefit = avoided cost of dredging + disposal
sediment + removal of pollution from water• SOM loss:
– Same, plus carbon storage effect• Nothing for compaction• Salinization: rough indication as % of on-site
benefits
QuickTime™ and a decompressor
are needed to see this picture.

The big picturePackage Cost
per ha Risk area (m ha)
Total cost package (mln €)
Additional cost (ml €)
On-site benefits (mln €)
Off-site benefits (mln €)
Balance (mln €)
serious erosion (>10 t/ha/yr)
296 8.1 2,398 2,091 2,060 2,484 +2453
moderate to serious erosion
140 22.7 3,178 2,772 899 1,085 -788
moderate (0.5-2 t/ha/yr)
120 31.3 3,756 3,276 292 350 -2,633
level areas, SOM loss
116 30.5 3,538 3,086 2,057 3,117 2,088
anti-compaction measures
4.5 40.4 182 122 1,027 - 905
salinization 1,076 7.15 7,688 7,304 2,887 606 -3,811
soil protection in forests
450 1.2 547 438 18.2 280 140
Protection con-truction sites
22,159 0.011 246 246 0 60 -186

Thank you
© Wageningen UR
QuickTime™ and a decompressor
are needed to see this picture.