Embed Size (px)
Citation preview

European Journal of Business and Management www.iiste.org
ISSN 2222-1905 (Paper) ISSN 2222-2839 (Online)
Vol.8, No.15, 2016
162
Economic Foreign Logistics Cost Analysis at the Cement Project
of Pt Semen Indonesia
Effnu Subiyanto Doctoral student of Airlangga University
Djoko Mursinto
Economic professor of Airlangga University
Rudi Purwono
Economic lecture of Airlangga University
Abstract
Cement is primarily product to build massif infrastructure while Indonesia was experiencing shortage of production last decade. Due the situation, cement projects were rampant in period 2008-2015 to anticipate further surprise demand. However to build a new cement plant is quite difficult due to high cost of logistic. In this paper, four projects of Indonesia state’s owned Semen Indonesia at Java and outside Java were examined to explore total logistic cost contributed by sea freight and domestic section. According this research total logistic cost came from foreign source was 6.464% while domestic contribution was 1.363% against total investment cost; however limitation of infrastructure contributes 27,129% against domestic path. Key Words: Cement, Logistics, Project, Foreign, Domestic
Introduction
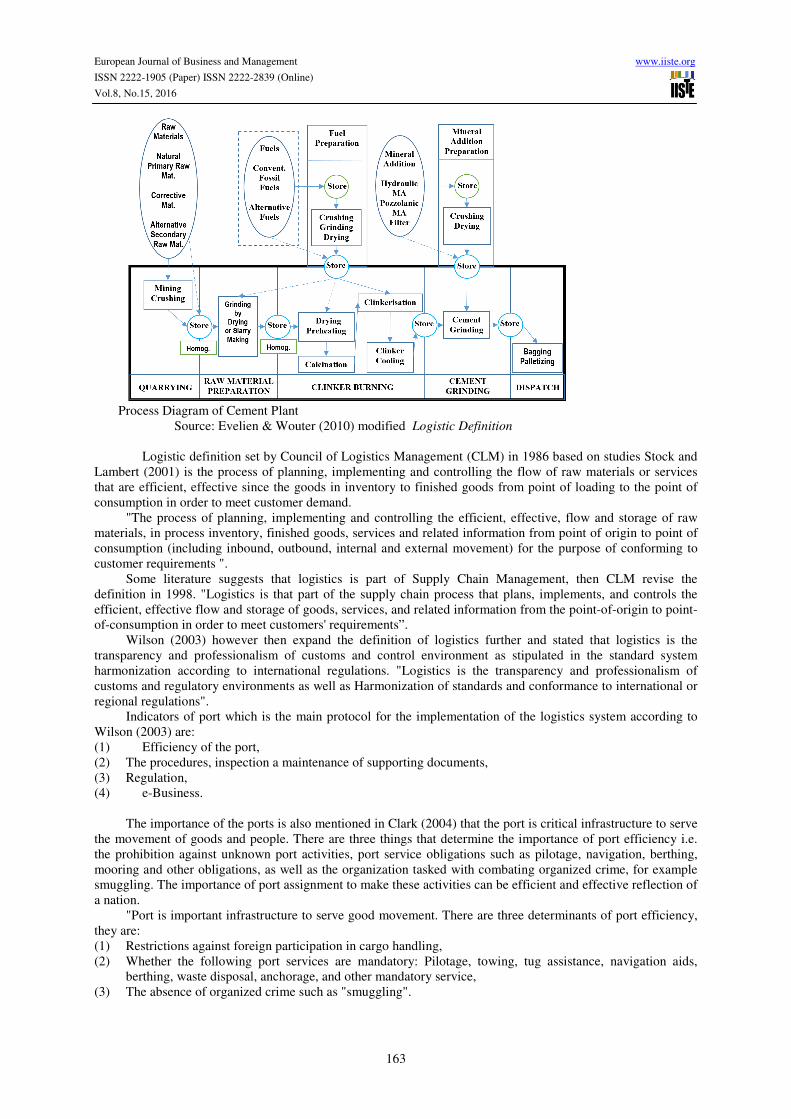
The cement industry as a whole generally includes mining process of raw materials section, preparation of raw materials section, clinker burning stage, milling of grinding cement and packaging section as mentioned Figure 1. The raw material obtained from mining was be tightly controlled through the process for better preparing for next burning in a high temperature in the rotary kiln. Semi-finished material (clinker) then was milled to produce finest final product that is named cement. Additional processes such as the preparation of fuel (fuel preparation) and the activities of the additional certain materials (mineral addition preparation) such as sand material (trass sand) and fly-ash is a process that does not include the main part of producing cement, but that is very important in determining the efficiency of operational processes.
Last innovation is the extra facilities substitute for fuel oil into coal; alternative fuels or electricity generation facilities to supply extra electric power from hot exhaust gases is called waste heat recovery power plant (WHRPP).
All machineries lead to additional facilities of capital expenditure in the form purchase of equipment for new cement plant in total. The problem then arising during execution project that came from logistic to transport all machineries to site.
This research to explore logistic view in term of investment performed by Indonesia’s state owned PT Semen Indonesia (PTSI) during execution their four projects in Tonasa V South Sulawesi, Tuban IV East Java, Rembang, Central Java dan Indarung VI in West Sumatera. Cement Plant
Understanding to execute new cement project must be well known what objects required for the project, what dimension and where it came from. Further; logistic pathway from beginning at the loading point upto unloading point at site project must be measured carefully. Finally, logistic of investment which is truly transportation strategy was engage in economic perspective that at the end would give impact to all cost against the investment. Previous research performed by Gkonis & Psaraftis (2012); Beverelli (2010); Hummels (2007); Mirza & Zitouna (2009); Polo (2011); Gentle & Perkins (1982); Eljardt (2006) stated that oil crude price had taken major impact to the logistic at sea-freight section. According to the research, beside of oil price there was also exchange rate, distance, size of the cargo, insurance and customs at the destination port.
Not also from foreign source but there is also capital source from domestic manufacture that contribute to the new cement project. Based on Hubner (2008); Subiyanto (2013); Huse (2002); Rad (2002) the domestic capital goods due to implementation engineering procurement construction (EPC) than turn-key project.
European Journal of Business and Management www.iiste.org
ISSN 2222-1905 (Paper) ISSN 2222-2839 (Online)
Vol.8, No.15, 2016
163
Process Diagram of Cement Plant
Source: Evelien & Wouter (2010) modified Logistic Definition
Logistic definition set by Council of Logistics Management (CLM) in 1986 based on studies Stock and Lambert (2001) is the process of planning, implementing and controlling the flow of raw materials or services that are efficient, effective since the goods in inventory to finished goods from point of loading to the point of consumption in order to meet customer demand.
"The process of planning, implementing and controlling the efficient, effective, flow and storage of raw materials, in process inventory, finished goods, services and related information from point of origin to point of consumption (including inbound, outbound, internal and external movement) for the purpose of conforming to customer requirements ".
Some literature suggests that logistics is part of Supply Chain Management, then CLM revise the definition in 1998. "Logistics is that part of the supply chain process that plans, implements, and controls the efficient, effective flow and storage of goods, services, and related information from the point-of-origin to point-of-consumption in order to meet customers' requirements”.
Wilson (2003) however then expand the definition of logistics further and stated that logistics is the transparency and professionalism of customs and control environment as stipulated in the standard system harmonization according to international regulations. "Logistics is the transparency and professionalism of customs and regulatory environments as well as Harmonization of standards and conformance to international or regional regulations".
Indicators of port which is the main protocol for the implementation of the logistics system according to Wilson (2003) are: (1) Efficiency of the port, (2) The procedures, inspection a maintenance of supporting documents, (3) Regulation, (4) e-Business.
The importance of the ports is also mentioned in Clark (2004) that the port is critical infrastructure to serve the movement of goods and people. There are three things that determine the importance of port efficiency i.e. the prohibition against unknown port activities, port service obligations such as pilotage, navigation, berthing, mooring and other obligations, as well as the organization tasked with combating organized crime, for example smuggling. The importance of port assignment to make these activities can be efficient and effective reflection of a nation.
"Port is important infrastructure to serve good movement. There are three determinants of port efficiency, they are: (1) Restrictions against foreign participation in cargo handling, (2) Whether the following port services are mandatory: Pilotage, towing, tug assistance, navigation aids,
berthing, waste disposal, anchorage, and other mandatory service, (3) The absence of organized crime such as "smuggling".

European Journal of Business and Management www.iiste.org
ISSN 2222-1905 (Paper) ISSN 2222-2839 (Online)
Vol.8, No.15, 2016
164
Logistics has become an important interdisciplinary and implications for the quality of the competition, the opportunities for participation in the broader market, deregulation of the transport system, mergers and acquisitions (Weston, 2004). Research strengthens logistics of Weston (2004) conducted Sobotka (2005) that the logistics activities actually take place in a larger scope than the activities of supply chain management (SCM). There are five institutions in an investment activity i.e. goods makers (manufacturers), agents (wholesalers, brokers, and dealers), contractors (contractors), the location of the project (building sites) and the project owner (owners, users, employers). In each of these institutions there are internal supply chain activities to support investment projects and disciplines integrate logistics plays an important role overall.
Internal supply chain activities for example in institutional investment location (building sites). In this department there is a supply chain activities of physical work, warehousing, administrative activities, safety (safety induction) or security. The study provides scientific evidence that all processes that represent coordination of the flow of material and information to the final product, known as the definition of supply chain ultimately form a logistics system. Foreign Logistic
Based on Buton (1982); Garona (2001) and Grainger (2007) any goods from abroad (foreign) should be through international trade mechanisms before entering into a different area of the country's sovereignty. In this case requires a process before it is shipped (pre-shipment), shipment and customs clearance in the destination country. In terms of foreign logistics have to be noted, that the statutes of international commerce terms (incoterms) and complementary regulations set by the World Customs Organization (WCO) must be applied. According to Ramberg (2011) incoterms was first introduced in 1936 and implemented as part of the international trade that apply globally. Incoterms have undergone the first revision in 1957, 1967, 1976, 1980, 1990, 2000 and 2010. Last Incoterms prevailing is called Incoterms 2010 today. The main purpose of the enactment of incoterms is to standardize the practices of international trade in the same system (common understanding).
The first version of incoterms 1936 was focused on commodity trading and the importance of determining the definition of the point of delivery from the perspective of the needs of ships. Risk transfer point is considered to occur when the goods cross the fence ships (the goods passed the ships's rail). This definition is relevant to the terminology (clause) free on board (FOB), cost and freight (CFR) and the cost insurance freight (CIF). In 1936 incoterms clause has also been found free alongside ship (FAS) and ex-works (EXW). In 1957, a clause was added to the railway and road transport called a free on rail (FOR) and free on truck (FOT). Revised in 1976 added clauses pertaining to air transportation called the FOB airport that changed in 1990 with a new clause airport free carrier (FCA).
In 1980, a clause was added to the field of non-marine settings and then known as carriage paid to (CPT) and the cost of insurance paid (CIP) which is identical with the CFR and CIF in the marine sector. In 1990 clause FOR, FOT and FOB airport eliminated. In 2000 the entire clause in incoterms developed into 13 terms and undergo amendments in 2010 to 11 terminology. Four clause is omitted on incoterms 2000 that is delivered ex-ship (DES), delivered ex quay (DEQ), delivered at frontier (DAF) and delivered duty unpaid (DDU), but the two added are delivered at Terminal (DAT) and delivered at place (DAP).
Clauses into the terms incoterms trilogy were simply to keep in risk sharing arrangement between the seller (the seller), the buyer (buyer) and the carrier (the carrier). Between sellers and buyers of goods to contract purchases of goods while the shipper to get a contract or agreement carriage. The shipper may obtain the contract the transshipment of goods seller (exporter) if the contract of sale of goods using incoterms clause with the prefix C and D. However, the carrier may also obtain a contract of carriage of goods the buyer (importer) if the contract of sale of goods using incoterms clause with the prefix E and F.
The next process of the process flow of international trade is the process of customs (customs clearance) before going to another country. According to Grainger (2014) in his study mentioned that the customs administration plays an important role in international logistics operations. Its main task is to facilitate international trade, perform the function prohibition or restriction and collect taxes for state purposes. However, excessive customs duties will also impact on the level of a country's competitive compared with other countries. Domestic Logistic
According to Ran (2009) after the goods passes through customs clearance gate then they still needed logistics activities to the point determined of their customer. For Indonesia as archipelago states required combination of intermodal logistics. Logistics in the region called the hinterland logistics or intra-island comprising the combination of logistics by land, rail or water. Logistics hinterland or intra-island is very important to the entire chain of distribution of goods and people as well as being very competitive factors of a nation (Zondag, 2008). The combination of ports with hinterland integrative pathway will be competitiveness key of the nation because an important role in reducing the total cost of the logistics chain.
European Journal of Business and Management www.iiste.org
ISSN 2222-1905 (Paper) ISSN 2222-2839 (Online)
Vol.8, No.15, 2016
165
First the goods are shipped from the delivery point (origin node) of the country of origin to point of destination importing countries. After going through the point of destination or port of destination and complete the customs formalities, the goods are released through the hinterland which is a combination of domestic water, rail and road to the destination point of consumption goods. Baan (2015) describes in his study that the domestic logistics in Indonesia has a number of very serious challenges with regard to lack of infrastructure facilities for transport. Using the model Nagurney-Qiang, Baan found logistics disparity between the eastern and the western part of Indonesia. This disparity encourages logistics costs become very expensive in the east than in the west.
Pathway logistic in the western part of Indonesia more frequency available than logistics in Eastern Indonesia. This causes worsen with limitation infrastructure. Using Nagurney-Qiang model each port are ranked and found factors influence the network analyzed by Julius-Peterson-Mattson model that the port of Tanjung Perak is the most strategic ports to maintain throughout the logistics chain in Indonesa. Beside port of Tanjung Priok is critical paths while the line of Sorong to Makassar in the next critical sequence. Logistic Model Based on the theory, logistic model for cement project in Indonesia then developed according Appendix 1. Structural equation then proposed which in first estimation to solve foreign sector, second estimation to predict domestic manufacture sector, third estimation for domestic logistic and finally fourth estimation for total logistic including infrastructure.
Analysis Analysis model was performed under statistic tools EViews 6.0 with panel data and found that best lag factor of the model is lag 2 meant independent variables had taken effect at second period quarterly or further 6 months. Regression table of first estimation can be observed in Appendix 2 in FEM method, further second estimation in Appendix 3 in FEM method, third estimation in Appendix 4 in FEM method and finally fourth estimation in Appendix 5 in PLS method.
Oil Factor
During the period study 2008-2015 variable crude oil prices fluctuated on a downward trajectory. At the beginning of the study period of 2008 oil price of US$93.93 per barrel to US$37.43 per barrel at the end of the study in 2015 or decrease of 60.15%. This is certainly a positive development from the perspective of logistics due to the earlier period of bunker prices was constant increased 4.71% every month, causing the cost of sea freight becomes expensive.
Based Gkonis and Psaraftis (2012); and Polo (2011) contribution of crude oil prices reached 60% - 75% of total operational cost each liner and became very important to the liner. According to the study a ship with a carrying capacity of 8,200 TEUs requires 217 tons of oil per day which is equivalent to US$119,784 per day with bunker prices of US$552 per ton. One round trip from European ports as origin to the destination port of Tanjung Perak, Surabaya requires 90 days or bunker costs US$10,780,560. These costs will increase exponential with the number of arguments including: if the liner has low level ratio efficiency for each cargo loaded. Operating costs due to the use of the bunker will also be increased due to delay estimation schedule time departure (ETD) as the consequence the liner must perform additional compensation ship's speed to arrive on time at the next port.
Prior to the drop of crude oil prices sharply in 2015, the price had always been increasing in the study period 2008-2014. During the period, the foreign logistic obtained tough challenge especially for liner in perspective to maintain service level to customers. The liner was heavy burdened caused by an imbalance of trade between area triggering logistics costs to be high. Ships from developed countries send final product greater while raw material products from the emerging countries was lower and made wide empty in vessel and inefficient logistic.
Further, crude oil prices experienced a turning point in 2014-2015 due to discovery of new shale oil, a type of oil that is produced from rocks by extracting at high temperatures. Excess production of crude oil made prices declined and eventually cause prices to ship bunker to deteriorate so that logistics costs should decline. Nevertheless the impact of falling oil prices in 2014 could not be felt in 2015.
Based on the test results showed that the regression coefficient of variable crude oil prices against foreign variable logistic cost is 1408.183 but not significance value α = 5%. Regression value of crude oil prices is significant against of the dependent variable foreign logistic cost with probability 0.0090 or smaller than the value of α. Partially, variable oil price is giving significantly affect the dependent variable of foreign logistic cost. Value regression of crude oil prices also proved the most dominant among other variables.
The impact of crude oil prices in arranging logistics costs from the foreign sector is supporting study conducted by Gkonis and Psaraftis (2012); Gentle and Perkins (1982); Eljardt (2006); Hummels (2007); Beverelli (2010); and Polo (2011). The researchers tested the effect of oil prices and other variables, and the

European Journal of Business and Management www.iiste.org
ISSN 2222-1905 (Paper) ISSN 2222-2839 (Online)
Vol.8, No.15, 2016
166
results are consistent that variable crude oil price provides greatest impact on the cost structure of foreign logistic cost.
Exchange Factor
In contrast to the weakening crude oil prices, in the study period 2010-2015; variable exchange rate of the rupiah against the US dollar was sharply depreciated. This situation led consequence as logistically that the benefit of weakened oil price could not be obtained even though cheaper bunker prices has occurred. Based Samuelson and Nordhaus (2004) fluctuations in currency exchange rates are influenced by the imbalance of supply-demand conditions. If the demand for the currency increases, while its supply remaining or decreasing, the exchange value of the currency would be going to appreciate. Conversely if the demand on the currency decline, while supply is stable or decreasing, the exchange value of the currency will depreciate.
According to Ma and Cheng (2005) and Joyce (2012) there are three factors that affect movement of currency exchange rates. First, the release of the majority of foreign portfolio investments out from Indonesia. The exit of foreign portfolio investment will provide a stimulant effect a decrease in the exchange rate for foreign investors in this process with the rupiah exchange the world's major currencies such as US dollars to be invested in other countries are more favorable. This could mean an increase value of the US dollar compared to the increase in the supply of currency rupiah. Factor fiscal policy stronger economies such as the United States also gives the effect. Since 2014 the US central bank has a plan to reduce quantitative easing (QE), which has implications for the plan to raise interest rates. These plans continue throughout the fiscal year 2014-2015 in order to run the program the United States economy. The QE policy is to print money in order to buy US dollar bonds or other financial assets from banks and financial institutions in the US. This program aims to inject money into the US banking system in the context of the US economic recovery which exposed to the crisis since 2009.
Second: the factors that lead to high supply and low demand for the Indonesian rupiah is the trade balance. Indonesia's current account deficit in 2014 was US$26.233 billion, equivalent to 2.95% of GDP. Root of the problem is what caused the rupiah to weaken because of the very high import dependence. Third: cultural factors of nation consumptive and wasteful manage the budget related debt. The funds obtained from debt is not having maximum benefit to provide income to refund the principal.
Based on the above we can see that the fall of the rupiah in the year 2008-2015 due to the release of most of the investment portfolio as a result of the reduction plan QE by the US central bank since 2014. Next caused the country's trade balance deficit and government policy factors that rests the high cost economy. It can be witnessed fluctuations in the rupiah against the US dollar tend to be on a downward trend. The realization of the exchange rate depreciation that would have implications on logistics costs for overall investment in the study period 2010-2015 had depreciated to 49.88%.
Based on test results of this study it was found that the regression coefficient variable foreign exchange rates against variable logistic cost is 30.946. Variable regression value of the rupiah against the US dollar in the foreign influence dependent variable is positive and significant against logistics cost or less than the value of significance α = 0.05. Variable exchange rates had a positive relationship with the dependent variable due to the currency used for payment when using the services of the ship is US dollar. Efforts made by the government in BI regulation (PBI) No. 17/3/PBI/2015 on Liability Use of Rupiah applicable from 1 April 2015 to July 1, 2015 transition period is appropriate interventions. The regulation is strengthening of the regulation of the Minister of Transport Instruction 3/2014 on the Use Rupiah in the Transactions on Transport activity in the harbor and is a derivative of the Law 7/2011 on Currency.
This is consistent with research performed Jabara (2009) that international trade is having impact to the exchange rate. Fluctuations in currency exchange rates depending on the volume of trade between countries and the depreciation of the currency will increasingly occur in developing countries with smaller trading volume. Distance Factor The loading port is associated as geographical distance is not quite significant based on the test. Term contracts of investment projects are coming from all over the world (worldwide), which meant capital goods providers can perform shipment from any port in the world. The logistical challenge is to prepare a logistic model in remote port. Western European ports such as the port of Izmir, Turkey requires special conditions if the cargo is not delivered in containers. Minimum inducement apply is 2000 freight-ton (FRT) to make a port call, this required separate effort to reserve tramper vessel willing to accept contract carriage to Indonesia. Ports in China also experienced similar difficulties when in breakbulk cargo. Term port of loading of the whole world is a subject that must be maintained and reconsidered further for logistics efficiency.
In contrast there is not quite problems of loading ports around the world if cargo is transported in containers and their derivatives. This is due to easy to provide ships with a fixed schedule (liner conferences) and regularly to transport containers. Instead get a vessel or tramper with heavy-lift cargo and extra-dimension vessel

European Journal of Business and Management www.iiste.org
ISSN 2222-1905 (Paper) ISSN 2222-2839 (Online)
Vol.8, No.15, 2016
167
will meet very severe constraints. Alternatively that could be taken by Indonesian cement investor is to transfer with special cargo to the nearest port in the country of origin with equipped greater facility despite significant costs quite expensive as consequences.
Capital goods for investment in the Indonesian from the scope of this research comes from Europe, South Asia and China. The goods were shipped from the port of loading with the destination ISPS port standards in Indonesia of Tanjung Priok, Jakarta for Indarung’s project; Tanjung Perak, Surabaya for Rembang’s project, and Tuban IV’s project; and Makassar port for Tonasa V’s project.
Based on test this study it was found that the regression coefficient variable -1.627 against foreign logistic and not significant. The notion that greater distance the port of loading will cause logistic more expensive are not proven. This is due to the distance factor is interdependent variable substituted with crude oil prices and intercorrelated between them. This study provides perspective that location of origin of the imported goods are not significant in giving effect to the cost of foreign logistic cost. Based on this finding, study of Gkonis and Psaraftis (2012) that the distance factor is a significant variable is denied. Size Factor
Size of the cargo was source of the problem in term of logistic in Indonesia due to limitation of infrastructure which consisting hard infrastructure and also soft infrastructure. Hard infrastructure is port, number of domestic vessel, road, and bridges. The bigger and or the heavy of cargo then put the high cost of logistic. Soft infrastructure is bureaucracy itself since agent, port administrative, and customs. Maximum weight allowed of road infrastructure in Indonesia is 10 ton each axle while equipment of cement plant is quite heavy. Maximum height of domestic infrastructure is 4.1 meter from the ground. Based on the test results showed that the regression coefficient variable to variable sized foreign cargo logistic cost is 109.618 and has a significant relationship to the dependent variable with a value of 0.0000 or less than α. The results of this study support the research of Christiansen (2007); Manzanero and Krupp (2009) that the size of the cargo to give effect to the cost of foreign logistic cost. In this study, all form of cargo containers, breakbulk, heavy-lift, or over dimension shown to provide sufficient influence to foreign variable logistic cost. Insurance Factor
Based on the test results of this study it was found that the regression coefficient of variable insurance against foreign variable logistic cost is 0.679 or has a positive and significant correlation with the value of 0.0080. Insurance variable regression value of imports is significant due to its competitive business in the field of insurance. Average insurance premiums ranged from 0.28% to 0.5% and is mandatory from the Commercial code and Article 246 of Law No. 2 of 1992 on Insurance Business, amended by Act No. 40 of 2014 on Insurance, then derivate in Director General of Customs Regulation No. 02/BC/2005 on Insurance, and subsequently in Finance Minister Regulation Number 160/PMK.04/2010 on customs value for the calculation of import duty. The results of this research consistent with study of Nieh and Jiang (2006) and Skuld (2009) that is absolutely necessary insurance on any logistics activities and the most appropriate is ocean marine because it provides risk protection both for cargo and vessel as well.
Customs Factor
Based on the test results showed that the regression coefficient variable against variable foreign customs logistics cost is 4.28 10-6 or has a significant negative relationship but with probability value of 0.0033. The value of this variable is significant regression in the foreign models of logistic costs due to high import taxes in Indonesia comprising customs duties, import VAT, income tax and import compliance costs at the port. In order to attract investment in Indonesia, the government is providing investment incentives scheme in the form of tax holiday within government regulation No. 1/2007 then was later changed to government regulation 62/2008, 52/2011 and amended again last modified 18/2015.
Based Garonna (2001); Grainger (2007); Ramberg (2011) and Grainger (2014) that the fulfillment of formalities document is mandatory and is implemented by local customs that represent the country of destination. International trade mechanisms stipulated in the organization of the International Chamber of Commerce (ICC), which resulted in an agreement called the trade terminology with international commerce terms (Incoterms). After experiencing seven times amendment since the first revision in 1957, currently in force are incoterms 2010.
Fabrication
Based on the test results showed that the regression coefficient variable abrication against domestic manufacture is 188508.1 or have a positive and significant with probability value of 0.0000. The value of this fabrication significant regression due to the large volume fabrication that require logistics activities. Even for investment outside Java is absolutely requires a change between modes since to the port, and then following

European Journal of Business and Management www.iiste.org
ISSN 2222-1905 (Paper) ISSN 2222-2839 (Online)
Vol.8, No.15, 2016
168
moda using sea and back again to inland at the port of destination. After being unloaded from the destination port fabrication variables inland logistics still need to be transported again to final location.
Based Huse (2002) the fabrication variables came from implementation of the contract with EPC method. The difference between the types of contracts using EPC basis and turn-key project is the protection of the interests of the owner. If owner needed greater control, EPC contract will provide more space than the turn-key contracts. One of the variables controlled by the owner is a fabrication or plate-work. Hubner (2008) confirmed that cost and benefit analysis (CBA) states that the EPC contract has an advantage in the field of efficiency in total investment costs.
Reinforcing Bar (Rebar)
Based on the test results showed that the regression coefficient variable of domestic rebar is positive 136996.4 significant with probability value of 0.0003. The value of this variable regression significantly due to large number of volumes needed in investment activities. This rebar is required for civil works structures also infrastructure such as roads. Based Huse (2002) rebar required due to the implementation of EPC contract method. The difference between the types of contracts using the EPC basis and turn-key project is the protection of the interests of owner. If owner needed greater control over the project, the EPC contract to provide more space control than turn-key project contracts. One of the variables controlled by the owner is the availability of rebar. Hubner (2008) confirm of cost and benefit analysis (CBA) which states that the EPC contract has an advantage in the field of efficiency of total investment costs. Ready-mix
Based on the test results showed that the coefficient regression ready-mix against domestic manufacture is a significant positive 26375.52 with a probability value of 0.0000. Value variable regression ready mix significantly due to the large volume of ready-mix needed for the project. Ready mix needed in a single project in this study reached 272,000 tons, thus requiring logistics frequencies up to 27,000-34,000 turn around trucking. Although this variable has special requirements for technical reasons named cold joint and should be placed close to the location of project, however the value of the regression is quite high.
Based Huse (2002) variable of ready-mix came due to the implementation of the EPC contract method. The difference between the types of contracts using EPC basis and turn-key project is the protection of the interests of the owner. If owner needed greater control over project, the EPC contract to provide more control than the turn-key project contracts. One of the variables controlled by owner is availability of ready-mix. Hubner (2008) confirmed that cost and benefit analysis (CBA) states that EPC contract has an advantage in the field of efficiency of total investment costs. Bulk Material
Based on the test results showed that regression coefficient of bulk-material against of domestic manufacture is minus 168,939.8 meant negative but significant with probability 0.0271. Regression value of this variable has a negative relationship because this variable previously could not be calculated or it can be identified while the goods arrived at site.
Based Huse (2002) the variable bulk material came due to the implementation of the EPC contract. The difference between the types of contracts using the EPC basis and turn-key project is the protection of the interests of owner.
Conclusion
Based on the analysis in this study can be concluded as follows: (1) Variable crude oil, exchange rate, distance, size of freight, insurance and customs have a significant effect
together but not significantly partially against of foreign logistic cost. Simultaneous hypothesis is accepted because based on the F-test showed the value of 0.00000 which means variable crude oil, exchange rate, distance, size of freight, insurance and customs have a significant effect together against foreign logistic cost. But based on t-test results shown that the results of the regression variable crude oil, exchange rate, distance, size of freight, insurance, and customs not significant effect partially against foreign logistic cost.
(2) Variable fabrication, rebar, ready-mix and bulk material together and partially is significant against domestic manufacture. This hypothesis is accepted because it is based on a statistical test regression value of each variable with a significant effect F-test results show the value of 0.000000 which means all variables have significant against of domestic manufacture. Similarly, based on t-test results showed that the variables fabrication, rebar, ready-mix and bulk material significant effect to the domestic manufacture.
(4) Variable foreign logistic cost and domestic manufacture is having significant together, and also significant partially against domestic logistic cost. Simultaneous hypothesis is accepted because it is based on a statistical F-test with a value of 0.00000 which means foreign logistic costs and domestic manufacture

European Journal of Business and Management www.iiste.org
ISSN 2222-1905 (Paper) ISSN 2222-2839 (Online)
Vol.8, No.15, 2016
169
significant effect together against domestic logistic cost. Same result obtained based on t-test results showed that foreign logistic cost and domestic manufacture logistic cost is also significant to the variable domestic logistic cost.
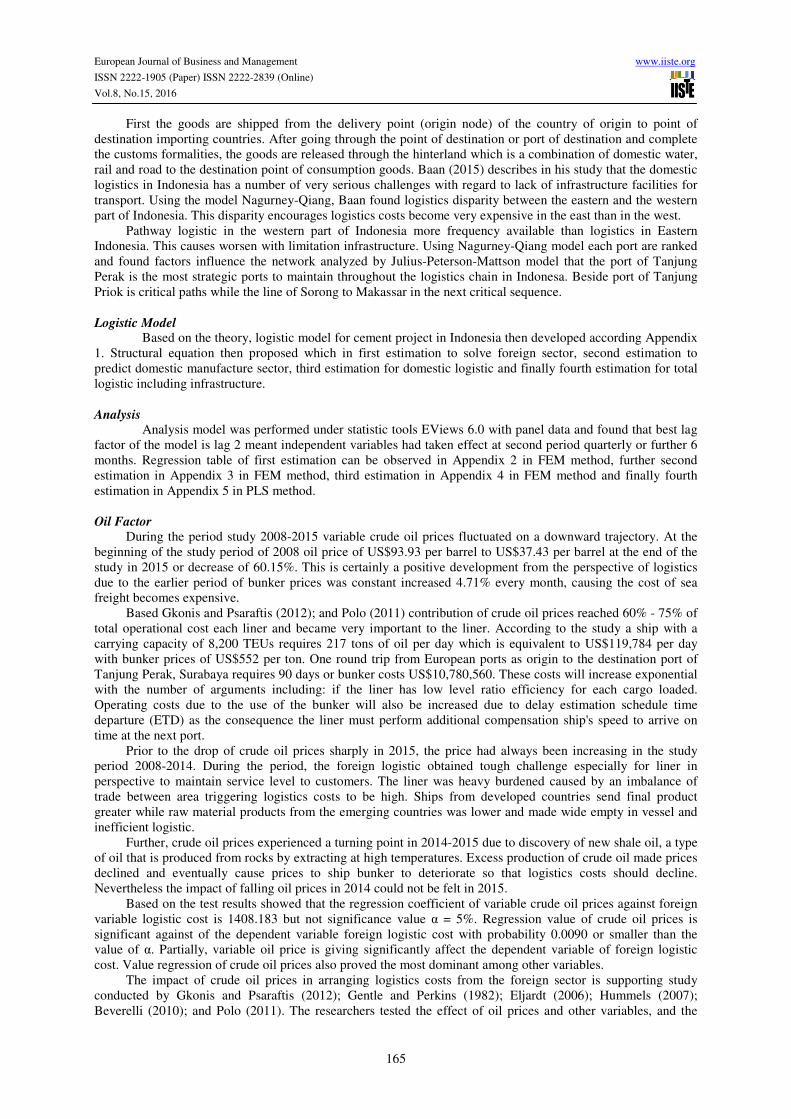
(5) Variable domestic logistic cost is significant against of total investment. This hypothesis is accepted because based on a statistical test results of domestic logistic cost shows significant value against of total investment received by F-test results with the value 0.0339 which means domestic logistic costs is significant influence against total investment.
(6) Advice for cement investors to take care especially to the cost of foreign logistics costs caused a higher contribution than domestic manufacture logistic cost. Determining the scope of domestic larger or reduce the scope of foreign will create logistic efficient.
(7) Special message for government, the infrastructure development plan has become an urgent to reduce domestic logistics costs. Based on this research infrastructure limitations in the country contributing 27.129% of the domestic logistics costs or high enough among countries in the same region.
References
Baan, C., et. al., 2015. “State of Logistic Indonesia 2015”, World Bank, Jakarta, Journal of Netherlands Expert
Groups for Sustainable Transport & Logistics, Nestra, pp 5-68 Beverelli, C., 2010. Oil Prices and Maritime Freight Rates: An Empirical Investigation, UNCTAD, Technical
Report Buton, K. J., 1982. Economics Transport. London Carana, 2004. Impact of Transport and Logistics on Indonesia’s Trade Competitiveness, USAID Christiansen, M., et. al., 2007. “Maritime Transportation”, International Journal of Maritime Economics, vol-14,
pp 189-284 Das, A.A., et. al., 2012. “Supply Chain Management & Logistic Strategy at SM Electronics for Reducing Cost
and Improving Service”, Journal of National Institute Technology Karnataka (NITK), India, ssrn, pp 1-45 Eklund, J. E., 2013. “Theories of Investment: A Theoritical Review with Empirical Applications”, Swedish
Entrepreneurship Forum, Sweden, Working Paper 22 Eljardt, G., 2006. Development of a Fuel Oil Consumption Monitoring System, TUHH, Jerman Evelien, C., dan Wouter, N., 2010. Cement Production, ETSAP Feng, M., 2010. A Comparative Study of Ports and Their Hinterlands: Factors Determining Port Performance
and Choice, University of Hull, UK, Dissertation Garonna, P., 2001. “Facilitation Measures Related to International Procedures”, New York, UN,
Recommendation 18 Gentle, N.F., Perkins, R. J., 1982. “An Estimate of Operating Costs for Bulk, Ro-ro and Container Ships”,
Canberra, Australia, Journal of Bureau Transport Economics (BTE), ISBN 0642017740, pp 127-131 Gkonis, G.K., Psaraftis, H.N., 2012. “Some Keys Variables Affecting Liner Shipping Costs”, Journal of
National University of Athens, pp 1-22 Grainger, A., 2007. “Customs and Trade Facilitation: From Concepts to Implementation”, World Customs
Journal, pp 17-29 Grainger, A., 2014. “Measuring-up Customs: A Trade Compliance Cost Perspective”, Nottingham University
Business School (NUBS), UK, NUBS Research Paper Series No: 2014-02 Hubner, D., 2008. Cost Benefit Analysis of Investment Projects, European Commission Huse, J. A., 2002. Understanding and Negotiating Turn-key and EPC Contracts. Thomson, London Jabara, C. L., 2009. “How Do Exchange Rates Affect Import Prices? Recent Economic Literature and Data
Analysis”, US International Trade and Commission, Working Paper Kowalski, A., 2013. “Cost Optimization of Marine Fuels Consumption as Important Factor of Control Ship’s
Sulfur and Nitrogen Oxides Emissions”, Maritime University of Szczecin, Scientific Journals, pp 94-99 Korinek, J., dan Sourdin, P., 2009. “Maritime Transport Costs and Their Impact on Trade”, OECD, Working
Paper Ma, Z., Cheng, L., 2005. “The Effects of Financial Crises on International Trade”, NBER Journal, East Asia, pp
253-285 Manzanero, L. D. A., dan Krupp, K. J., 2009. Forecasting Container Freight Rates: An Econometric Analysis,
CBS, Denmark Muangthong, K., Suthikarnnarunai, N., 2011. “A Development of Sea Freight Transportation Index of
Thailand”, WCECS, San Francisco, USA, Journal on Engineering and Computer Science
Muller, S., et. al., 2015. “How to Translate Economic Activity into Freight Transportation”, Journal
Transportation Research Procedia 8, pp 155-167 Nieh, C. C., Jiang, S. J., 2006. “Against Marine Risk: Margins Determination of Ocean Marine Insurance”,
Journal Marine Science dan Technology, Taiwan, pp 15-24

European Journal of Business and Management www.iiste.org
ISSN 2222-1905 (Paper) ISSN 2222-2839 (Online)
Vol.8, No.15, 2016
170
Polo, G., 2011. “On Maritime Transport Costs, Evolution, and Forecast”, Madrid, Spain, Journal of Maritime, pp 19-31
Ramberg, J., 2011. ICC Guide to Incoterms® 2010: Understanding and Practical Use, ICC, France Ran, T., 2009. “Internal Logistics as A Part of Supply Chain”, Journal of Lahti University of Applied Sciences,
China, pp 67, appendix 3 Rodrigue, J. P., 2006. “Intermodal Transportation and Integrated Transport Systems: Spaces, Networks, and
Flows”, Hempstead, NY, International Transport Journal, pp 1-24 Ronen, D., 2011. “The Effect of Oil Price on Container Speed and Fleet Size”, Journal of the Operational
Research Society, Vol. 62, pp 211-216 Sobotka, A., et. al., 2005. “Logistics of Construction Projects”, Lublin, Poland, Journal of Logistic, pp 203-216 Stock, J.R., & Lambert, D.M., 2001. Strategic Logistic Management, McGraw-Hill, New York Subiyanto, E., 2013. “Impact of Foreign Sea Freight Cost at The EPC (Engineering, Procurement and
Construction) Contract 4th Project of SMGR”, ISBN-9789868568297, ICOI 2013, Thailand, pp 879-893 Szmigiel, C., 1979. “Liner Shipping and General Cargo Transport”, EFI, Stockholm School of Economics,
Sweden, Dissertation Thoyts, R., 2010. Insurance Theory and Practice, 270 Madison Avenue, NY Vido, E., Prentice, B. E., 2003. “The Use of Proxy Variables in Economic Gravity Models: A Cautionary Note”,
Washington DC, NBER Journal, pp 123-137 Whittle, T. S., 1987. Basic Concepts of Maritime Transport and Its Present Status in Latin America and The
Caribbean, UN Economic Commission, Santiago, Chile Zeng, A. Z., Rossetti, C., 2003. “Developing A Framework for Evaluating the Logistic Costs in Global Sourcing
Processes: An Implementation and Insights”, Journal of Emerald, pp 785-803 Zondag, B., et. al., 2008. “A Model For Maritime Freight Flows, Port Competition and Hinterland Transport”,
Working Paper Appendix 1. Model Logistic of Cement Project

European Journal of Business and Management www.iiste.org
ISSN 2222-1905 (Paper) ISSN 2222-2839 (Online)
Vol.8, No.15, 2016
171
Appendix 2. Regression Result of 1st Estimation Dependent Variable: FLC? Method: Pooled Least Squares Date: 03/06/16 Time: 05:47 Sample: 2008Q1 2015Q4 Included observations: 30 Cross-sections included: 2 Total pool (balanced) observations: 60 Variable Coefficient Std. Error t-Statistic Prob. C -457587.8 285241.3 -1.604213 0.1143 OIL? 1408.183 1518.174 0.927550 0.0090 EXCHANGE? 30.94616 16.26810 1.902260 0.0423 DIST? -1.627083 1.599476 -1.017260 0.3134 SIZE? 109.6181 11.04274 9.926712 0.0000 INS? 0.679435 0.710520 0.956250 0.0080 CUST? 4.28E-06 1.43E-06 2.994799 0.0033 Fixed Effects (Cross) _JAVA--C -5553.597 _OUTJAVA--C 5553.597 Effects Specification Cross-section fixed (dummy variables) R-squared 0.756836 Mean dependent var 208926.4 Adjusted R-squared 0.726441 S.D. dependent var 220727.8 S.E. of regression 115447.0 Akaike info criterion 26.26748 Sum squared resid 7.46E+11 Schwarz criterion 26.53734 Log likelihood -832.5594 Hannan-Quinn criter. 26.37379 F-statistic 24.89962 Durbin-Watson stat 2.174069 Prob(F-statistic) 0.000000

European Journal of Business and Management www.iiste.org
ISSN 2222-1905 (Paper) ISSN 2222-2839 (Online)
Vol.8, No.15, 2016
172
Appendix 3. Regression Result of 2nd Estimation Dependent Variable: DM? Method: Pooled Least Squares Date: 03/06/16 Time: 05:49 Sample: 2008Q1 2015Q4 Included observations: 30 Cross-sections included: 2 Total pool (balanced) observations: 60 Variable Coefficient Std. Error t-Statistic Prob. C 40016528 95771646 0.417833 0.6776 FABR? 188508.1 33180.74 5.681252 0.0000 REBR? 136996.4 54650.65 2.506767 0.0003 READYMIX? 26375.52 4595.907 5.738914 0.0000 BULKM? -168939.8 74510.89 2.267317 0.0271 Fixed Effects (Cross) _JAVA--C 11022073 _OUTJAVA--C -11022073 Effects Specification Cross-section fixed (dummy variables) R-squared 0.783282 Mean dependent var 9.77E+08 Adjusted R-squared 0.764599 S.D. dependent var 7.05E+08 S.E. of regression 3.42E+08 Akaike info criterion 42.22797 Sum squared resid 6.79E+18 Schwarz criterion 42.43036 Log likelihood -1345.295 Hannan-Quinn criter. 42.30770 F-statistic 41.92578 Durbin-Watson stat 1.985056 Prob(F-statistic) 0.000000
European Journal of Business and Management www.iiste.org
ISSN 2222-1905 (Paper) ISSN 2222-2839 (Online)
Vol.8, No.15, 2016
173
Appendix 4. Regression Result of 3rd Estimation Dependent Variable: DLC? Method: Pooled Least Squares Date: 03/06/16 Time: 05:51 Sample: 2008Q1 2015Q4 Included observations: 30 Cross-sections included: 2 Total pool (balanced) observations: 60 Variable Coefficient Std. Error t-Statistic Prob. C 1.04E+09 3.56E+08 2.917460 0.0050 FLC? 3567.817 809.1938 4.409101 0.0000 DM? 0.531240 0.253965 2.091782 0.0407 Fixed Effects (Cross) _JAVA--C -1.42E+09 _OUTJAVA--C 1.42E+09 Effects Specification Cross-section fixed (dummy variables) R-squared 0.593535 Mean dependent var 2.30E+09 Adjusted R-squared 0.573212 S.D. dependent var 2.16E+09 S.E. of regression 1.41E+09 Akaike info criterion 45.03751 Sum squared resid 1.20E+20 Schwarz criterion 45.17244 Log likelihood -1437.200 Hannan-Quinn criter. 45.09066 F-statistic 29.20475 Durbin-Watson stat 1.527514 Prob(F-statistic) 0.000000 Appendix 5. Regression Result of 4th Estimation Dependent Variable: TI? Method: Pooled Least Squares Date: 03/06/16 Time: 05:53 Sample: 2008Q1 2015Q4 Included observations: 30 Cross-sections included: 2 Total pool (unbalanced) observations: 60 Variable Coefficient Std. Error t-Statistic Prob. C 2.13E+11 4.79E+10 4.444067 0.0000 DLC? 14.16762 15.48941 0.914665 0.0339 R-squared 0.013529 Mean dependent var 2.45E+11 Adjusted R-squared -0.002642 S.D. dependent var 2.60E+11 S.E. of regression 2.60E+11 Akaike info criterion 45.44063 Sum squared resid 4.14E+24 Schwarz criterion 45.50866 Log likelihood -1744.380 Hannan-Quinn criter. 45.46739 F-statistic 21.83661 Durbin-Watson stat 1.583624 Prob(F-statistic) 0.033969