Embed Size (px)
Citation preview
Economic Growth and Quality Adjusted HumanCapital Equation: Moderating Role of SocialCapabilities in AfricaTonuchi Emmanuel Joseph ( [email protected] )
Central Bank of Nigeria https://orcid.org/0000-0002-2010-0848Pauline Chimuru Obikaonu
Central Bank of Nigeria
Research Article
Keywords: Africa, human capital, General Method of Moment (GMM), quality adjusted human capital,social capabilities
Posted Date: November 1st, 2021
DOI: https://doi.org/10.21203/rs.3.rs-1030633/v2
License: This work is licensed under a Creative Commons Attribution 4.0 International License. Read Full License
i
Economic Growth and Quality Adjusted Human Capital Equation: Moderating Role of
Social Capabilities in Africa
Tonuchi E Joseph1,2, Obikaonu C. Pauline1
1. Central Bank of Nigeria, Abuja
2. Corresponding author: [email protected]
Abstract
The role of human capital on economic growth across countries has over time garnered lots of
discussion in economic literature. This is fundamental, given that the actual determinant of the
difference in income per capita across countries or why some countries are growing faster than
other countries has remained an unresolved issue. This study provides a different insight into
the nexus between human capital and economic growth by accounting for the role of social
capabilities in a panel framework. Specifically, the study covers 40 African countries between
1998-2019, where the General Method of Moment (GMM) was employed to estimate the
model. Specifically, it was discovered that without improved legal institutions and better
economic opportunities, human capital impact on the growth of income per capita across
countries is insignificant though positive. The study concludes that the effectiveness of
knowledge accumulation and adoption of technology in a country is hinged on the availability
of an enhanced legal, social, and economic environment.
Keywords: Africa, human capital, General Method of Moment (GMM), quality-adjusted
human capital, social capabilities
JEL CODE: A3, D83, E24, F63, I2

1
1. Introduction
What determines the differences in cross-country income and long-run economic growth rate
across countries remains a controversial and highly debated topic among economists (Adler et
al., 2017). The global economy has witnessed tremendous growth in output per capita in the
last four decades, with world average growth rate at 4.3 percent between 1987 and 2015 (United
Nation Report, 2018). Despite the outstanding growth rate witnessed in the past three decades
championed by the East Asian countries (China, India & Asian tigers), the growth rate in the
last decades has been met with lots of economic crises and global negative shocks. This global
economic crisis and shocks include the global financial crisis of 2008 to 2010 championed by
the US, the European debt-crisis of 2010 to 2012 championed by Argentina, the global
commodity price fluctuation or falls championed by oil-producing countries including Nigeria
(2014-2016), and more recently the global negative output shock induced by Covid 19
pandemic (Joseph, 2020).
In the past three decades, empirical evidence has revealed that human capital accumulation,
physical capital stock, technological adoption (machine and equipment), institutional
framework, quality, and quantity of labour force are among the leading drivers of the difference
in cross country income (Obialor, 2017; Izushi & Huggins, 2004; Barro, 1998, Orogwu et al,
2021). Data from International Monetary Fund (2017) revealed that machinery and intellectual
properties (human capital and technology advancement) are the leading drivers of growth in
most developed countries, including the US, EU, Japan, and South Korea. Although, data
revealed that China's outstanding economic growth, which has lasted for decades, cannot be
attributed to intellectual properties but rather accumulation and stock of physical and human
capital (Tonuchi & Onyebuchi, 2019). Izushi and Huggins (2004) noted that China is enjoying
technological diffusion partly necessitated by trade policies from the West.
Economic growth theories postulate that the determinant of economic growth across countries
is the differences in technology adoption and human capital accumulation. Specifically, the
endogenous growth model states that technological advancement is directly related to
investment in human capital. Similarly, the human capital theory postulates that the higher the
quantity of schooling society the higher the economic growth (state of the economy). However,
available evidence revealed that the increased global quantity of education or schooling had
2
not yielded much impact on economic growth, especially in developing countries (IMF, 2017).
Bobetko, Draženović & Funda (2017) noted that rising school enrollment worldwide did not
yield much equitable income distribution, economic growth, and development, especially in
Africa. Evidence revealed that the global average of school enrollment has risen by 240 percent
between 1960 and 2015, while global income per capita has only grown by 19.44 percent within
the same period (World Bank, 2016). The missing link here is the fact that a mere rise in school
enrollment does not guarantee quality education, improved economic opportunities, and a
quality workforce. It borders on the question of whether the workforce (for example university
graduates) is competent and employable, given that available evidence shows that cognitive
skills and institutional quality (level of economic opportunities, democratic system, and quality
education) are major determinants of how effective human capital is in driving economic
growth (Ali et al., 2018; Hanushek, 2013; Joseph et al, 2021). This lack of emphasis on the role
of institutions and quality of education in the most empirical literature on growth as well as
policy framework including the popular MDGs programme brings to limelight the huge policy
lacuna in most growth and developmental policies across the globe.
To this end, this study aims to determine the role of social capabilities in the nexus between
human capital and the difference in cross-country growth rate. The rest of the paper is
structured in the form of a literature review, methodology, analysis, and conclusion.
2. Literature Review
2.1 Theoretical Evidence
The role of human capital and recently human capital interaction with social capability (role of
the institution and legal framework) in driving economic growth has received substantial
theoretical and empirical discussion since the work of Schultz (1961) and Becker (1962).
Solow (1956) growth model arguably appears to be the most potent first theoretical foundation
explaining differences in cross-country per capita income and factors that account for the long-
run economic growth of a country (Ali et al., 2018; Izushi & Huggins, 2004).
In an attempt to explain the factors responsible for the long-run economic growth and
differences in cross country income per capita; Solow relies on four major variables thus:
Y = F(K, AL) …………………………………………………………..(1)
where; Y = output, K = capital stock and L = labour force and A = Labour

3
Effectiveness. By employing Cobb-Douglas production function, equation (1) can be re-written
as;
Y= 𝐾𝐾𝛼𝛼𝐴𝐴𝐴𝐴1−𝛼𝛼, 0 < α <1 ………………………………………….………… (2)
To see this, we can write the output per effective labour as a function of the effectiveness of
capital per labour by multiplying 1/AL all through as seen in equation (3) below.
y = 𝑘𝑘𝛼𝛼 = f (k) ……………………………………………………………… . (3)
Such that, f ’> 0 and f ’’ < 0. Equation three entails that labour productivity can only be
achieved through more capital deepening, that is, increasing capital intensity (Izushi &
Huggins, 2004). Overall, the assumption of diminishing returns to capital entails that output
per effective worker does not increase indefinitely with an increase in capital, so long as
individuals save a constant fraction of their income (s), and depreciation occurs on capital
investment (𝛿𝛿). Where ‘n’ represents population growth and ‘g’ represent knowledge growth
rate, such that the rate of increase in capital (k) can be written as;
∆𝑘𝑘∆𝑡𝑡 = 𝑠𝑠𝑠𝑠(𝑘𝑘) − (𝑛𝑛 + 𝑔𝑔 + 𝛿𝛿)𝑘𝑘 …………………………………………. (4)
when ∆𝑘𝑘∆𝑡𝑡 = 0; 𝑠𝑠𝑠𝑠(𝑘𝑘) = (𝑛𝑛 + 𝑔𝑔 + 𝛿𝛿)𝑘𝑘 …………………………..…….. (5)
Or, 𝑠𝑠(𝑘𝑘) = (𝑛𝑛 + 𝑔𝑔 + 𝛿𝛿)𝑘𝑘 𝑠𝑠� …………………………………………… (6)
Equations (5) and (6) are the key equation of the Solow neoclassical model. The equation states
that the derivative of 𝑘𝑘 is the difference between the per unit of actual investment per labour
and the amount of investment that must be done to keep capital per unit of effective labour (k)
at that point (Romer, 2012). Solow concludes that regardless of where the economy starts, the
economy will converge where output per worker (y) will be growing at the rate g. Meaning
that knowledge or technological progress is the only source of growth in such an economy
(Ludema, 2014; Barro, 1998).
However, following the work of Mankiw et al. (1992), equation (1) can be rewritten by
assuming that technology progress (A) does not enter the model multiplicatively to capture the
current state of technological knowledge as given in equation (7);
Y = F (A, K, L) ………………………………………………………… (7)
4
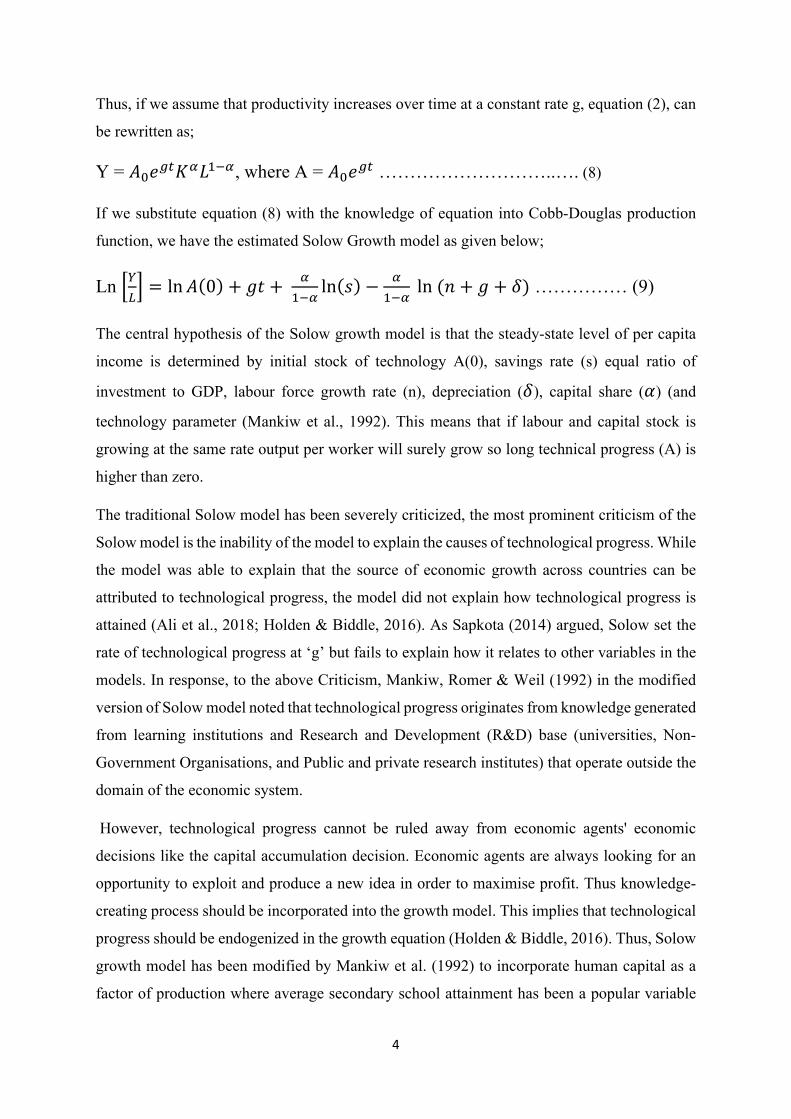
Thus, if we assume that productivity increases over time at a constant rate g, equation (2), can
be rewritten as;
Y = 𝐴𝐴0𝑒𝑒𝑔𝑔𝑡𝑡𝐾𝐾𝛼𝛼𝐴𝐴1−𝛼𝛼, where A = 𝐴𝐴0𝑒𝑒𝑔𝑔𝑡𝑡 ………………………..…. (8)
If we substitute equation (8) with the knowledge of equation into Cobb-Douglas production
function, we have the estimated Solow Growth model as given below;
Ln �𝑌𝑌𝐿𝐿� = ln𝐴𝐴(0) + 𝑔𝑔𝑔𝑔 + 𝛼𝛼1−𝛼𝛼 ln(𝑠𝑠) − 𝛼𝛼1−𝛼𝛼 ln (𝑛𝑛 + 𝑔𝑔 + 𝛿𝛿) …………… (9)
The central hypothesis of the Solow growth model is that the steady-state level of per capita
income is determined by initial stock of technology A(0), savings rate (s) equal ratio of
investment to GDP, labour force growth rate (n), depreciation (𝛿𝛿), capital share (𝛼𝛼) (and
technology parameter (Mankiw et al., 1992). This means that if labour and capital stock is
growing at the same rate output per worker will surely grow so long technical progress (A) is
higher than zero.
The traditional Solow model has been severely criticized, the most prominent criticism of the
Solow model is the inability of the model to explain the causes of technological progress. While
the model was able to explain that the source of economic growth across countries can be
attributed to technological progress, the model did not explain how technological progress is
attained (Ali et al., 2018; Holden & Biddle, 2016). As Sapkota (2014) argued, Solow set the
rate of technological progress at ‘g’ but fails to explain how it relates to other variables in the
models. In response, to the above Criticism, Mankiw, Romer & Weil (1992) in the modified
version of Solow model noted that technological progress originates from knowledge generated
from learning institutions and Research and Development (R&D) base (universities, Non-
Government Organisations, and Public and private research institutes) that operate outside the
domain of the economic system.
However, technological progress cannot be ruled away from economic agents' economic
decisions like the capital accumulation decision. Economic agents are always looking for an
opportunity to exploit and produce a new idea in order to maximise profit. Thus knowledge-
creating process should be incorporated into the growth model. This implies that technological
progress should be endogenized in the growth equation (Holden & Biddle, 2016). Thus, Solow
growth model has been modified by Mankiw et al. (1992) to incorporate human capital as a
factor of production where average secondary school attainment has been a popular variable
5
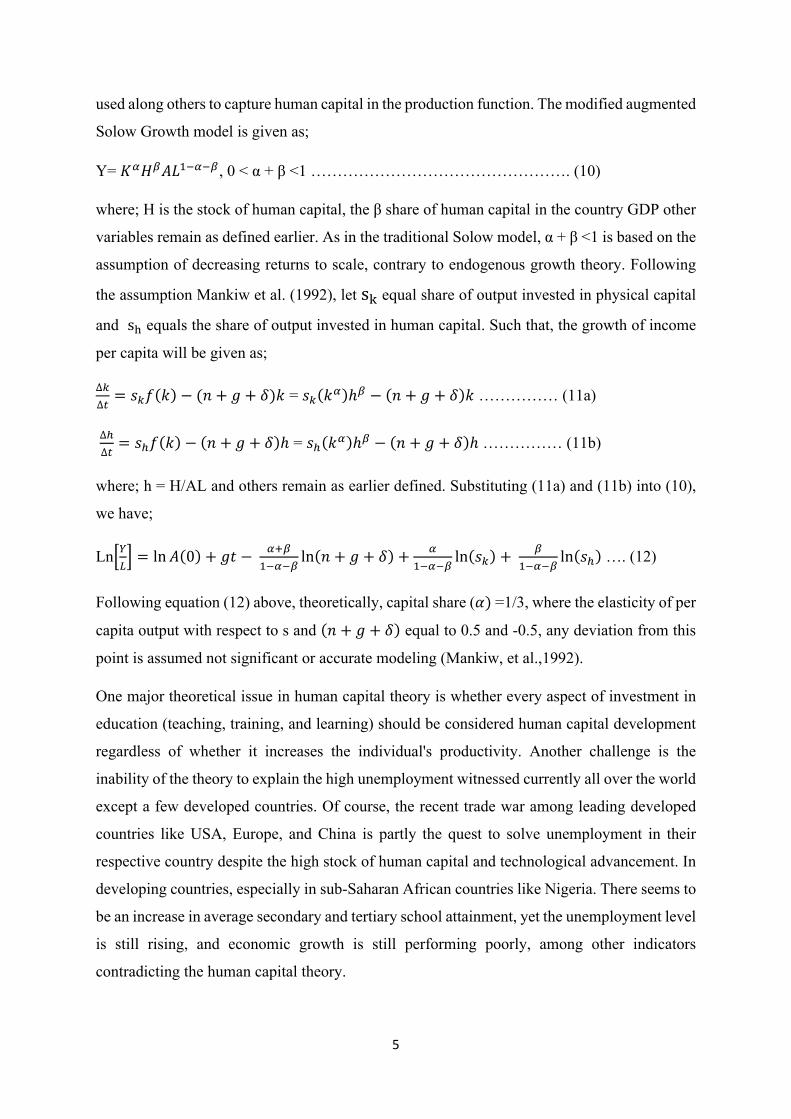
used along others to capture human capital in the production function. The modified augmented
Solow Growth model is given as;
Y= 𝐾𝐾𝛼𝛼𝐻𝐻𝛽𝛽𝐴𝐴𝐴𝐴1−𝛼𝛼−𝛽𝛽, 0 < α + β <1 …………………………………………. (10)
where; H is the stock of human capital, the β share of human capital in the country GDP other
variables remain as defined earlier. As in the traditional Solow model, α + β <1 is based on the
assumption of decreasing returns to scale, contrary to endogenous growth theory. Following
the assumption Mankiw et al. (1992), let sk equal share of output invested in physical capital
and sh equals the share of output invested in human capital. Such that, the growth of income
per capita will be given as;
∆𝑘𝑘∆𝑡𝑡 = 𝑠𝑠𝑘𝑘𝑠𝑠(𝑘𝑘) − (𝑛𝑛 + 𝑔𝑔 + 𝛿𝛿)𝑘𝑘 = 𝑠𝑠𝑘𝑘(𝑘𝑘𝛼𝛼)ℎ𝛽𝛽 − (𝑛𝑛 + 𝑔𝑔 + 𝛿𝛿)𝑘𝑘 …………… (11a)
∆ℎ∆𝑡𝑡 = 𝑠𝑠ℎ𝑠𝑠(𝑘𝑘) − (𝑛𝑛 + 𝑔𝑔 + 𝛿𝛿)ℎ = 𝑠𝑠ℎ(𝑘𝑘𝛼𝛼)ℎ𝛽𝛽 − (𝑛𝑛 + 𝑔𝑔 + 𝛿𝛿)ℎ …………… (11b)
where; h = H/AL and others remain as earlier defined. Substituting (11a) and (11b) into (10),
we have;
Ln�𝑌𝑌𝐿𝐿� = ln𝐴𝐴(0) + 𝑔𝑔𝑔𝑔 − 𝛼𝛼+𝛽𝛽1−𝛼𝛼−𝛽𝛽 ln(𝑛𝑛 + 𝑔𝑔 + 𝛿𝛿) +
𝛼𝛼1−𝛼𝛼−𝛽𝛽 ln(𝑠𝑠𝑘𝑘) + 𝛽𝛽1−𝛼𝛼−𝛽𝛽 ln(𝑠𝑠ℎ) …. (12)
Following equation (12) above, theoretically, capital share (𝛼𝛼) =1/3, where the elasticity of per
capita output with respect to s and (𝑛𝑛 + 𝑔𝑔 + 𝛿𝛿) equal to 0.5 and -0.5, any deviation from this
point is assumed not significant or accurate modeling (Mankiw, et al.,1992).
One major theoretical issue in human capital theory is whether every aspect of investment in
education (teaching, training, and learning) should be considered human capital development
regardless of whether it increases the individual's productivity. Another challenge is the
inability of the theory to explain the high unemployment witnessed currently all over the world
except a few developed countries. Of course, the recent trade war among leading developed
countries like USA, Europe, and China is partly the quest to solve unemployment in their
respective country despite the high stock of human capital and technological advancement. In
developing countries, especially in sub-Saharan African countries like Nigeria. There seems to
be an increase in average secondary and tertiary school attainment, yet the unemployment level
is still rising, and economic growth is still performing poorly, among other indicators
contradicting the human capital theory.
6
2.2 Empirical Evidence.
Several empirical works have investigated the impact of human capital on cross-country
income differences. In summary, human capital theory attributes knowledge as the most potent
driver of economic growth across countries (Ali et al., 2018; Ludema, 2014; Barro, 1998;
Shultz, 1961).
One of the earliest literature to investigate human capital and economic growth across countries
is Barro (1991). Barro employed a series of human capital variables with emphasis on the
quantity of education and growth rate per capita income. Using OLS, Barro (1991) found that
school enrolment rate is positively related to the growth rate of income per capita for a given
level of initial per capita income using data from 100 countries. Barro (1998) later re-examined
the relationship between human capital and economic growth using the same data set but made
a series of modifications to the data used and assumption. For instance, Barro disaggregates
the data for school enrollment to males and females to check whether gender influences the
extent the human capital impacts economic growth. The result revealed that male school
attainment at level has a significant positive impact on the growth rate of income per capita
across countries while female school attainment does not have any significant impact.
In response to criticism of using school enrolment as measure of human capital that ignores
quality, in 1998, Barro further examined whether school quality has any significant impact on
how human capital influences the cross-country economic growth rate. He employed students'
scores in science to achieve this, which positively impacted the human-economic growth rate
nexus. Mankiw et al. (1992) investigated both Solow growth model and the augmented Solow
model, where they introduce human capital variables in the model using panel data. They
model the growth rate of income per capita as a function of income per capita at level,
population growth rate, real investment ratio, average secondary school attainment as human
capital variables, and other variables. They argued that the addition of the human capital
variable in the model was able to explain the disparity in the growth rate of income per capita
among different countries of the world. They argue that there will be convergence in the long
run as more developing countries invest more in human capital accumulation. These countries
will be able to successfully imitate the technological advancement of the developed countries.
They used the lag one of the per capita growth rate to determine Solow conditional
convergence.
7
Benhabib & Spiegel (1994) investigated the applicability of the Mankiw et al. (1992)
augmented Solow model. The authors first duplicated the Mankiw model using Cobb-Douglass
production function where human capital captured as years of secondary school enrolment was
used as input in the production function. It was revealed from the findings that human capital
used as part of input in the production function does not have a significant positive impact on
the difference in income per capital across countries, contrary to the significant positive impact
found by Mankiw et al. (1992). In a second model, the researcher investigated the endogenous
model that argued that human capital does not directly enter the growth equation but through
innovation and technological diffusion. The authors modeled technological diffusion and
innovation using total factor productivity as a function of human capital. It was discovered that
human capital has a significant positive relationship with technological diffusion and
innovation based on the data set used to estimate the relationship. Therefore, the authors
concluded that human capital surely impacts the difference in cross-country income through
technological diffusion and innovation and not directly on the income as treated by Mankiw et
al. (1992).
Similarly, Caselli et al. (1996), following Mankiw et al. (1992) estimated the growth rate
income per capita determinant across the country using cross-country panel data in the
framework of generalized method of moment (GMM). The authors like Islam (1995) criticize
the methodological approach employed by Mankiw et al. (1992) on the ground that one at least
of the explanatory variables might be endogenous, leading to a wrong prediction of
convergence between developing countries and developed countries in the long run. In dealing
with endogeneity and estimation bias issues, the author recommended the use of GMM as the
appropriate estimation technique. They argue that time-invariant of country-specific effect and
the lagged dependent variables, OLS, and fixed-effect (within the group) might lead to upward
bias and possibly generate an upward correlation between the lagged dependent variables and
the country-specific effect. This will make OLS (Mankiw et al., 1992) bias and inconsistent.
Using the General method of moment (GMM) as suggested to estimate the model, they found
that real income per capita converges to a steady-state in the long run by at least 10 percent per
annum.
A critic of Caselli et al.. (1996) methodological approach is that of Bond, Hoeffler, & Temple
(2001) using cross-country panel data. The authors criticize Caselli et al. (1996) first difference
estimation in terms of precision and bias. They argue that the first difference estimator has a
large finite downward bias, basically because of the small sample period. The view is that
8
Caselli et al.. (1996) first difference estimation in GMM framework might perform poorly due
to the weak instrument. As such, Bond et al. (2001) recommended the application of system
GMM instead of the first difference GMM as applied by Caselli et al.. Since system GMM has
the original equation, it improves efficiency and reduces the level of finite sample bias.
Sunde & Vischer (2015) further examined the factor responsible for the weak empirical effect
of human capital on growth rate per capita among most cross countries literature. They argued
on the issues with the neoclassical growth model, which ignores most of the important variables
through which human capital impact the economic growth of a country affects the models. The
authors employed cross-country panel data for 80 countries using three different data set for
capturing average years of schooling (channels through which human capital impacts growth
rate per capita). Using school enrolment average, international student scores, and mean years
of schooling measure human capital on economic growth. They argued that human capital,
when controlled for measurement error and heterogeneity, has a significant impact on GDP
growth across countries.
Recent, literature tends to account for social capabilities interaction with human capital in
explaining the existing nexus between human capital and economic growth. As argued by Ali
et al. (2018), the social capabilities within a country impact the growth process by influencing
the quality and effectiveness of the normal production factors, including human capital. As
noted by the author, social capabilities encompass formalized institutions' role, like rule of law,
court system, political liberation, democracy prevalence in enhancing human capital. This
prompted Ali et al. (2018), to argue that institutional factors should be incorporated in the
growth equation, it the exact influence of human capital on the growth rate across countries
will be extracted. Several measures have been used in literature to measure the influence of
social capability as it interacts with human capital and economic growth across country. It was
revealed that human capital significantly impacts income per capita growth rate when there are
better opportunities and high-quality legal institutions are available.
3. METHODOLOGY
3.1 Data and Sources
All data are either sourced from World Bank Development Indicators (WDI), Penn World
databank, v8.0, and Economic Freedom Data set of Fraser Institute1. The most common human
1 https://www.fraserinstitute.org/economic-freedom/
9
capital proxy used in literature is secondary and primary school enrolment (Barro, 1998) data
available in Barro & Lee (2011). However, given the recent argument in literature that human
capital proxy based on school enrollment does not provide a good description of a country
educational system, the researcher employed a robust human capital index that captured years
of schooling, quality of education, and returns on education at Penn World database as a proxy
for human capital. Social capabilities indices will be sourced from the economic freedom data
bank. The three leading social capability indices include political freedom (captured by
democracy index), economic opportunities (captured by property and legal right), and freedom
to trade locally and internationally (captured by trade openness). The index score is between 0
&10 where 10 represents the highest level of freedom and 0 represents the lowest level of
freedom. For instance, a well-established democratic setting improves the legal institution of
a country through effective check and balances, reduces abuse of power, reduce corruption and
increase investment since the investor believes in government accountability. Democracy is
said to guarantee more equitable redistribution of income which is capable of reducing unrest,
violence, and social revolution, which have a negative relationship with investment cum
economic growth. Again, the legal and property right is also a component of the economic
freedom index that is made up of factors relating to the prevailing quality of legal institutions.
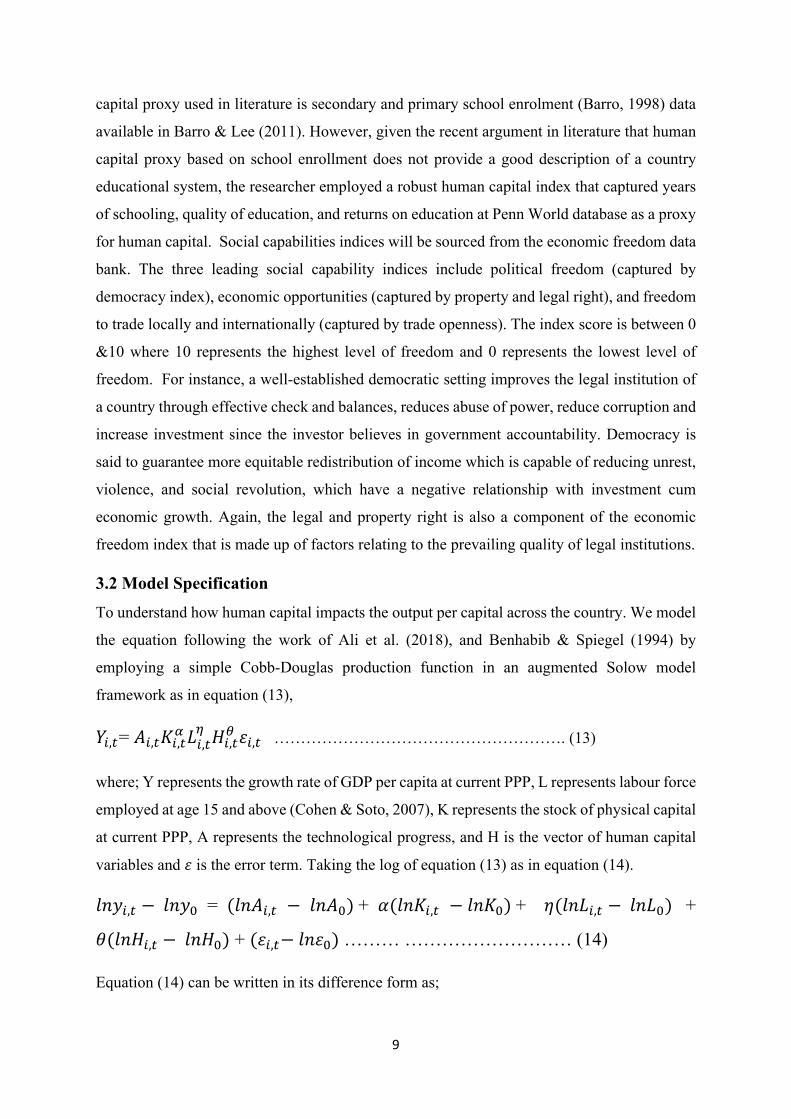
3.2 Model Specification
To understand how human capital impacts the output per capital across the country. We model
the equation following the work of Ali et al. (2018), and Benhabib & Spiegel (1994) by
employing a simple Cobb-Douglas production function in an augmented Solow model
framework as in equation (13), 𝑌𝑌𝑖𝑖,𝑡𝑡= 𝐴𝐴𝑖𝑖,𝑡𝑡𝐾𝐾𝑖𝑖,𝑡𝑡𝛼𝛼 𝐴𝐴𝑖𝑖,𝑡𝑡𝜂𝜂 𝐻𝐻𝑖𝑖,𝑡𝑡𝜃𝜃 𝜀𝜀𝑖𝑖,𝑡𝑡 ………………………………………………. (13)
where; Y represents the growth rate of GDP per capita at current PPP, L represents labour force
employed at age 15 and above (Cohen & Soto, 2007), K represents the stock of physical capital
at current PPP, A represents the technological progress, and H is the vector of human capital
variables and 𝜀𝜀 is the error term. Taking the log of equation (13) as in equation (14). 𝑙𝑙𝑛𝑛𝑙𝑙𝑖𝑖,𝑡𝑡 − 𝑙𝑙𝑛𝑛𝑙𝑙0 = (𝑙𝑙𝑛𝑛𝐴𝐴𝑖𝑖,𝑡𝑡 − 𝑙𝑙𝑛𝑛𝐴𝐴0) + 𝛼𝛼(𝑙𝑙𝑛𝑛𝐾𝐾𝑖𝑖,𝑡𝑡 − 𝑙𝑙𝑛𝑛𝐾𝐾0) + 𝜂𝜂(𝑙𝑙𝑛𝑛𝐴𝐴𝑖𝑖,𝑡𝑡 − 𝑙𝑙𝑛𝑛𝐴𝐴0) + 𝜃𝜃(𝑙𝑙𝑛𝑛𝐻𝐻𝑖𝑖,𝑡𝑡 − 𝑙𝑙𝑛𝑛𝐻𝐻0) + (𝜀𝜀𝑖𝑖,𝑡𝑡− 𝑙𝑙𝑛𝑛𝜀𝜀0) ……… ……………………… (14)
Equation (14) can be written in its difference form as;
10
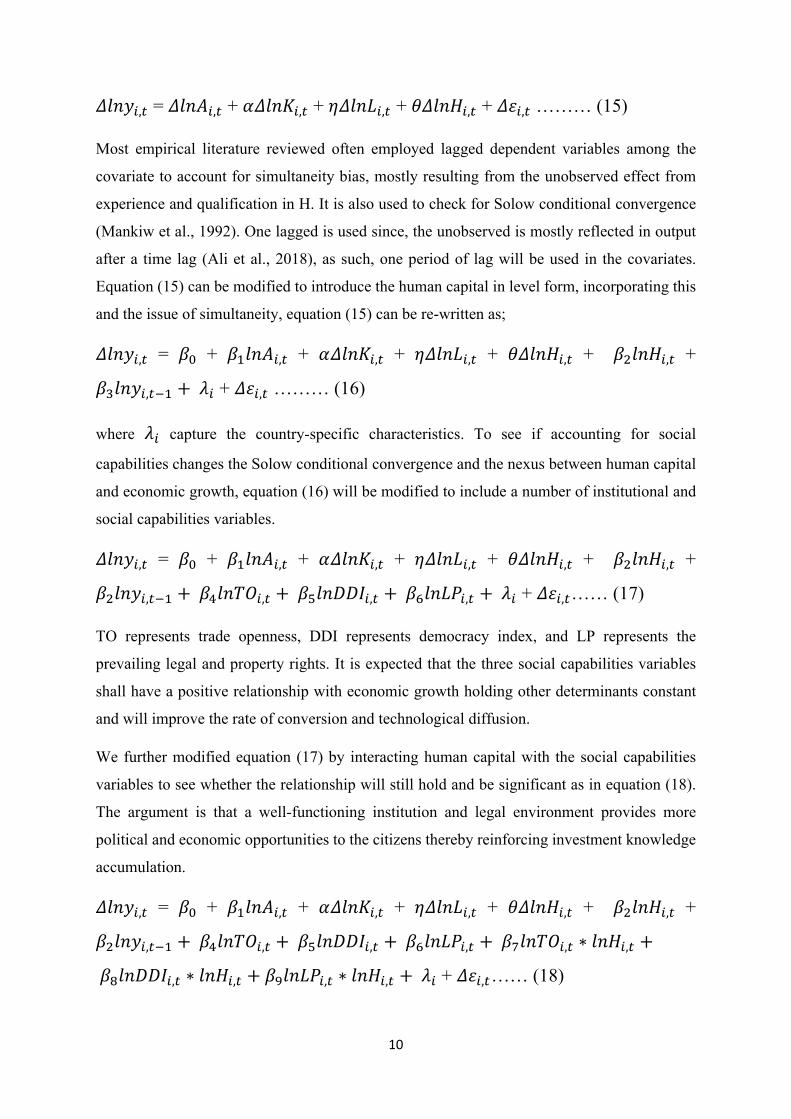
𝛥𝛥𝑙𝑙𝑛𝑛𝑙𝑙𝑖𝑖,𝑡𝑡 = 𝛥𝛥𝑙𝑙𝑛𝑛𝐴𝐴𝑖𝑖,𝑡𝑡 + 𝛼𝛼𝛥𝛥𝑙𝑙𝑛𝑛𝐾𝐾𝑖𝑖,𝑡𝑡 + 𝜂𝜂𝛥𝛥𝑙𝑙𝑛𝑛𝐴𝐴𝑖𝑖,𝑡𝑡 + 𝜃𝜃𝛥𝛥𝑙𝑙𝑛𝑛𝐻𝐻𝑖𝑖,𝑡𝑡 + 𝛥𝛥𝜀𝜀𝑖𝑖,𝑡𝑡 ……… (15)
Most empirical literature reviewed often employed lagged dependent variables among the
covariate to account for simultaneity bias, mostly resulting from the unobserved effect from
experience and qualification in H. It is also used to check for Solow conditional convergence
(Mankiw et al., 1992). One lagged is used since, the unobserved is mostly reflected in output
after a time lag (Ali et al., 2018), as such, one period of lag will be used in the covariates.
Equation (15) can be modified to introduce the human capital in level form, incorporating this
and the issue of simultaneity, equation (15) can be re-written as; 𝛥𝛥𝑙𝑙𝑛𝑛𝑙𝑙𝑖𝑖,𝑡𝑡 = 𝛽𝛽0 + 𝛽𝛽1𝑙𝑙𝑛𝑛𝐴𝐴𝑖𝑖,𝑡𝑡 + 𝛼𝛼𝛥𝛥𝑙𝑙𝑛𝑛𝐾𝐾𝑖𝑖,𝑡𝑡 + 𝜂𝜂𝛥𝛥𝑙𝑙𝑛𝑛𝐴𝐴𝑖𝑖,𝑡𝑡 + 𝜃𝜃𝛥𝛥𝑙𝑙𝑛𝑛𝐻𝐻𝑖𝑖,𝑡𝑡 + 𝛽𝛽2𝑙𝑙𝑛𝑛𝐻𝐻𝑖𝑖,𝑡𝑡 + 𝛽𝛽3𝑙𝑙𝑛𝑛𝑙𝑙𝑖𝑖,𝑡𝑡−1 + 𝜆𝜆𝑖𝑖 + 𝛥𝛥𝜀𝜀𝑖𝑖,𝑡𝑡 ……… (16)
where 𝜆𝜆𝑖𝑖 capture the country-specific characteristics. To see if accounting for social
capabilities changes the Solow conditional convergence and the nexus between human capital
and economic growth, equation (16) will be modified to include a number of institutional and
social capabilities variables. 𝛥𝛥𝑙𝑙𝑛𝑛𝑙𝑙𝑖𝑖,𝑡𝑡 = 𝛽𝛽0 + 𝛽𝛽1𝑙𝑙𝑛𝑛𝐴𝐴𝑖𝑖,𝑡𝑡 + 𝛼𝛼𝛥𝛥𝑙𝑙𝑛𝑛𝐾𝐾𝑖𝑖,𝑡𝑡 + 𝜂𝜂𝛥𝛥𝑙𝑙𝑛𝑛𝐴𝐴𝑖𝑖,𝑡𝑡 + 𝜃𝜃𝛥𝛥𝑙𝑙𝑛𝑛𝐻𝐻𝑖𝑖,𝑡𝑡 + 𝛽𝛽2𝑙𝑙𝑛𝑛𝐻𝐻𝑖𝑖,𝑡𝑡 + 𝛽𝛽2𝑙𝑙𝑛𝑛𝑙𝑙𝑖𝑖,𝑡𝑡−1 + 𝛽𝛽4𝑙𝑙𝑛𝑛𝑙𝑙𝑙𝑙𝑖𝑖,𝑡𝑡 + 𝛽𝛽5𝑙𝑙𝑛𝑛𝑙𝑙𝑙𝑙𝑙𝑙𝑖𝑖,𝑡𝑡 + 𝛽𝛽6𝑙𝑙𝑛𝑛𝐴𝐴𝑙𝑙𝑖𝑖,𝑡𝑡 + 𝜆𝜆𝑖𝑖 + 𝛥𝛥𝜀𝜀𝑖𝑖,𝑡𝑡…… (17)
TO represents trade openness, DDI represents democracy index, and LP represents the
prevailing legal and property rights. It is expected that the three social capabilities variables
shall have a positive relationship with economic growth holding other determinants constant
and will improve the rate of conversion and technological diffusion.
We further modified equation (17) by interacting human capital with the social capabilities
variables to see whether the relationship will still hold and be significant as in equation (18).
The argument is that a well-functioning institution and legal environment provides more
political and economic opportunities to the citizens thereby reinforcing investment knowledge
accumulation. 𝛥𝛥𝑙𝑙𝑛𝑛𝑙𝑙𝑖𝑖,𝑡𝑡 = 𝛽𝛽0 + 𝛽𝛽1𝑙𝑙𝑛𝑛𝐴𝐴𝑖𝑖,𝑡𝑡 + 𝛼𝛼𝛥𝛥𝑙𝑙𝑛𝑛𝐾𝐾𝑖𝑖,𝑡𝑡 + 𝜂𝜂𝛥𝛥𝑙𝑙𝑛𝑛𝐴𝐴𝑖𝑖,𝑡𝑡 + 𝜃𝜃𝛥𝛥𝑙𝑙𝑛𝑛𝐻𝐻𝑖𝑖,𝑡𝑡 + 𝛽𝛽2𝑙𝑙𝑛𝑛𝐻𝐻𝑖𝑖,𝑡𝑡 + 𝛽𝛽2𝑙𝑙𝑛𝑛𝑙𝑙𝑖𝑖,𝑡𝑡−1 + 𝛽𝛽4𝑙𝑙𝑛𝑛𝑙𝑙𝑙𝑙𝑖𝑖,𝑡𝑡 + 𝛽𝛽5𝑙𝑙𝑛𝑛𝑙𝑙𝑙𝑙𝑙𝑙𝑖𝑖,𝑡𝑡 + 𝛽𝛽6𝑙𝑙𝑛𝑛𝐴𝐴𝑙𝑙𝑖𝑖,𝑡𝑡 + 𝛽𝛽7𝑙𝑙𝑛𝑛𝑙𝑙𝑙𝑙𝑖𝑖,𝑡𝑡 ∗ 𝑙𝑙𝑛𝑛𝐻𝐻𝑖𝑖,𝑡𝑡 +
𝛽𝛽8𝑙𝑙𝑛𝑛𝑙𝑙𝑙𝑙𝑙𝑙𝑖𝑖,𝑡𝑡 ∗ 𝑙𝑙𝑛𝑛𝐻𝐻𝑖𝑖,𝑡𝑡 + 𝛽𝛽9𝑙𝑙𝑛𝑛𝐴𝐴𝑙𝑙𝑖𝑖,𝑡𝑡 ∗ 𝑙𝑙𝑛𝑛𝐻𝐻𝑖𝑖,𝑡𝑡 + 𝜆𝜆𝑖𝑖 + 𝛥𝛥𝜀𝜀𝑖𝑖,𝑡𝑡…… (18)

11
where 𝛽𝛽7 to 𝛽𝛽9 are the parameter estimate of the moderating factors between human capital -
economic growth nexus. The parameter estimate of the moderating factors is expected to
positively correlate with economic growth since the above factors theoretically enhance human
capital capabilities and productivity.
3.3 Estimation Procedure
The panel data will be subjected to a stationarity test to ensure the data are free from unit root.
In a panel framework, the stationarity test developed over time can generally be grouped into
the first generation that imposes the restriction that the time series in the panel data has cross-
sectional independence. Such an assumption is necessary to satisfy Lindberg-Levy central limit
theorem and easily obtain asymptotic normal distribution test (Im, Pesaran and Shin test, 2003;
Mandala & Wu, 2000; Hadri, 2000). While the second generation tried to overcome the
assumption made by the first generation to allow for the situation where the time series in the
panel data have cross-sectional dependence (Bai & Ng, 2004; Moon and Perron, 2004). This
article adopted the first-generation panel unit root test as the study maintains the assumption
of independent cross-sectional correlation.
To estimate the models, this study shall rely on General Methods of Moments (GMM). Most
growth models explained the impact of human capital on the differences in income per capita
across countries using panel OLS (Barro, 1991), panel fixed and random effect (Islam, 1995),
First difference GMM (Caselli et al., 1996). Fixed effect, for instance, allow the estimation of
the unobserved country-specific effect 𝜆𝜆𝑖𝑖 as in equations (16) to (18), this is based on the
several advantages it has – reduces measurement errors among others.
As compared to fixed effect and random effect, GMM offered more robust estimation
advantages over the other estimation techniques in panel data estimation. The argument is that
time-invariant of country-specific effect and the lagged dependent variable, OLS, and Fixed-
effect (within the group) might lead to an upward bias. This will make OLS (Mankiw et al.,
1992) and fixed effect (Islam, 1995) bias and inconsistent. Also, it enables the correction of
endogeneity common in growth equation by adding lagged of the independent variables as
instruments in the equation. In the study following Dansasi (2013), Bond et al. (2001)
employed system GMM to investigate the relationship since it improves efficiency and reduces
the level of finite sample bias. The first difference GMM will not be used considering the
argument of Bond et al. (2001), who noted that first difference estimation in GMM framework
might perform poorly due to the weak instrument.
12
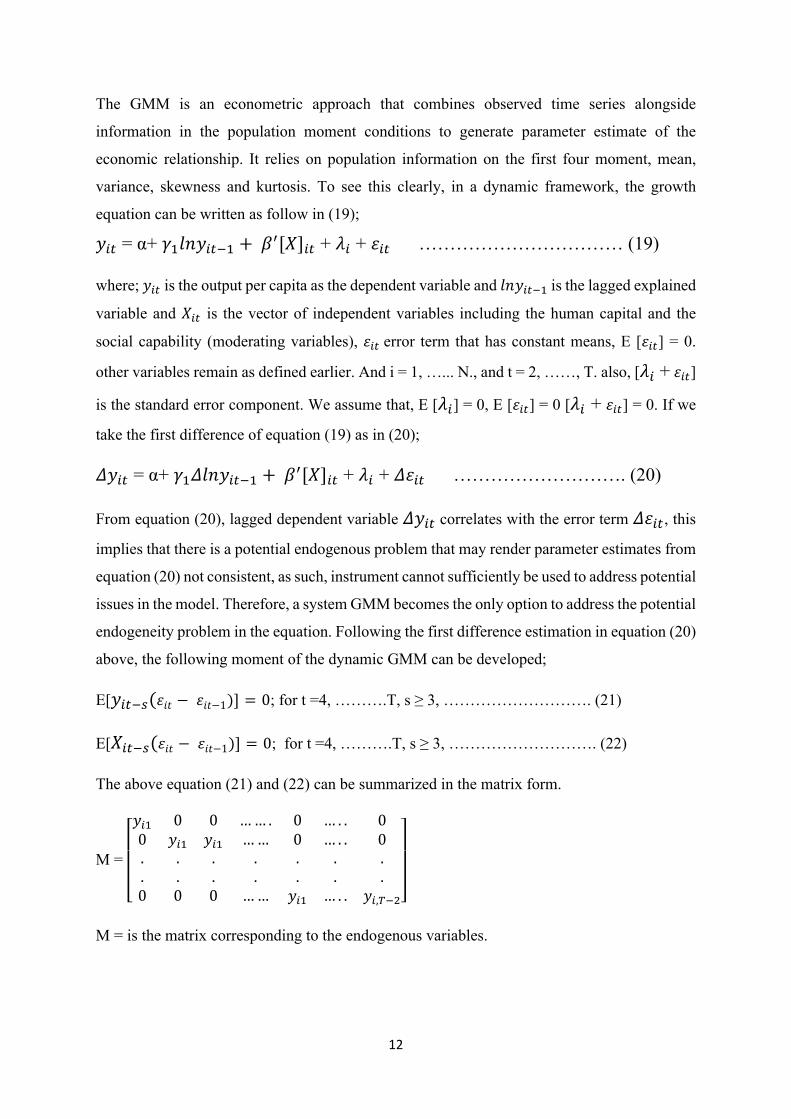
The GMM is an econometric approach that combines observed time series alongside
information in the population moment conditions to generate parameter estimate of the
economic relationship. It relies on population information on the first four moment, mean,
variance, skewness and kurtosis. To see this clearly, in a dynamic framework, the growth
equation can be written as follow in (19); 𝑙𝑙𝑖𝑖𝑡𝑡 = α+ 𝛾𝛾1𝑙𝑙𝑛𝑛𝑙𝑙𝑖𝑖𝑡𝑡−1 + 𝛽𝛽′[𝑋𝑋]𝑖𝑖𝑡𝑡 + 𝜆𝜆𝑖𝑖 + 𝜀𝜀𝑖𝑖𝑡𝑡 …………………………… (19)
where; 𝑙𝑙𝑖𝑖𝑡𝑡 is the output per capita as the dependent variable and 𝑙𝑙𝑛𝑛𝑙𝑙𝑖𝑖𝑡𝑡−1 is the lagged explained
variable and 𝑋𝑋𝑖𝑖𝑡𝑡 is the vector of independent variables including the human capital and the
social capability (moderating variables), 𝜀𝜀𝑖𝑖𝑡𝑡 error term that has constant means, E [𝜀𝜀𝑖𝑖𝑡𝑡] = 0.
other variables remain as defined earlier. And i = 1, …... N., and t = 2, ……, T. also, [𝜆𝜆𝑖𝑖 + 𝜀𝜀𝑖𝑖𝑡𝑡] is the standard error component. We assume that, E [𝜆𝜆𝑖𝑖] = 0, E [𝜀𝜀𝑖𝑖𝑡𝑡] = 0 [𝜆𝜆𝑖𝑖 + 𝜀𝜀𝑖𝑖𝑡𝑡] = 0. If we
take the first difference of equation (19) as in (20); 𝛥𝛥𝑙𝑙𝑖𝑖𝑡𝑡 = α+ 𝛾𝛾1𝛥𝛥𝑙𝑙𝑛𝑛𝑙𝑙𝑖𝑖𝑡𝑡−1 + 𝛽𝛽′[𝑋𝑋]𝑖𝑖𝑡𝑡 + 𝜆𝜆𝑖𝑖 + 𝛥𝛥𝜀𝜀𝑖𝑖𝑡𝑡 ………………………. (20)
From equation (20), lagged dependent variable 𝛥𝛥𝑙𝑙𝑖𝑖𝑡𝑡 correlates with the error term 𝛥𝛥𝜀𝜀𝑖𝑖𝑡𝑡, this
implies that there is a potential endogenous problem that may render parameter estimates from
equation (20) not consistent, as such, instrument cannot sufficiently be used to address potential
issues in the model. Therefore, a system GMM becomes the only option to address the potential
endogeneity problem in the equation. Following the first difference estimation in equation (20)
above, the following moment of the dynamic GMM can be developed;
E[𝑙𝑙𝑖𝑖𝑡𝑡−𝑠𝑠(𝜀𝜀𝑖𝑖𝑔𝑔 − 𝜀𝜀𝑖𝑖𝑔𝑔−1)] = 0; for t =4, ……….T, s ≥ 3, ………………………. (21)
E[𝑋𝑋𝑖𝑖𝑡𝑡−𝑠𝑠(𝜀𝜀𝑖𝑖𝑔𝑔 − 𝜀𝜀𝑖𝑖𝑔𝑔−1)] = 0; for t =4, ……….T, s ≥ 3, ………………………. (22)
The above equation (21) and (22) can be summarized in the matrix form.
M = ⎣⎢⎢⎢⎡𝑙𝑙𝑖𝑖1 0 0 … … . 0 … . . 0
0 𝑙𝑙𝑖𝑖1 𝑙𝑙𝑖𝑖1 … … 0 … . . 0
. . . . . . .
. . . . . . .
0 0 0 … … 𝑙𝑙𝑖𝑖1 … . . 𝑙𝑙𝑖𝑖,𝑇𝑇−2⎦⎥⎥⎥⎤
M = is the matrix corresponding to the endogenous variables.

13
4. Result and Discussion
The study started by conducting a correlation matrix as presented in table 1. Variables remain
as defined earlier.
Table 1: Correlation Matrix
Variables GDP K L A H TO DD LP
GDP 1
K 0.687*** 1
L 0.616*** 0.481*** 1
A 0.275*** 0.290*** -0.0552 1
H 0.3897** 0.0858* -0.164*** 0.365*** 1
TO -0.287*** -0.270*** -0.181*** -0.106** -0.0339 1
DD 0.347*** 0.0605 -0.196*** 0.564*** 0.408*** -0.112*** 1
LP 0.128*** 0.00185 -0.0661 0.268*** 0.308*** 0.00613 0.443*** 1
Note: Significance is indicated as follows: ***, ** and * for 1%, 5% and 10% respectively.
The correlation matrix was conducted to ensure that the analysis variables do not exhibit near-
perfect correlations among each other. A situation where changes in one of the explanatory
variables can influence the changes in another variable leads to a situation of bias estimate. As
seen, there is no evidence of multicollinearity in the series.
Having established that our model is free from multicollinearity, we proceed to estimate the
panel unit root test using the first-generation approach. The study employed both the Fisher-
based unit root test and Im, Pesaran & Shin (IPS) to check for stationarity because of their
superiority to other first-generation tests.
Variables IPS @ Level IPS @ 1st Difference
Statistics/P-value
Fisher @ Level Fisher @ First
Difference
Fffgg Statistics/P-value Statistic/P-value Statistics/ P-value
LGDP/Lny 4.5457 (1.0000) -12.2639 (0.0000)*** -3.2752 (0.9995) -16.9932 (0.0000)***
LnK 7.8551 (1.0000) -5.3780 (0.0000)*** -4.9545 (1.0000) -6.0923 (0.0000)***
LnL 3.2121 (0.99993) -9.4363 (0.0000)*** -1.7284 (0.958) -13.0225 (0.0000)***
LnH 4.5287 (1.0000) -3.0082 (0.0000)*** -1.1205 (0.8688) -5.3467 (0.0000)***
LnA 2.3452 (1.0000) -6.5636 (0.0000)*** 0.0713 (0.4716) -13.5987 (0.0000)***
LnTO -1.5944(0.0554)** -13.8831 (0.0000)*** -2.0222 (0.0216)*** -18.9747 (0.0000)***
LnDD 3.4453 (0.9995) -3.4982 (0.0000)*** -3.1757 (0.0009)*** -23.8688 (0.0000)***

14
Table 2: Panel Unit Root test Using IPS and Fisher Approach/ AIC Criteria
Notes: The P-value is enclosed in the parentheses. All variables are logged and significance is
indicated as follows: ***, ** and * for 1%, 5%, and 10%, respectively.
We could see from the panel unit root test in table 2 that none of the model's key variables is
stationary at level in both IPS and Fisher-based approach except for the institutional variables.
Of course, judging by the fact that our model's time dimension is relatively small with N > T
and the data are strongly balanced unit root should not be an issue for the study. However, to
ensure there is no room for any doubt on our estimated parameters, the study proceeded to
further differentiate the variables following the suggestion of Bai & Ng (2004) and Moon &
Perron (2004).
The study employed the Westerlund co-integration test to check for the existence of long-run
relationship.
Table 3: Westerlund Co-integration test
Results for H0: no co-integration: With 40 series and 1 covariate
Statistics Value Z-value P-value
Gt -3.442 -11.715 0.0000
Ga -13.465 -7.346 0.0000
Pt -21.952 -12.871 0.0000
Pa -15.912 -16.642 0.0000
From the Westerlund result presented in table 4.3 above, it is evident that all the series
categories from Gt to Pa are significant at 1% level of significance. This implies that null
hypothesis of no co-integration is rejected.
Having validated that there is a long-run relationship between the variables of interest, the
study, therefore, estimated the relationship between the variables using the General Method of
Moment (GMM). Following Roodman (2009) argument, it is important to choose between
system GMM and difference GMM on certain statistics. Following Bond et al. (2001) rule of
thumb approach, it can be revealed that the difference GMM coefficient is close and less than
the fixed effect coefficient, which indicates a negative downward bias of the difference GMM
LnLP -3.1631(0.0008)*** -21.9424 (0.0000)*** -5.5125 (0.0000)*** -37.323 (0.0000)***

15
due to weak instruments as seen in table 4, thereby leaving us with system GMM as the best
estimation technique.
Table 4: Decision Making Criteria
Pooled
OLS
Fixed
Effect
Difference
GMM
System
GMM
Lny_1 -.001828 -0.901180 -0.884942 -0.88063
Remark 1.82% 90.1% 88.4% 88.0%
Source: Author computation from Stata output
The estimate for the three key model is as presented in table 5.
Table 5: System GMM result
Notes: The P-value is enclosed in the parentheses. All variables are logged and significance is
indicated as follows: ***, ** and * for 1%, 5% and 10% respectively.
Source: Author computation from Stata output
As seen in Table 5, when the model was estimated using fixed effect and without accounting
for social capabilities, only two variables labour and capital is significant at 5 percent level of
significance judging by the p-value. Both human capital at difference and level is only
significant at 10 percent with the expected sign. However, when the model were estimated with
Variables Fixed Effect
(Model 1) System GMM
(Model 2) Coeff./P-
value
System GMM/
(Model 3)
System GMM/
(Model 4)
Coeff./P-value Coeff./P-value Coeff./P-value
Lgdp_1 -0.9012(0.000)*** -0.8806 (0.000)*** -0.8962 (0.000)*** -0.8968 (0.000)*** 𝛥𝛥Lk 0.4330(0.000)*** 0.3935 (0.000)*** 0.4073 (0.000)*** 0.4121 (0.000)*** 𝛥𝛥LL 0.5873 (0.000)*** 0.6100 (0.000)*** 0.6456 (0.000)*** 0.7179 (0.001)*** 𝛥𝛥LA 0.2691 (0.272) 0.3322 (0.085)* 0.1575 (0.057)** 1.3804 (0.002)*** 𝛥𝛥LH 0.6486 (0.065)* 0.6203 (0.056)* 0.4437 (0.051)** 0.9416 (0.000)***
LLH 0.6586 (0.057)* 0.6403 (0.051)** 0.7437 (0.000)*** 0.9416 (0.000)***
LTO -0.0459 (0.884)** 0.0228 (0.017)***
LDD 0.0253 (0.027)** 0.0484 (0.0107)***
LLP 0.0009 (0.0957)* 0.0215 (0. 064)*
LH*TO 0.0285 (0.002)***
LH*DD 0.0111 (0.006)***
LH*LP 0.0423 (0.001)**
Observations 880 880 880 880
Number of
c_id
40 40 40 40
AR(2) 0.978 0.799 0.882
Hansen test 0.153 0.148 0.116
F-stat; P-
value (0.000)*** (0.000)*** (0.000)*** (0.000)***
16
GMM, human capital at level became significant though, human capital at difference and
knowledge are both insignificant at 5 percent. Specifically, it was discovered that a 1 percent
rise in the human capital development index across countries will lead to an increase in income
per capita by at least 64.03 percent at 5 percent level of significance. Other variables are also
significant with an expected sign except for knowledge and human capital at difference that
only became significant at 10 percent. The findings also reveal that the popular Solow
conditional convergence holds as the lag endogenous variable has a negative sign and is
consistent with previous studies like Mankiw et al. (1992) and that of Sunde & Vischer (2015).
It was discovered also that when we introduced social capabilities in the model, the impact of
human capital on the growth rate across countries improved by at least 10.33 percent. Similarly,
other variables in the model including labour, capital, and knowledge all witnessed an
improved impact on the difference in cross-country growth rate in per capita income. For
instance, labour increased by at least 3 percent, capital by 1 percent, and human capital by 10
percent. However, the introduction of the social capabilities did not change the Solow
conditional convergence but rather reinforce its impact.
According to Sunde & Vischer (2015), Solow conditional convergence states that, even if
countries differ in their saving rates, population growth rates, and production function (due to
unequal access to technology) they will converge to a steady-state with different capital-labour
ratio and different standards of living in the long-run. In a last-ditch, the study further interacts
human capital with social capabilities, as expected all the interactive variables positively
impact the growth rate of per capita income across country. And the impact of human capital
on economic growth became even stronger with the interaction of social capabilities. For
instance, the introduction of social capabilities in the model increases human capital's impact
on income per capita by 20.13 percent from the initial impact when social capabilities have not
been introduced in the model. The result is expected as an improved democratic system where
laws and policy are adhered to and the existence of checks and balances among the alms of
government individuals rights – political, economic, and property are resected thereby
improving the human capital impact in driving the necessary economic growth. Again,
economic openness offers the citizens a wider market for their products and services, facilitates
technological diffusion in developing countries like Africa.
The f-test p-value equally reveals that all the explanatory variables have a significant
relationship with economic growth across the country since the p-value (0.0000) is much less
17
than a 1 percent level of significance. Looking at the Arellano-Bond test of higher-order serial
correlation in Table 4.6, the AR2 p-value is 0.978, which is much higher than the 10 percent
level of significance as such we cannot reject the null hypothesis of serial correlation. We,
therefore, conclude that the model is free from serial autocorrelation and is fit for analysis.
Also, the model is checked for over-identification and validity of instruments using Hansen-
Sargan test. As seen in Table 4.6 above, the probability value of the Hansen validity test for
instrument validity is 0.153, which is greater than 1 percent level of significance, indicating
that the instrument used are valid.
5. Conclusion and Policy Recommendations.
This study has investigated human capital, social capabilities, and economic growth across
countries. The empirical findings revealed that human capital has a significant impact on the
growth rate of income per capita across countries. We discovered that without accounting for
social capabilities the impact of human capital on growth though positive is weakly significant.
But accounting for social capabilities rekindles the impact of human capital in driving the
growth rate across nations.
The finding is not surprising giving the fact that when the labour force has access to a working
legal system that respects individuals’ rights and freedom and increased economic opportunity,
they will intend to invest more in themselves and their future (human capacity building). An
improved democratic system of government and respect for the rule of law will lead to an
improved educational system, better job opportunities that will instill the hard work spirit and
working institution will decrease the informality in a country as argued by Tonuchi et al (2020).
Therefore, this study concludes that investment in human capital should be a deliberate
decision like the investment in physical capital if the nation intends to grow. And that
investment in human capital will not yield the required result if a sound legal, economic, and
political institution is not deliberately built.
Therefore, the study recommends strong institutional building by investing in the rule of law
and liberty of the citizens and investing in the infrastructural building to ensure a friendly
business environment. It is important to note that infrastructural building improves the
institutional factors thereby improving the relationship between human capital and economic
growth. Building an institution that guarantees everyone's rights and equitable distribution of
income should be the priority of developing countries' leaders. This can be achieved first
18
through a strong check and balances in the three alms of government and easing regulations
that hinder business success in the region.
Competing Interest
Authors declare no competing interests.
Disclaimer
The opinion shared are that of the author and not any institution.
References
Adler, G., Romain, A. D., Davide, F., Sinem, K. C., Ksenia, K. & Marcos, P. P. (2017) Gone
with the headwinds: Global productivity. IMF Staff Discussion Note, No: SDN/17/04.
Washington, D.C., International Monetary Fund
Ali, M., Egbetokun, A. A. & Memon, M. H. (2018) Human capital, social capabilities, and
economic growth. [Online] Economies, 6(2), 1-18. Available from:
DOI:10.3390/economies6010002 [Accessed 16th June 2018]
Amartya, S. K. (1999) Development as freedom. Oxford: Oxford University Press
Atalay, R. (2015) The education and the human capital to get rid of the middle-income trap
and to provide economic development. Procedia-Social and Behavioural Sciences,
174, 969-976
Bai, J. & Ng, S. (2004) A panic attack on unit roots and co-integration. Econometrica, 72,
1127-1177.
Barro, R. (1991) Economic growth in a cross-section of countries. The Quarterly Journal of
Economics, 106, 407–443.
Barro, R. (1991) Economic growth in a cross-section of countries. The Quarterly Journal of
Economics, 106, 407–443.
Barro, R. J & Lee, J. (12011) A New Data Set of Educational Attainment in the World, 1950–
2010. New York, Harvard University. [Online] Available from:
http://www.barrolee.com/papers/Barro_Lee_Human_Capital_Update_2011Nov.pdfB
arro, R. J & Lee, J. (1998) A New Data Set of Educational Attainment in the World,
1950–2010. New York, Harvard University. [Online] Available from:
http://www.barrolee.com/papers/Barro_Lee_Human_Capital_Update_2011Nov.pdf
Becker, G. S. (1962) Investment in human capital: A theoretical analysis. Journal of Political
Economy, 70, 9-49. Available from: doi:10.1086/258724
Benhabib, J., & Mark, M. S. (1994) The role of human capital in economic development
evidence from aggregate cross-country data. Journal of Monetary Economics, 34, 143–
73.
Bobetko, A. Draženović, I. & Funda, J. (2017) Human capital and economic growth in CEE
countries and other emerging markets. The Twenty-Third Dubrovnik Economic
Conference Organized by the Croatian National Bank.

19
Bond, S., Hoeffler, A. & Temple, J. (2001) GMM estimation of empirical growth models.
Economica, 234-246
Caselli, F., Esquivel, G. & Lefort, F. (1996) Reopening the convergence debate: A new look at
cross-country growth empirics. Journal of Economic Growth, 1, 363-389.
Cohen, D. & Sonto, M. (2007) Growth and human capital: Good data, good results. Journal of
Economic Growth, 12, 51–76.
Dansasi, K. D. (2013) Empirical estimation of the Solow growth model: A panel approach.
Unpublished MSc thesis submitted to Fund University.
Hadri, K. (2000) Testing for unit roots in heterogeneous panel data. Econometrics Journal, 3,
148-161.
Hakooma, M. R. (2017) The impact of human capital development on economic growth in
Zambia: An Econometric Analysis. International Journal of Economics, Commerce,
and Management, V(4), 71-87
Hanushek, E. (2013) Economic growth in developing countries: The role of human capital.
Journal of Economic Growth, 17(4), 267-321
Holding, L. & Biddle, J. (2016) The introduction of human capital theory into education policy
in the United States. Michigan: Michigan State University Press.
Hussein, K., Mukungu, A. & Awel, Y. (2017) Drivers of inclusive growth in Africa. In: ECA
Working Paper, No: 23. Addis Ababa: Economic Commission for Africa.
Im, K. S., Pesaran, M. H. & Shin, Y. (2003) Testing for unit roots in heterogeneous panels.
Journal of Econometrics, 115, 53-74.
International Monetary Fund (IMF) (2017) World economic outlook database. IMF report:
October 2017 [Online] Available from
https://www.imf.org/external/pubs/ft/weo/2017/02/weodata/index.aspx
Islam, N. (1995) Growth empirics: A panel data approach. The Quarterly Journal of
Economics, 110, 1127-1170
Izushi, H. & Huggins, R. (2004) Empirical analysis of human capital development and
economic growth in European regions. Third report on vocational training research in
Europe: Background report No: 54, 71-112.
Joseph, E. T. (2020) How to Improve mobile money service usage and adoption by Nigerians
in the era of Covid-19. International Journal of Finance, Insurance and Risk
Management, 10(3), 31-52
Joseph, T., Obikaonu, P., Ariolu, C., Nwolisa, C., & Aderohunmu, A. (2021) SMEs
intervention programmes in Nigeria: evaluating challenges facing
implementation. Applied Journal of Economics, Management and Social
Sciences, 2(1), 16–25. https://doi.org/10.53790/ajmss.v2i1.10
Ludema, R. D. (2014) The economic benefits of free and open internet. South Korea, Seoul
Financial Forum.
Maddala, G. & Wu, S. (1999) A comparative study of unit root tests and a new simple test.
Oxford Bulletin of Economics and Statistics, 61, 631-652.

20
Mankiw, N. G., Romer, D. & Weil, D. N. (1992) A Contribution to the Empirics of Economic
Growth. The Quarterly Journal of Economics, 107, 407–437.
Mashayekhi, M. & Bruno A., eds. (2017) Services and structural transformation for
development. Geneva: United Nations Conference on Trade and Development.
Moon, H. R. & Perron, B. (2004) Testing for a unit root in a panel with dynamic factors.
Journal of Econometrics, 122, 81-126.
Obialor, M. C. (2017) Effect of government human capital investment on economic growth in
Sub-Saharan Africa: evidence from Nigeria, South Africa and Ghana (1980-2013).
International Journal of Asian Social Science, 7(4), 328-339
Sapkota, J. B. (2014). Access to infrastructure and human development: Cross-country
evidence. Tokyo: JICA Research Institute.
Schultz, T. W. (1961) Investment in human capital. American Economic Review, 51, 1-17.
Solow, R. M. (1956) A contribution to the theory of economic growth. The quarterly journal
of economics, 70(1), 65-94.
Solow, R. M. (1957) Technical Change and the Aggregate Production. Review of Economics
and Statistics, 33(3), 312 – 320.
Sunde, U., & Vischer, T. (2015) Human capital and growth: Specification matters. Economica
82, 368–90.
Tonuchi, E. J., & Onyebuchi, N. A. (2019). Economic diversification in Nigeria:The role of
agriculture and manufacturing sector. International Journal of Research in Electronics
and Computer Engineering., 7( 3), 916-919.
Tonuchi, J., Peters, I., Adetoba, T., Oluwaseun, M. (2020) How large is the size of Nigeria's
informal economy? A MIMIC Approach. International Journal of Economics,
Commerce and Management, 8(7), 204-228
United Nation Report (2018) World economic situation and prospects, 2018. [Online]
Available from: https://www.un.org/development/desa/dpad/wp-
content/uploads/sites/45/publication/WESP2018_Full_Web-1.pdf [Accessed 16th June
2018]
World Bank (2016). World development indicators data. [Online] Available from:
http://wdi.worldbank.org/tables

21