Embed Size (px)
Citation preview

Economic impact of shale and tight gas development in the NT APPEA
14 July 2015

2
Contents Executive Summary 3
Introduction and Background 6
Scenario Development 16
Economic Impact 21
Limitations of Our Work 27
Appendix 29
Deloitte refers to one or more of Deloitte Touche Tohmatsu Limited, a UK private company limited by guarantee, and its network of member firms, each of which is a legally separate and independent entity. Please see www.deloitte.com/au/about for a detailed description of the legal structure of Deloitte Touche Tohmatsu Limited and its member firms.
Liability limited by a scheme approved under Professional Standards Legislation
© 2015 Deloitte Access Economics Pty Ltd

Economic impact of shale and tight gas development in the NT ©2015 Deloitte Access Economics Pty Ltd 3
Executive Summary

Economic impact of shale and tight gas development in the NT ©2015 Deloitte Access Economics Pty Ltd 4
Development of shale and tight gas resources in the NT have the potential to significantly bolster the region’s economic growth
Executive Summary
Deloitte Access Economics finds that onshore shale and tight gas production has the potential to drive significant economic growth and provide substantial benefits to the Northern Territory (NT) economy. Under an ‘Aspirational’ scenario it could provide:
• A cumulative $22.4b increase in Gross State Product (GSP) between 2020 and 2040 in net present value (NPV) terms
• A long term employment boost of 6,300 full time positions in the NT
• A cumulative $961m increase in NT Government revenues between 2020 and 2040 in NPV terms
Significant untapped potential
According to the NT Geological Survey, the ‘best estimate’ of NT shale gas resources is approximately 234 Tcf (of this estimate, 119 Tcf relates to basins lying solely within NT boundaries, with the remainder consisting of shared resources with other States). This makes the NT a potentially important player in Australia’s shale and tight gas sector.
The recent experience of the United States in developing its endowment of shale gas provides an example of how an economy can be transformed and supported by the right market conditions and new technologies that allow for the extraction of these previously uneconomic resources.
The industry in the NT is at a developmental stage, but significant opportunities are offered by continued growth in global demand for LNG and the proposed development of a pipeline to connect the East Coast and NT gas markets.
Study aims and approach
APPEA engaged Deloitte Access Economics to undertake an economic impact assessment of the potential benefits for the NT in developing its shale and tight gas resources.
Given the highly developmental stage of the industry in the NT, this study has involved an extensive process to gauge potential production, cost and price assumptions that would most likely underpin the development of the NT’s large potential onshore shale and tight gas resources.
A comprehensive research exercise incorporating public sources and Deloitte’s internal resources was undertaken to build the requisite assumptions. These assumptions were subsequently tested and validated with APPEA and selected APPEA members.
The final assumptions – comprising production, sales revenue, capital expenditure, and operational expenditure estimates - formed inputs for Deloitte’s in-house Computable General Equilibrium (CGE) model to assess the direct and indirect impacts on the NT economy under two scenarios for the period 2020-2040.
Formulating the future – scenarios modelled
The two production scenarios explored – a “Success” and an “Aspirational” scenario - were run against a base case whereby no onshore shale and tight gas development is assumed to take place. The scenarios assume gas is to be supplied into three markets (NT, East Coast, and LNG export). These scenarios were developed in consultation with APPEA and other stakeholders.
The Success scenario assumes the development of two brownfield LNG trains in the NT to export shale and tight gas to overseas markets. A moderate supply of gas to the East Coast is also assumed via new pipeline infrastructure (max production = 56 PJ per annum), while a moderate level of supply to the NT domestic market is also assumed (max production = 30 PJ per annum).
The Aspirational scenario, as the name suggests, is more ambitious in terms of potential production of shale and tight gas from the NT. It assumes the development of three brownfields LNG trains in the NT, significantly higher supply of gas to the East Coast to meet most of its projected future gas supply shortfall (max production = 84 PJ per annum), and also assumes higher supply to the NT domestic market (max production = 79 PJ per annum), particularly from the development of a petrochemicals project.
Both scenarios utilise assumptions from a ‘high consumption’ planning scenario developed by the Australian Energy Market Operator (AEMO). As such, they do not necessarily represent expected outcomes. Rather, they are intended to reflect economic benefits that may accrue if the underlying ‘upper-bound’ assumptions materialise.
Economic impact of shale and tight gas development in the NT ©2015 Deloitte Access Economics Pty Ltd 5
Development of shale and tight gas resources could provide a cumulative $22.4 billion boost to the NT economy over 20 years in NPV terms, and an additional 6,300 jobs by 2040
Executive Summary
Shale and tight gas – a potential boon to the economy of the NT
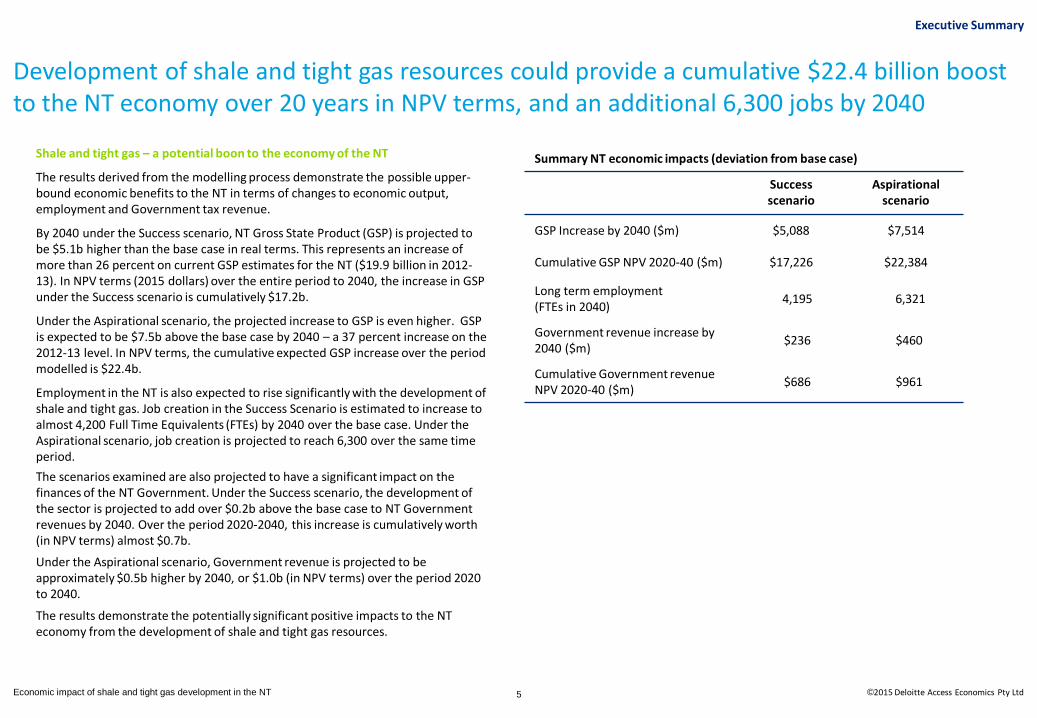
The results derived from the modelling process demonstrate the possible upper-bound economic benefits to the NT in terms of changes to economic output, employment and Government tax revenue.
By 2040 under the Success scenario, NT Gross State Product (GSP) is projected to be $5.1b higher than the base case in real terms. This represents an increase of more than 26 percent on current GSP estimates for the NT ($19.9 billion in 2012-13). In NPV terms (2015 dollars) over the entire period to 2040, the increase in GSP under the Success scenario is cumulatively $17.2b.
Under the Aspirational scenario, the projected increase to GSP is even higher. GSP is expected to be $7.5b above the base case by 2040 – a 37 percent increase on the 2012-13 level. In NPV terms, the cumulative expected GSP increase over the period modelled is $22.4b.
Employment in the NT is also expected to rise significantly with the development of shale and tight gas. Job creation in the Success Scenario is estimated to increase to almost 4,200 Full Time Equivalents (FTEs) by 2040 over the base case. Under the Aspirational scenario, job creation is projected to reach 6,300 over the same time period.
The scenarios examined are also projected to have a significant impact on the finances of the NT Government. Under the Success scenario, the development of the sector is projected to add over $0.2b above the base case to NT Government revenues by 2040. Over the period 2020-2040, this increase is cumulatively worth (in NPV terms) almost $0.7b.
Under the Aspirational scenario, Government revenue is projected to be approximately $0.5b higher by 2040, or $1.0b (in NPV terms) over the period 2020 to 2040.
The results demonstrate the potentially significant positive impacts to the NT economy from the development of shale and tight gas resources.
Success scenario
Aspirational scenario
GSP Increase by 2040 ($m) $5,088 $7,514
Cumulative GSP NPV 2020-40 ($m) $17,226 $22,384
Long term employment (FTEs in 2040)
4,195 6,321
Government revenue increase by 2040 ($m)
$236 $460
Cumulative Government revenue NPV 2020-40 ($m)
$686 $961
Summary NT economic impacts (deviation from base case)

Economic impact of shale and tight gas development in the NT ©2015 Deloitte Access Economics Pty Ltd 6
Introduction and background

Economic impact of shale and tight gas development in the NT ©2015 Deloitte Access Economics Pty Ltd
Rapid growth of the US shale sector has redefined the global energy supply equation and has impacted global energy pricing
The US is experiencing an extraordinary transition in its production and consumption of energy. Its so called “shale revolution” has been the product of significant advances in oil and natural gas extraction technology, specifically a new combination of horizontal drilling and hydraulic fracturing that has enabled the development of large, previously inaccessible shale and tight resources.
The US is now the world’s largest producer of natural gas, with annual production reaching 25,000 PJ in 2012, representing 20 percent of global natural gas production1. This production revolution is shifting the US energy dynamic, with the country expected to become a net energy exporter by 2040 for the first time since the first half of the 20th century#.
Crude oil exports from the US are currently prohibited. Historically this ban has acted as a protection against damaging fluctuations in world oil prices . However this policy is expected to change in the near future. Additionally, with the development of significant shale and tight gas reserves, construction is underway on five LNG export facilities on the US east coast as of July 2015*. The combined impact of these two factors would be to link US production and US energy prices to global energy markets.
The US shale gas revolution has resulted in plentiful supply of low priced energy for the US domestic economy. Domestic gas prices in the US at Henry Hub (the primary price measure for the North American natural gas market) were US$2.65 at March 2015, significantly lower than the US$12.01 reached in June 2008. As the US has increasingly met its energy needs with domestic resources, global energy prices have eased. This is because as the US has become less of an importer of energy, demand pressures on global energy supplies have decreased.
7
The experience of the US suggests shale and tight energy sources will play a vital role in meeting future demand
US net energy imports (1982-2013) PJ
Source: U.S Energy Information Administration, Monthly Energy Review
Introduction and background
U.S. Henry Hub price $USD/GJ
Source: World Bank, Prices (Pink sheet) data
#The International Energy Agency (IEA) in its ‘World Energy Outlook (WEO) 2040’ forecasts that the US will become a net energy exporter sometime in the period to 2040.
*US Department of Energy, Federal Energy Regulatory Commission, Office of Energy Projects, ‘North American LNG Import / Export Terminals Approved’, July 13, 2015
0
5,000
10,000
15,000
20,000
25,000
30,000
35,000
1982 1985 1988 1991 1994 1997 2000 2003 2006 2009 2012
0
2
4
6
8
10
12
14
1990 1993 1996 1999 2002 2005 2008 2011 2014

Economic impact of shale and tight gas development in the NT ©2015 Deloitte Access Economics Pty Ltd 8
Global demand for energy will continue to increase, ensuring opportunity for the development of Australian energy resources, including shale and tight gas
Global total primary energy demand PJ
Source: IEA World Energy Outlook 2014
The International Energy Agency’s World Energy Outlook (WEO) 2014 shows that global demand for energy will continue to grow under a number of scenarios
The WEO report highlights global output and population growth as the central drivers of energy demand over the period to 2040. It forecasts an average rate of growth in global GDP of 3.4 percent and a population growth rate of 0.9 percent from 2012-2040. It expects that such growth will stimulate primary energy demand over this period. Growth is expected to largely come from non-OECD economies, with Asia and specifically China responsible for the majority of the expected increase.
Given the significant uncertainty regarding Government policies to combat climate change, the WEO considers three possible directions for global energy demand and the extent to which they will affect demand:
• New Policies Scenario: The central scenario considers a pathway for global energy growth taking into account existing policies and the implementation of policy proposals
• Current Policies Scenarios: Considers only policies enacted as of mid-2014
• 450 Scenario: Considers a scenario in which policies are implemented to limit the long term increase in global temperatures to 2°
Global energy consumption is estimated to have increased at an annual growth rate of 1.9 percent from 1990-2012, from 368,000 PJ to 560,000 PJ. Under the WEO’s central ‘New Policies’ scenario this growth rate is expected to slow to 1.1 percent, with consumption reaching 766,000 PJ in 2040. Under the ‘Current Policies’ scenario, consumption would instead rise to 839,000 PJ (growth of 1.4 percent per annum) and under the ‘450 Scenario’ just 645,000 PJ (0.6 percent per annum).
Renewables and nuclear are the fastest growing energy sources in the WEO forecast. Among the traditional fossil fuel sources, which will continue to supply the majority of the world’s energy needs, consumption of gas is projected to grow at the fastest rate (1.6 percent per annum under the central ‘New Policies’ scenario).
Introduction and background
300,000
400,000
500,000
600,000
700,000
800,000
900,000
1990 2000 2010 2020 2030 2040
New Policies Scenario
Current Policies Scenario
450 Scenario
Economic impact of shale and tight gas development in the NT ©2015 Deloitte Access Economics Pty Ltd 9
Australia and the NT have significant potential supplies of shale and tight gas reserves that could possibly meet increasing world energy demand
Australia’s shale and tight gas reserves are potentially very large compared to conventional gas reserves
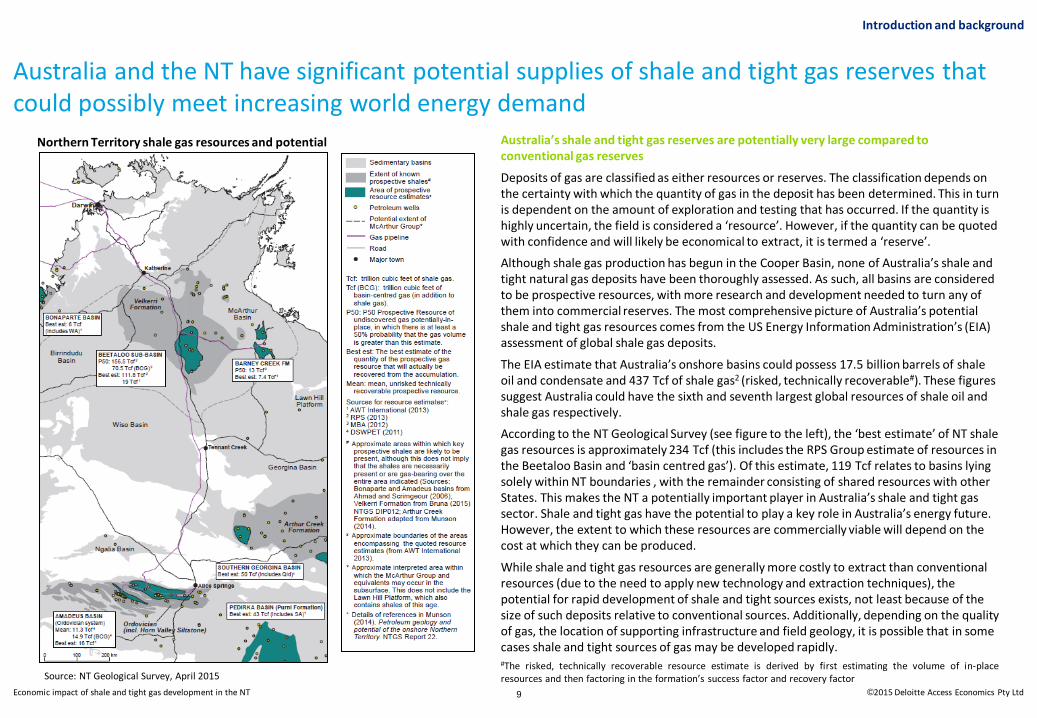
Deposits of gas are classified as either resources or reserves. The classification depends on the certainty with which the quantity of gas in the deposit has been determined. This in turn is dependent on the amount of exploration and testing that has occurred. If the quantity is highly uncertain, the field is considered a ‘resource’. However, if the quantity can be quoted with confidence and will likely be economical to extract, it is termed a ‘reserve’.
Although shale gas production has begun in the Cooper Basin, none of Australia’s shale and tight natural gas deposits have been thoroughly assessed. As such, all basins are considered to be prospective resources, with more research and development needed to turn any of them into commercial reserves. The most comprehensive picture of Australia’s potential shale and tight gas resources comes from the US Energy Information Administration’s (EIA) assessment of global shale gas deposits.
The EIA estimate that Australia’s onshore basins could possess 17.5 billion barrels of shale oil and condensate and 437 Tcf of shale gas2 (risked, technically recoverable#). These figures suggest Australia could have the sixth and seventh largest global resources of shale oil and shale gas respectively.
According to the NT Geological Survey (see figure to the left), the ‘best estimate’ of NT shale gas resources is approximately 234 Tcf (this includes the RPS Group estimate of resources in the Beetaloo Basin and ‘basin centred gas’). Of this estimate, 119 Tcf relates to basins lying solely within NT boundaries , with the remainder consisting of shared resources with other States. This makes the NT a potentially important player in Australia’s shale and tight gas sector. Shale and tight gas have the potential to play a key role in Australia’s energy future. However, the extent to which these resources are commercially viable will depend on the cost at which they can be produced.
While shale and tight gas resources are generally more costly to extract than conventional resources (due to the need to apply new technology and extraction techniques), the potential for rapid development of shale and tight sources exists, not least because of the size of such deposits relative to conventional sources. Additionally, depending on the quality of gas, the location of supporting infrastructure and field geology, it is possible that in some cases shale and tight sources of gas may be developed rapidly.
Northern Territory shale gas resources and potential
Introduction and background
#The risked, technically recoverable resource estimate is derived by first estimating the volume of in-place resources and then factoring in the formation’s success factor and recovery factor Source: NT Geological Survey, April 2015

Economic impact of shale and tight gas development in the NT ©2015 Deloitte Access Economics Pty Ltd
The NT currently produces conventional gas for domestic use
The NT produced 26 PJ of natural gas in 2012-13, with most gas sourced from the Bonaparte Basin via the Blacktip field. Prior to the Bonaparte Basin entering production in 2007-08 the Amadeus Basin wholly supplied the domestic market. In addition to the existing fields the NT has a number of potential future sources of conventional gas supply. For example, Central Petroleum has recently commenced production from the Dingo field with gas piped to Alice Springs for use in power generation. Central Petroleum is also further developing the Palm Valley field. In recent years Santos has also undertaken a major appraisal and development program of the Mereenie field.
The NT has one existing Liquefied Natural Gas (LNG) facility and one under construction
Darwin LNG (Conoco Phillips)
The Darwin LNG facility first produced gas in 2006, and operates one LNG train at a nameplate capacity of 3.7 Mtpa (≈ 205 PJ per annum). Gas production associated with Darwin LNG comes from the Joint Petroleum Development Area (JPDA) in the Timor Sea. For energy accounting purposes, all of the gas produced at the JDPA is considered an import into Australia, and therefore is not included in the NT’s official production statistics (first chart on the right).
Ichthys LNG (Inpex)
BREE forecasts that NT LNG production will increase to 667 PJ by 2018-19, largely due to the development of the Ichthys LNG project (expected to come online in the first half of 2017). This will see two LNG trains with nameplate capacity of 4.2Mtpa each3.
Gas use in the NT
In 2012-13, domestic gas use in the NT was underpinned by consumption at the Darwin LNG plant and in electricity generation. The two sources of consumption accounted for 43 percent (19 PJ) and 56 percent (25 PJ) of total gas use in 2012-13, respectively. As noted above, the corresponding production of gas related to Darwin LNG is not attributed to the NT due to its location of origin in the JDPA.
10
Currently the NT produces gas (conventional only) for domestic use and for export
0
5
10
15
20
25
30
2002-03 2004-05 2006-07 2008-09 2010-11 2012-13
Bonaparte Amadeus
Source: BREE, 2014 Australian Energy Statistics
0
5
10
15
20
25
30
35
40
45
50
2002-03 2004-05 2006-07 2008-09 2010-11 2012-13
Others Electricity Supply Resources
Source: BREE, 2014 Australian Energy Statistics
NT natural gas production (ex production from the Joint Petroleum Development Area) PJ / annum
NT natural gas consumption PJ / annum
Introduction and background
Economic impact of shale and tight gas development in the NT ©2015 Deloitte Access Economics Pty Ltd 11
The NT Government is currently assessing options to build a pipeline to connect the NT gas network with the East Coast network
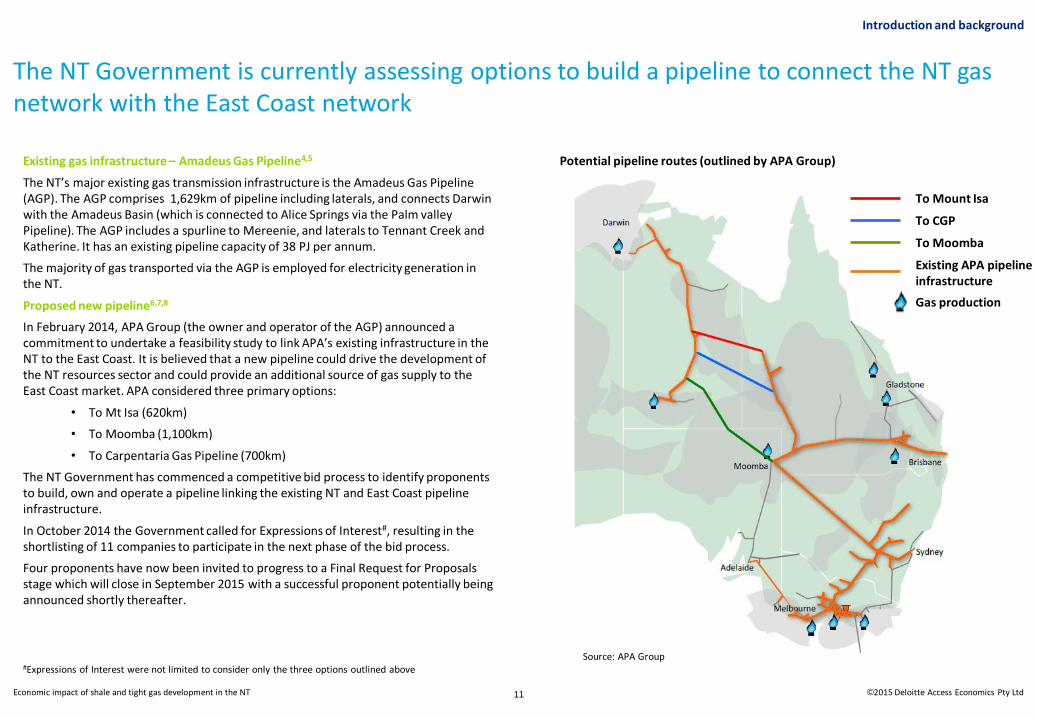
Existing gas infrastructure – Amadeus Gas Pipeline4,5
The NT’s major existing gas transmission infrastructure is the Amadeus Gas Pipeline (AGP). The AGP comprises 1,629km of pipeline including laterals, and connects Darwin with the Amadeus Basin (which is connected to Alice Springs via the Palm valley Pipeline). The AGP includes a spurline to Mereenie, and laterals to Tennant Creek and Katherine. It has an existing pipeline capacity of 38 PJ per annum.
The majority of gas transported via the AGP is employed for electricity generation in the NT.
Proposed new pipeline6,7,8
In February 2014, APA Group (the owner and operator of the AGP) announced a commitment to undertake a feasibility study to link APA’s existing infrastructure in the NT to the East Coast. It is believed that a new pipeline could drive the development of the NT resources sector and could provide an additional source of gas supply to the East Coast market. APA considered three primary options:
• To Mt Isa (620km)
• To Moomba (1,100km)
• To Carpentaria Gas Pipeline (700km)
The NT Government has commenced a competitive bid process to identify proponents to build, own and operate a pipeline linking the existing NT and East Coast pipeline infrastructure.
In October 2014 the Government called for Expressions of Interest#, resulting in the shortlisting of 11 companies to participate in the next phase of the bid process.
Four proponents have now been invited to progress to a Final Request for Proposals stage which will close in September 2015 with a successful proponent potentially being announced shortly thereafter.
Source: APA Group
Potential pipeline routes (outlined by APA Group)
Introduction and background
To Mount Isa
To CGP
To Moomba
#Expressions of Interest were not limited to consider only the three options outlined above
Existing APA pipeline infrastructure
Gas production
Economic impact of shale and tight gas development in the NT ©2015 Deloitte Access Economics Pty Ltd 12
The NT Government’s recent review into the use of hydraulic fracturing in the NT found that the associated environmental risks can be managed effectively
Introduction and background
Background and timeline of the Inquiry9
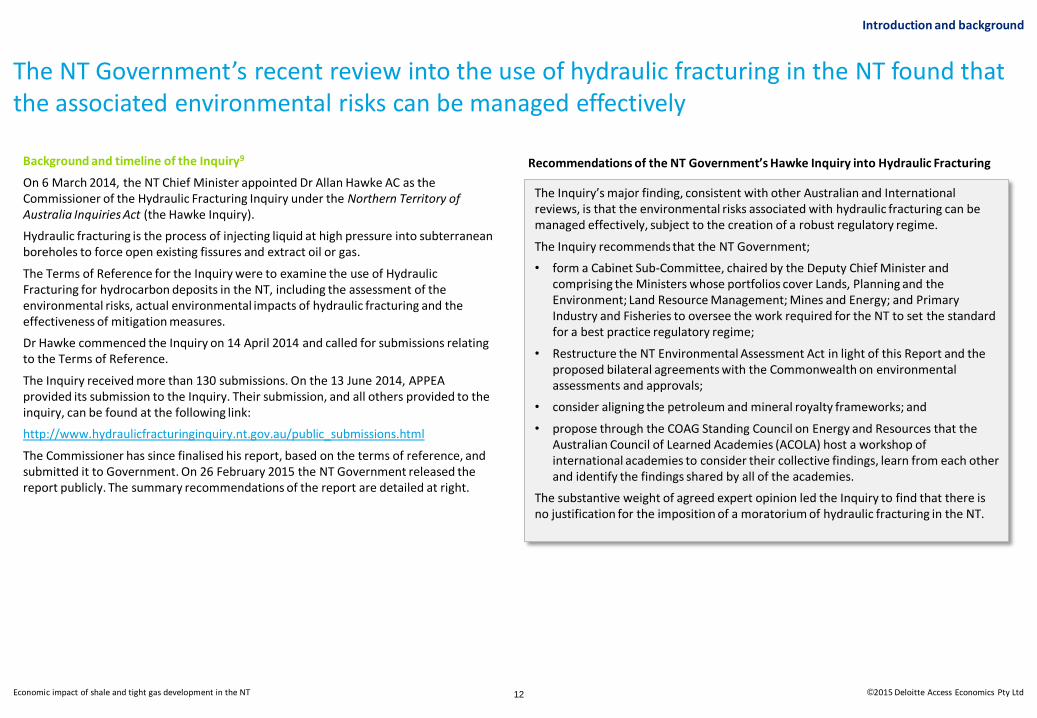
On 6 March 2014, the NT Chief Minister appointed Dr Allan Hawke AC as the Commissioner of the Hydraulic Fracturing Inquiry under the Northern Territory of Australia Inquiries Act (the Hawke Inquiry).
Hydraulic fracturing is the process of injecting liquid at high pressure into subterranean boreholes to force open existing fissures and extract oil or gas.
The Terms of Reference for the Inquiry were to examine the use of Hydraulic Fracturing for hydrocarbon deposits in the NT, including the assessment of the environmental risks, actual environmental impacts of hydraulic fracturing and the effectiveness of mitigation measures.
Dr Hawke commenced the Inquiry on 14 April 2014 and called for submissions relating to the Terms of Reference.
The Inquiry received more than 130 submissions. On the 13 June 2014, APPEA provided its submission to the Inquiry. Their submission, and all others provided to the inquiry, can be found at the following link:
http://www.hydraulicfracturinginquiry.nt.gov.au/public_submissions.html
The Commissioner has since finalised his report, based on the terms of reference, and submitted it to Government. On 26 February 2015 the NT Government released the report publicly. The summary recommendations of the report are detailed at right.
The Inquiry’s major finding, consistent with other Australian and International reviews, is that the environmental risks associated with hydraulic fracturing can be managed effectively, subject to the creation of a robust regulatory regime.
The Inquiry recommends that the NT Government;
• form a Cabinet Sub-Committee, chaired by the Deputy Chief Minister and comprising the Ministers whose portfolios cover Lands, Planning and the Environment; Land Resource Management; Mines and Energy; and Primary Industry and Fisheries to oversee the work required for the NT to set the standard for a best practice regulatory regime;
• Restructure the NT Environmental Assessment Act in light of this Report and the proposed bilateral agreements with the Commonwealth on environmental assessments and approvals;
• consider aligning the petroleum and mineral royalty frameworks; and
• propose through the COAG Standing Council on Energy and Resources that the Australian Council of Learned Academies (ACOLA) host a workshop of international academies to consider their collective findings, learn from each other and identify the findings shared by all of the academies.
The substantive weight of agreed expert opinion led the Inquiry to find that there is no justification for the imposition of a moratorium of hydraulic fracturing in the NT.
Recommendations of the NT Government’s Hawke Inquiry into Hydraulic Fracturing
Economic impact of shale and tight gas development in the NT ©2015 Deloitte Access Economics Pty Ltd
Mar
ket
Op
po
rtu
nit
ies
13
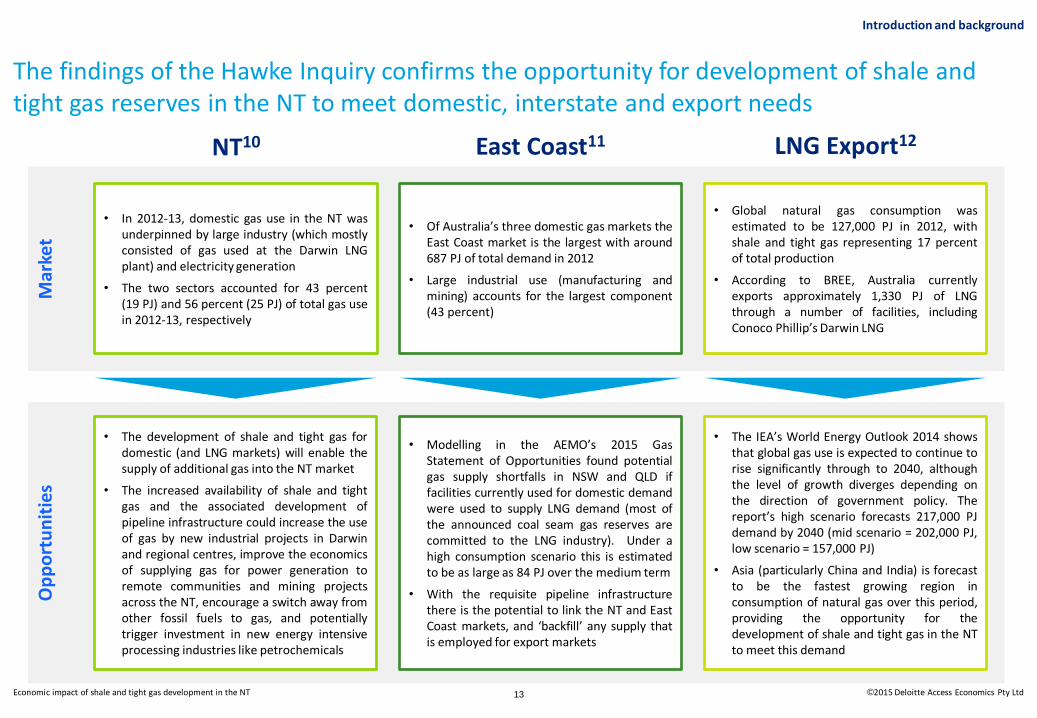
The findings of the Hawke Inquiry confirms the opportunity for development of shale and tight gas reserves in the NT to meet domestic, interstate and export needs
NT10 East Coast11 LNG Export12
• In 2012-13, domestic gas use in the NT was underpinned by large industry (which mostly consisted of gas used at the Darwin LNG plant) and electricity generation
• The two sectors accounted for 43 percent (19 PJ) and 56 percent (25 PJ) of total gas use in 2012-13, respectively
• The development of shale and tight gas for domestic (and LNG markets) will enable the supply of additional gas into the NT market
• The increased availability of shale and tight gas and the associated development of pipeline infrastructure could increase the use of gas by new industrial projects in Darwin and regional centres, improve the economics of supplying gas for power generation to remote communities and mining projects across the NT, encourage a switch away from other fossil fuels to gas, and potentially trigger investment in new energy intensive processing industries like petrochemicals
• Of Australia’s three domestic gas markets the East Coast market is the largest with around 687 PJ of total demand in 2012
• Large industrial use (manufacturing and mining) accounts for the largest component (43 percent)
• Modelling in the AEMO’s 2015 Gas Statement of Opportunities found potential gas supply shortfalls in NSW and QLD if facilities currently used for domestic demand were used to supply LNG demand (most of the announced coal seam gas reserves are committed to the LNG industry). Under a high consumption scenario this is estimated to be as large as 84 PJ over the medium term
• With the requisite pipeline infrastructure there is the potential to link the NT and East Coast markets, and ‘backfill’ any supply that is employed for export markets
• Global natural gas consumption was estimated to be 127,000 PJ in 2012, with shale and tight gas representing 17 percent of total production
• According to BREE, Australia currently exports approximately 1,330 PJ of LNG through a number of facilities, including Conoco Phillip’s Darwin LNG
• The IEA’s World Energy Outlook 2014 shows that global gas use is expected to continue to rise significantly through to 2040, although the level of growth diverges depending on the direction of government policy. The report’s high scenario forecasts 217,000 PJ demand by 2040 (mid scenario = 202,000 PJ, low scenario = 157,000 PJ)
• Asia (particularly China and India) is forecast to be the fastest growing region in consumption of natural gas over this period, providing the opportunity for the development of shale and tight gas in the NT to meet this demand
Introduction and background

Economic impact of shale and tight gas development in the NT ©2015 Deloitte Access Economics Pty Ltd 14
APPEA have engaged DAE to undertake an economic impact assessment of the potential benefits for the NT in developing its onshore shale and tight gas resources
Purpose of this report
Rising global demand for gas, and the identification of onshore gas resources has led to significant exploration for shale and tight gas in the NT. APPEA is seeking to inform the debate regarding the development of shale and tight onshore gas resources in the NT.
In addition to securing the NT’s energy supply, onshore shale and tight gas production has the potential to drive economic growth and provide substantial benefits to the NT Government through increased royalty receipts.
APPEA commissioned Deloitte Access Economics (DAE) to undertake an economic impact assessment to help quantify the economic impacts of the development of onshore gas resources to the economy of the NT.
Previous studies have indicated the economic benefits from the development of shale and tight gas in other jurisdictions:
• A report to the International Association of Oil and Gas producers by Pöyry and Cambridge Econometrics found that the development of shale gas resources across Europe could increase European GDP by as much as 1 percent (€235bn) by 205013.
• In the United States a study by IHS concluded that the shale gas boom will drive $3.2 trillion in cumulative investment between 2010 and 2035, and contribute $332 billion to US GDP by 203514.
The purpose of this report is to identify if similar benefits would accrue to the NT resulting from the development of its large potential shale and tight gas reserves. Potential environmental and social considerations of developing these resources were outside the scope of this study.
Approach
Given the highly developmental stage of the industry in the NT, DAE undertook an extensive process to gauge the production, cost and price assumptions that would most likely underpin the development of the NT’s large potential onshore shale and tight gas resources.
A comprehensive research exercise incorporating public sources and Deloitte’s internal resources was undertaken to build the requisite assumptions. Most of these assumptions were subsequently tested and validated with APPEA and selected members. Cost assumptions we then reconciled with forecast prices.
The final assumptions formed inputs for Deloitte Access Economics’ in-house Computable General Equilibrium (CGE) model to assess the direct and indirect impacts for the NT economy under two scenarios for the period 2020-2040.
The two production scenarios explored – a “Success” and an “Aspirational” scenario - were run against a base case whereby no onshore shale and tight gas development is assumed to take place. The scenarios assume gas is to be supplied into three markets (NT, East Coast, and LNG export). These scenarios are defined fully on page 17.
The results derived from the CGE model demonstrate under these scenarios the possible economic benefits to the NT in terms of changes to GSP and employment.
Despite a robust process being undertaken as described above, given the developmental stage of the sector, the analysis is subject to a number of assumptions based on research and stakeholder consultation. The quality of the outputs are ultimately limited by these assumptions. Page 28 contains further detail on the limitations of our work.
A brief, step-by-step description of the modelling methodology is outlined on the next page.
Introduction and background

Economic impact of shale and tight gas development in the NT ©2015 Deloitte Access Economics Pty Ltd 15
Modelling methodology – 6 core steps
Introduction and background
• Taking market prices, transport and processing costs as given, it is assumed that producers can supply at the residual cost (i.e. the extraction cost)
4 Calculate
breakeven costs
• Sales values, CAPEX and OPEX inputs are derived from the assumption above for input into CGE model
• Sales value is based on the price forecasts, while CAPEX & OPEX inputs were derived from the analysis of the cost components
5 Calibrate CGE model inputs
• Costs, production volumes and values, and NT gas prices were input into Deloitte Access Economics’ CGE model to determine GSP, employment and taxation effects for the NT economy
6 Estimation of
economic impact
• Price forecasts for the East Coast and LNG markets were sourced from external sources
• NT prices were calculated using a netback methodology
1 Price forecasts
• Characteristics of a ‘Success’ and ‘Aspirational’ scenario were developed (in consultation with APPEA) for the three potential markets:
o NT, East Coast (indicatively Sydney) and LNG Export (indicatively Japan)
2 Scenario
development
• Financial assumptions, including rates of return and average taxation rates were estimated from existing literature
• Assumptions for resource extraction, transport and processing costs were also developed from existing literature
3 Cost
components
Define assumptions Financial & economic modelling
Much of the methodology is devoted to developing and defining suitable production scenarios. This is explored in more detail in following slides.

Economic impact of shale and tight gas development in the NT ©2015 Deloitte Access Economics Pty Ltd 16
Scenario Development

Economic impact of shale and tight gas development in the NT ©2015 Deloitte Access Economics Pty Ltd
Two production scenarios were developed and assessed in this analysis, a “Success” scenario and an “Aspirational” scenario. Both scenarios utilise assumptions from a ‘high consumption’ planning scenario developed by the AEMO. As such, they do not represent expected outcomes. Rather, they are intended to reflect economic benefits that may accrue if the underlying ‘upper-bound’ assumptions materialise.
The exact level of production under each scenario has been defined using a mixed methods approach. Consultation with APPEA, industry and government were used to build a consensus of likely production capacity over the period 2020-2040.
Below is a description of each scenario, including an overview of the core cost drivers underlying each scenario. A full analysis of the assumptions and rationale underlying these cost drivers is provided in the appendix of this report.
LNG supply
Global demand for gas is expected to be the primary driver for development of shale and tight gas in the NT. Both scenarios assume brownfield expansion of existing LNG facilities. Consultations revealed that 2028 represents the earliest expected export from LNG facilities utilising shale and tight gas. This train and the development of another train after three years (i.e. first gas in 2031) forms the basis for the Success scenario. Under the Aspirational scenario a third LNG train is also developed (with first gas in in 2034). These scenarios were largely informed by stakeholder feedback regarding realistic outcomes under the different price scenarios.
The key cost drivers underlying this scenario are detailed below.
Core LNG Cost Drivers
• Brownfields expansion of existing LNG facility (CAPEX and OPEX) – 2 trains (each assumed to be 250 PJ at maximum production) in Success Scenario, and 3 trains in Aspirational Scenario
• Intra Territory pipeline construction (CAPEX and OPEX) for transport to Darwin
• Freight (OPEX) – indicatively to Japan
• Assumed average well production profile
17
Developing the scenario rationale (1 of 2)
Scenario development
• Average completion cost per well (CAPEX and OPEX)
• Weighted average cost of capital
• Taxation rate (including royalties, PRRT and corporate tax)
East Coast Supply
Feedback and market analysis suggested that LNG exports from the East Coast will generate opportunities for NT gas developments (shale, tight and conventional) to supply the East Coast market as backfill for domestic supply that is committed to export markets. Development of pipeline infrastructure from the NT is currently under consideration to enable this in the future (page 11).
Under the Aspirational Scenario, the NT is assumed to be the first to capitalise on the projected supply gap on the East Coast. As such, the NT is assumed to meet all of the expected shortfall in East Coast Gas supply over the long term (≈ 84 PJ per annum by 2030, as outlined in the ‘high consumption’ scenario of AEMO’s 2015 Gas Statement of Opportunities). Under the Success Scenario, the NT is assumed to meet two-thirds of this shortfall (as a sensitivity test against full satisfaction of the supply gap under the Aspirational scenario).
Under both scenarios, the East Coast supply gap is assumed to be initially partially met with two-thirds conventional gas and one-third shale and tight gas. However, with the expected depletion of conventional gas resources in the NT over time, shale and tight gas is assumed to eventually meet an increasing proportion of East Coast demand (up to 84 PJ per annum in the Aspirational scenario and up to 56 PJ per annum in the Success scenario). It must be stressed that should other potential supply regions develop earlier and/or supply East Coast gas cheaper, then the NT Success or Aspirational scenarios may not eventuate.
Core East Coast Cost Drivers
• Expansion of existing East Coast processing facility (CAPEX and OPEX)
• Intra Territory pipeline tariff (OPEX)
• Tariff for inter-connecting pipeline between NT & East Coast (OPEX)
• Existing East Coast pipeline tariff (OPEX)
• Assumed average well production profile
• Average completion cost per well (CAPEX and OPEX)
• Weighted average cost of capital
• Taxation rate (including royalties, PRRT and corporate tax)

Economic impact of shale and tight gas development in the NT ©2015 Deloitte Access Economics Pty Ltd
NT supply
Under the Success scenario, shale and tight gas is assumed to meet all incremental consumption of natural gas in the NT to 2040 (additional ≈ 20 PJ per annum by 2040). A level of switching from other fossil fuels in fuel intensive industries (mining, road transport and electricity generation) in the NT (additional ≈ 9 PJ per annum by 2040) is also assumed as shale and tight gas supply becomes more abundant.
Under the Aspirational scenario, an abundance of shale and tight gas drives a greater rate of switching in these industries (additional ≈ 18 PJ per annum by 2040). Significant levels of supply are also assumed to drive the development of a petrochemical sector by the late 2020s (additional ≈ 40 PJ per annum by 2040) such as a gas to liquids facility or Ammonia Plant, Nitric Acid Plant, and Ammonium Nitrate Plants. Such a development would be expected to supply the domestic market and markets overseas.
It must be noted that for the purposes of this project the economic impact does not include any growth generated by the expansion or development of a petrochemicals sector (only the gas consumption impact of the assumed petrochemical plant is captured). Therefore, the economic impact derived in this study is a conservative estimate, stemming solely from the higher CAPEX and OPEX associated with the development of the gas resources required to meet the additional consumption.
Core NT Cost Drivers
• Existing NT processing facility expansion (CAPEX and OPEX)
• Intra Territory pipeline tariff (OPEX)
• Assumed average well production profile
• Average completion cost per well (CAPEX and OPEX)
• Weighted average cost of capital
• Taxation rate (including royalties, PRRT & corporate tax)
18
Developing the scenario rationale (2 of 2)
Scenario development
Success Aspirational
NT Supply (2022 – 30PJ)
East Coast Supply (2022 – 60 PJ)
LNG Train (2028 – 250 PJ)
LNG Train (2031 – 250 PJ)
NT Supply (2022 – 79PJ)
East Coast Supply (2022 – 130 PJ)
LNG Train (2028 – 250 PJ)
LNG Train (2031 – 250 PJ)
LNG Train (2034 – 250PJ)
Three production scenarios Year of first production– max production
NT Supply (2022 / 30PJ)
East Coast Supply (2022 / 56 PJ)
LNG Train (2028 / 250 PJ)
LNG Train (2031 / 250 PJ)
Aspirational scenario
(First gas / max production)
NT Supply (2022 / 79PJ)
East Coast Supply (2022 / 84 PJ)
LNG Train (2028 / 250 PJ)
LNG Train (2031 / 250 PJ)
LNG Train (2034 / 250PJ)
Success scenario
(First gas / max production)
Economic impact of shale and tight gas development in the NT ©2015 Deloitte Access Economics Pty Ltd
0
2
4
6
8
10
12
14
16
2020 2022 2024 2026 2028 2030 2032 2034 2036 2038 2040
19
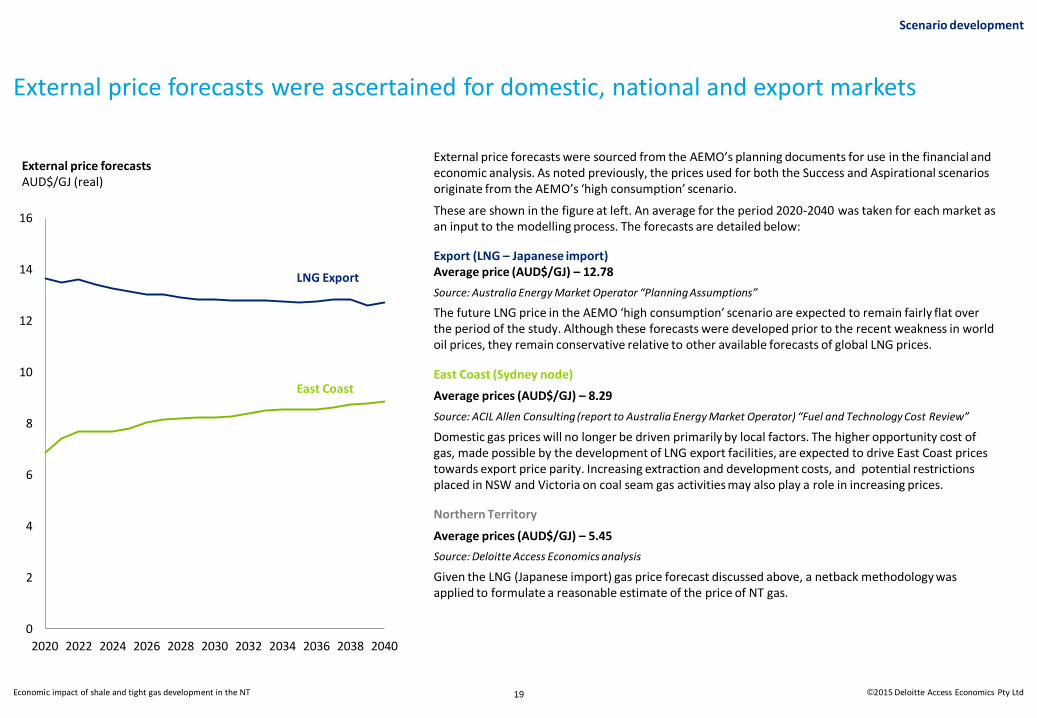
External price forecasts were ascertained for domestic, national and export markets
External price forecasts were sourced from the AEMO’s planning documents for use in the financial and economic analysis. As noted previously, the prices used for both the Success and Aspirational scenarios originate from the AEMO’s ‘high consumption’ scenario.
These are shown in the figure at left. An average for the period 2020-2040 was taken for each market as an input to the modelling process. The forecasts are detailed below:
Export (LNG – Japanese import) Average price (AUD$/GJ) – 12.78
Source: Australia Energy Market Operator “Planning Assumptions”
The future LNG price in the AEMO ‘high consumption’ scenario are expected to remain fairly flat over the period of the study. Although these forecasts were developed prior to the recent weakness in world oil prices, they remain conservative relative to other available forecasts of global LNG prices.
East Coast (Sydney node)
Average prices (AUD$/GJ) – 8.29
Source: ACIL Allen Consulting (report to Australia Energy Market Operator) “Fuel and Technology Cost Review”
Domestic gas prices will no longer be driven primarily by local factors. The higher opportunity cost of gas, made possible by the development of LNG export facilities, are expected to drive East Coast prices towards export price parity. Increasing extraction and development costs, and potential restrictions placed in NSW and Victoria on coal seam gas activities may also play a role in increasing prices.
Northern Territory
Average prices (AUD$/GJ) – 5.45
Source: Deloitte Access Economics analysis
Given the LNG (Japanese import) gas price forecast discussed above, a netback methodology was applied to formulate a reasonable estimate of the price of NT gas.
External price forecasts AUD$/GJ (real)
Scenario development
LNG Export
East Coast
Economic impact of shale and tight gas development in the NT ©2015 Deloitte Access Economics Pty Ltd
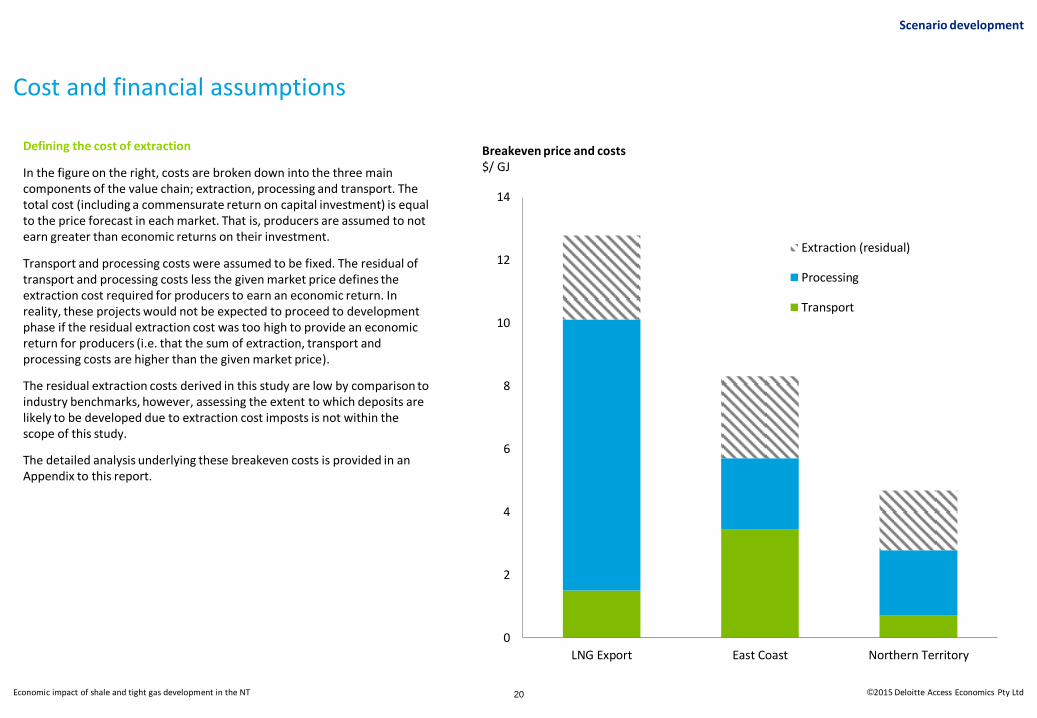
Cost and financial assumptions
Defining the cost of extraction
In the figure on the right, costs are broken down into the three main components of the value chain; extraction, processing and transport. The total cost (including a commensurate return on capital investment) is equal to the price forecast in each market. That is, producers are assumed to not earn greater than economic returns on their investment.
Transport and processing costs were assumed to be fixed. The residual of transport and processing costs less the given market price defines the extraction cost required for producers to earn an economic return. In reality, these projects would not be expected to proceed to development phase if the residual extraction cost was too high to provide an economic return for producers (i.e. that the sum of extraction, transport and processing costs are higher than the given market price).
The residual extraction costs derived in this study are low by comparison to industry benchmarks, however, assessing the extent to which deposits are likely to be developed due to extraction cost imposts is not within the scope of this study.
The detailed analysis underlying these breakeven costs is provided in an Appendix to this report.
Breakeven price and costs $/ GJ
Scenario development
20
0
2
4
6
8
10
12
14
LNG Export East Coast Northern Territory
Extraction (residual)
Processing
Transport

Economic impact of shale and tight gas development in the NT ©2015 Deloitte Access Economics Pty Ltd 21
Economic impact
Economic impact
Economic impact of shale and tight gas development in the NT ©2015 Deloitte Access Economics Pty Ltd
The economic impacts of the activities undertaken by specific industry sectors can be measured through an Input Output (IO) multiplier analysis or CGE modelling in response to a change in the economy. The IO multiplier analysis provides a snapshot of linkages across sectors of the economy, as measured by the resources they use in terms of economic output, value added and employment.
CGE analysis is an extension of IO analysis, incorporating a system of equations and modelling parameters, based on a widely accepted body of economic theory, that models competition for resources (particularly in labour and capital markets) between economic agents and allows for economy-wide modelling impacts incorporating any “crowding-out” impacts.
This study adopts a CGE modelling process to measure the economic impacts potentially arising from the ‘Success’ and ‘Aspirational’ scenarios. The economic impact of developing this sector has only been modelled for the NT economy.
Deloitte Access Economics – Regional General Equilibrium Model
The Deloitte Access Economics – Regional General Equilibrium Model (DAE-RGEM) is a large scale, dynamic, multi-region, multi-commodity computable general equilibrium model of the world economy. The model allows policy analysis in a single, robust, integrated economic framework. This model projects changes in macroeconomic aggregates such as GDP, employment, export volumes, investment and private consumption. At the sectoral level, detailed results such as output, exports, imports and employment are also available. The model is based upon a set of key underlying relationships between the various components of the model, each which represent a different group of agents in the economy, with these relationships solved simultaneously.
The key components of the model for an individual region include a representative household, producers, investors and international (or linkages with the other regions in the model, including other Australian States and foreign regions).
22
Modelling economic impacts
Economic impact
Economic impacts modelled
Based on the capital and operational expenditures for each scenario, the modelling gauges the wider economic impacts of the development of shale and tight gas reserves as follows:
• Direct impacts — changes in economic activity associated with ‘core’ commercial operations, namely the additional resource extraction, processing and transport, and revenues generated by sale of gas (domestically and export) from shale and tight gas.
• Indirect, induced and crowding out impacts — changes in economic activity in upstream or downstream industries where the impacts associated with increased/decreased resource activity are typically the highest. As outlined above, the CGE modelling also captures any crowding out of activity in other sectors of the economy as a result of the changes in the modelled parameters. The model output provides projections of macroeconomic aggregates such as GDP, employment and wages for a policy scenario against a reference or baseline case for each of the modelling years. The results from the economic impact analysis are presented as absolute deviations in output, employment and wages from a baseline case that shale and tight gas reserves are not developed in the NT (i.e. a counterfactual of zero).
• Government revenue impacts — A number of taxes and levies applied by the Government, such as payroll tax and stamp duties, are also affected by the policy scenarios. Estimates for the level of NT petroleum royalties have been guided by an estimate of the wellhead value of the resource in each scenario. In the NT a royalty rate of 10 percent is applied on the gross value of the resource at the wellhead. Changes in other taxes including payroll taxes have been gauged through the economic modelling. More specifically, each of the individual taxes and levies charged by the NT Government were mapped to appropriated variables in the CGE model. This allowed taxation to move in line with the growth rates of the variables that play the most significant role in determining the level of revenue raised.

Economic impact of shale and tight gas development in the NT ©2015 Deloitte Access Economics Pty Ltd 23
Model inputs (1 of 2)
The model inputs that drive the economic impacts consist of four key components: production, sales revenue, capital expenditure and operational expenditure. These inputs were calculated as part of the scenario development phase (page 17 and described in more detail in the Technical Appendix).
Production
Under the Success scenario, annual production volumes are expected to reach 586 PJ per annum by 2040, and 910 PJ under the Aspirational scenario. The Aspirational scenario differs from the Success scenario in:
• A greater level of switching to shale and tight gas by, and the economic development of, energy intensive industries in the NT
• Meeting a more significant portion of the projected East Coast gas supply gap
• A third LNG train
Revenue
In revenue terms, gross revenues (value of gas produced) reach $7.0b p.a. under the Success scenario by 2040. Total revenues over the period (2020-2040) are $20.1 b in 2015 dollars (at a discount rate of 7 percent) in NPV terms. Under the Aspirational scenario, gross revenues reach $10.7b by 2040 and the NPV of all production is $26.1b.
Production volumes – Success scenario PJ / annum
Production volumes – Aspirational scenario PJ / annum
Economic impact
0
100
200
300
400
500
600
700
800
900
1,000
2020
2021
2022
2023
2024
2025
2026
2027
2028
2029
2030
2031
2032
2033
2034
2035
2036
2037
2038
2039
2040
Northern Territory
East Coast
LNG
0
100
200
300
400
500
600
700
800
900
1,000
20
20
20
21
20
22
20
23
20
24
20
25
20
26
20
27
20
28
20
29
20
30
20
31
20
32
20
33
20
34
20
35
20
36
20
37
20
38
20
39
20
40
Northern Territory
East Coast
LNG
Economic impact of shale and tight gas development in the NT ©2015 Deloitte Access Economics Pty Ltd 24
Model inputs (2 of 2)
Capital expenditure
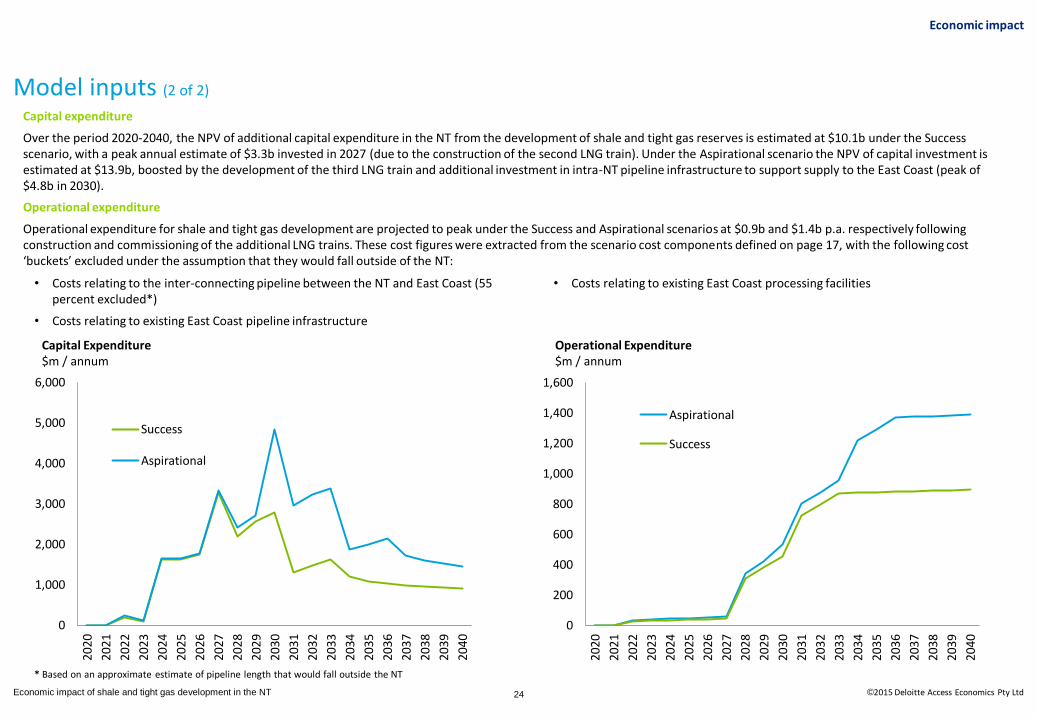
Over the period 2020-2040, the NPV of additional capital expenditure in the NT from the development of shale and tight gas reserves is estimated at $10.1b under the Success scenario, with a peak annual estimate of $3.3b invested in 2027 (due to the construction of the second LNG train). Under the Aspirational scenario the NPV of capital investment is estimated at $13.9b, boosted by the development of the third LNG train and additional investment in intra-NT pipeline infrastructure to support supply to the East Coast (peak of $4.8b in 2030).
Operational expenditure
Operational expenditure for shale and tight gas development are projected to peak under the Success and Aspirational scenarios at $0.9b and $1.4b p.a. respectively following construction and commissioning of the additional LNG trains. These cost figures were extracted from the scenario cost components defined on page 17, with the following cost ‘buckets’ excluded under the assumption that they would fall outside of the NT:
Capital Expenditure $m / annum
Operational Expenditure $m / annum
Economic impact
• Costs relating to the inter-connecting pipeline between the NT and East Coast (55 percent excluded*)
• Costs relating to existing East Coast pipeline infrastructure
• Costs relating to existing East Coast processing facilities
* Based on an approximate estimate of pipeline length that would fall outside the NT
0
1,000
2,000
3,000
4,000
5,000
6,000
2020
2021
2022
2023
2024
2025
2026
2027
2028
2029
2030
2031
2032
2033
2034
2035
2036
2037
2038
2039
2040
Success
Aspirational
0
200
400
600
800
1,000
1,200
1,400
1,600
2020
2021
2022
2023
2024
2025
2026
2027
2028
2029
2030
2031
2032
2033
2034
2035
2036
2037
2038
2039
2040
Aspirational
Success

Economic impact of shale and tight gas development in the NT ©2015 Deloitte Access Economics Pty Ltd 25
Projected economic impact of shale and tight gas development (1 of 2)
GSP and employment effects
The incremental effects on output and employment of shale and tight gas development were estimated by comparing against levels likely under a base case in which the sector did not develop.
The analysis shows that the development of shale and tight gas in the NT will have significant effects on output and employment in the NT.
By 2040 under the Success scenario, NT Gross State Product (GSP) is projected to be almost $5.1b higher than the base case in real terms. This represents an increase of more than 26 percent on current GSP estimates for the NT ($19.9 billion in 2012-13). In NPV terms (2015 dollars) over the entire period to 2040, the increase in GSP under the Success scenario is cumulatively $17.2b.
Under the Aspirational scenario, the projected increase to GSP is even higher. GSP is expected to be $7.5b above the base case by 2040 – a 37 percent increase on the 2012-13 level. In NPV terms, the expected GSP increase over the period modelled is cumulatively $22.3b.
NT Gross State Product Deviation from base case ($m)
NT employment Deviation from base case (FTEs)
Success scenario
Aspirational scenario
GSP Increase by 2040 ($m) $5,088 $7,514
GSP Increase by 2040 (%) 26% 37%
GSP NPV 2020-40 ($m) $17,226 $22,384
Long term employment (FTEs in 2040)
4,195 6,321
Economic impact
Summary output and employment impacts (deviation from base case)
The economic impacts are defined according to the scenario’s effects upon gross state product (GSP, or aggregate economic output in the NT), employment and Government revenues. These impacts include both direct and indirect (i.e. flow on) economic effects.
Employment in the NT is also expected to rise significantly with the development of shale and tight gas. Job creation in the Success Scenario is estimated to increase to nearly 4,200 Full Time Equivalents (FTEs) by 2040. Under the Aspirational scenario, job creation is projected to reach 6,300 over the same time period.
-
1,000
2,000
3,000
4,000
5,000
6,000
7,000
8,000
2020
2021
2022
2023
2024
2025
2026
2027
2028
2029
2030
2031
2032
2033
2034
2035
2036
2037
2038
2039
2040
Aspirational
Success
-
1,000
2,000
3,000
4,000
5,000
6,000
7,000
8,000
2020
2021
2022
2023
2024
2025
2026
2027
2028
2029
2030
2031
2032
2033
2034
2035
2036
2037
2038
2039
2040
AspirationalSuccess
Economic impact of shale and tight gas development in the NT ©2015 Deloitte Access Economics Pty Ltd
Projected economic impact of shale and tight gas development (2 of 2)
Government revenue impacts
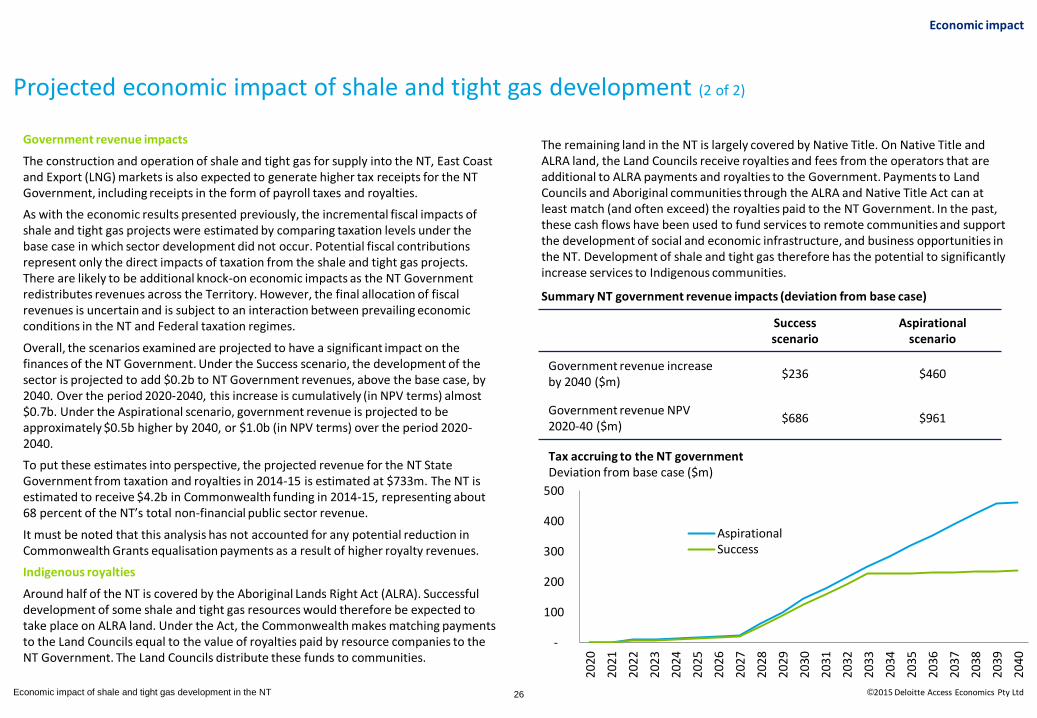
The construction and operation of shale and tight gas for supply into the NT, East Coast and Export (LNG) markets is also expected to generate higher tax receipts for the NT Government, including receipts in the form of payroll taxes and royalties.
As with the economic results presented previously, the incremental fiscal impacts of shale and tight gas projects were estimated by comparing taxation levels under the base case in which sector development did not occur. Potential fiscal contributions represent only the direct impacts of taxation from the shale and tight gas projects. There are likely to be additional knock-on economic impacts as the NT Government redistributes revenues across the Territory. However, the final allocation of fiscal revenues is uncertain and is subject to an interaction between prevailing economic conditions in the NT and Federal taxation regimes.
Overall, the scenarios examined are projected to have a significant impact on the finances of the NT Government. Under the Success scenario, the development of the sector is projected to add $0.2b to NT Government revenues, above the base case, by 2040. Over the period 2020-2040, this increase is cumulatively (in NPV terms) almost $0.7b. Under the Aspirational scenario, government revenue is projected to be approximately $0.5b higher by 2040, or $1.0b (in NPV terms) over the period 2020-2040.
To put these estimates into perspective, the projected revenue for the NT State Government from taxation and royalties in 2014-15 is estimated at $733m. The NT is estimated to receive $4.2b in Commonwealth funding in 2014-15, representing about 68 percent of the NT’s total non-financial public sector revenue.
It must be noted that this analysis has not accounted for any potential reduction in Commonwealth Grants equalisation payments as a result of higher royalty revenues.
Indigenous royalties
Around half of the NT is covered by the Aboriginal Lands Right Act (ALRA). Successful development of some shale and tight gas resources would therefore be expected to take place on ALRA land. Under the Act, the Commonwealth makes matching payments to the Land Councils equal to the value of royalties paid by resource companies to the NT Government. The Land Councils distribute these funds to communities.
Success scenario
Aspirational scenario
Government revenue increase by 2040 ($m)
$236 $460
Government revenue NPV 2020-40 ($m)
$686 $961
Summary NT government revenue impacts (deviation from base case)
Economic impact
Tax accruing to the NT government Deviation from base case ($m)
26
The remaining land in the NT is largely covered by Native Title. On Native Title and ALRA land, the Land Councils receive royalties and fees from the operators that are additional to ALRA payments and royalties to the Government. Payments to Land Councils and Aboriginal communities through the ALRA and Native Title Act can at least match (and often exceed) the royalties paid to the NT Government. In the past, these cash flows have been used to fund services to remote communities and support the development of social and economic infrastructure, and business opportunities in the NT. Development of shale and tight gas therefore has the potential to significantly increase services to Indigenous communities.
-
100
200
300
400
500
2020
2021
2022
2023
2024
2025
2026
2027
2028
2029
2030
2031
2032
2033
2034
2035
2036
2037
2038
2039
2040
AspirationalSuccess

Economic impact of shale and tight gas development in the NT ©2015 Deloitte Access Economics Pty Ltd 27
Limitations of our work
Limitations of our work

Economic impact of shale and tight gas development in the NT ©2015 Deloitte Access Economics Pty Ltd
Economic impact
28
General use restriction
This report is prepared solely for the use of the Australian Petroleum Production and Exploration Association (APPEA). This report is not intended to and should not be used or relied upon by anyone else and we accept no duty of care to any other person or entity. The report has been prepared for the purpose of considering the potential economic impacts on the NT from the possible development of shale and tight gas resources in that jurisdiction. You should not refer to or use our name or the advice for any other purpose.
Limitations of assumptions
Some of the core assumptions which underpin the financial and economic models have been developed by Deloitte Access Economics Pty Ltd with input from APPEA, its members, other stakeholders and publically available data and information. Deloitte Access Economics Pty Ltd has not independently tested or verified any of the inputs and advice received from these sources regarding the assumptions. Many of the stakeholders that participated in the process and reports used to inform the study were unable to validate all assumptions due to commercial sensitivities and because of information gaps stemming from the infancy of shale and tight gas development in the NT. Therefore, Deloitte Access Economics Pty Ltd takes no responsibility for the accuracy of the assumptions adopted in the modelling, or the modelling outcomes.
While reasonable efforts have been made to ensure the information contained in this report is accurate and correct at 10 June 2015, Deloitte Touche Tohmatsu nor Deloitte Access Economics Pty Ltd have audited, tested, verified or checked for completeness any information provided for the purpose of preparing the report. To the extent that there is any error in the report, the report information, or any other relevant information providers have failed to provide additional relevant information; the report may be incorrect or unsuitable for use.
Neither Deloitte Touche Tohmatsu nor Deloitte Access Economics Pty Ltd provides any assurance on the reliability of any forecasts or projections set out in the report or the reasonableness of any underlying assumptions. All forecasts and projections (including prices) have been built on assumptions developed from public information and feedback from APPEA and industry stakeholders and are for illustrative purposes only. Since forecasts or projections relate to the future, they may be affected by unforeseen events and they depend, in part, on the effectiveness of actions in implementing the forecasts or projections. Accordingly, actual results are likely to be different from those forecasts or projected because events and circumstances frequently do not occur as expected, and those differences may be material.
Limitations of our work

Economic impact of shale and tight gas development in the NT ©2015 Deloitte Access Economics Pty Ltd 29
Appendix
Appendix
Economic impact of shale and tight gas development in the NT ©2015 Deloitte Access Economics Pty Ltd
References
Appendix
1. International Energy Agency – ‘World Energy Outlook 2014’
2. US Energy Information Administration – ‘Technically Recoverable Shale Oil and Shale Gas Resources: An Assessment of 137 Shale Formations in 41 Countries Outside the United States’
3. Bureau of Resources and Energy Economics – ‘Gas Market Report’ 2014
4. Australian Energy Regulator ‘Decision, Access arrangement’, Amadeus Gas Pipeline, 1st August 2011 – 30 June 2016’
5. APA Group – ‘APA in the NT (Factsheet)’
6. APA Group – ‘Northern Link Feasibility Study (Factsheet)’
7. Rob Wheals (APA Group) – ‘New pipeline developments, Linking Australia's gas markets for improved energy security’
8. http://www.nt.gov.au/ntg/gaspipeline/
9. www.hydraulicfracturinginquiry.nt.gov.au
10. Bureau of Resource and Energy Economics – ‘Energy Statistics 2014’
11. Australian Energy Market Operator – ‘2015 Gas Statement of Opportunities’
12. International Energy Agency – ‘World Energy Outlook 2014’
13. Pöyry and Cambridge Econometrics – ‘Macroeconomic Effects of European Shale Gas Production’
14. IHS – ‘America’s New Energy Future: The Unconventional Oil and Gas Revolution and the Economy – Volume 3: A Manufacturing Renaissance’
30

Economic impact of shale and tight gas development in the NT ©2015 Deloitte Access Economics Pty Ltd 31
Technical Appendix (1 of 6)
Appendix
Market Category Description / logic
All General methodology
• Time series CAPEX and OPEX costs resulting from the development of shale and tight gas in the Northern Territory formed inputs into the CGE modelling process.
• Based on external price forecasts, costs (CAPEX and OPEX) and financial assumptions for each market detailed below, Deloitte employed an in-house financial model to calculate an effective breakeven cost.
• The total cost (including a commensurate return on capital investment) is equal to the price forecast in each market. That is, producers are assumed to not earn greater than economic returns on their investment. Transport and processing costs were assumed to be fixed based on the cost and financial assumptions below.
• The residual cost relative to the given market price defines the extraction cost that is required by producers to earn an economic return. As a basis for disaggregating CAPEX and OPEX from a $/GJ extraction cost, an initial estimate for CAPEX of $11m per well and OPEX of $0.95 / GJ were derived from ACOLA’s report “Engineering Energy: Unconventional Gas Production”. For the analysis a generic well production flow was derived from a previous confidential Deloitte project.
• CAPEX per well and OPEX on a $/ GJ basis were scaled accordingly to meet the magnitude of the residual • Note: for simplicity CAPEX was only scaled on a per well basis i.e. ignoring changes in the average well production
profile. Practically this does not alter the analysis – but the CAPEX per well used for this commercial analysis should not be taken as an indication of the CAPEX per well likely to eventuate in this scenario, because the scaling is intended to reflect a conflation of changes to well production rates in addition to CAPEX per well.
• The number of wells drilled was assumed to be the following under each scenario. Note that only producing wells were included in the analysis:
LNG General assumptions / scenario rationale
• LNG is assumed to be exported to Japan due to availability of price and freight information • As brownfields development each LNG train is identical in cost and financial structure • Each LNG train is assumed to be 250 PJ at maximum production • Success scenario – two LNG trains (first gas = 2028 and 2031) • Aspirational scenario – three LNG trains (first gas = 2028, 2031 and 2034)
Market Success scenario Aspirational scenario
NT 80 207
East Coast 225 319
LNG 1319 1787

Economic impact of shale and tight gas development in the NT ©2015 Deloitte Access Economics Pty Ltd 32
Technical Appendix (2 of 6)
Appendix
Market Category Description / logic
LNG Price forecast assumptions
• Assumptions were sourced from Australia Energy Market Operator “Planning Assumptions” for LNG price (USD/tonne, (Japanese import price, CIF), exchange rates and inflation to determine a AUD/GJ price estimate
• Both the Success scenario and the Aspirational scenario are aligned to the AEMO’s “High Consumption” scenario, with an average of forecast prices over 2028-2040 used for the analysis
• Price employed for analysis = A$12.78 / GJ
LNG Cost and financial assumptions
Beetaloo to Darwin pipeline • A new pipeline is required to transport gas from fields to the LNG facility in Darwin given the quantity of gas far exceeds the
available capacity in the Amadeus Gas Pipeline • The field is assumed to be located in the Beetaloo sub-basin – approximately 300km from Darwin • Estimates for pipeline CAPEX are from Core Energy’s report for AEMO ‘Gas Transmission Costs’ with capital costs for a 500km
pipeline at $0.8m/km = $0.24b. CAPEX was distributed across a 2 year construction phase • Estimates for pipeline OPEX at 2% of CAPEX p.a. are sourced from ACCC’s “Access Arrangement Information for Roma
Brisbane Pipeline” = $4.8m p.a • Taxation rate is assumed to be 30% • Weighted average cost of capital is assumed to be 10% • Effective breakeven cost for pipeline = $0.20 / GJ Freight cost • Benchmark freight costs to Japan were adopted and adjusted from the Oxford Institute for Energy Studies’ report “The
Future of Australian LNG Exports: Will domestic challenges limit the development of future LNG export capacity?” • The freight cost used in the analysis = $1.30 / GJ Liquefaction Facility • Each additional LNG train represents the expansion of a brownfields LNG facility requiring the construction of a new
liquefaction facility • Estimates for liquefaction facility CAPEX come from The Oxford Institute for Energy Studies’ report “LNG Plant Cost
Escalation”. The central estimate for liquefaction costs in a High Cost region (of which Australia is one) is US $1100/tpa. Using a USD/AUD exchange rate of 0.80 and an LNG train size of 250 PJ (≈4.5mtpa), CAPEX per train = $6.1875b. CAPEX was distributed across a 4 year construction phase
• Estimates for liquefaction facility OPEX come from a presentation by Nick White, Director Process Engineering, Clough “Rules of Thumb for Screening LNG Development” at 3% of CAPEX p.a.
• Taxation rate (including royalties, PRRT and corporate tax) is estimated at 45% based on APPEA’s “2014 Key Industries Statistics”
• Weighted average cost of capital is estimated at 12% based on NOPTA’s Retention Lease Guidelines • Effective breakeven cost for liquefaction = $8.61 / GJ
Economic impact of shale and tight gas development in the NT ©2015 Deloitte Access Economics Pty Ltd 33
Technical Appendix (3 of 6)
Appendix
Market Category Description / logic
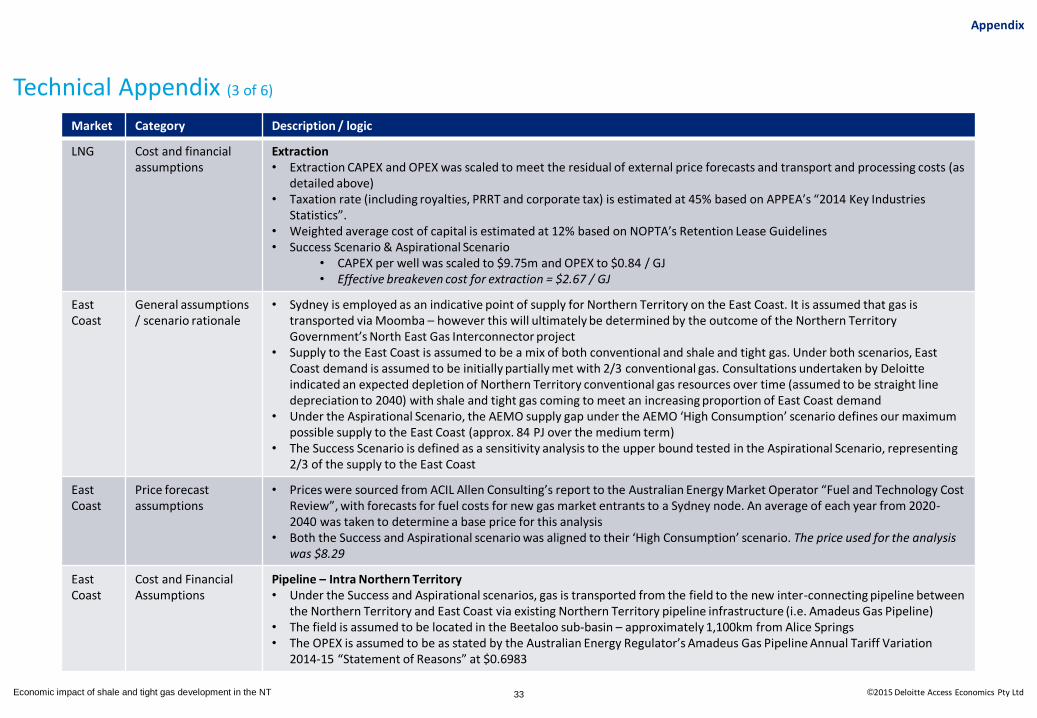
LNG Cost and financial assumptions
Extraction • Extraction CAPEX and OPEX was scaled to meet the residual of external price forecasts and transport and processing costs (as
detailed above) • Taxation rate (including royalties, PRRT and corporate tax) is estimated at 45% based on APPEA’s “2014 Key Industries
Statistics”. • Weighted average cost of capital is estimated at 12% based on NOPTA’s Retention Lease Guidelines • Success Scenario & Aspirational Scenario
• CAPEX per well was scaled to $9.75m and OPEX to $0.84 / GJ • Effective breakeven cost for extraction = $2.67 / GJ
East Coast
General assumptions / scenario rationale
• Sydney is employed as an indicative point of supply for Northern Territory on the East Coast. It is assumed that gas is transported via Moomba – however this will ultimately be determined by the outcome of the Northern Territory Government’s North East Gas Interconnector project
• Supply to the East Coast is assumed to be a mix of both conventional and shale and tight gas. Under both scenarios, East Coast demand is assumed to be initially partially met with 2/3 conventional gas. Consultations undertaken by Deloitte indicated an expected depletion of Northern Territory conventional gas resources over time (assumed to be straight line depreciation to 2040) with shale and tight gas coming to meet an increasing proportion of East Coast demand
• Under the Aspirational Scenario, the AEMO supply gap under the AEMO ‘High Consumption’ scenario defines our maximum possible supply to the East Coast (approx. 84 PJ over the medium term)
• The Success Scenario is defined as a sensitivity analysis to the upper bound tested in the Aspirational Scenario, representing 2/3 of the supply to the East Coast
East Coast
Price forecast assumptions
• Prices were sourced from ACIL Allen Consulting’s report to the Australian Energy Market Operator “Fuel and Technology Cost Review”, with forecasts for fuel costs for new gas market entrants to a Sydney node. An average of each year from 2020-2040 was taken to determine a base price for this analysis
• Both the Success and Aspirational scenario was aligned to their ‘High Consumption’ scenario. The price used for the analysis was $8.29
East Coast
Cost and Financial Assumptions
Pipeline – Intra Northern Territory • Under the Success and Aspirational scenarios, gas is transported from the field to the new inter-connecting pipeline between
the Northern Territory and East Coast via existing Northern Territory pipeline infrastructure (i.e. Amadeus Gas Pipeline) • The field is assumed to be located in the Beetaloo sub-basin – approximately 1,100km from Alice Springs • The OPEX is assumed to be as stated by the Australian Energy Regulator’s Amadeus Gas Pipeline Annual Tariff Variation
2014-15 “Statement of Reasons” at $0.6983
Economic impact of shale and tight gas development in the NT ©2015 Deloitte Access Economics Pty Ltd 34
Technical Appendix (4 of 6)
Appendix
Market Category Description / logic
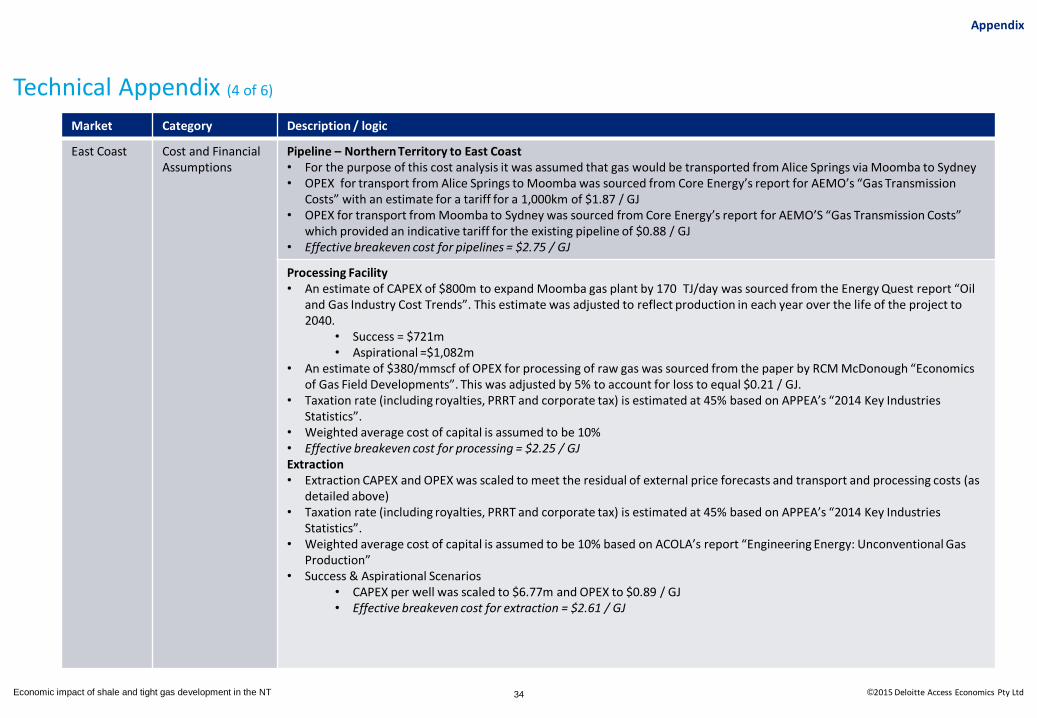
East Coast
Cost and Financial Assumptions
Pipeline – Northern Territory to East Coast • For the purpose of this cost analysis it was assumed that gas would be transported from Alice Springs via Moomba to Sydney • OPEX for transport from Alice Springs to Moomba was sourced from Core Energy’s report for AEMO’s “Gas Transmission
Costs” with an estimate for a tariff for a 1,000km of $1.87 / GJ • OPEX for transport from Moomba to Sydney was sourced from Core Energy’s report for AEMO’S “Gas Transmission Costs”
which provided an indicative tariff for the existing pipeline of $0.88 / GJ • Effective breakeven cost for pipelines = $2.75 / GJ
Processing Facility • An estimate of CAPEX of $800m to expand Moomba gas plant by 170 TJ/day was sourced from the Energy Quest report “Oil
and Gas Industry Cost Trends”. This estimate was adjusted to reflect production in each year over the life of the project to 2040.
• Success = $721m • Aspirational =$1,082m
• An estimate of $380/mmscf of OPEX for processing of raw gas was sourced from the paper by RCM McDonough “Economics of Gas Field Developments”. This was adjusted by 5% to account for loss to equal $0.21 / GJ.
• Taxation rate (including royalties, PRRT and corporate tax) is estimated at 45% based on APPEA’s “2014 Key Industries Statistics”.
• Weighted average cost of capital is assumed to be 10% • Effective breakeven cost for processing = $2.25 / GJ Extraction • Extraction CAPEX and OPEX was scaled to meet the residual of external price forecasts and transport and processing costs (as
detailed above) • Taxation rate (including royalties, PRRT and corporate tax) is estimated at 45% based on APPEA’s “2014 Key Industries
Statistics”. • Weighted average cost of capital is assumed to be 10% based on ACOLA’s report “Engineering Energy: Unconventional Gas
Production” • Success & Aspirational Scenarios
• CAPEX per well was scaled to $6.77m and OPEX to $0.89 / GJ • Effective breakeven cost for extraction = $2.61 / GJ
Economic impact of shale and tight gas development in the NT ©2015 Deloitte Access Economics Pty Ltd 35
Technical Appendix (5 of 6)
Appendix
Market Category Description / logic
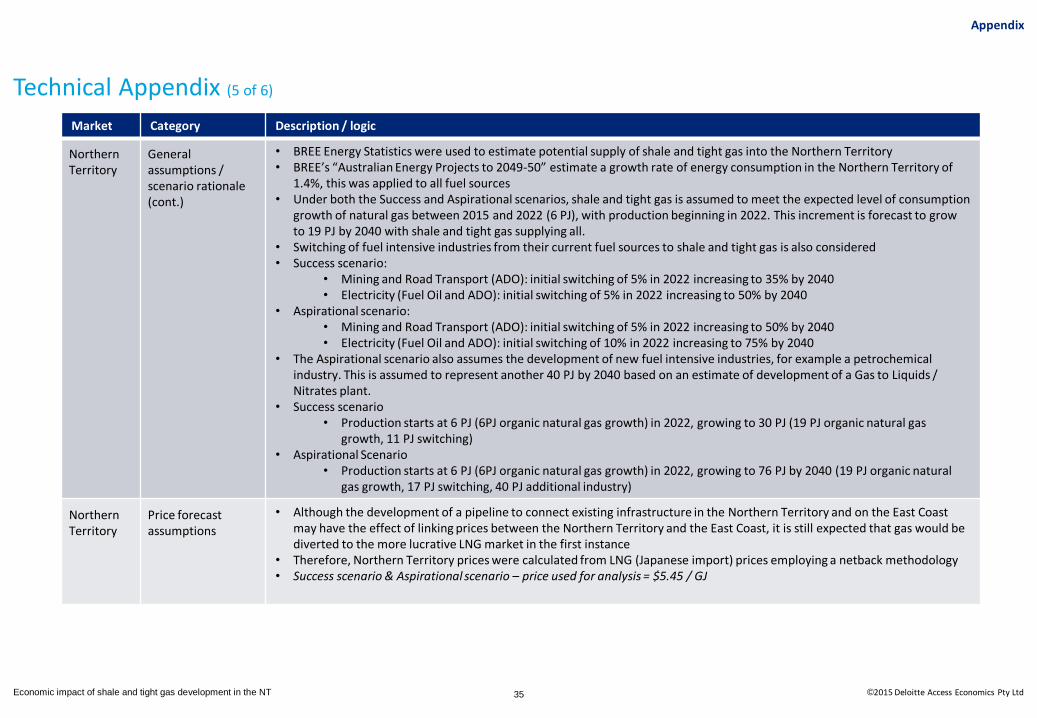
Northern Territory
General assumptions / scenario rationale (cont.)
• BREE Energy Statistics were used to estimate potential supply of shale and tight gas into the Northern Territory • BREE’s “Australian Energy Projects to 2049-50” estimate a growth rate of energy consumption in the Northern Territory of
1.4%, this was applied to all fuel sources • Under both the Success and Aspirational scenarios, shale and tight gas is assumed to meet the expected level of consumption
growth of natural gas between 2015 and 2022 (6 PJ), with production beginning in 2022. This increment is forecast to grow to 19 PJ by 2040 with shale and tight gas supplying all.
• Switching of fuel intensive industries from their current fuel sources to shale and tight gas is also considered • Success scenario:
• Mining and Road Transport (ADO): initial switching of 5% in 2022 increasing to 35% by 2040 • Electricity (Fuel Oil and ADO): initial switching of 5% in 2022 increasing to 50% by 2040
• Aspirational scenario: • Mining and Road Transport (ADO): initial switching of 5% in 2022 increasing to 50% by 2040 • Electricity (Fuel Oil and ADO): initial switching of 10% in 2022 increasing to 75% by 2040
• The Aspirational scenario also assumes the development of new fuel intensive industries, for example a petrochemical industry. This is assumed to represent another 40 PJ by 2040 based on an estimate of development of a Gas to Liquids / Nitrates plant.
• Success scenario • Production starts at 6 PJ (6PJ organic natural gas growth) in 2022, growing to 30 PJ (19 PJ organic natural gas
growth, 11 PJ switching) • Aspirational Scenario
• Production starts at 6 PJ (6PJ organic natural gas growth) in 2022, growing to 76 PJ by 2040 (19 PJ organic natural gas growth, 17 PJ switching, 40 PJ additional industry)
Northern Territory
Price forecast assumptions
• Although the development of a pipeline to connect existing infrastructure in the Northern Territory and on the East Coast may have the effect of linking prices between the Northern Territory and the East Coast, it is still expected that gas would be diverted to the more lucrative LNG market in the first instance
• Therefore, Northern Territory prices were calculated from LNG (Japanese import) prices employing a netback methodology • Success scenario & Aspirational scenario – price used for analysis = $5.45 / GJ
Economic impact of shale and tight gas development in the NT ©2015 Deloitte Access Economics Pty Ltd 36
Technical Appendix (6 of 6)
Appendix
Market Category Description / logic
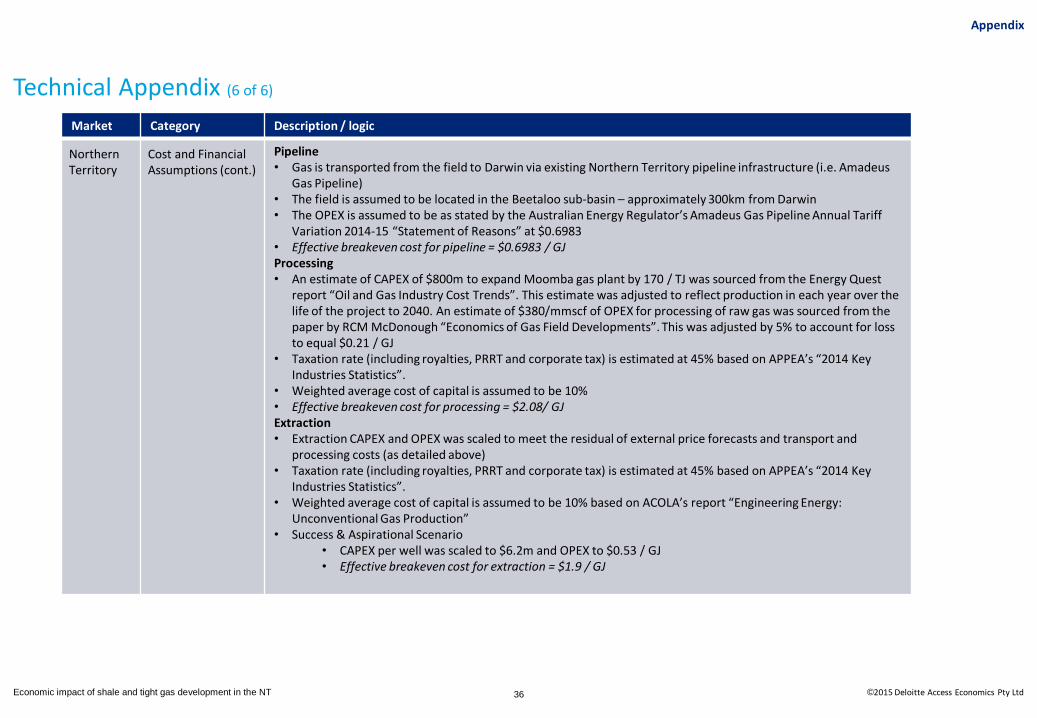
Northern Territory
Cost and Financial Assumptions (cont.)
Pipeline • Gas is transported from the field to Darwin via existing Northern Territory pipeline infrastructure (i.e. Amadeus
Gas Pipeline) • The field is assumed to be located in the Beetaloo sub-basin – approximately 300km from Darwin • The OPEX is assumed to be as stated by the Australian Energy Regulator’s Amadeus Gas Pipeline Annual Tariff
Variation 2014-15 “Statement of Reasons” at $0.6983 • Effective breakeven cost for pipeline = $0.6983 / GJ Processing • An estimate of CAPEX of $800m to expand Moomba gas plant by 170 / TJ was sourced from the Energy Quest
report “Oil and Gas Industry Cost Trends”. This estimate was adjusted to reflect production in each year over the life of the project to 2040. An estimate of $380/mmscf of OPEX for processing of raw gas was sourced from the paper by RCM McDonough “Economics of Gas Field Developments”. This was adjusted by 5% to account for loss to equal $0.21 / GJ
• Taxation rate (including royalties, PRRT and corporate tax) is estimated at 45% based on APPEA’s “2014 Key Industries Statistics”.
• Weighted average cost of capital is assumed to be 10% • Effective breakeven cost for processing = $2.08/ GJ Extraction • Extraction CAPEX and OPEX was scaled to meet the residual of external price forecasts and transport and
processing costs (as detailed above) • Taxation rate (including royalties, PRRT and corporate tax) is estimated at 45% based on APPEA’s “2014 Key
Industries Statistics”. • Weighted average cost of capital is assumed to be 10% based on ACOLA’s report “Engineering Energy:
Unconventional Gas Production” • Success & Aspirational Scenario
• CAPEX per well was scaled to $6.2m and OPEX to $0.53 / GJ • Effective breakeven cost for extraction = $1.9 / GJ

About Deloitte
Deloitte refers to one or more of Deloitte Touche Tohmatsu Limited, a UK private company limited by guarantee, and its network of member firms, each of which is a legally separate and independent entity. Please see www.deloitte.com/au/about for a detailed description of the legal structure of Deloitte Touche Tohmatsu Limited and its member firms.
Deloitte provides audit, tax, consulting, and financial advisory services to public and private clients spanning multiple industries. With a globally connected network of member firms in more than 150 countries, Deloitte brings world-class capabilities and deep local expertise to help clients succeed wherever they operate. Deloitte's approximately 170,000 professionals are committed to becoming the standard of excellence.
In Australia, the member firm is the Australian partnership of Deloitte Touche Tohmatsu. As one of Australia’s leading professional services firms. Deloitte Touche Tohmatsu and its affiliates provide audit, tax, consulting, and financial advisory services through approximately 5,000 people across the country. Focused on the creation of value and growth, and known as an employer of choice for innovative human resources programs, we are dedicated to helping our clients and our people excel. For more information, please visit our web site at www.deloitte.com.au.
Confidential – this document and the information contained in it are confidential and should not be used or disclosed in any way without our prior consent.
Liability limited by a scheme approved under professional Standards Legislation
Member of Deloitte Touche Tohmatsu Limited Liability limited by a scheme approved under Professional Standards Legislation. © 2015 Deloitte Access Economics