Embed Size (px)
Citation preview
Economic Contributions of the Turfgrass Industry
in Florida
Final Project Report to the Florida Turfgrass Association
Alan W. Hodges, PhD and Thomas J. Stevens, PhD
University of Florida, Institute of Food and Agricultural Sciences
Food and Resource Economics Department
Gainesville, FL
Corresponding author contact:
tel. 352-392-1881 x312; email [email protected]
December 2010

1
Table of Contents
Table of Contents ............................................................................................................................................... 1
Acknowledgments .............................................................................................................................................. 2
Executive Summary ............................................................................................................................................ 3
Introduction ........................................................................................................................................................ 6
Survey Methodology .......................................................................................................................................... 9
Survey Findings and State Industry Estimates ................................................................................................. 10
Golf Courses ................................................................................................................................................. 10
Lawn and Garden Retail Stores .................................................................................................................... 12
Landscape Service Vendors ......................................................................................................................... 14
Commercial, Non-Profit and Government Institutions and Properties With Buildings and Grounds ......... 17
Home Owners ............................................................................................................................................... 19
Sod Farms ..................................................................................................................................................... 21
Economic Contribution Analysis ..................................................................................................................... 22
Methodology ................................................................................................................................................. 22
Golf Courses ................................................................................................................................................. 24
Lawn and Garden Retail Stores .................................................................................................................... 26
Landscape Service Vendors ......................................................................................................................... 28
Sod Farms ..................................................................................................................................................... 30
Economic Contributions Summary .............................................................................................................. 31
Literature and Information Sources Cited ........................................................................................................ 34
Appendix A: Glossary of Regional Economic Terminology ........................................................................... 35
Appendix B: Survey Questionnaires ................................................................................................................ 36
General Greeting and Introduction ............................................................................................................... 36
Lawn and Garden Retail Stores ..................................................................................................................... 36
Landscape Service Vendors ........................................................................................................................... 37
Golf Courses ................................................................................................................................................. 37
Commercial, Non-Profit, Government Institutions Buildings/Grounds .......................................................... 38
Homeowners ................................................................................................................................................. 39

2
Acknowledgments
This research and project report were made possible by a grant to the University of Florida from the Florida Turfgrass
Association (Lakeland, Florida), through the Florida Turfgrass Research Foundation, with valuable input provided by
Mr. Peter Snyder, Executive Director.
The Florida Turfgrass Association would like to thank Matt Taylor, CGCS, chair of the FTGA Research Committee
for his leadership and guidance in making this project come to life.
The Florida Turfgrass Association also would like to thank the companies and organizations that helped fund the
Florida Turfgrass Industry Economic Impact Study. Research Leadership contributions were made by:
Everglades Golf Course Superintendents Association
Florida Golf Course Superintendents Association
Golf Course Superintendents Association of America
Harrell’s Professional Fertilizer Solutions
Palm Beach Golf Course Superintendents Association
ShowTurf of Florida LLC
SunCoast Golf Course Superintendents Association
Tom Wells’ Memorial Golf Tournament
Treasure Coast Golf Course Superintendents Association
Wesco Turf, Inc.
Also contributing to the study were: Aerification Plus, Club Car Inc, Calusa Golf Course Superintendents Association,
Dean’s Soil Solutions, Florida Coastal Equipment, Florida Pest Management Association, Go For Supply Inc, Gulf
Coast Golf Course Superintendents Association, Hendrix & Dail, Howard Fertilizer & Chemical, and MJS Golf
Services.
Telephone surveys of the turfgrass industry were conducted by the University of Florida’s, Bureau of Economic and
Business Research. A previous survey of sod farms in Florida conducted by Loretta Satterthwaite, of the University of
Florida-IFAS, Mid-Florida Research and Education Center, was used to augment data for this economic analysis.
3
Economic Contributions of the Turfgrass Industry in Florida
Executive Summary
The purpose of this research was to estimate the economic contributions of the turfgrass industry to the state of Florida.
It is based on survey data for 2007 (the most complete information available), together with regional economic models
and other information. Summary results are reported in 2010 dollars. This study updates results from previous research
conducted in 1992/3. Industry sectors included in this analysis were retail lawn and garden stores, landscape service
vendors, golf courses, sod farms, home-owners, and selected businesses or institutions with significant turfgrass area,
such as commercial property managers, apartments, airports, cemeteries and public parks. A telephone survey of
turfgrass related businesses and households in Florida was conducted during March-May 2010 to collect industry data
for 2007. In addition, a mail survey of sod farms in Florida was conducted in 2008. A total of 1,248 survey interviews
or forms were completed. State-level estimates of industry revenues and employment were calculated from survey
averages together with published industry population statistics and the proportion of valid contacts achieved during the
survey.
Survey results indicate that a total of 3.94 million acres of turfgrass were maintained by golf courses, sod farms,
institutions and homeowners in Florida (Table ES1). Total turfgrass related revenues in Florida in 2007 were estimated
at $6.26 billion, and total turfgrass related direct employment was 157,240 jobs. Golf courses and landscape service
vendors each had revenues exceeding $2.5 billion in 2007, and employment of 50,185 and 61,999 jobs, respectively.
Retail lawn and garden stores had $790 million in revenues of turfgrass related goods and employment of 10,342 jobs.
Sod farms had sales of $320 million in 2008, and employment of 1,800 people. Home-owners made total expenditures
of $3.25 billion for turfgrass related products and services. Selected institutions spent a total of $416 million and
employed 32,914 people for turfgrass maintenance in 2007.
The economic multiplier effects of turfgrass related industry activity in the state were estimated using an input-output
model the Florida economy created with IMPLAN ® software and regional datasets. Total contributions for the
industry and each of its component sectors include the indirect and induced multiplier effects that represent supply
chain activity from business input purchases, and spending by employee households that result from new final demand
or nonlocal sales. Expenditures by home-owners and non-labor expenditures by institutions were not included in the
totals because these values are captured by revenues in the other sectors.
The combined total output (revenue) contribution of the Florida turfgrass industry in 2007 is estimated at $7.82 billion
(in 2010 dollars), as shown in Table ES1. The total value-added contribution was $4.16 billion, including $2.71 billion
in labor income (employee compensation and proprietor income), $1.13 billion in other property type income (rents,
royalties, interest, dividends), and $318 M in indirect business taxes (property, sales, excise taxes). The total value-
added contribution represented 0.54 percent of the Gross State Product of Florida in 2007 ($771.1 billion in 2010
dollars). The total employment contribution of Florida’s turfgrass industry in 2007 is estimated at 173,166 jobs,
representing 1.64% of all jobs in the State that year (10.56 million).

4
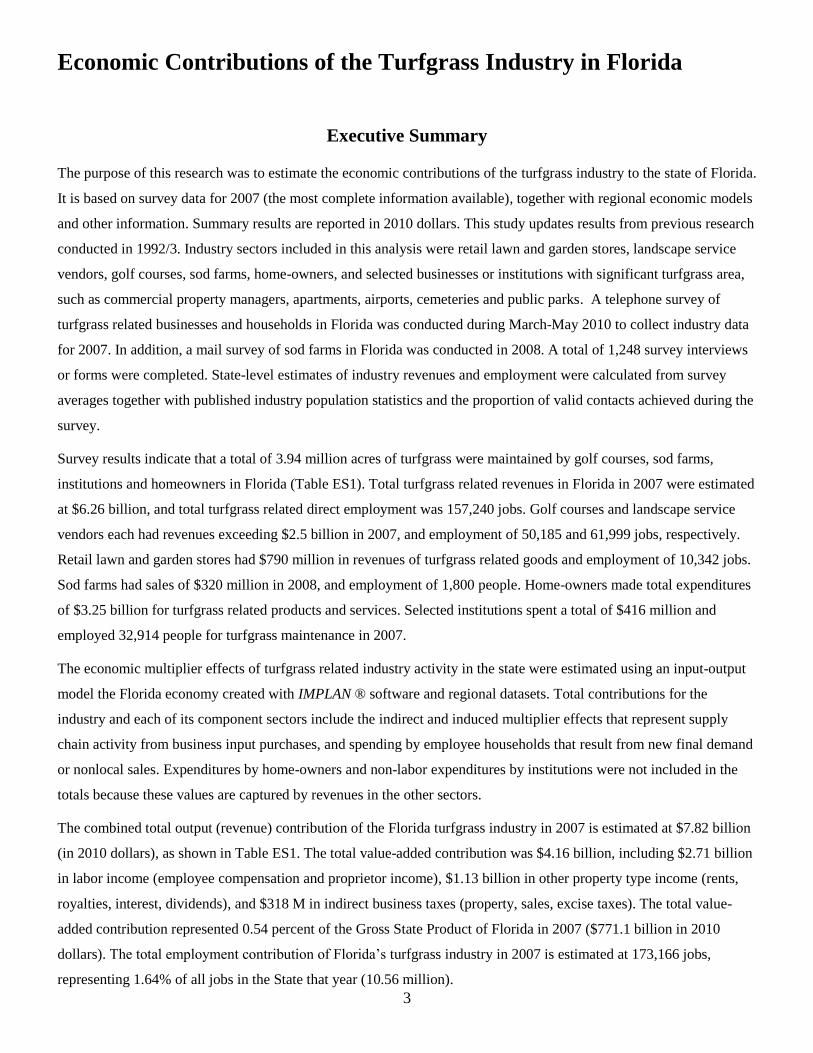
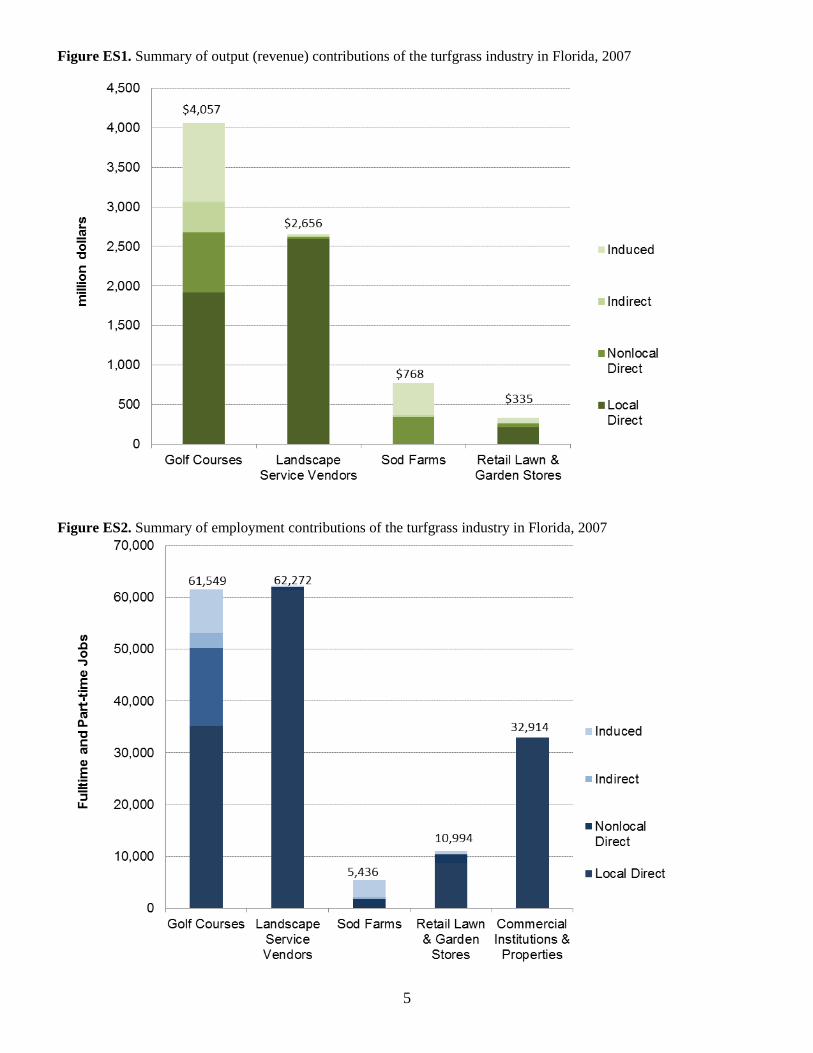
Golf courses were the largest sector in Florida’s turfgrass industry in 2007, with total output contributions of $4.06
billion, value added contribution of $2.04 billion, and indirect business tax contributions of $194 million, and
employment of 61,549 jobs, which represented nearly half or more of the total for the industry (Table ES1). Landscape
service vendors were the second largest sector, generating total output of $2.66 billion, value-added of $1.40 billion,
and employment of 62,272 jobs, or 44 percent of the total. The retail lawn and garden store sector had output
contributions of $335 million, value added contributions of $218 million and employment contributions of 10,994 jobs.
Although sod farms had the lowest revenues of any sector, their output contributions ($768 million) and employment
contributions (5,436 jobs) were large because of high multiplier effects of final demand for this product.
Local direct effects dominated the economic impacts of retail lawn and garden stores, and landscape service vendors,
while indirect and induced effects from nonlocal sales were more important for the sod and golf sectors (Figures ES1
and ES2). These two figures also highlight the differences in monetary versus employment contributions across the
four turfgrass sectors. While sod production had output contributions nearly 2.3 times that of retail stores, employment
contributions of retail stores were over twice as great as those of sod production. Similarly, although golf’s monetary
contributions to the State were over 50 percent greater than those of landscape services, employment contributions by
landscape services exceeded that of golf by 723 jobs.
Table ES1. Summary of economic contributions and characteristics of turfgrass industry sectors in Florida, 2007
Golf
Courses
Lawn &
Garden
Retailers
Landscape
Service
Vendors
Sod
Farms
Institutions
and
Properties
Home
owners
Total
All
Sectors
Survey sample size 205 198 201 59 194 391 1,248
Population 921 1,601 7,502 11,029 3,376,982
Turfgrass area managed (thousand acres) 108.6 1,844.7 103.9 686.7 3,042 3,940.5
Turgrass-related revenues (million $) 2,529.1 789.9 2,594.4 348.3 6,261.6
Nonlocal share of revenues (%) 29.8 16.4 0.9 100.0
Expenditures for goods and services
(million $) 415.6 3,253.7 3,669.3
Employment (jobs) 50,185 10,342 61,999 1,800 32,914 157,240
Output impacts (million $) 4,056.8 334.8 2,656.0 767.9 7,815.4
Value added impacts (million $) 2,040.3 218.3 1,403.2 493.7 4,155.5
Employment impacts (fulltime, part-time
jobs) 61,549 10,994 62,272 5,436 32,914 173,166
Labor income impacts (million $) 1,200.5 135.1 1,141.5 230.5 2,707.6
Other property type income impacts
(million $) 646.1 40.2 204.1 239.2 1,129.6
Indirect business tax impacts (million $) 193.7 43.1 57.6 23.9 318.3
All values stated in 2010 dollars. Employment impacts represent fulltime and part-time jobs. Impact estimates include
indirect/induced multiplier effects. Empty table cells indicate values not available or not applicable. Turfgrass area managed by
landscape service vendors not included in total to avoid double-counting.
5
Figure ES1. Summary of output (revenue) contributions of the turfgrass industry in Florida, 2007
Figure ES2. Summary of employment contributions of the turfgrass industry in Florida, 2007
6
Economic Contributions of the Turfgrass Industry in Florida
Introduction
Cultivated turfgrass is a pervasive vegetative groundcover for lawns of most homes in America and other developed
regions of the world. Turfgrass lawns are a preferred groundcover because they provide environmental benefits to
property owners and society at-large such as erosion control, noise buffering, nutrient runoff capture, pollutant
absorption and aesthetic enhancement. The production, installation, and management of turfgrass is a major
contributor to regional economic activity through sod production, lawn and landscape installation and maintenance,
and retail sales of lawn-related horticultural goods. The total economic impacts of turfgrass related commercial activity
in the United States in 2002 was estimated at $57.9 billion in industry output or revenues (in 2005 dollars), $35.1
billion in value added (income) and 822,849 jobs (Haydu et al, 2006). Florida was ranked as the largest state in the
U.S. for turfgrass related economic activity.
The present study updates a previous major survey-based study of the turfgrass industry in Florida in 1991-92,
broadly-defined to include household, business and government segments. The previous study estimated total industry
revenues of $6.5 billion, consumer expenditures of $5.0 billion, employment of 185,000 workers, and investment in
turf-related at assets valued at $8.6 billion (Hodges et al, 1994). The 1991-92 study also reported a total managed
turfgrass area of 4.4 million acres in the state, with 75 percent of this for households.
Recent changes in the economic performance of the broad economic sectors encompassing the turfgrass industry are
reviewed in this section to provide some background and context to the findings of the study. As with most sectors of
the economy, these sectors are affected by cyclical changes in general economic activity. The turfgrass industry is
strongly influenced by activity in the construction and real estate sectors. Other factors influencing industry activity
include population growth, technological change, infrastructure investment and weather. Trends in economic activity
of three industry sectors for 2001 through 2008 are shown in Figures 1, 2 and 3 for output (revenues), value added, and
employment respectively. The three sectors tracked are Greenhouse, Nursery, and Floriculture Production, Services to
Buildings and Dwellings (landscape services), and Retail Building Material and Garden Supply stores.
Landscape services and retail lawn and garden stores both saw significant revenue growth from 2001 through 2006,
while landscape services continued to grow through 2007 before dropping off significantly in 2008. Over the eight
year period, growth in revenues for landscape services and retail stores was robust, averaging 11.3 and 6.0 percent
respectively. Nursery and greenhouse production has not shown any particular trend during the eight year period, with
growth averaging a negative 0.2 percent (Figure 1).
Among the three sectors, the trends for value added are similar to those for output, although more volatile. Value
added includes employee and proprietor earnings as well as corporate profits. Services to buildings and retail lawn and
garden stores grew at an average annual rate of 4.9 and 5.1 percent respectively, while nursery and greenhouse
earnings shrank by an average 2.1 percent per year (Figure 2).

7
Trends in employment are presented in Figure 3. Most of the change in employment has occurred in building services
which saw a rise from 62,568 jobs in 2000 to 81,759 jobs in 2007, before dropping off to 79,598 jobs in 2008. Job
growth in this sector averaged 4.5 percent annually over the eight year period. Employment by lawn and garden stores
grew by 3.2 percent, while the nursery and greenhouse sector grew by just 0.7 percent.
Figure 1. Trend in industry output by turfgrass related sectors in Florida, 2001-08
0.0
0.5
1.0
1.5
2.0
2.5
3.0
3.5
4.0
4.5
5.0
2001 2002 2003 2004 2005 2006 2007 2008
bill
ion
do
llars
(2
00
8)
Source: IMPLAN (MIG, Inc.)
Landscapeservices
Nursery andgreenhouseproduction
Retail lawnand gardenstores
Note, data not available for 2005.

8
Figure 2. Trend in value added impacts of turfgrass related sectors in Florida, 2001-08
0.0
0.5
1.0
1.5
2.0
2.5
3.0
3.5
4.0
4.5
2001 2002 2003 2004 2005 2006 2007 2008
bill
ion
do
llars
(2
00
8)
Source: IMPLAN (MIG, Inc.)
Landscapeservices
Nursery andgreenhouseproduction
Retail lawnand gardenstores
Figure 3. Trend in employment of turfgrass related sectors in Florida, 2001-08
0
10
20
30
40
50
60
70
80
90
2001 2002 2003 2004 2005 2006 2007 2008
tho
usa
nd
fu
llti
me
& p
art-
tim
e jo
bs
Source: IMPLAN (MIG, Inc.)
Landscapeservices
Nursery andgreenhouseproduction
Retail lawnand gardenstores
9
Survey Methodology
Primary information for this study was collected through a telephone survey of Florida businesses and households
conducted during the period March-May, 2010. Groups targeted by the survey included golf courses, lawn and garden
retail stores, landscape service companies, single family homeowners, and commercial, non-profit or government
institutions such as apartment and property managers, cemeteries, and airports. Survey interviews were performed by
the University of Florida, Bureau of Economic and Business Research, Survey Research Program. Data collected for
each sector included land or turf area, types of products or services, market segments, employment, and revenues or
expenditures for the year 2007. Survey questionnaires are shown for each group in Appendix B. The survey protocol
was approved by the University of Florida Institutional Review Board for compliance with ethical standards for human
subjects research. Listings of businesses in each group were obtained from the One Source Business Directory. Firms
or households were randomly sampled in each group, and at least 3 attempts were made to contact a respondent. A
total of 1,248 businesses or homeowners were sampled for the survey. Based on industry population data and the
proportion of valid contacts achieved during the survey, state-level estimates of industry sales, employment and area
were calculated from survey averages. Contacts that did not have a working telephone number were considered
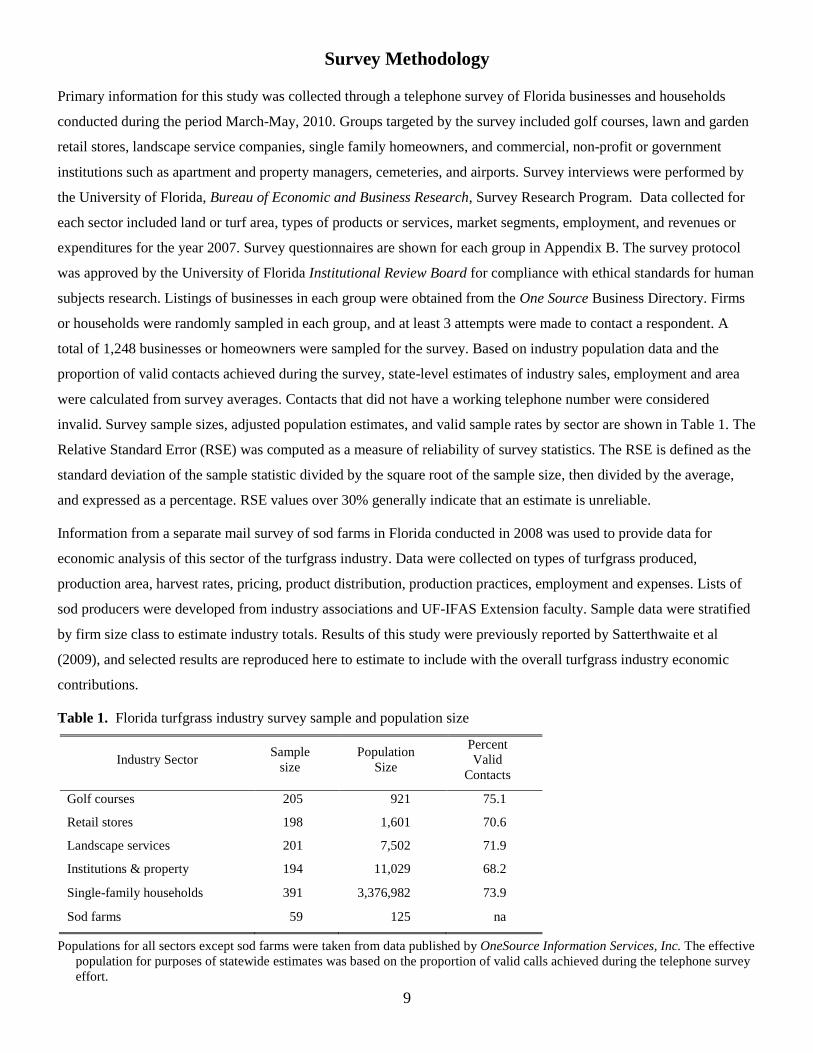
invalid. Survey sample sizes, adjusted population estimates, and valid sample rates by sector are shown in Table 1. The
Relative Standard Error (RSE) was computed as a measure of reliability of survey statistics. The RSE is defined as the
standard deviation of the sample statistic divided by the square root of the sample size, then divided by the average,
and expressed as a percentage. RSE values over 30% generally indicate that an estimate is unreliable.
Information from a separate mail survey of sod farms in Florida conducted in 2008 was used to provide data for
economic analysis of this sector of the turfgrass industry. Data were collected on types of turfgrass produced,
production area, harvest rates, pricing, product distribution, production practices, employment and expenses. Lists of
sod producers were developed from industry associations and UF-IFAS Extension faculty. Sample data were stratified
by firm size class to estimate industry totals. Results of this study were previously reported by Satterthwaite et al
(2009), and selected results are reproduced here to estimate to include with the overall turfgrass industry economic
contributions.
Table 1. Florida turfgrass industry survey sample and population size
Industry Sector Sample
size
Population
Size
Percent
Valid
Contacts
Golf courses 205 921 75.1
Retail stores 198 1,601 70.6
Landscape services 201 7,502 71.9
Institutions & property 194 11,029 68.2
Single-family households 391 3,376,982 73.9
Sod farms 59 125 na
Populations for all sectors except sod farms were taken from data published by OneSource Information Services, Inc. The effective
population for purposes of statewide estimates was based on the proportion of valid calls achieved during the telephone survey
effort.

10
Survey Findings and State Industry Estimates
In this section, the statistical findings of a survey of the turfgrass related industry sectors in Florida are presented for
lawn and garden retail stores, landscape service vendors, golf courses, sod farms, home owners, and selected
commercial, non-profit or government institutions.
Golf Courses
Two-hundred and five golf course operations in Florida were interviewed about their operations as part of this study.
Golf course operators were asked first about the basic characteristics of their facility including the type of operation,
number of golf-playing holes and acreage. In Table 2 the distribution of surveyed course types is shown. Respondents
were asked to classify their operations as private, semi-private, public, municipal, military, resort, “other”, or some
combination. Some courses operate in multiple formats based on time of day, day of the week, or specific sections of
the course. Results indicate that private, semi-private, and public course each comprise approximately one third of all
course types. Municipal courses comprised 7.8 percent of surveyed golf operations, followed by “other” at 7.3
percent, resorts (6.3%) and military courses (1.5%).
The distribution of golf courses according to the number of golf-playing holes is shown in Table 3. Over 70 percent of
all golf operations surveyed had 18 holes, while facilities with nine holes or less comprised 10.7 percent and those with
27 or more holes accounted for 9.8 percent of the total.
Golf course respondents were also queried about the land area their operations encompassed (Table 4). The average
land area was 118 acres, and almost 100 acres (90%) of this area was irrigated. The estimated total area in golf courses
for the state was calculated by multiplying the average by the population estimates given in Table 1. On this basis,
there was an estimated 108,613 acres of land in golf courses in 2007, with 91,742 acres under irrigation.
Respondents were also asked to provide employment and financial data on their operations, including the number of
full-time, part-time and contract employees, as shown in Table 5. A total of 10,350 jobs were reported, representing an
average of 54.5 jobs per course, with about 69 percent full-time jobs, 27 percent part-time, and 5 percent contract
workers. The high relative standard-error for the number of contract jobs is due to the relatively small number of golf
courses that had employees of this type. The significantly smaller median values for employment reflects a few large
courses in the sample with over 200 employees. Based on these survey data, it is estimated that golf courses provided
direct employment of more than 50,000 jobs in Florida in 2007.
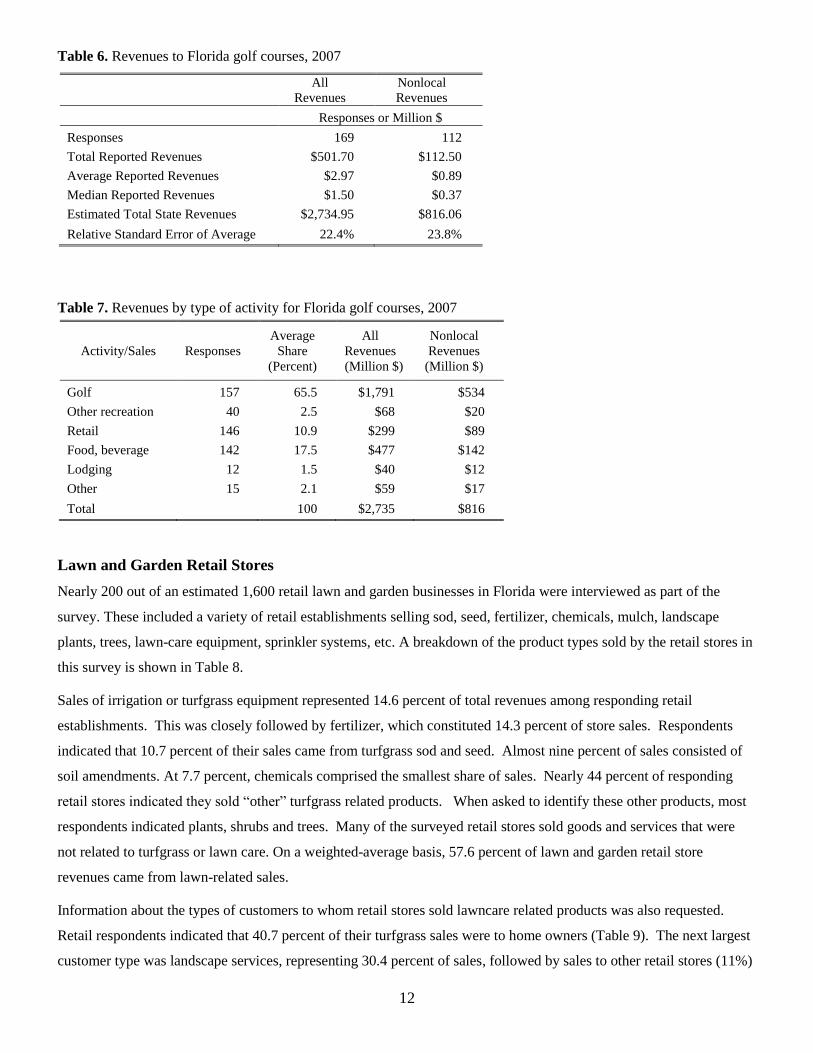
Survey statistics on golf course revenues in Florida are shown in Table 6. Average revenues for 2007 reported by
sampled golf courses was $2.97 million. Nearly 30 percent of revenues, on average, were estimated to have originated
from outside the state from golf-playing visitors. Median revenues were roughly half as large as the averages due to a
small number of surveyed courses that were five to ten times larger than the sample average. Multiplying the average
revenue by 921 operations in the state gives estimated total revenues for Florida golf courses in 2007 of $2.73 billion,
with $816 million from non-local (out of state) sources (Table 6).

11
Surveyed golf courses were also asked about the share of revenues originating from sales of equipment, food and
beverages, lodging, etc., in addition to golf. Statistics and state projections from these data are shown in Table 7. Not
surprisingly, golf fees represented nearly two-thirds of total revenues for surveyed golf courses, equivalent to nearly
$1.8 billion in 2007, with $534 million coming from out-of-state sources. The biggest remaining share (27%) of the
remaining golf course revenues came from food and beverage, and retail sales, averaging $477,000 and $299,000
respectively, per golf course in 2007. Revenues from lodging, other recreation, and miscellaneous activities amounted
to less than five percent of the total.
Table 2. Florida golf course types surveyed
Course Type Percent
Private 30.2
Semi-private 36.6
Resort 6.3
Public 36.6
Municipal 7.8
Military 1.5
Other 7.3
Note: Sum of percentages exceeds 100 because respondents were allowed to report multiple course types.
Table 3. Number of golf-playing holes managed by Florida golf courses, 2007
Golf Holes Number of
Respondents Percent
9 or less 22 10.7
18 146 71.2
27 15 7.3
More than 27 19 9.3
Table 4. Turfgrass area and irrigated area of Florida golf courses, 2007
Turf Area Irrigated Area
Responses 185 166
Total Reported Acres 21,811 17,626
Average Acres 118 99.6
Relative Standard Error 5.8% 6.0%
Estimated State Acres 108,613 91,742
Table 5. Employment by Florida golf courses, 2007
Statistic Full-time
Jobs
Part-time
Jobs
Contract
Jobs
Total
Jobs
Number of Responses 188 187 179 190
Total jobs reported 7,098 2,775 477 10,350
Average per Course 37.4 14.6 2.5 54.5
Median 20.0 8.0 0.0 35.0
Estimated State Total Jobs 34,417 13,455 2,313 50,185
Relative Std. Error of Average 12.0% 11.4% 21.8% 11.0%
12
Table 6. Revenues to Florida golf courses, 2007
All
Revenues
Nonlocal
Revenues
Responses or Million $
Responses 169 112
Total Reported Revenues $501.70 $112.50
Average Reported Revenues $2.97 $0.89
Median Reported Revenues $1.50 $0.37
Estimated Total State Revenues $2,734.95 $816.06
Relative Standard Error of Average 22.4% 23.8%
Table 7. Revenues by type of activity for Florida golf courses, 2007
Activity/Sales Responses
Average
Share
(Percent)
All
Revenues
(Million $)
Nonlocal
Revenues
(Million $)
Golf 157 65.5 $1,791 $534
Other recreation 40 2.5 $68 $20
Retail 146 10.9 $299 $89
Food, beverage 142 17.5 $477 $142
Lodging 12 1.5 $40 $12
Other 15 2.1 $59 $17
Total 100 $2,735 $816
Lawn and Garden Retail Stores
Nearly 200 out of an estimated 1,600 retail lawn and garden businesses in Florida were interviewed as part of the
survey. These included a variety of retail establishments selling sod, seed, fertilizer, chemicals, mulch, landscape
plants, trees, lawn-care equipment, sprinkler systems, etc. A breakdown of the product types sold by the retail stores in
this survey is shown in Table 8.
Sales of irrigation or turfgrass equipment represented 14.6 percent of total revenues among responding retail
establishments. This was closely followed by fertilizer, which constituted 14.3 percent of store sales. Respondents
indicated that 10.7 percent of their sales came from turfgrass sod and seed. Almost nine percent of sales consisted of
soil amendments. At 7.7 percent, chemicals comprised the smallest share of sales. Nearly 44 percent of responding
retail stores indicated they sold “other” turfgrass related products. When asked to identify these other products, most
respondents indicated plants, shrubs and trees. Many of the surveyed retail stores sold goods and services that were
not related to turfgrass or lawn care. On a weighted-average basis, 57.6 percent of lawn and garden retail store
revenues came from lawn-related sales.
Information about the types of customers to whom retail stores sold lawncare related products was also requested.
Retail respondents indicated that 40.7 percent of their turfgrass sales were to home owners (Table 9). The next largest
customer type was landscape services, representing 30.4 percent of sales, followed by sales to other retail stores (11%)

13
and commercial clients (9.4%), growers (5.6%) and non-profits (including government agencies) at 3.2 percent (Table
9).
Data on the number of jobs and annual revenues for 2007 generated by lawn and garden retailers are summarized in
Tables 10 and 11. Total 2007 revenues averaged $924,000 per establishment (Table 10). Approximately $471,000 or
50.9 percent of average revenues came from turfgrass related sales, and approximately $77,000 (16.4%) were from
nonlocal or out-of-state sales. Expanding these averages by the population of stores in the state yields an estimated
total of $1.48 billion in lawn and garden store sales for Florida in 2007, with approximately $754 million in turfgrass
related revenues, and $123 million in sales from nonlocal sources.
A total of 2,295 jobs of all types were reported by responding retail establishments in the survey, or an average 12.7
jobs per store, including 9.2 full-time jobs (72%), 2 part-time jobs (15%), and 1.6 contract employees (12%), as shown
in Table 11. The median numbers jobs of all types were substantially smaller due to a small percentage of
establishments employing more than 50 persons, and a significant number of stores that had no part-time or contract
employees. The estimated total number of jobs in the state for 2007 associated with lawn and garden retail stores was
estimated at 20,299, based the average jobs per establishment multiplied by the population (1,601). Multiplying this
number by the proportion of turfgrass/lawn-related sales (50.9%) gives a total of 10,342 retail turfgrass related jobs in
the state (Table 11).
Table 8. Product mix of Florida lawn and garden retail stores
Product Type Average Percent
Sales
Turfgrass sod or seed 10.7
Fertilizer 14.3
Soil amendments 8.9
Chemicals 7.7
Irrigation or Turfgrass equipment 14.6
Other 43.8
Table 9. Types of customers for Florida lawn and garden retail stores
Lawn Market Segment: Average Percent
Sales
Growers 5.6
Other retailers 10.7
Landscape services 30.4
Commercial 9.4
Homeowners 40.7
Non-profit, government 3.2

14
Table 10. Revenues to Florida lawn and garden retail stores, 2007
Statistic Units All
Revenues
Turf Related Revenues
All Nonlocal
Responses number 165 146 144
Total Revenues Reported Million $ 183.00 93.23 15.26
Average Revenues Reported Million $ 0.92 0.47 0.08
Median Revenues Reported Million $ 0.25 0.03 0.00
Estimated State Revenues Million $ 1,479.62 753.84 123.37
Relative Std. Error of Average % 14.22 20.51 39.61
Revenues estimated from mean reported revenues multiplied by population (2,268) and valid call rate (0.7059).
Table 11. Employment by Florida lawn and garden retail stores, 2007
Full-time Part-time Contract Total
Responses 181 180 177 177
Total Jobs Reported 1,657 353 285 2,295
Average Jobs Reported 9.15 1.95 1.57 12.68
Median Jobs Reported 4.00 1.00 0.00 6.00
Estimated Jobs Statewide 14,656 3,122 2,521 20,299
Estimated Turf related Jobs Statewide 7,467 1,591 1,284 10,342
Relative Std. Error of Average 14.9% 19.2% 41.8% 15.1%
Estimated Nonlocal Turf Jobs 1,222 260 210 1,693
Total jobs estimated from average reported jobs multiplied by population (2,268) and valid call rate (70.6%).
Turf related jobs estimated from total jobs multiplied by percent of sales to lawn market (57.6%).
Landscape Service Vendors
Two-hundred and one landscape venders were interviewed for this study, out of an estimated population of 7,502
firms. These businesses included both landscape maintenance and installation contractors, as well as irrigation
specialists. On average, surveyed landscape vendors managed 342 acres of lawn area, although the median acres
managed was much smaller (50 acres). The average was distorted upward by a small percentage of vendors that
reported managing over 1,000 acres. The total area lawn managed by landscape service companies was estimated at
1.84 million acres, based on the average area per firm, the industry population (7,502) and the share of valid survey
contacts (71.9%).
Landscape service vendors were asked to estimate the share of their company’s total sales to various market segments
for 2007. Nearly half of landscape vendor sales were to single-family homes, followed by commercial businesses
(23.1%), apartments and condominiums (19.2%), and non-profit entities, government agencies, and other markets
which combined constituted eight percent of sales in 2007, as shown in Table 13.
Survey results on the types of services provided by landscape vendors in 2007 are presented In Table 14. Not
surprisingly, “lawn mowing” generated the largest share (40.4 percent) of revenues. The next largest sources of
revenues were “plant installation” (14.8%) and sod installation (9.6%). The remaining 35 percent of revenues came
from landscape irrigation and design services, clipping removal, fertilization, pest control, and other services.

15
A total of 3,008 jobs were reported by 189 landscape service vendors, averaging 15.9 jobs per establishment (Table
15). The average landscape business employed about 11 fulltime employees 71%), 1.7 part-time and 2.6 contract
workers. Median job numbers were much lower than the averages because a significant number of respondents were
nonemployers, and thus had no part-time or contract employees. State-level job numbers were estimated by
multiplying average per firm by the population of businesses in Florida (10,429) and by the valid contact rate achieved
during the survey call-out (71.9%). By this method, Florida landscape contractors are estimated to have generated a
total of 119,391 jobs in 2007, with 84,979 of those being full-time, 12,979 part-time, and 21,433 contractual (Table
15). Based on an average reported share of revenues from turfgrass related activities of 51.9 percent, the estimated
total landscape service jobs in the state attributed to turfgrass activities was 61,999, with 44,129 full-time, 6,740 part-
time and 11,130 contract jobs.
Revenues for 2007 reported by surveyed landscape businesses totaled $105.2 million, including $46.9 million (51.9%)
in turfgrass related revenues (Table 16). These figures represent an average of $619,000 in total revenues and
$321,000 in turfgrass related revenues per firm. Expanding these survey averages for the state population, total
landscape business revenues (of all types) are estimated at $4.64 billion, and turfgrass related revenues at $2.41 billion
for 2007. Landscape service vendors reported 0.9 percent of revenues originating from outside of Florida, equivalent
to an average of $2,920 per vendor or $21.9 million for the industry (Table 16). Landscape vendors also reported
making 1.35 percent of their input purchases from out-of-state suppliers.
Table 12. Area managed by Florida landscape service vendors, 2007
Statistic Units Value
Share of turf-grass related revenues Percent 51.9
Average reported acres managed Acres 342
Median acres managed Acres 50
Relative Standard Error of Average Percent 30.0
Table 13. Type of customers for Florida landscape service vendors, 2007
Customer type Average Share of
Sales (Percent)
Single family homes 49.7
Apartments, condominiums 19.2
Commercial businesses 23.1
Nonprofit & government 5.3
Other markets 2.7

16
Table 14. Services provided by Florida landscape service vendors, 2007
Services Average
percent of sales
Lawn mowing 40.4
Plant installation 14.8
Sod installation 9.6
Other service 6.9
Irrigation 5.6
Landscape design 5.6
Clipping removal 5.0
Turf renovation 4.4
Fertilization 3.5
Disease, insect control 2.2
Weed control 2.0
Table 15. Employment by Florida landscape service vendors, 2007
Full-time Part-time Contract Total
Responses 188 188 182 189
Total Reported Jobs 2,141 327 540 3,008
Average Reported Jobs 11.33 1.73 2.86 15.92
Median Reported Jobs 3.00 0.00 0.00 6.00
Estimated State Jobs 84,979 12,979 21,433 119,391
Relative Std. Error of Average 9.1% 19.1% 49.3% 10.8%
Estimated State Turfgrass Jobs 44,129 6,740 11,130 61,999
Estimated total turfgrass related jobs based on 51.93% reported share of turfgrass related revenues.
Table 16. Revenues to Florida landscape service vendors, 2007
Units
All
Revenues
Turf related
Revenue
Nonlocal Turf
Revenue
Responses N 170 146 17
Total Reported Revenues Million $ $105.16 $46.90 $0.42
Average Reported Revenues Million $ $0.619 $0.321 $0.003
Share of Average Revenues % 100.0 51.9 0.47
Median Revenues Million $ $0.250 $0.150 $0.000
Estimated State Total Revenues Million $ $4,640.47 $2,409.76 $21.91
Relative Std. Error of Average % 12.2 12.9 42.9

17
Commercial, Non-Profit and Government Institutions and Properties With Buildings and Grounds
This category of turfgrass related industries represents various commercial and municipal properties, as well as
facilities for public sporting events (excluding golf courses), such as municipal and commercial recreation parks,
cemeteries, airports, public pools, race tracks, apartments, condominiums and mobile home parks. A total of 194
entities were surveyed, and of these, 190 reported that they managed a total of 17,159 acres, or an average of 90.3
acres (Table 17). About 10 percent of the total area managed was irrigated, or 9.1 acres per respondent. Total turfgrass
area managed by these institutions in Florida for 2007 was estimated at 687 thousand acres, based on the average per
respondent, together with the population (11,029) and percentage of valid survey contacts (68.2%).
Nearly 63 percent of institutions and properties interviewed used their own employees to maintain their grounds, while
34.5 percent used a landscape contractor, and about 10 percent used some other means, such as volunteers or a general
management company (Table 18). Respondents reported that a total of 570 employees were devoted to lawn and
landscape maintenance in 2007, averaging about 3 employees per respondent, or about 5 jobs among respondents who
reported employment (Table 19). Estimated statewide employment for this group was 32,914 jobs.
The types of landscape management practices followed by institutions and properties are shown in Table 20. Almost
all respondents engaged in lawn mowing. Over two-thirds of respondents indicated that they practiced fertilization,
weed control, and irrigation, over 65 percent removed leaves and lawn clippings, 61 percent used disease and insect
control, and 59 percent installed sod. The least common practices were turf renovation and soil testing at 59 and 42
percent, respectively (Table 20).
Total expenditures reported by surveyed respondents for landscape and turfgrass care in 2007 were $6.78 million
(Table 21). Nonlocal expenditures amounted to $1.27 million, or about 18.7 percent of the total. Average total
expenditures per respondent were $37,683. Expanding this average to the population of institutions and commercial
properties in Florida gives an estimated total expenditures of $609.2 million, with $112.4 million spent non-locally. It
should be noted that the relative standard error of average non-local expenditures is quite high, indicating that this
estimate is not very reliable (Table 21).
Table 17. Turfgrass area managed by Florida institutions and properties, 2007
Total
Acres
Irrigated
Acres
Responses 190 191
Total Reported Acres 17,159 1,739
Average Reported Acres 90.3 9.1
Relative Std. Error 32.3% 17.0%

18
Table 18. Lawn-care agent for Florida institutions and properties, 2007
Agent Percent of
Respondents
Landscape company 34.5
Employees 62.9
Others 10.3
Note: Sum of percentages exceeds 100 because respondents were allowed to report multiple care sources
Table 19. Employment for lawn and landscape maintenance by Florida institutions and properties, 2007
Statistic Respondents that use
their own employees
Responses 191
Total Employees Reported 570
Average Employees Reported 2.98
Est. State Total Employment 32,914
Median Employees Reported 1.00
Relative Std. Error of Average 10.29%
Table 20. Turf management practices followed by Florida institutions and properties
Practices Percent of
Respondents
Mowing 98.5%
Weed Control 73.7%
Fertilization 69.6%
Irrigation 69.1%
Clipping, Leaf Removal 65.5%
Disease, Insect Control 61.3%
Sod Installation 59.3%
Turf Renovation 41.8%
Soil Testing 27.3%
Table 21. Florida institutions and property turfgrass related expenditures, 2007
Total
Expenditures
Nonlocal
Expenditures
Responses 180 182
Total Reported Expenditures $6,782,932 $1,265,375
Average Reported Expenditures $37,683 $6,953
Median Reported Expenditures $7,750 $0
Estimated State Total Expenditures $415,603,694 $76,680,035
Relative Standard Error of Average 22.6% 90.1%

19
Home Owners
Owners of single-family detached homes were interviewed for this survey to investigate residential lawn management
practices and expenditures. Respondents were asked to indicate the size of their lawn either in square feet, linear
dimensions, or acres, and 288 respondents provided this data. The average lawn size reported was 0.90 acres, and 0.38
acres (42.2%) of the lawn area was irrigated. When these averages are expanded by the number of single family
detached homes in Florida in 2007, and adjusted for the valid call rate (73.9%), it is estimated that there are 3.04
million acres of lawns in the state, including 1.28 million acres irrigated (Table 22).
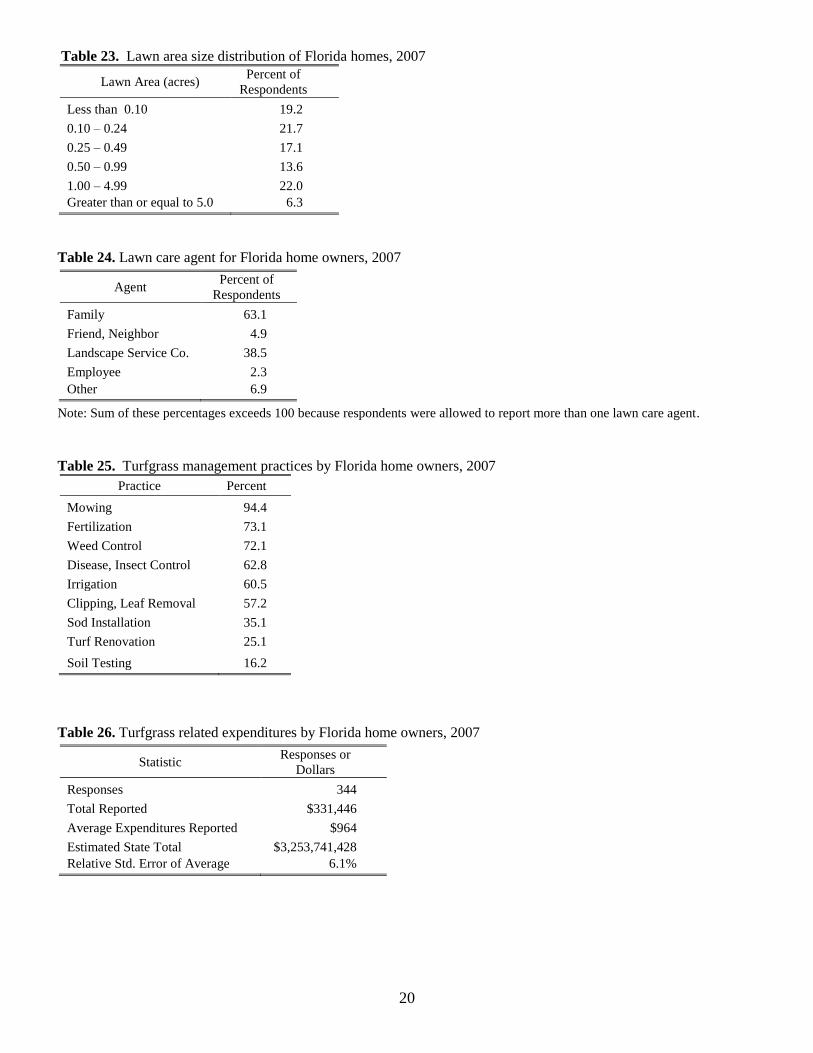
The distribution of lawn areas reported by detached single-family home owners is shown in Table 23. The largest size-
class was homes with 0.10 to 0.24 acres, representing 21.8 percent of respondents). Homes with 1.00 to 4.99 acres
represented 22.5 percent. A small percentage of homes reported lawn areas exceeding five acres (Table 23).
A large share of home owners (63.1%) reported that they do their own lawn care, with family members performing this
activity. However, 38.5 percent of home owners reported hiring a commercial landscape service company to handle
this chore, while about 14 percent indicated that some other party such as a friend, employee, or “other” handles the
lawn-care activities (Table 24).
Home owners reported following many of the basic lawn management practices. Of course, basic maintenance, such as
mowing, is required by most local ordinances, and over 94 percent of homeowners reported this activity. Other
common practices reported were fertilization (73%), weed control (72%), diseases/insect control (63%), and irrigation
(61%), and removal of lawn clippings and leaves (57%). Establishing or renovating lawns is practiced by less than half
of homes, and even fewer (16.2%) performed soil testing (Table 25).
Respondents were asked about their annual expenditures on landscaping or lawn-care in 2007. Total expenditures of
$331,446 were reported, or an average of $964 per household. For the statewide total of 3,376,982 single family
detached homes in Florida, total expenditures are estimated at $3.25 billion (Table 26).
Table 22. Lawn area and irrigated lawn area for single family homes in Florida, 2007
Statistic Units Lawn Area Irrigated Area
Responses N 280 267
Total Acres Reported Acres 253 102
Average Acres Reported Acres 0.90 0.38
Estimated State Total Acres 1 Acres 3,042,094 1,282,639
Relative Std. Error of Average Percent 13.6% 23.0%
U.S. Department of Commerce, Census Bureau, Housing Units reports Florida had 8,729,879 housing units in 2007
(www.census.gov/popest/housing/HU-EST2009.html). The share of single-family detached housing units in Florida in 2000
was reported at 52.3 percent (www.census.gov/hhes/www/housing/census/historic/units.html).
20
Table 23. Lawn area size distribution of Florida homes, 2007
Lawn Area (acres) Percent of
Respondents
Less than 0.10 19.2
0.10 – 0.24 21.7
0.25 – 0.49 17.1
0.50 – 0.99 13.6
1.00 – 4.99 22.0
Greater than or equal to 5.0 6.3
Table 24. Lawn care agent for Florida home owners, 2007
Agent Percent of
Respondents
Family 63.1
Friend, Neighbor 4.9
Landscape Service Co. 38.5
Employee 2.3
Other 6.9
Note: Sum of these percentages exceeds 100 because respondents were allowed to report more than one lawn care agent.
Table 25. Turfgrass management practices by Florida home owners, 2007
Practice Percent
Mowing 94.4
Fertilization 73.1
Weed Control 72.1
Disease, Insect Control 62.8
Irrigation 60.5
Clipping, Leaf Removal 57.2
Sod Installation 35.1
Turf Renovation 25.1
Soil Testing 16.2
Table 26. Turfgrass related expenditures by Florida home owners, 2007
Statistic Responses or
Dollars
Responses 344
Total Reported $331,446
Average Expenditures Reported $964
Estimated State Total $3,253,741,428
Relative Std. Error of Average 6.1%
21
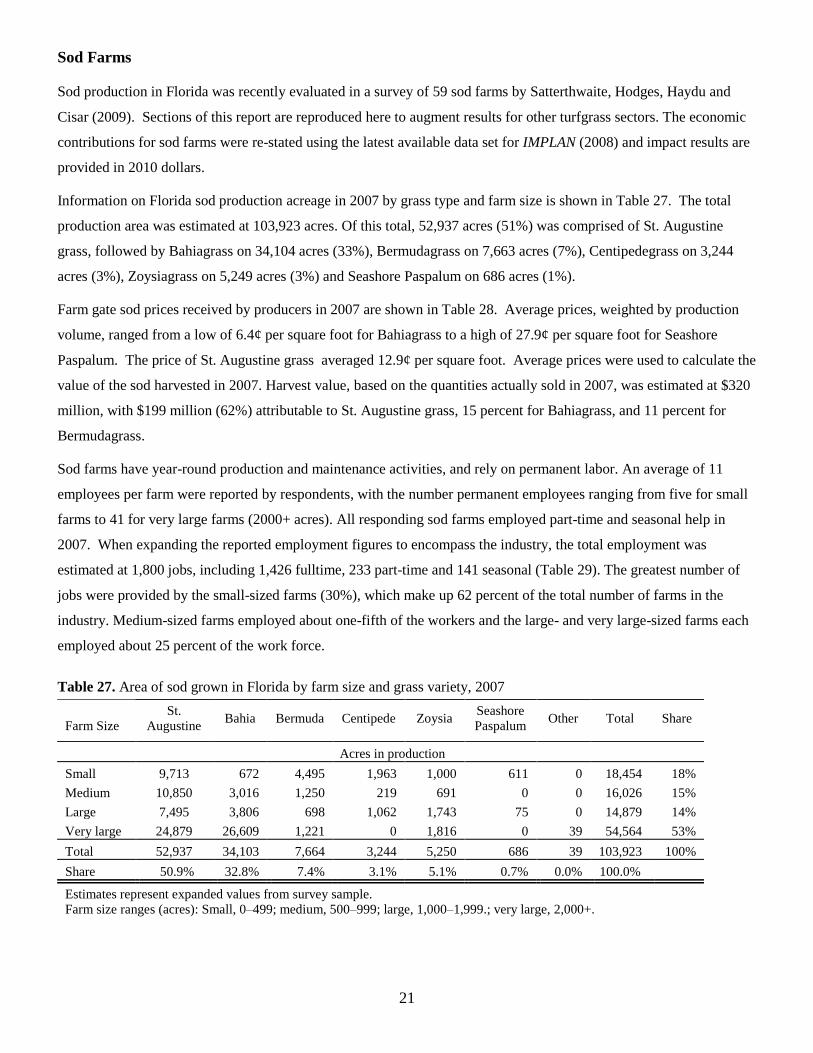
Sod Farms
Sod production in Florida was recently evaluated in a survey of 59 sod farms by Satterthwaite, Hodges, Haydu and
Cisar (2009). Sections of this report are reproduced here to augment results for other turfgrass sectors. The economic
contributions for sod farms were re-stated using the latest available data set for IMPLAN (2008) and impact results are
provided in 2010 dollars.
Information on Florida sod production acreage in 2007 by grass type and farm size is shown in Table 27. The total
production area was estimated at 103,923 acres. Of this total, 52,937 acres (51%) was comprised of St. Augustine
grass, followed by Bahiagrass on 34,104 acres (33%), Bermudagrass on 7,663 acres (7%), Centipedegrass on 3,244
acres (3%), Zoysiagrass on 5,249 acres (3%) and Seashore Paspalum on 686 acres (1%).
Farm gate sod prices received by producers in 2007 are shown in Table 28. Average prices, weighted by production
volume, ranged from a low of 6.4¢ per square foot for Bahiagrass to a high of 27.9¢ per square foot for Seashore
Paspalum. The price of St. Augustine grass averaged 12.9¢ per square foot. Average prices were used to calculate the
value of the sod harvested in 2007. Harvest value, based on the quantities actually sold in 2007, was estimated at $320
million, with $199 million (62%) attributable to St. Augustine grass, 15 percent for Bahiagrass, and 11 percent for
Bermudagrass.
Sod farms have year-round production and maintenance activities, and rely on permanent labor. An average of 11
employees per farm were reported by respondents, with the number permanent employees ranging from five for small
farms to 41 for very large farms (2000+ acres). All responding sod farms employed part-time and seasonal help in
2007. When expanding the reported employment figures to encompass the industry, the total employment was
estimated at 1,800 jobs, including 1,426 fulltime, 233 part-time and 141 seasonal (Table 29). The greatest number of
jobs were provided by the small-sized farms (30%), which make up 62 percent of the total number of farms in the
industry. Medium-sized farms employed about one-fifth of the workers and the large- and very large-sized farms each
employed about 25 percent of the work force.
Table 27. Area of sod grown in Florida by farm size and grass variety, 2007
Farm Size
St.
Augustine Bahia Bermuda Centipede Zoysia
Seashore
Paspalum Other Total Share
Acres in production
Small 9,713 672 4,495 1,963 1,000 611 0 18,454 18%
Medium 10,850 3,016 1,250 219 691 0 0 16,026 15%
Large 7,495 3,806 698 1,062 1,743 75 0 14,879 14%
Very large 24,879 26,609 1,221 0 1,816 0 39 54,564 53%
Total 52,937 34,103 7,664 3,244 5,250 686 39 103,923 100%
Share 50.9% 32.8% 7.4% 3.1% 5.1% 0.7% 0.0% 100.0%
Estimates represent expanded values from survey sample.
Farm size ranges (acres): Small, 0–499; medium, 500–999; large, 1,000–1,999.; very large, 2,000+.

22
Table 28. Sod farm acreage, percent harvested, price per square foot, and harvest value in Florida, by major grass
variety, 2007
Turfgrass Variety
Total Area in
Production
(acres)
Percent of
production
acres harvested
Average
price
$/ft2
Harvest value
($ millions)
St. Augustine 52,937 67% $0.129 $199.3
Bahia 34,104 49% $0.064 $46.6
Centipede 3,244 38% $0.146 $7.8
Bermuda 7,663 74% $0.147 $36.3
Zoysia 5,249 58% $0.187 $24.8
Seashore paspalum 686 58% $0.279 $4.8
Total 103,883 $319.7
Harvest value assumes percent of gross production acres sold based on results of this study, calculated as
production area (A) multiplied by percent area harvested, 43,560 ft2/A, and price/ft
2.
Table 29. Full-time, part-time and seasonal employment Florida sod farms, 2007
Farm Size Full-time Part-time Seasonal Total
Small 345 125 78 548
Medium 309 44 19 372
Large 366 51 22 439
Very Large 406 13 22 441
Total 1,426 233 141 1,800
Average per farm 11.4 1.9 1.1 14.4
Economic Contribution Analysis
Methodology
The economic contributions of turfgrass related sectors to the Florida economy are presented in this section.
Economic impact analysis is typically used to estimate the consequences of an injection of “new” dollars into
a regional economy. This would occur, for example, when visiting tourists purchase local amenities, or when
a local industry sells its products outside the region. This first round of transactions represents the “direct
effects” of economic impacts. Subsequent spending of these new dollars generates additional, or multiplier,
effects for a regional economy. When directly affected businesses purchase inputs from the local supply
chain, this generates “indirect effects” or impacts, and when employees and owners of directly and indirectly
affected businesses spend their earnings inside the region, these are referred to as induced effects or impacts.
Expenditures by households and institutions/properties were not included in this analysis because much of
that spending is already included in the revenues of the other turfgrass sectors.
When the importance of an existing local industry is being considered, it is sometimes evaluated as a
contribution analysis, especially when the output is considered a necessity or unique for the regional

23
economy. In these cases, the evaluation is conceptually reframed in terms of the losses that would occur to
the economy if that particular industry or activity disappeared (Watson et al., 2007). In this case, a hybrid
approach was used to evaluate Florida’s turfgrass related industries. The sod farm sector was treated as a
contribution analysis, while the golf, landscape services, and retail sectors were handled more or less as
impact analyses. There are few substitutes for regionally grown sod as an input for home construction and
many other types of landscaping. The loss of this industry would likely result in sod being imported from
outside the state, or the value of real estate developments being reduced. With respect to the other turfgrass
sectors, there are numerous recreational substitutes for golf, and the demand for landscape services, and lawn
and garden goods could be satisfied by a variety of economic sectors. For these sectors, survey data was used
to allocate the share of total revenues that originated from within and outside the State to direct and
secondary economic impacts respectively.
Input-Output (I-O) analysis is a standard technique for measuring economic impacts for a regional economy
using input-output models. Input-output models are a system of mathematical equations specified to represent
the typical transactions that occur between industries, governments, employees, and households in such an
economy (Schaffer, 1999; Miller and Blair, 2009). The parameters in these models are estimated from detailed
business and demographic data collected by state and federal government agencies. From these models,
industry level economic multipliers can be calculated, and then used to estimate economic impacts.
The input-output models used to conduct this analysis were constructed with the the Impact Analysis for
Planning (IMPLAN®) system of software and regional databases (Minnesota IMPLAN Group). The
IMPLAN system can be used to construct I-O models of particular regional economies in the U.S., ranging
from individual counties to multiple states, and includes data and equations for over 460 different industry
sectors and social institutions. The IMPLAN models constructed for this analysis were based on 2008
economic data, the most recent available at the time.
IMPLAN has a range of settings and adjustments that can be used to customize I-O model construction. The
models constructed for this analysis were specified to include transactions between industries, households,
state and local governments, federal government, corporations, and capital. Domestic and foreign trade-
flows in the model were calculated using econometrically estimated regional purchase coefficients. When
both revenue and employment survey data were available, model parameters were adjusted to match these
data.
The types of economic impacts typically estimated with I-O models include output or gross revenues,
employment (fulltime and part-time jobs), and value-added, which includes labor income, other property
type income, and indirect business taxes. Each of these measures represents a different way of assessing the

24
size or contribution of a particular activity or event to a regional economy. Definitions of these types of
impacts or effects can be found in the glossary in Appendix A.
For economic impact analysis, it is important to distinguish between local and non-local revenues. Local
revenues typically represent simple transfers between individuals or businesses within an economy and do
not generate economic spin-off or multiplier effects. However, non-local revenues flowing into an economy
generate additional economic activity through the supply chain (indirect effects) and employee spending
(induced effects). A summary of the data and sectors used for the impact analyses are provided in Table 30.
Table 30. Florida turfgrass industry IMPLAN model inputs
Item Type
Golf
Courses
(NAICS
71391)
Lawn &
Garden
Retail Stores
(NAICS 444)
Landscape
Service
Vendors
(NAICS
5617)
Sod
Production
(NAICS
1114)
IMPLAN sector 410 323 388 6
Revenues (million $) Local 1,918.9 630.5 2,387.9
Non-local 816.1 123.4 21.9 320.0
Total 2,735.0 753.9 2,409.8 320.0
Employment (jobs) Local 35,211 8,649 564
Non-local 14,974 1,693 61,435 1,800
Total 50,185 10,342 61,999 1,800
NAICS: North American Industrial Classification System, www.census.gov/naics/2007/NAICOD07.htm
IMPLAN: www.implan.com
Golf Courses
Results from the industry survey, discussed in the previous section, showed that Florida golf courses generated
approximately $2.73 B in revenues in 2007, along with an estimated 50,185 jobs. On average, golf course respondents
indicated that 29.8 percent or $816 million of their revenues originated from out-of-state visitors or business. To
estimate the economic impacts of these revenues and jobs, $816 million was entered as revenues into sector 410 (Local
Amusement and Recreation Industries) of a 2008 IMPLAN model of the State of Florida. The remaining $1.92 B in
local revenues were entered into a separate IMPLAN event in which only the local-direct impacts were estimated.
Annual output (sales) per worker in the IMPLAN model was reduced from $133,054 to $54,497 and annual earnings
per worker were reduced from $29,178 to $11,611 to match industry survey findings. All other parameters for the
IMPLAN model were left at the settings described in the Impact Methods section.
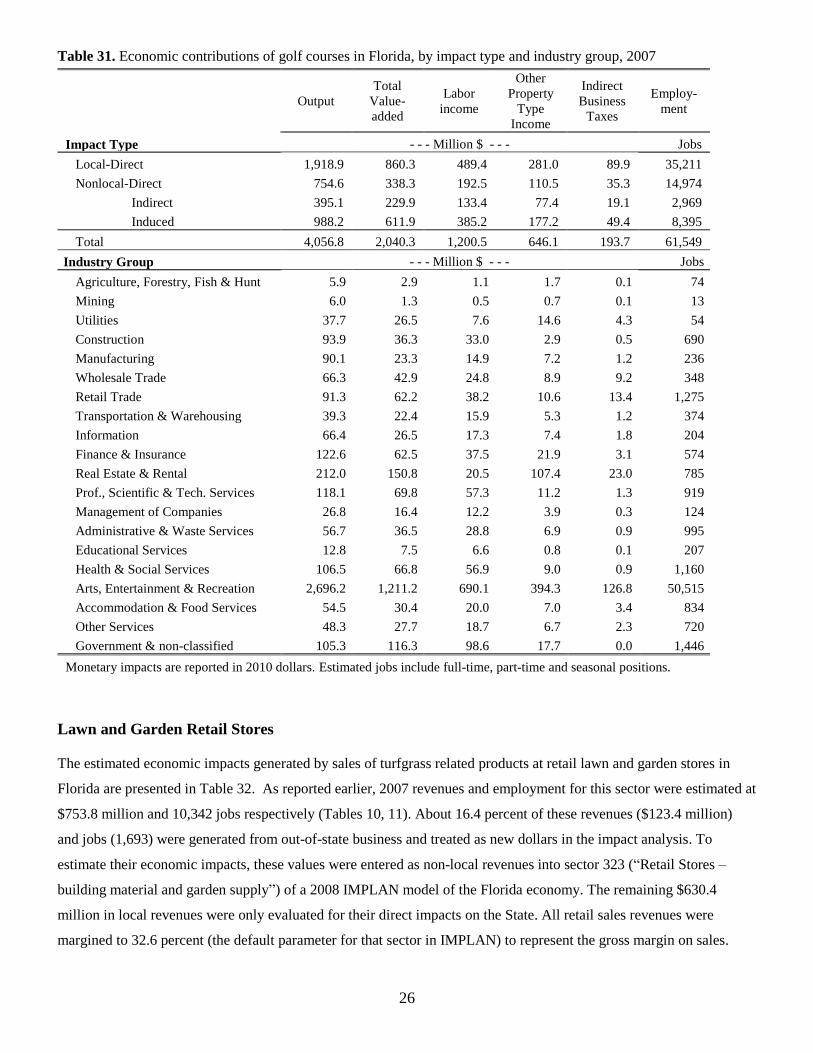
Estimated economic impacts of the Golf industry in 2007 are presented in Table 31, with local-direct, and non-local
direct, indirect, induced and total economic impacts shown in the rows of the top section of the table, and impacts for
20 aggregated sectors based on the North American Industry Classification System (NAICS) provided in the bottom
section of the table. Output, value added, labor Income, other property income, indirect business tax and employment
impacts are presented in table columns. Local-direct impacts are direct impacts generated by resident spending on golf

25
inside the State. The other impacts are the result of visitor spending, or new dollars, on the industry/economy, which
generate indirect and induced effects. All monetary impacts are reported in 2010 dollars.
Golf course revenues of $816 million in 2007 are equivalent to a direct output impact of $755 M in 2010 dollars,
because prices in this sector have been falling over time. Indirect output contributions were estimated at $395 million,
and induced output impacts were valued at $988 million. These impacts from nonlocal revenues summed with $1.92
billion in direct impacts from local revenues result in a total output impact of $4.06 billion for this sector in 2007
(Table 32). Value added represents the net income contribution to the economy, including labor income, other property
type income and indirect business taxes that are generated directly and indirectly by industry activity. Estimated total
value added impacts of Florida’s golf industry on the State in 2007 were $2.04 billion. The labor income impact,
representing earnings by employees and owners of businesses, was estimated at $1.20 billion. Other property type
income consists of rents, royalties, interest, dividends, and corporate profits, and was estimated at $646 million.
Indirect business tax impacts to state/local and federal governments, including excise, property and sales taxes,
business and licensing fees, but not income taxes, were estimated at $194 million. Employment contributions estimate
the number of full-time, part-time, and seasonal jobs that are created annually by an industry or activity. Total
Employment impacts of the golf industry on Florida in 2007 are estimated at 61,549 jobs (Table 31).
The distribution of economic impacts by golf courses across twenty aggregate industry groups in Florida is shown in
the bottom section of Table 31. Not unexpectedly, the largest impacts occurred in the aggregate sector “Arts,
Entertainment & Recreation” which includes golf courses. Impacts occurring in this group included employment of
50,515 jobs, labor income of $690 million, output of $2.70 billion and value added of $1.21 billion . The Real
Estate and Rental aggregate sector ranked second among industry impacts for output ($212 million), value-added
($151 million), other property type income ($107 million) and indirect business taxes ($23 million). Golf courses also
generated significant impacts in the government sector, with $116 million in value added, $99 million in labor income,
and 1,446 jobs (Table 31).
26
Table 31. Economic contributions of golf courses in Florida, by impact type and industry group, 2007
Output
Total
Value-
added
Labor
income
Other
Property
Type
Income
Indirect
Business
Taxes
Employ-
ment
Impact Type - - - Million $ - - - Jobs
Local-Direct 1,918.9 860.3 489.4 281.0 89.9 35,211
Nonlocal-Direct 754.6 338.3 192.5 110.5 35.3 14,974
Indirect 395.1 229.9 133.4 77.4 19.1 2,969
Induced 988.2 611.9 385.2 177.2 49.4 8,395
Total 4,056.8 2,040.3 1,200.5 646.1 193.7 61,549
Industry Group - - - Million $ - - - Jobs
Agriculture, Forestry, Fish & Hunt 5.9 2.9 1.1 1.7 0.1 74
Mining 6.0 1.3 0.5 0.7 0.1 13
Utilities 37.7 26.5 7.6 14.6 4.3 54
Construction 93.9 36.3 33.0 2.9 0.5 690
Manufacturing 90.1 23.3 14.9 7.2 1.2 236
Wholesale Trade 66.3 42.9 24.8 8.9 9.2 348
Retail Trade 91.3 62.2 38.2 10.6 13.4 1,275
Transportation & Warehousing 39.3 22.4 15.9 5.3 1.2 374
Information 66.4 26.5 17.3 7.4 1.8 204
Finance & Insurance 122.6 62.5 37.5 21.9 3.1 574
Real Estate & Rental 212.0 150.8 20.5 107.4 23.0 785
Prof., Scientific & Tech. Services 118.1 69.8 57.3 11.2 1.3 919
Management of Companies 26.8 16.4 12.2 3.9 0.3 124
Administrative & Waste Services 56.7 36.5 28.8 6.9 0.9 995
Educational Services 12.8 7.5 6.6 0.8 0.1 207
Health & Social Services 106.5 66.8 56.9 9.0 0.9 1,160
Arts, Entertainment & Recreation 2,696.2 1,211.2 690.1 394.3 126.8 50,515
Accommodation & Food Services 54.5 30.4 20.0 7.0 3.4 834
Other Services 48.3 27.7 18.7 6.7 2.3 720
Government & non-classified 105.3 116.3 98.6 17.7 0.0 1,446
Monetary impacts are reported in 2010 dollars. Estimated jobs include full-time, part-time and seasonal positions.
Lawn and Garden Retail Stores
The estimated economic impacts generated by sales of turfgrass related products at retail lawn and garden stores in
Florida are presented in Table 32. As reported earlier, 2007 revenues and employment for this sector were estimated at
$753.8 million and 10,342 jobs respectively (Tables 10, 11). About 16.4 percent of these revenues ($123.4 million)
and jobs (1,693) were generated from out-of-state business and treated as new dollars in the impact analysis. To
estimate their economic impacts, these values were entered as non-local revenues into sector 323 (“Retail Stores –
building material and garden supply”) of a 2008 IMPLAN model of the Florida economy. The remaining $630.4
million in local revenues were only evaluated for their direct impacts on the State. All retail sales revenues were
margined to 32.6 percent (the default parameter for that sector in IMPLAN) to represent the gross margin on sales.

27
Local-direct, and nonlocal Direct, Indirect, Induced, and Total economic impacts of turfgrass related sales by retail
lawn and gardens in 2007 are shown in the rows of the top section of the table, and impacts for 20 aggregated sectors
based on the North American Industry Classification System (NAICS) are provided in the bottom section. Output,
value added, labor income, other property income, indirect business taxes and employment impacts are presented in
the table columns. Local-direct impacts are direct impacts generated by resident spending at Florida lawn and garden
supply stores, while nonlocal-direct, indirect and induced impacts are the result of visitor spending or out-of-state
sales. All monetary impacts are in 2010 dollars.
Retail lawn and garden store impacts are dominated by direct effects because only 16.4 percent of industry revenues
were comprised of new dollars entering the state. Also, the industry does not generate large indirect impacts because a
substantial proportion of store inventories are purchased from outside Florida. In contrast, induced effects are large
relative to the nonlocal direct impact because retail stores tend to be more labor intensive and these types of employees
tend to spend a large proportion of their earnings locally. Total output impacts on the state in 2007 are estimated at
$335 million, with nearly two-thirds of this output impact ($215 million) occurring from local-direct effects. Induced
effects from nonlocal revenues were the next largest source of impacts at $64.4 million or 19.2 percent of the total.
The relatively small indirect impacts from nonlocal sales are again likely due to a low level of lawn and garden product
manufacturing in the state. Value added impacts totaled $218 million, including $135 million in labor income impacts,
$40 million in other property type income impacts, and $43 million in indirect business tax impacts. Employment
impacts totaled 10,994 jobs, with 94 percent occurring directly in the stores.
The distribution of impacts by retail lawn and garden stores across aggregate industry sectors is dominated
by those in its own sector (Retail Trade), with over 90 percent of indirect business taxes and employment
impacts occurring there, and about three-quarters of the output, value added and labor income impacts as
well. This is due both to the large proportion of local sales and the small amount of inventory that is
purchased within the State. Aggregate sectors for real estate and government also garnered a substantial
amount of impacts from retail lawn and garden stores, including $12 million in real estate output impacts and
112 jobs in government. Health and social services had labor income impacts of $3.7 million and
employment impacts of 75 jobs (Table 32).

28
Table 32. Economic contributions of retail lawn and garden stores in Florida, by impact type and industry group, 2007
Output
Total
Value-
added
Labor
income
Other
Property
Type
Income
Indirect
Business
Taxes
Employ-
ment
Impact Type - - - Million $ - - - Jobs
Local-Direct 215.3 142.1 87.6 21.7 32.8 8,649
Nonlocal-Direct 42.1 27.8 17.1 4.2 6.4 1,693
Indirect 12.9 7.7 4.4 2.7 0.6 94
Induced 64.4 40.7 25.9 11.6 3.2 559
Total 334.8 218.3 135.1 40.2 43.1 10,994
Industry Group - - - Million $ - - - Jobs
Agriculture, Forestry, Fisheries 0.3 0.1 0.1 0.1 0.0 3
Mining 0.2 0.0 0.0 0.0 0.0 1
Utilities 1.6 1.1 0.3 0.6 0.2 2
Construction 5.6 2.2 2.0 0.2 0.0 41
Manufacturing 4.9 1.3 0.8 0.4 0.1 12
Wholesale Trade 3.6 2.3 1.3 0.5 0.5 19
Retail Trade 263.2 173.8 107.1 26.6 40.1 10,422
Transportation & Warehousing 2.4 1.5 1.0 0.4 0.1 25
Information 3.8 1.5 1.0 0.4 0.1 12
Finance & Insurance 6.3 3.3 1.9 1.2 0.1 30
Real Estate & Rental 11.8 8.4 1.0 6.1 1.3 38
Prof., Scientific & Tech. Services 5.7 3.4 2.8 0.5 0.1 45
Management of Companies 0.9 0.6 0.4 0.1 0.0 4
Administrative & Waste Services 2.6 1.7 1.3 0.4 0.0 44
Educational Services 0.7 0.4 0.4 0.0 0.0 12
Health & Social Services 6.9 4.3 3.7 0.6 0.1 75
Arts, Entertainment & Recreation 1.1 0.6 0.3 0.2 0.1 11
Accommodation & Food Services 3.0 1.7 1.1 0.4 0.2 46
Other Services 2.6 1.4 1.0 0.3 0.1 42
Government & non-classified 7.6 8.7 7.5 1.2 0.0 112
Monetary impacts are reported in 2010 dollars. Estimated jobs include full-time, part-time and seasonal positions.
Landscape Service Vendors
From the survey it was determined that landscape service vendors in Florida generated an estimated $2.41 billion in
revenues and 61,999 jobs from turfgrass related activities during 2007 (Tables 15, 16). Only 0.91 percent of these
revenues and jobs resulted from nonlocal business and generated new dollars for the state. Impact analysis for this
sector was accomplished by applying $2.39 billion in local sales and $21.9 million in nonlocal sales to IMPLAN
sector number 388 (“Services to Buildings and Dwellings”). All IMPLAN modeling parameters were left at their
default settings.
Local-direct, nonlocal-direct, indirect, induced and total economic impacts of landscape service vendors to the Florida
economy are presented in the top part of Table 33, and impacts for 20 aggregated sectors based on the North American
Industry Classification System (NAICS) are provided in the bottom section. Output, value added, labor income, other
29
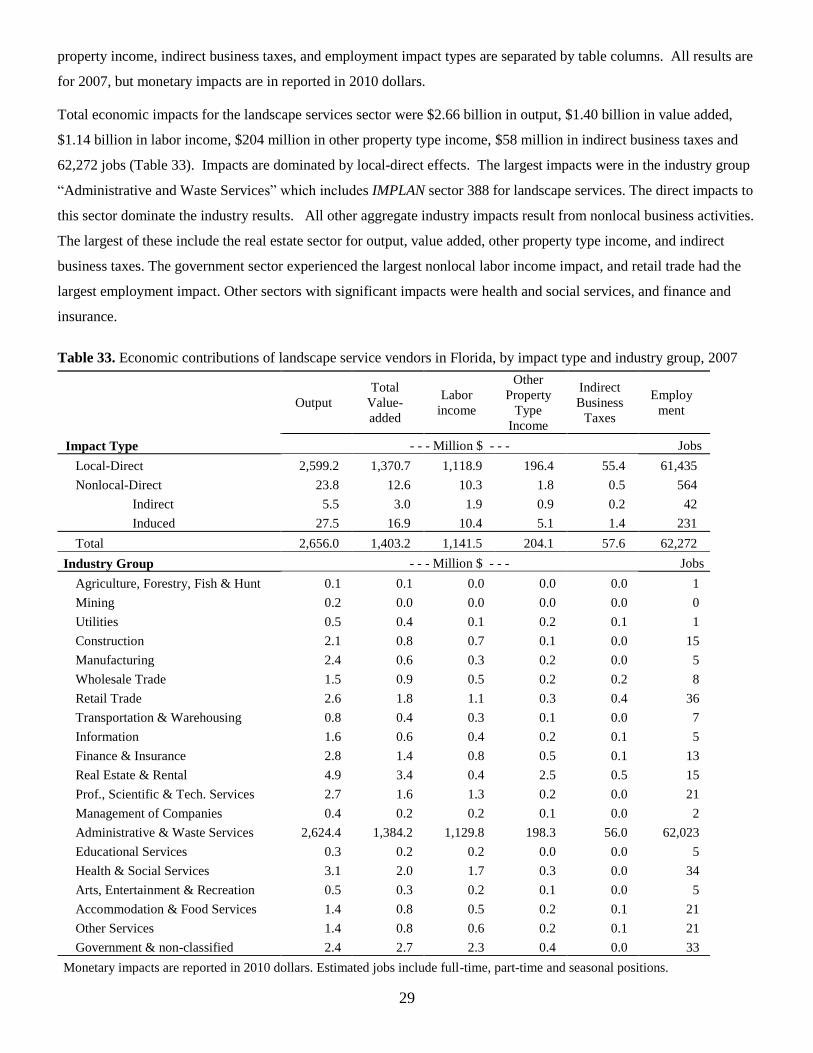
property income, indirect business taxes, and employment impact types are separated by table columns. All results are
for 2007, but monetary impacts are in reported in 2010 dollars.
Total economic impacts for the landscape services sector were $2.66 billion in output, $1.40 billion in value added,
$1.14 billion in labor income, $204 million in other property type income, $58 million in indirect business taxes and
62,272 jobs (Table 33). Impacts are dominated by local-direct effects. The largest impacts were in the industry group
“Administrative and Waste Services” which includes IMPLAN sector 388 for landscape services. The direct impacts to
this sector dominate the industry results. All other aggregate industry impacts result from nonlocal business activities.
The largest of these include the real estate sector for output, value added, other property type income, and indirect
business taxes. The government sector experienced the largest nonlocal labor income impact, and retail trade had the
largest employment impact. Other sectors with significant impacts were health and social services, and finance and
insurance.
Table 33. Economic contributions of landscape service vendors in Florida, by impact type and industry group, 2007
Output
Total
Value-
added
Labor
income
Other
Property
Type
Income
Indirect
Business
Taxes
Employ
ment
Impact Type - - - Million $ - - - Jobs
Local-Direct 2,599.2 1,370.7 1,118.9 196.4 55.4 61,435
Nonlocal-Direct 23.8 12.6 10.3 1.8 0.5 564
Indirect 5.5 3.0 1.9 0.9 0.2 42
Induced 27.5 16.9 10.4 5.1 1.4 231
Total 2,656.0 1,403.2 1,141.5 204.1 57.6 62,272
Industry Group - - - Million $ - - - Jobs
Agriculture, Forestry, Fish & Hunt 0.1 0.1 0.0 0.0 0.0 1
Mining 0.2 0.0 0.0 0.0 0.0 0
Utilities 0.5 0.4 0.1 0.2 0.1 1
Construction 2.1 0.8 0.7 0.1 0.0 15
Manufacturing 2.4 0.6 0.3 0.2 0.0 5
Wholesale Trade 1.5 0.9 0.5 0.2 0.2 8
Retail Trade 2.6 1.8 1.1 0.3 0.4 36
Transportation & Warehousing 0.8 0.4 0.3 0.1 0.0 7
Information 1.6 0.6 0.4 0.2 0.1 5
Finance & Insurance 2.8 1.4 0.8 0.5 0.1 13
Real Estate & Rental 4.9 3.4 0.4 2.5 0.5 15
Prof., Scientific & Tech. Services 2.7 1.6 1.3 0.2 0.0 21
Management of Companies 0.4 0.2 0.2 0.1 0.0 2
Administrative & Waste Services 2,624.4 1,384.2 1,129.8 198.3 56.0 62,023
Educational Services 0.3 0.2 0.2 0.0 0.0 5
Health & Social Services 3.1 2.0 1.7 0.3 0.0 34
Arts, Entertainment & Recreation 0.5 0.3 0.2 0.1 0.0 5
Accommodation & Food Services 1.4 0.8 0.5 0.2 0.1 21
Other Services 1.4 0.8 0.6 0.2 0.1 21
Government & non-classified 2.4 2.7 2.3 0.4 0.0 33
Monetary impacts are reported in 2010 dollars. Estimated jobs include full-time, part-time and seasonal positions.

30
Sod Farms
Because sod is a unique product for Florida it was evaluated as an economic contribution with no distinctions made for
the geographic source of its revenues. In this case, multipliers were applied to 100 percent of sod industry revenues to
estimate its direct, indirect and induced effects. Specifically, $320 million in 2007 estimated revenues and employment
of 1,800 jobs were entered into sector 6 (“Greenhouse, Nursery and Floriculture Production”) of the IMPLAN model
for Florida. The regional purchase coefficient for IMPLAN sector six was set to zero in order to block all purchases
from Sector 6 by other industries in the model to avoid double counting of sales (Steinback, 2004). All other
parameters for the IMPLAN model were left at their default settings.
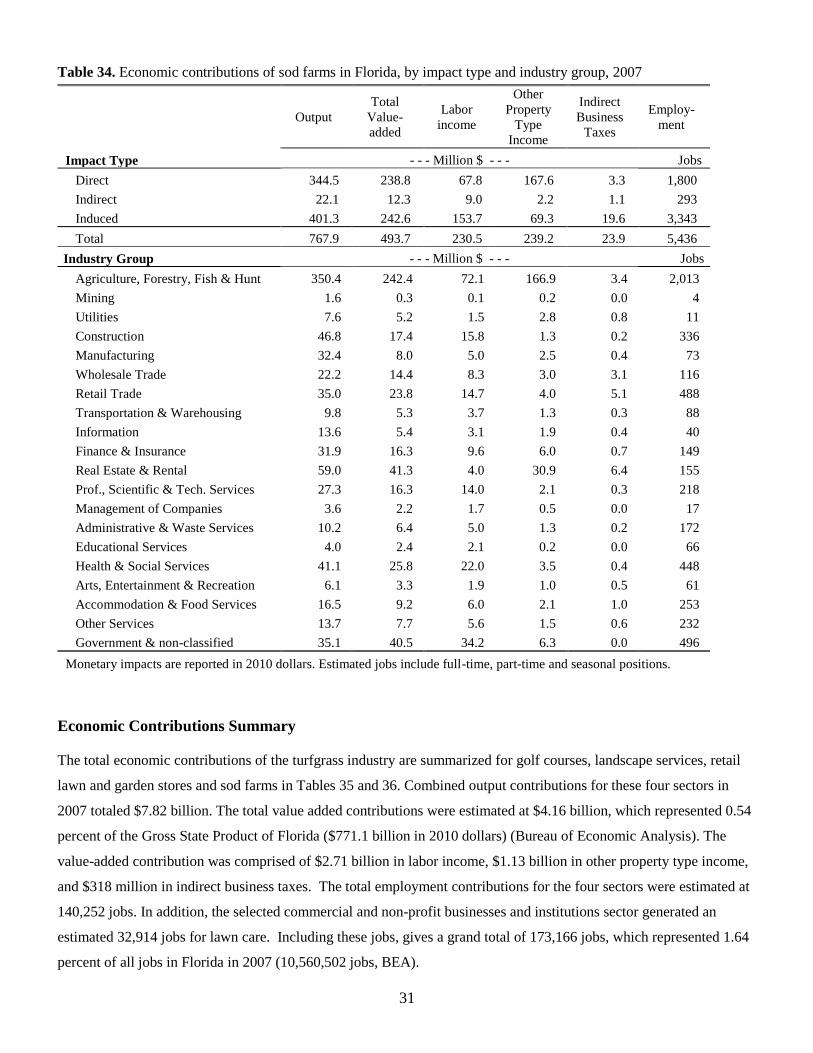
Results of the impact analysis for sod farms are presented in Table 34, with direct, indirect, induced and total economic
contributions appearing in the top section, and contributions for 20 aggregated industry groups defined according to
the North American Industry Classification System (NAICS) provided in the bottom section. Impact measures for
output, value added, labor income, other property type income, indirect business taxes, and employment are shown in
the table columns. All monetary values are in 2010 dollars.
Total output contributions of Florida sod farms in 2007 are estimated at $768 million for 2007, including direct output
(sales) of $345 million (in 2010 dollars), indirect output of $22 million, and induced output of $401 million. Indirect
contributions are relatively small for this sector because only about 15 percent of the production expenses for sod are
comprised of intermediate inputs. Value added contributions to the state’s economy in 2007 were $494 million,
including labor income of $231 million, other property type income of $239 million, and indirect business taxes of
$23.9 million. A total of 5,436 jobs are estimated to have been created in Florida through the direct, indirect and
induced effects of sod farms in 2007 (Table 34).
Not surprisingly, the agriculture industry group captured the largest share of total sod farm contributions for most
impact measures, including $345 million (46%) of output, $239 million (49%) of the value added, $167 million (70%)
in other property type income, 1,800 jobs (37%). The real estate industry group experienced the largest indirect
business tax contribution from sod farms ($6.4 million) and the second largest contributions for output ($59 million),
value added ($41 million) and other property income ($31 million). The government sector showed the second largest
labor income ($34 million) and employment (496 jobs) contributions. The retail trade group had second largest
indirect business taxes contributions of $5.1 million (Table 34).
31
Table 34. Economic contributions of sod farms in Florida, by impact type and industry group, 2007
Output
Total
Value-
added
Labor
income
Other
Property
Type
Income
Indirect
Business
Taxes
Employ-
ment
Impact Type - - - Million $ - - - Jobs
Direct 344.5 238.8 67.8 167.6 3.3 1,800
Indirect 22.1 12.3 9.0 2.2 1.1 293
Induced 401.3 242.6 153.7 69.3 19.6 3,343
Total 767.9 493.7 230.5 239.2 23.9 5,436
Industry Group - - - Million $ - - - Jobs
Agriculture, Forestry, Fish & Hunt 350.4 242.4 72.1 166.9 3.4 2,013
Mining 1.6 0.3 0.1 0.2 0.0 4
Utilities 7.6 5.2 1.5 2.8 0.8 11
Construction 46.8 17.4 15.8 1.3 0.2 336
Manufacturing 32.4 8.0 5.0 2.5 0.4 73
Wholesale Trade 22.2 14.4 8.3 3.0 3.1 116
Retail Trade 35.0 23.8 14.7 4.0 5.1 488
Transportation & Warehousing 9.8 5.3 3.7 1.3 0.3 88
Information 13.6 5.4 3.1 1.9 0.4 40
Finance & Insurance 31.9 16.3 9.6 6.0 0.7 149
Real Estate & Rental 59.0 41.3 4.0 30.9 6.4 155
Prof., Scientific & Tech. Services 27.3 16.3 14.0 2.1 0.3 218
Management of Companies 3.6 2.2 1.7 0.5 0.0 17
Administrative & Waste Services 10.2 6.4 5.0 1.3 0.2 172
Educational Services 4.0 2.4 2.1 0.2 0.0 66
Health & Social Services 41.1 25.8 22.0 3.5 0.4 448
Arts, Entertainment & Recreation 6.1 3.3 1.9 1.0 0.5 61
Accommodation & Food Services 16.5 9.2 6.0 2.1 1.0 253
Other Services 13.7 7.7 5.6 1.5 0.6 232
Government & non-classified 35.1 40.5 34.2 6.3 0.0 496
Monetary impacts are reported in 2010 dollars. Estimated jobs include full-time, part-time and seasonal positions.
Economic Contributions Summary
The total economic contributions of the turfgrass industry are summarized for golf courses, landscape services, retail
lawn and garden stores and sod farms in Tables 35 and 36. Combined output contributions for these four sectors in
2007 totaled $7.82 billion. The total value added contributions were estimated at $4.16 billion, which represented 0.54
percent of the Gross State Product of Florida ($771.1 billion in 2010 dollars) (Bureau of Economic Analysis). The
value-added contribution was comprised of $2.71 billion in labor income, $1.13 billion in other property type income,
and $318 million in indirect business taxes. The total employment contributions for the four sectors were estimated at
140,252 jobs. In addition, the selected commercial and non-profit businesses and institutions sector generated an
estimated 32,914 jobs for lawn care. Including these jobs, gives a grand total of 173,166 jobs, which represented 1.64
percent of all jobs in Florida in 2007 (10,560,502 jobs, BEA).
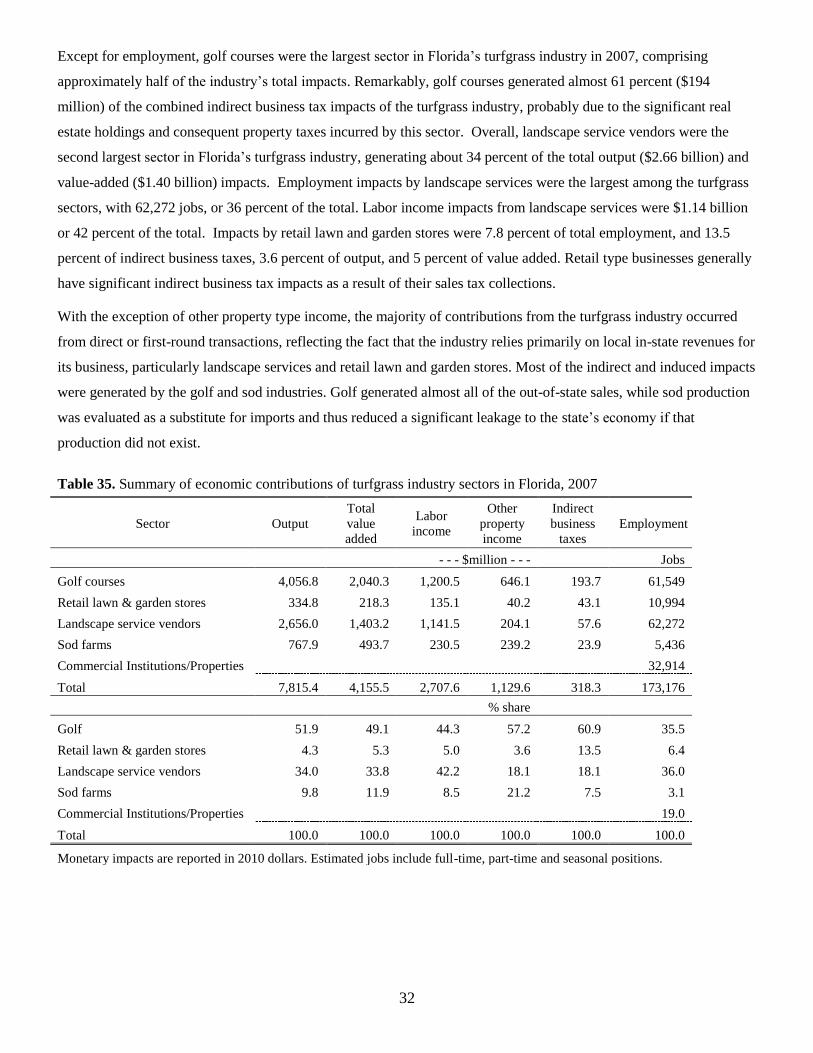
32
Except for employment, golf courses were the largest sector in Florida’s turfgrass industry in 2007, comprising
approximately half of the industry’s total impacts. Remarkably, golf courses generated almost 61 percent ($194
million) of the combined indirect business tax impacts of the turfgrass industry, probably due to the significant real
estate holdings and consequent property taxes incurred by this sector. Overall, landscape service vendors were the
second largest sector in Florida’s turfgrass industry, generating about 34 percent of the total output ($2.66 billion) and
value-added ($1.40 billion) impacts. Employment impacts by landscape services were the largest among the turfgrass
sectors, with 62,272 jobs, or 36 percent of the total. Labor income impacts from landscape services were $1.14 billion
or 42 percent of the total. Impacts by retail lawn and garden stores were 7.8 percent of total employment, and 13.5
percent of indirect business taxes, 3.6 percent of output, and 5 percent of value added. Retail type businesses generally
have significant indirect business tax impacts as a result of their sales tax collections.
With the exception of other property type income, the majority of contributions from the turfgrass industry occurred
from direct or first-round transactions, reflecting the fact that the industry relies primarily on local in-state revenues for
its business, particularly landscape services and retail lawn and garden stores. Most of the indirect and induced impacts
were generated by the golf and sod industries. Golf generated almost all of the out-of-state sales, while sod production
was evaluated as a substitute for imports and thus reduced a significant leakage to the state’s economy if that
production did not exist.
Table 35. Summary of economic contributions of turfgrass industry sectors in Florida, 2007
Sector Output
Total
value
added
Labor
income
Other
property
income
Indirect
business
taxes
Employment
- - - $million - - - Jobs
Golf courses 4,056.8 2,040.3 1,200.5 646.1 193.7 61,549
Retail lawn & garden stores 334.8 218.3 135.1 40.2 43.1 10,994
Landscape service vendors 2,656.0 1,403.2 1,141.5 204.1 57.6 62,272
Sod farms 767.9 493.7 230.5 239.2 23.9 5,436
Commercial Institutions/Properties 32,914
Total 7,815.4 4,155.5 2,707.6 1,129.6 318.3 173,176
% share
Golf 51.9 49.1 44.3 57.2 60.9 35.5
Retail lawn & garden stores 4.3 5.3 5.0 3.6 13.5 6.4
Landscape service vendors 34.0 33.8 42.2 18.1 18.1 36.0
Sod farms 9.8 11.9 8.5 21.2 7.5 3.1
Commercial Institutions/Properties 19.0
Total 100.0 100.0 100.0 100.0 100.0 100.0
Monetary impacts are reported in 2010 dollars. Estimated jobs include full-time, part-time and seasonal positions.

33
Table 36. Summary of economic contributions of the turfgrass industry in Florida, by impact type and industry group,
2007
Output
Total
Value-
added
Labor
income
Other
Property
Type
Income
Indirect
Business
Taxes
Employment
Impact Type - - - Million $ - - - Jobs
Local-direct 4,733.4 2,373.1 1,695.9 499.1 178.1 105,295
Nonlocal-Direct 1,165.1 617.4 287.7 284.2 45.6 19,031
Indirect 435.6 252.9 148.7 83.2 20.9 3,397
Induced 1,481.3 912.1 575.3 263.2 73.6 12,528
Total 7,815.4 4,155.5 2,707.6 1,129.6 318.3 140,252
Industry Group - - - Million $ 1 - - - Jobs
2
Agriculture, Forestry, Fish & Hunt 356.7 245.5 73.3 168.7 3.5 2,091
Mining 8.0 1.7 0.7 0.9 0.2 17
Utilities 47.4 33.2 9.6 18.3 5.3 68
Construction 148.3 56.6 51.5 4.4 0.7 1,083
Manufacturing 129.8 33.1 21.1 10.3 1.7 327
Wholesale Trade 93.5 60.6 35.0 12.6 12.9 491
Retail Trade 392.1 261.7 161.1 41.5 59.1 12,221
Transportation & Warehousing 52.3 29.6 20.9 7.2 1.5 494
Information 85.4 34.1 21.8 9.9 2.4 261
Finance & Insurance 163.6 83.5 49.9 29.6 4.0 766
Real Estate & Rental 287.7 203.9 25.9 146.8 31.2 992
Prof., Scientific & Tech. Services 153.8 91.2 75.4 14.0 1.7 1,202
Management of Companies 31.8 19.4 14.5 4.6 0.3 146
Administrative & Waste Services 2,693.9 1,428.8 1,164.9 206.9 57.0 63,234
Educational Services 17.8 10.4 9.3 1.0 0.1 290
Health & Social Services 157.6 98.9 84.2 13.3 1.4 1,716
Arts, Entertainment & Recreation 2,703.9 1,215.3 692.5 395.5 127.3 50,593
Accommodation & Food Services 75.3 42.1 27.6 9.7 4.7 1,155
Other Services 66.0 37.6 25.9 8.7 3.1 1,016
Government & non-classified 150.4 168.3 142.6 25.7 0.0 2,087
Monetary impacts are reported in 2010 dollars. Estimated jobs include full-time, part-time and seasonal positions.

34
Literature and Information Sources Cited
Bureau of Economic and Business Research – Survey Research Program, University of Florida, 221 Matherly Hall,
Gainesville, FL, www.bebr.ufl.edu
Haydu, John J., Alan W. Hodges, and Charles R. Hall. Economic impacts of the turfgrass and lawncare industry in the
United States. Extension publication FE632, University of Florida, Institute of Food and Agricultural Sciences, 39
pages, Mar. 2006, available at http://edis.ifas.ufl.edu/fe632
Hodges, Alan W., John Haydu, P.J. van Blokland and Alden Bell. Contribution of the turfgrass industry to Florida’s
economy, 1991/92: a value added approach. Economics Report ER94-1, University of Florida, Food and Resource
Economics Department , 83 pages, Dec. 1994.
Miller, R. E, and P. D. Blair. Input-Output Analysis: Foundations and Extensions, 2nd edition, Cambridge University
Press, 2009.
Minnesota IMPLAN Group, Inc., IMPLAN, version 3, Economic impact assessment software and data for Florida
counties. Stillwater, MN, Oct. 2009. www.implan.com
OneSource Information Services, Inc. Business directory. 300 Baker Ave., Concord, MA 01742 www.onesource.com
Satterthwaite, L.N., A.W. Hodges, J.J. Haydu and J.L. Cisar. An agronomic and economic profile of Florida’s sod
industry in 2007. University of Florida, Institute of Food and Agricultural Sciences, 2009.
www.economicimpact.ifas.ufl.edu/publications/sod2007.pdf
Schaffer, William A. Regional Impact Models, Web Book of Regional Science, West Virginia University, Regional
Research Institute. www.rri.wvu.edu/WebBook/Schaffer/index.html
Steinback, S. Using Ready-made Regional Input-Output Models to Estimate Backward-linkage Effects of Exogenous
Output Shocks. Review of Regional Studies, 34 (1): 57–71 (2004).
http://www.economy.okstate.edu/rrs/issue.asp?volume=34&issue=1
U.S. Department of Commerce, Bureau of Economic Analysis (BEA), Regional Economic Accounts, Gross Domestic
Product by State. http://www.bea.gov/regional/gsp/
U.S. Department of Commerce, Bureau of Economic Analysis (BEA), Regional Economic Accounts, State Annual
Personal Income. http://www.bea.gov/regional/spi/
U.S. Department of Commerce, Census Bureau. Annual Estimates of Housing Units for the United States and States:
April 1, 2000 to July 1, 2009 (HU-EST2009-01), www.census.gov/popest/housing/HU-EST2009.html
U.S. Department of Commerce, Census Bureau. Census of Housing, Historical Census of Housing Tables: Units in
Structure. www.census.gov/hhes/www/housing/census/historic/units.html
Watson, P., J. Wilson, D. Thilmany, and S. Winter. 2007. Determining economic contributions and impacts: What is
the difference and why do we care? Journal of Regional Analysis and Policy 37 (2): 140–146. http://www.jrap-
journal.org/pastvolumes/2000/v37/F37-2-6.pdf

35
Appendix A: Glossary of Regional Economic Terminology
Direct effects/impacts: Direct impacts, represent the revenues, value-added, income, or jobs that result directly from
an economic activity within a regional economy.
Employment or Jobs: Represents the total numbers of wage and salaried employees as well as self-employed jobs.
This includes full-time, part-time and seasonal workers measured in annual average jobs.
Indirect Business Taxes: Include sales, excise, and property taxes as well as fees and licenses paid by businesses
during normal operations. It does not include taxes on profits or income.
Indirect effects/impacts: Indirect effects occur when businesses use revenues originating from outside the region, or
study area, to purchase inputs (goods and services) from local suppliers. This secondary, or indirect business,
generates additional revenues, income, jobs and taxes for the area economy.
Induced effects/impacts: Induced effects or impacts occur when new dollars, originating from outside the study area,
are introduced into the local economy. Induced economic impacts occur as the households of business owners and
employees spend their earnings from these enterprises to purchase consumer goods and services from other
businesses within the region. This induced effect generates additional revenues, income, jobs and taxes for the
area economy.
Input-Output (I-O) Analysis: The use of input-output models to estimate how revenues or employment for one or
more particular industries, businesses or activities in a regional economy impact other businesses and institutions
in that region, and the regional as a whole.
Input-Output (I-O) Models: A mathematical representation of economic activity within a defined region using inter-
industry transaction tables or matrices where the outputs of various industries are used as inputs by those same
industries and other industries as well.
Labor Income: All forms of employment compensation, including employee wages and salaries, and proprietor
income or profits.
Local revenues/expenditures: Local revenues or spending represent simple transfers between individuals or
businesses within a regional economy. These transactions do not generate economic spin-off or multiplier
(indirect and induced) effects.
Margins: Represent the differences between retail, wholesale, distributor and producers prices. IMPLAN I-O models
are calibrated in producer prices. Thus, retail merchandize sales are generally margined to accurately reflect net
revenues for the local economy.
Non-local or “New” revenues/expenditures: When outside or new revenues flow into a local economy either from
the sale of locally produced goods and services to points outside the study area, or from expenditures by non-local
visitors to the study area, additional economic repercussions occur through indirect and induced (multiplier)
effects.
Other Property Type Income: Income in the form of rents, royalties, interest, dividends, and corporate profits.
Output: Revenues or sales associated with an industry or economic activity.
Total Impacts: The sum of direct, indirect and induced effects or economic impacts.
Value-added: Includes wages and salaries, interest, rent, profits, and indirect taxes paid by businesses. Total Value-
added across all industries is equivalent to Gross Regional Product.

36
Appendix B: Survey Questionnaires
General Greeting and Introduction
[Greeting read by interviewer]:
Hello, my name is ____________. I’m calling from the University of Florida. We are conducting a survey about turfgrass products
and lawn maintenance services. May I speak to the person in charge of the business (household)?
[Continue when appropriate person is available].
Hello, my name is ____________. I’m calling from the University of Florida. We are conducting a survey about the economic impact
of turfgrass products and lawn maintenance services on behalf of the Florida Turfgrass Association. The survey takes only 5 minutes
or less. All responses will be kept strictly confidential, and information will only be published in summary form. There is no
compensation for the survey, but your participation is greatly appreciated. Do you agree to participate in this survey?
[If respondent consents, continue questionnaire; if refused terminate interview]
Thank you very much for your willingness to participate!
Qualifying Question. Was your business involved in providing turfgrass related products or lawn maintenance services in 2007?
(yes/no)
[Continue if answer is affirmative; terminate interview if negative]
Respondent position. What is your position in the company (household)? (choose from list)
Owner
Manager
Employee
Type of business. Confirm the type of business [choose from list]
Lawn and garden retail store
Landscape service vendor
Golf course
Commercial, non-profit or government institution
Homeowner
[Branch to appropriate sub-questionnaire based on answer above]
Lawn and Garden Retail Stores
Lawn Products Mix. What was the share of your company’s total sales in 2007 for each of the following product types? (%):
Turfgrass sod or grass seed
Fertilizer
Soil amendments
Agricultural chemicals (fungicides, insecticides, herbicides)
Irrigation or turf care equipment
Sporting Goods
Other goods (specify)
Lawn Market Sales. What was the share of your company’s total sales in 2007 specifically for lawn-related use? (%)
Markets. What share of your company’s lawn-related product sales in 2007 were to each of the following market segments? (%):
Wholesale distributors
Growers
Other retailers
Landscape contractors
Lawn maintenance firms
Non-profit or Government Institutions (e.g. schools)
Homeowners
Others (specify)
Non-Local Sales. What share of your company's lawn-related sales in 2007 were to customers outside Florida? (%)
Non-Local Purchases. What share of your horticultural goods for sale were purchased from vendors outside of Florida? (%)
Employment. On average, how many fulltime and part-time employees and contract workers did your company have in 2007?
(number)
Fulltime employees
Part-time employees
Contract workers
Revenues. What were your company’s total revenues in 2007, given either as an actual amount or a range of values.
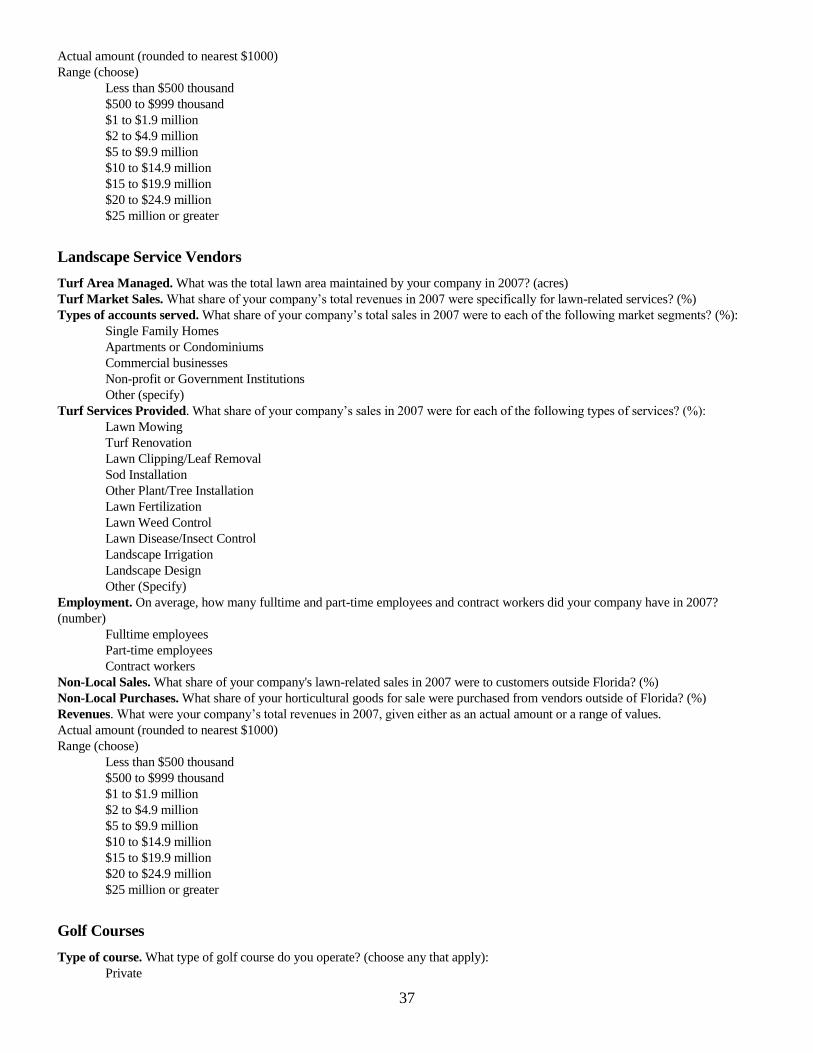
37
Actual amount (rounded to nearest $1000)
Range (choose)
Less than $500 thousand
$500 to $999 thousand
$1 to $1.9 million
$2 to $4.9 million
$5 to $9.9 million
$10 to $14.9 million
$15 to $19.9 million
$20 to $24.9 million
$25 million or greater
Landscape Service Vendors
Turf Area Managed. What was the total lawn area maintained by your company in 2007? (acres)
Turf Market Sales. What share of your company’s total revenues in 2007 were specifically for lawn-related services? (%)
Types of accounts served. What share of your company’s total sales in 2007 were to each of the following market segments? (%):
Single Family Homes
Apartments or Condominiums
Commercial businesses
Non-profit or Government Institutions
Other (specify)
Turf Services Provided. What share of your company’s sales in 2007 were for each of the following types of services? (%):
Lawn Mowing
Turf Renovation
Lawn Clipping/Leaf Removal
Sod Installation
Other Plant/Tree Installation
Lawn Fertilization
Lawn Weed Control
Lawn Disease/Insect Control
Landscape Irrigation
Landscape Design
Other (Specify)
Employment. On average, how many fulltime and part-time employees and contract workers did your company have in 2007?
(number)
Fulltime employees
Part-time employees
Contract workers
Non-Local Sales. What share of your company's lawn-related sales in 2007 were to customers outside Florida? (%)
Non-Local Purchases. What share of your horticultural goods for sale were purchased from vendors outside of Florida? (%)
Revenues. What were your company’s total revenues in 2007, given either as an actual amount or a range of values.
Actual amount (rounded to nearest $1000)
Range (choose)
Less than $500 thousand
$500 to $999 thousand
$1 to $1.9 million
$2 to $4.9 million
$5 to $9.9 million
$10 to $14.9 million
$15 to $19.9 million
$20 to $24.9 million
$25 million or greater
Golf Courses
Type of course. What type of golf course do you operate? (choose any that apply):
Private

38
Semi-Private
Resort
Public
Municipal
Military
Other (specify)
Number of golf holes. How many golf holes were on your course in 2007? (9, 18, 27, 36+)
Turf area. What was the total turfgrass area maintained by this course in 2007? (acres)
Irrigated Turf Area. What was the total irrigated area of this golf course in 2007? (acres or % of total turf area)
Golf Play. What was the total number of golf rounds played on your course in 2007? (number)
Non-Local Golf Play. What was the share of total golf play on your course in 2007 by out of state visitors, i.e. Florida nonresidents?
(%)
Non-Local Sales. What share of your company's sales in 2007 were to customers outside Florida? (%)
Non-Local Purchases. What share of goods and services for course operations were purchased from vendors outside of Florida? (%)
Employment. On average, how many fulltime and part-time employees and contract workers did your company have in 2007?
(number)
Fulltime employees
Part-time employees
Contract workers
Business Activities. What share of total company revenues in 2007 were from each of the following business activities? (%):
Golf play
Other recreation (e.g. swimming, tennis)
Retail sales (e.g. pro shop)
Food and beverage services
Lodging
Other (specify)
Revenues. What were your company’s total revenues in 2007, given either as an actual amount or a range of values.
Actual amount (rounded to nearest $1000)
Range (choose)
Less than $500 thousand
$500 to $999 thousand
$1 to $1.9 million
$2 to $4.9 million
$5 to $9.9 million
$10 to $14.9 million
$15 to $19.9 million
$20 to $24.9 million
$25 million or greater
Commercial, Non-Profit, Government Institutions Buildings/Grounds
Turf Area. What was the total lawn area maintained by this institution in 2007? (acres or sq. ft.)
Irrigated Area. What was the total irrigated landscape area maintained by this institution in 2007? (acres or % of total turf area)
Employment. On average, how many fulltime and part-time employees and contract workers did your company have for lawn and
landscape maintenance in 2007? (number)
Fulltime employees
Part-time employees
Contract workers
Turf Management Practices. Which of the following lawn care practices are conducted on your property? (choose any that apply):
Lawn Mowing
Lawn Fertilization
Lawn Weed Control
Lawn Disease/Insect Control
Irrigation
Soil Testing
Turf Renovation
Lawn Clipping/Leaf Removal
Sod Installation

39
Non-Local Purchases. What share of your goods and services for lawn maintenance were purchased from vendors outside of
Florida? (%)
Landscape Budget. What was the total expense for landscape and lawn maintenance on your property in 2007, either as an actual
amount or a range of values?
Actual amount (rounded to nearest $1000)
Range (choose)
Less than $500
$500 to $999
$1,000 to $1,999
$2,000 to $4,999
$5,000 to $9,999
$10,000 or greater
Homeowners
Type of Place. Is your home in and urban, suburban or rural area? (choose Urban, Suburban, Rural)
Turf Area. What is the total area of lawn maintained at this location? (acres or sq. ft, or dimensions-length x width).
Irrigated Area. What share of your landscaped area is irrigated? (%)
Lawn Care Agent. Who takes care of the lawn at your property? (choose any):
Family members
Friend or neighbor
Landscape service company
Employee
Other (specify)
Turf Management Practices. Which of the following lawn care practices are conducted on your property? (choose any that apply):
Lawn Mowing
Lawn Fertilization
Lawn Weed Control
Lawn Disease/Insect Control
Irrigation
Soil Testing
Turf Renovation
Lawn Clipping/Leaf Removal
Sod Installation
Landscape Budget. What was the total expense for landscape and lawn maintenance on your property in 2007, either as an actual
amount or a range of values?
Actual amount (rounded to nearest $1000)
Range (choose)
Less than $500
$500 to $999
$1,000 to $1,999
$2,000 to $4,999
$5,000 to $9,999
$10,000 or greater