Embed Size (px)
Citation preview

Economic Impact of Tourism in Connecticut, 2017

1) Key findings

| Tourism Economics 3
Key facts about Connecticut’s tourism sector
Visitor spending rose 3.6% in 2017 to $9.3 billion
Tourism supports 5.3% of all jobs in Connecticut
Tourism in Connecticut generated $960 million in state and local taxes alone in 2017
Tourism spending $9,294Total business sales $15,493Employment sustained by tourism 123,521Income sustained by tourism $5,441Taxes sustained by tourism $2,183
Federal $1,224State $546Local $413
Source: Tourism Economics
Key indicators in Connecticut 2017
Dollar figures in millions
Report Overview

2) Visitation Spending
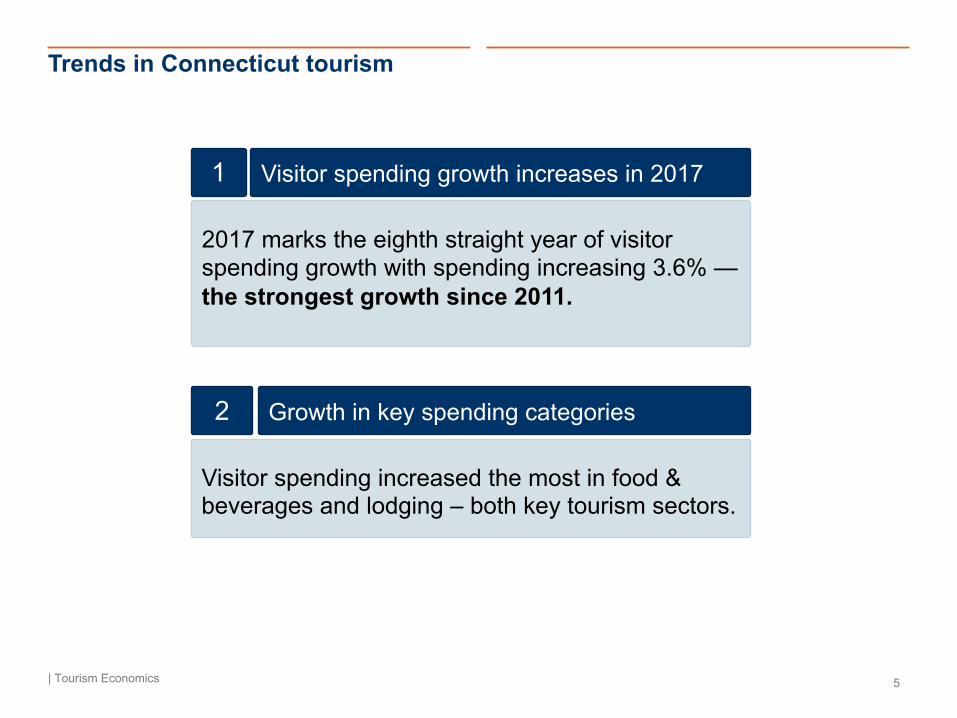
Trends in Connecticut tourism
| Tourism Economics 5
Visitor spending increased the most in food & beverages and lodging – both key tourism sectors.
Growth in key spending categories2
2017 marks the eighth straight year of visitor spending growth with spending increasing 3.6% —the strongest growth since 2011.
Visitor spending growth increases in 20171

Results are subject to revision
| Tourism Economics
Current year results should be considered to be preliminary.
The economic impact of tourism in Connecticut analysis uses several different data sources including consumer survey data from Longwoods International, tax data, and employment and wage data. At the time of publication, current year results should be considered to be preliminary as many of these sources get revised before being considered final.

Visitor spending growth
| Tourism Economics 7
Visitor spending increased 3.6% in 2017, the strongest rate of increase in Connecticut since 2011.
$8.3
$8.5
$8.7
$9.0
$9.3
2.2%
2.9% 3.0%
3.6%
0.0%
1.0%
2.0%
3.0%
4.0%
5.0%
$7.6
$7.8
$8.0
$8.2
$8.4
$8.6
$8.8
$9.0
$9.2
$9.4
2013 2014 2015 2016 2017
Total spending (left axis)
Growth (right axis)
Visitor spending in ConnecticutVisitor spending, billions
Source: Tourism Economics
Percent growth

Visitor spending in Connecticut
| Tourism Economics 8
The largest visitor spending category is recreational spending, capturing 29 cents of each visitor dollar. 19% of each visitor dollar is spent on lodging.
19%
25%
15%
29%
12%
Source: Tourism Economics
$1.8b of spending on lodging
$9.3b of spending
Total$2.3b of spending on food and beverage
$1.1b of spending on transportation
$2.7b of spending on recreation
Visitor spending in Connecticut, 2017Dollars, billions and percent of total
$1.4b of spending on retail

Tourism spending reached $9.3 billion in 2017
| Tourism Economics 9
Spending grew 3.6% in 2017, led by increases in spending on food & beverages and lodging.
The 3.6% growth represented an increase in visitor spending of more than $300 million.
Visitor spending has increased by $1.0 billion since 2013, an annual average increase of 2.3%.
With visitor spending on food & beverages growing an average of 5.0% over the past five years, food & beverage spending has increased by $500 million.
Visitor spending in ConnecticutNominal dollars, millions 2017 2013-2017
2013 2014 2015 2016 2017 Growth CAGRLodging $1,401.3 $1,427.4 $1,486.5 $1,681.9 $1,758.8 4.6% 4.6%Food & beverages $1,830.8 $1,980.8 $2,163.2 $2,212.1 $2,331.3 5.4% 5.0%Retail $1,238.5 $1,297.4 $1,312.4 $1,341.0 $1,368.7 2.1% 2.0%Recreation $2,813.7 $2,697.4 $2,684.5 $2,653.6 $2,722.1 2.6% -0.7%Local Transportation $795.8 $853.5 $859.1 $867.3 $886.7 2.2% 2.2%Air Transportation $200.2 $207.7 $205.2 $215.4 $226.2 5.0% 2.5%Total $8,280.4 $8,464.2 $8,710.9 $8,971.2 $9,293.8 3.6% 2.3%Source: Tourism Economics

Tourism spending by category
| Tourism Economics 10
Visitor spending increased in each category — led by food & beverages and lodging.
Spending on lodging – including 2nd home rental and room rentals – surpassed $1.75 million in 2017.
Spending by visitors on food & beverages jumped over $110 million in 2017, reaching $2.3 billion.
Recreational spending reached $2.7 billion in 2017 despite a decline in visitor supported gaming revenue.
$1.00 $1.06 $1.06 $1.08 $1.11
$2.81 $2.70 $2.68 $2.65 $2.72
$1.24 $1.30 $1.31 $1.34 $1.37
$1.83 $1.98 $2.16 $2.21 $2.33
$1.40 $1.43 $1.49 $1.68 $1.76
$0.0$1.0$2.0$3.0$4.0$5.0$6.0$7.0$8.0$9.0
$10.0
2013 2014 2015 2016 2017
Lodging
Food andbeverage
Retail
Recreation
Transportation
Connecticut visitor spendingBillions of $
Source: Tourism EconomicsTransportation includes both Air and Local Transportation

Visitor spending shares
| Tourism Economics 11
The share of the visitor dollar going to lodging expenses (including 2nd homes) increased to nearly 19% in 2017.
Visitors are now spending 25 cents of their dollar in Connecticut at restaurants and grocery stores, an increase of 3.0 percentage points since 2013.
Increasing competition for the gaming dollar across the Northeast has affected the recreational share in Connecticut.
12.0% 12.5% 12.2% 12.1% 12.0%
34.0% 31.9% 30.8% 29.6% 29.3%
15.0% 15.3% 15.1% 14.9% 14.7%
22.1% 23.4% 24.8% 24.7% 25.1%
16.9% 16.9% 17.1% 18.7% 18.9%
0%
20%
40%
60%
80%
100%
2013 2014 2015 2016 2017
Lodging
Food andbeverage
Retail
Recreation
Transportation
Connecticut visitor spendingPercent of total
Source: Tourism EconomicsTransportation includes both Air and Local Transportation
The share of the visitor dollar going to retail is decreasing while the lodging and food & beverages shares are increasing.

Travel sectors
| Tourism Economics 12
Spending growth was strongest amongst day visitors, Canadian visitors, and amongst visitors traveling for leisure purposes.
2017 saw visitor spending growth across all travel sectors.
Leisure spend grew 4.0% in 2017, supporting overall state growth.
Strength in both the day and overnight sectors contributed to overall gains in spending.
The majority of visitor spending growth in Connecticut in 2017 can be attributed to domestic visitors.
Visitor spending in ConnecticutNominal dollars, millions
Leisure $8.08 Day $3.58 Domestic $8.51Business $1.22 Overnight $5.71 Overseas $0.76
Canada $0.02Total $9.29 Total $9.29 Total $9.29
Leisure 4.0% Day 4.3% Domestic 3.7%Business 1.2% Overnight 3.2% Overseas 2.2%
Canada 5.4%Total 3.6% Total 3.6% Total 3.6%
Leisure 86.9% Day 38.5% Domestic 91.6%Business 13.1% Overnight 61.5% Overseas 8.2%
Canada 0.3%
Source: Tourism Economics
Share
Purpose Stay Market
Growth Rates

Travel sectors
| Tourism Economics 13
Visitor spending in Connecticut is led by leisure, overnight, and domestic sectors.
86.9%
38.5%
91.6%
13.1%
61.5%
8.4%
0%10%20%30%40%50%60%70%80%90%
100%
Purpose Day / Overnight Market
Connecticut market breakouts
Business
Source: Tourism Economics
Leisure
Overnight
Day
International
Domestic
Visitor spending sharesLeisure spending makes up 87% of all visitor spending in the state.
Despite being only one-third of overall visitation, overnight visitor spending is 61.5% of all visitor spending.
International visitor spending comprises about 8.4% of all visitor spending in Connecticut in 2017.

3) The Economic Impact of Tourism –Direct Tourism Industry

How tourism generates impact
| Tourism Economics 15
Tourism spending flows through the economy and generates economic benefit through multiple channels.
Our analysis of tourism’s impact on Connecticut starts with actual spending by tourists, but also considers the downstream effects of this injection of spending into the local economy. To determine the total economic impact of tourism in Connecticut, we input tourism spending into a model of the Connecticut’s economy created in IMPLAN. This model calculates three distinct types of impact: direct, indirect, and induced.
How tourism spending flows through the economy and generates economic benefits
§ Travelers create direct economic value within a discreet group of sectors (e.g. recreation, transportation). This supports a relative proportion of jobs, wages, taxes, and GDP within each sector.
§ Each directly affected sector also purchases goods and services as inputs (e.g. food wholesalers, utilities) into production. These impacts are called indirect impacts.
§ Lastly, the induced impact is generated when employees whose wages are generated either directly or indirectly by tourism, spend those wages in the local economy.
The impacts on business sales, jobs, wages, and taxes are calculated for all three levels of impact.

Tourism industry impacts
| Tourism Economics 16
Visitor spending in Connecticut directly supported 84,254 jobs and $4.6 billion in state GDP in 2017.
Tourism GDP is the value added of those sectors directly interacting with visitors.
The narrow definition of the tourism industry counts only tourism consumption, which excludes capital investment and general government support of tourism. This definition is consistent with economic accounts.
On this basis, tourism industry GDP was $4.6 billion in 2017, accounting for 1.8% of total Connecticut GDP.
Employment GDPAgriculture, Fishing, Mining - - Construction and Utilities - - Manufacturing - - Wholesale Trade - - Air Transport 744 $82.4Other Transport 1,981 $155.8Retail Trade 6,931 $304.4Gasoline Stations 528 $53.7Communications - - Finance, Insurance and Real Estate 331 $358.1Business Services 81 $9.7Education and Health Care - - Recreation and Entertainment 18,909 $636.2Lodging 13,609 $888.6Food & Beverage 30,323 $1,181.6Personal Services 2,216 $118.8Government 8,603 $852.2TOTAL 84,254 $4,641.5Source: Tourism Economics
Core Tourism

Tourism Employment Intensity
| Tourism Economics 17
Tourism employment is a significant part of several industries – 99% of lodging, 34% of recreation, and 17% of the food & beverage employment is supported by visitor spending.
98.5%
33.8%
17.2%
3.1%
3.6%
0% 20% 40% 60% 80% 100%
Lodging
Rec
Food & Bev
Retail
Total
Tourism Employment Intensity
JobsSource: Tourism Economics; BLS

Tourism employment growth
| Tourism Economics 18
With spending growth concentrated in key tourism sectors, tourism businesses now employ 84,254 residents.
79,092
80,93781,379
82,688
83,62684,254
1.9%
2.3%
0.5%
1.6%
1.1%
0.8%
0.0%
0.5%
1.0%
1.5%
2.0%
2.5%
76,000
77,000
78,000
79,000
80,000
81,000
82,000
83,000
84,000
85,000
2012 2013 2014 2015 2016 2017Direct employment Growth (right axis)
Tourism supported employment in ConnecticutJobs
Source: Tourism Economics
Percent growth
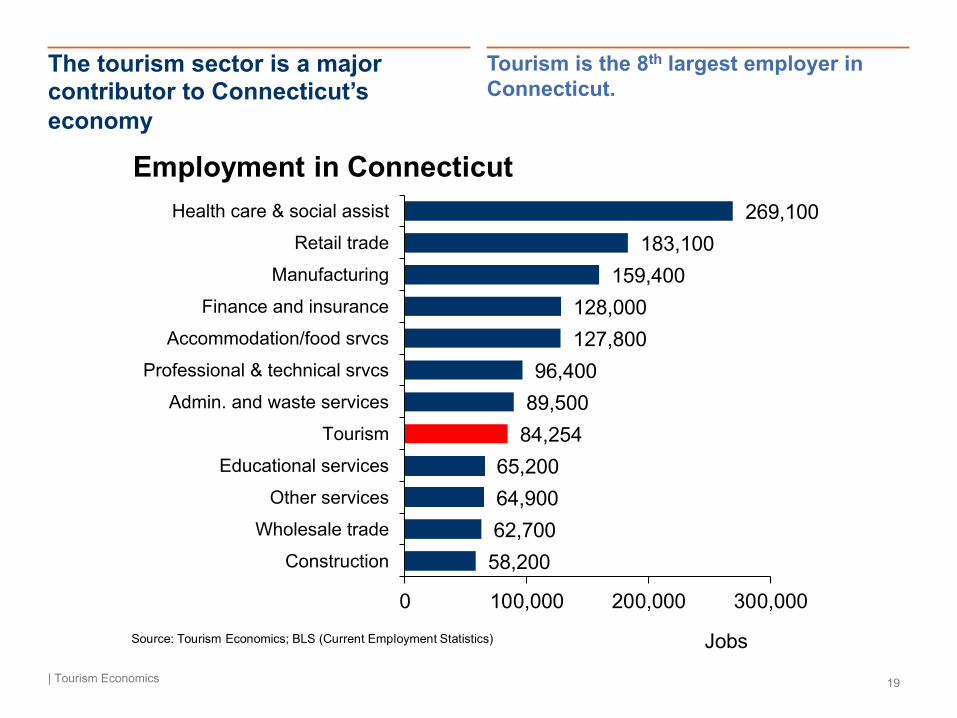
The tourism sector is a major contributor to Connecticut’s economy
| Tourism Economics 19
Tourism is the 8th largest employer in Connecticut.
269,100 183,100
159,400 128,000 127,800
96,400 89,500
84,254 65,200 64,900 62,700 58,200
0 100,000 200,000 300,000
Health care & social assist
Retail trade
Manufacturing
Finance and insurance
Accommodation/food srvcs
Professional & technical srvcs
Admin. and waste services
Tourism
Educational services
Other services
Wholesale trade
Construction
Employment in Connecticut
JobsSource: Tourism Economics; BLS (Current Employment Statistics)
4) The Economic Impact of Tourism –Total Tourism Economy

Business sales impacts (1 of 2)
| Tourism Economics 21
Visitors and tourism businesses spent $9.3 billion in Connecticut in 2017. This supported a total of $15.5 billion in business sales when indirect and induced impacts are considered.
Direct Indirect Induced TotalAgriculture, Fishing, Mining - 17.6 8.7 26.3 Construction and Utilities - 254.5 101.1 355.7 Manufacturing - 111.6 93.3 204.9 Wholesale Trade - 73.6 142.9 216.5 Air Transport 226.2 2.5 6.2 234.9 Other Transport 243.8 111.3 54.2 409.4 Retail Trade 1,718.4 13.6 258.0 1,990.1 Gasoline Stations 487.7 1.1 18.6 507.4 Communications - 222.5 135.7 358.2 Finance, Insurance and Real Estate 487.1 708.7 1,296.9 2,492.7 Business Services 43.0 742.8 284.6 1,070.5 Education and Health Care - 4.7 726.5 731.2 Recreation and Entertainment 1,260.7 64.4 43.9 1,368.9 Lodging 1,426.9 1.4 1.5 1,429.9 Food & Beverage 1,981.6 63.6 228.1 2,273.3 Personal Services 128.9 80.6 172.7 382.2 Government 1,289.5 91.5 59.8 1,440.8 TOTAL 9,293.8 2,566.3 3,632.7 15,492.8 Percent Change (2015-2017) 6.7% 4.8% 2.8% 5.5%
Business sales impacts, 2017 (millions of $)

Business sales impacts (2 of 2)
| Tourism Economics 22
While the majority of sales are in industries directly serving visitors, $750 million in business sales is happening in business services as a result of selling to tourism businesses.
FIRE*Food & Beverage
Retail TradeGovernment
LodgingRecreation and Entertainment
Business ServicesEducation and Health Care
Gasoline StationsOther Transport
Personal ServicesCommunications
Construction and UtilitiesAir Transport
Wholesale TradeManufacturing
Agriculture, Fishing, Mining
$0 $500 $1,000 $1,500 $2,000 $2,500 $3,000
DirectIndirectInduced
Business sales impacts, 2017
Source: Tourism Economics
Dollars, millions*Finance, insurance and real estate

GDP impacts (1 of 2)
| Tourism Economics 23
Travel generated $8.7 billion in state GDP in 2017, or 3.3% of the Connecticut economy. This excludes all import leakages to arrive at the economic value generated by travel.
Direct Indirect Induced TotalAgriculture, Fishing, Mining - 8.6 4.2 12.8 Construction and Utilities - 150.6 66.3 216.9 Manufacturing - 41.1 35.2 76.2 Wholesale Trade - 60.4 122.3 182.7 Air Transport 82.4 1.1 2.7 86.2 Other Transport 155.8 59.7 28.8 244.4 Retail Trade 304.4 8.0 175.8 488.2 Gasoline Stations 53.7 0.7 13.4 67.9 Communications - 114.6 76.5 191.1 Finance, Insurance and Real Estate 358.1 513.7 965.9 1,837.7 Business Services 9.7 499.8 196.8 706.3 Education and Health Care - 2.6 450.4 453.1 Recreation and Entertainment 636.2 30.3 24.9 691.4 Lodging 888.6 0.9 1.0 890.5 Food & Beverage 1,181.6 37.1 142.1 1,360.8 Personal Services 118.8 50.2 93.8 262.8 Government 852.2 50.1 21.3 923.5 TOTAL 4,641.5 1,629.5 2,421.4 8,692.4 Percent Change (2015-2017) 3.7% 2.2% 1.9% 2.9%Source: Tourism Economics
GDP im pac t s, 2017 (m i l l ions o f $ )

GDP impacts (2 of 2)
| Tourism Economics 24
Supported by 2nd home rentals, the finance, insurance and real estate (FIRE) industry has the largest economic contribution from traveler spending followed by the restaurant industry.
FIRE*Food & Beverage
GovernmentLodging
Business ServicesRecreation and Entertainment
Retail TradeEducation and Health Care
Personal ServicesOther Transport
Construction and UtilitiesCommunicationsWholesale Trade
Air TransportManufacturing
Gasoline StationsAgriculture, Fishing, Mining
$0.0 $0.5 $1.0 $1.5 $2.0
DirectIndirectInduced
GDP impacts, 2017
Source: Tourism EconomicsDollars, billions*Finance, Insurance and Real Estate

Employment impacts (1 of 2)
| Tourism Economics 25
Visitor spending supported a total of 123,521 jobs when indirect and induced impacts are considered.
Direct Indirect Induced TotalAgriculture, Fishing, Mining - 160 105 265 Construction and Utilities - 1,012 275 1,287 Manufacturing - 326 180 505 Wholesale Trade - 304 626 931 Air Transport 744 9 22 774 Other Transport 1,981 886 465 3,332 Retail Trade 6,931 140 3,167 10,238 Gasoline Stations 528 8 131 667 Communications - 583 350 933 Finance, Insurance and Real Estate 331 3,037 3,444 6,812 Business Services 81 5,353 2,153 7,587 Education and Health Care - 68 6,585 6,652 Recreation and Entertainment 18,909 1,263 823 20,995 Lodging 13,609 14 15 13,637 Food & Beverage 30,323 936 3,339 34,598 Personal Services 2,216 734 2,028 4,978 Government 8,603 502 225 9,331 TOTAL 84,254 15,334 23,933 123,521 Percent Change (2015-2017) 1.9% 2.2% 0.4% 1.6%Source: Tourism Economics
Em ploym ent im pac t s, 2017

Employment impacts (2 of 2)
| Tourism Economics 26
Food & Beverage
Recreation and Entertainment
Lodging
Retail Trade
Government
Business Services
FIRE*
Education and Health Care
Personal Services
Other Transport
Construction and Utilities
Communications
Wholesale Trade
Air Transport
Gasoline Stations
Manufacturing
Agriculture, Fishing, Mining
0 10,000 20,000 30,000 40,000
Direct
Indirect
Induced
Employment impacts, 2017
Source: Tourism Economics Jobs*Finance, insurance and real estate
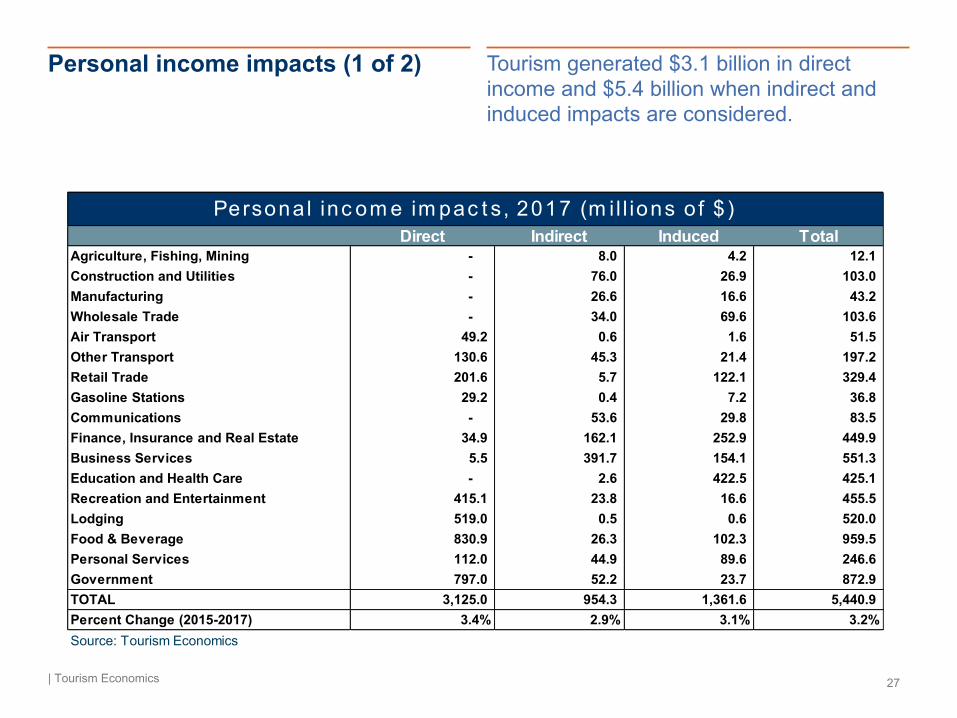
Personal income impacts (1 of 2)
| Tourism Economics 27
Tourism generated $3.1 billion in direct income and $5.4 billion when indirect and induced impacts are considered.
Direct Indirect Induced TotalAgriculture, Fishing, Mining - 8.0 4.2 12.1 Construction and Utilities - 76.0 26.9 103.0 Manufacturing - 26.6 16.6 43.2 Wholesale Trade - 34.0 69.6 103.6 Air Transport 49.2 0.6 1.6 51.5 Other Transport 130.6 45.3 21.4 197.2 Retail Trade 201.6 5.7 122.1 329.4 Gasoline Stations 29.2 0.4 7.2 36.8 Communications - 53.6 29.8 83.5 Finance, Insurance and Real Estate 34.9 162.1 252.9 449.9 Business Services 5.5 391.7 154.1 551.3 Education and Health Care - 2.6 422.5 425.1 Recreation and Entertainment 415.1 23.8 16.6 455.5 Lodging 519.0 0.5 0.6 520.0 Food & Beverage 830.9 26.3 102.3 959.5 Personal Services 112.0 44.9 89.6 246.6 Government 797.0 52.2 23.7 872.9 TOTAL 3,125.0 954.3 1,361.6 5,440.9 Percent Change (2015-2017) 3.4% 2.9% 3.1% 3.2%Source: Tourism Economics
Persona l inc om e im pac t s, 2017 (m i l l ions o f $ )

Personal income impacts (2 of 2)
| Tourism Economics 28
Food & Beverage
Government
Business ServicesLodging
Recreation and EntertainmentFIRE*
Education and Health CareRetail Trade
Personal Services
Other TransportWholesale Trade
Construction and UtilitiesCommunications
Air TransportManufacturing
Gasoline Stations
Agriculture, Fishing, Mining
$0 $200 $400 $600 $800 $1,000 $1,200
DirectIndirectInduced
Personal income impacts, 2017
Source: Tourism Economics
Dollars, millions*Finance, insurance and real estate

Tax impacts
| Tourism Economics 29
Visitor spending, visitor supported jobs, and business sales generated nearly $2.2 billion in governmental revenues.
State and local taxes alone tallied $960 million in 2017 with property and sales taxes the two largest categories.
State and local tax receipts supported by visitor activity have grown by $65 million since 2015.
Each household in Connecticut would need to be taxed an additional $705 to replace the state and local taxes generated by visitors in 2017.
2015 2016 2017Federal $1,181.5 $1,203.0 $1,224.4 Personal Income $507.1 $522.7 $530.8 Corporate $140.6 $130.1 $134.0 Indirect business $74.7 $76.9 $79.2 Social insurance $459.1 $473.3 $480.5
State and Local $893.6 $926.1 $958.5 Sales $203.8 $213.3 $218.4 Bed Tax $117.2 $122.9 $129.7 Personal Income $136.0 $131.6 $133.7 Corporate $21.1 $21.7 $22.4 Social insurance $5.1 $4.4 $4.5 Excise and Fees $44.2 $45.8 $47.5 Property $366.2 $386.4 $402.3Total $2,075.1 $2,129.1 $2,183.0Source: Tourism Economics
Tax im pac t s, m i l l ions
Tax impacts
| Tourism Economics 30
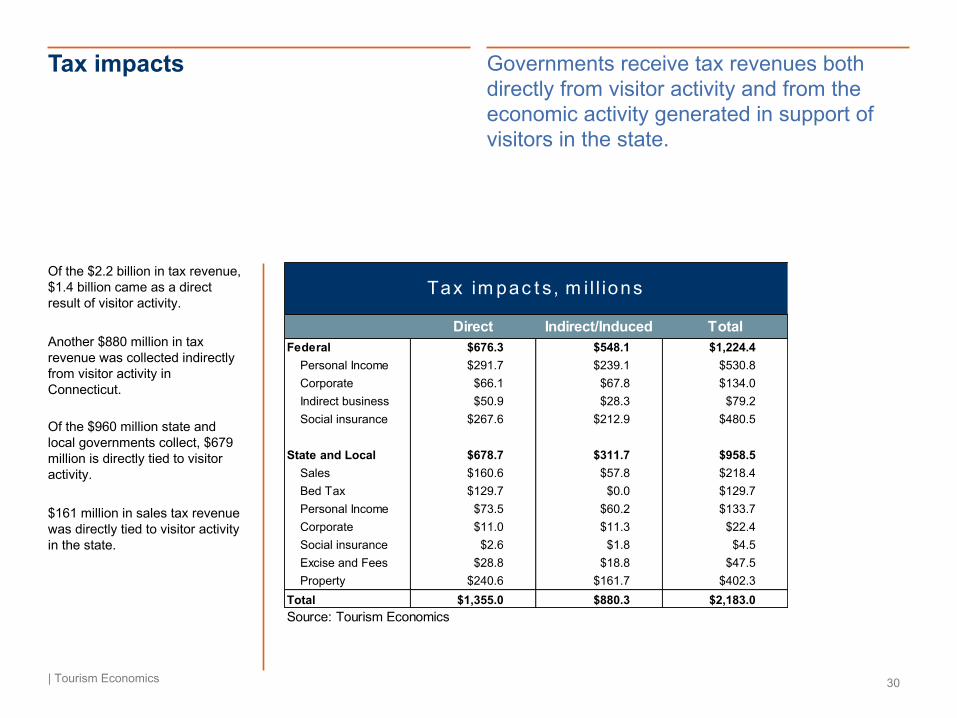
Governments receive tax revenues both directly from visitor activity and from the economic activity generated in support of visitors in the state.
Of the $2.2 billion in tax revenue, $1.4 billion came as a direct result of visitor activity.
Another $880 million in tax revenue was collected indirectly from visitor activity in Connecticut.
Of the $960 million state and local governments collect, $679 million is directly tied to visitor activity.
$161 million in sales tax revenue was directly tied to visitor activity in the state.
Direct Indirect/Induced TotalFederal $676.3 $548.1 $1,224.4 Personal Income $291.7 $239.1 $530.8 Corporate $66.1 $67.8 $134.0 Indirect business $50.9 $28.3 $79.2 Social insurance $267.6 $212.9 $480.5
State and Local $678.7 $311.7 $958.5 Sales $160.6 $57.8 $218.4 Bed Tax $129.7 $0.0 $129.7 Personal Income $73.5 $60.2 $133.7 Corporate $11.0 $11.3 $22.4 Social insurance $2.6 $1.8 $4.5 Excise and Fees $28.8 $18.8 $47.5 Property $240.6 $161.7 $402.3Total $1,355.0 $880.3 $2,183.0Source: Tourism Economics
Tax im pac t s, m i l l ions
5) Tourism in context

Figures in context
| Tourism Economics 32
The $15.5 billion in total impact in 2017 is equal in size to the entire U.S. youth sports market.
Tourism Supported
Sales
Stacking 9.3 billion $1 bills would reach over 630 miles high – this pile would traverse the state nearly six times from east to west (110 miles long) .
Tourism Spending
The 84,254 jobs directly supported by visitor spending would be enough for every resident of the City of Danbury (population 84,657).
Employment

Figures in context
| Tourism Economics 33
To make up for the $960 million in state and local taxes generated by visitor activity, each household in the state would need to contribute $705 to maintain the current level of government.
In comparison, American consumers spent an average of $652 on admissions to arts, movies, sporting events and other entertainment activities. The savings from tourism to state households is larger than what they spend on admissions.
Taxes
State and local tax revenue collected from tourism activity reached $960 million in 2017 – enough to fund the entire state transportation capital budget AND capital budget for education & libraries ($920 million).
Taxes

About Tourism Economics
| Tourism Economics 34
Tourism Economics is an Oxford Economics company with a singular objective: combine an understanding of tourism dynamics with rigorous economics in order to answer the most important questions facing destinations, developers, and strategic planners. By combining quantitative methods with industry knowledge, Tourism Economics designs custom market strategies, destination recovery plans, tourism forecasting models, tourism policy analysis, and economic impact studies.
With over four decades of experience of our principal consultants, it is our passion to work as partners with our clients to achieve a destination’s full potential.
Oxford Economics is one of the world’s leading providers of economic analysis, forecasts and consulting advice. Founded in 1981 as a joint venture with Oxford University’s business college, Oxford Economics enjoys a reputation for high quality, quantitative analysis and evidence-based advice. For this, it draws on its own staff of more than 200 professional economists; a dedicated data analysis team; global modeling tools, and a range of partner institutions in Europe, the US and in the United Nations Project Link. Oxford Economics has offices in London, Oxford, Dubai, New York, Philadelphia, and Belfast.
For more information: