Embed Size (px)
Citation preview

The Economic and Fiscal Impacts of the Distilling Industry in Kentucky
for the
by
Paul Coomes, Ph.D. Professor of Economics
and Barry Kornstein
Research Manager
January 2012

TABLE OF CONTENTS
EXECUTIVE SUMMARY ........................................................................................................ 1 THE SIZE OF THE DISTILLING INDUSTRY IN KENTUCKY ....................................................... 3 Industry definition, classification ............................................................................ 3 Number of companies, facilities ............................................................................. 4 Production and sales ............................................................................................... 7 Employment and payrolls ..................................................................................... 12 Distilling’s share of Kentucky Gross State Product ............................................... 13 Recent investments at Kentucky distillers ............................................................ 16 Corporate responsibility and philanthropic activity ............................................. 17 ECONOMIC IMPACTS ........................................................................................................ 18 Linkages to other sectors ...................................................................................... 18 Economic multipliers ............................................................................................ 19 Total economic impact of distillery company operations .................................... 20 Importance compared to other industries in Kentucky ....................................... 21 Impact of construction activity ............................................................................. 22 TAXATION AND FISCAL IMPACTS OF THE INDUSTRY ........................................................ 24 Property taxes ....................................................................................................... 25 Alcohol consumption taxes ................................................................................... 27 Licenses and fees .................................................................................................. 30 Tax revenues related to payrolls of distilleries ..................................................... 30 Taxation of distilled spirits in Kentucky compared to other states ...................... 33 Recent tax policy proposals to stimulate the bourbon industry .......................... 36 THE KENTUCKY BOURBON TRAIL® EXPERIENCE AND ITS TOURISM POTENTIAL .............. 38 Sites, visitation data .............................................................................................. 38 Visitor profiles, impacts ........................................................................................ 40 Other tourism‐related activity .............................................................................. 41

The Distilling Industry in Kentucky 1
The Economic and Fiscal Impacts of the Distilling Industry in Kentucky
entucky is known internationally for its bourbon whiskey. The state produces and ages perhaps 95 percent of all the bourbon in the world. Nearly all of the products are shipped to customers outside of Kentucky, meaning the dollars generated from sales are ‘new’ to
Kentucky. The dollars support the wages, salaries and benefits of workers in the state’s distilling industry, as well as those employed by suppliers. The dollars circulate further, as employees and owners spend their income in the regional economy, generating jobs and income in grocery stores, car dealers, banks, restaurants, doctors’ offices, and the like. In this study, we provide a comprehensive statement of the size and economic importance of the distilling industry in Kentucky. We also provide estimates of the state and local government tax revenues associated with the industry, a look at Kentucky’s tax treatment of the industry compared to other states, and an estimate of the economic potential of the emerging bourbon‐tourism component. Among the most important and interesting findings are:
There are 19 major distilling establishments in Kentucky, and these are owned by 10 corporations. The establishments are in 9 locations and 8 counties. Moreover, we have documented a dozen new ‘craft’ distilleries that have been recently licensed by the Kentucky Alcohol Beverage Control agency, or are in the process of obtaining a license.
Kentucky stands out nationally in bourbon production, accounting for as much as 95 percent of the US total. This is an industry that could feasibly be located in another state, and one in which Kentucky has managed to dominate. Moreover, the industry is very stable during economic downturns, helping to diversify the economic base in the state. But with new micro‐bourbon distilleries now opening around the country, there is fresh competition among locations for the industry.
Kentucky distilling companies ship about $2.5 billion in products annually, and account for around 35 percent of the value of all distilled spirits produced in the United States. Kentucky bourbon is exported to 126 countries, with 28.7 million proof‐gallons shipped in 2010. It is by far the largest export category among all US spirits.
Because of its large scale and its corporate headquarters operations, Kentucky hosts about 43 percent of all distilling jobs and 48 percent of payrolls in the United States. Distilling companies in Kentucky employ around 3,100 people, with an annual payroll of about $246 million, excluding fringe benefits.
The bourbon production, as well as the management and marketing of bourbon brands, is linked to many other Kentucky industries. This includes obvious support industries like wooden barrels and pallets, plastic bottles, trucking, and electricity. Hundreds of other less obvious industries are impacted directly or indirectly, and these account for the relatively high employment and payroll multipliers for distilling. We estimate that the Kentucky distilling industry is responsible for a total of 8,690 jobs in the state, with a total annual payroll of $413 million.
K
The Distilling Industry in Kentucky 2
Among the 244 detailed manufacturing industries with operations in Kentucky, only three have both more jobs and a higher employment multiplier than distilling: automobiles, light truck and utility vehicles, and meatpacking. Moreover, several nonmanufacturing industries that receive considerable public attention have much lower employment multipliers, including tobacco farming, coal mining, and horse farms.
Our detailed analysis of property tax records documents the large investments in buildings, equipment, and aging barrels by the industry over the past few years. We found tax assessments and payments have grown by over 25 percent since 2008.
Kentucky state and local governments directly tax both the production and consumption of distilled spirits, the property owned by the companies, the wages earned by employees, and corporate net income. We estimate that the state and local governments receive about $126 million annually from spirits production and consumption. Consumption taxes of some sort would be paid whether the industry produced bourbon in Kentucky or not. However, we estimate that the production component accounts for $61 million of the annual total.
Kentucky appears to tax spirits higher than any other open market state except Alaska and Illinois. This contrasts starkly with the tax climate in the leading wine and beer producing states, where their tax rates are among the lowest in the nation.
We estimate that in 2010 distillers paid about $11.7 million in inventory property taxes and $2.7 million in property taxes on their buildings, land, equipment, and inventory. These property taxes go to schools, city governments, county governments, other local districts, and state government. Schools receive about one‐half of the tax revenues.
The distilling industry in Kentucky is also responsible for many other taxes to state and local governments. The largest recipient is Kentucky state government, with total distillery‐related wages and salaries generating $35.6 million in individual income and sales tax receipts annually.
Overall, annual state and local government tax receipts related to spirits production amount to $19,600 per distilling industry employee.
The Kentucky Bourbon Trail® experience has emerged as a significant tourism destination. Over 22,000 people, mostly from out‐of‐state, have now visited all Kentucky Bourbon Trail® distilleries. Surveys revealed the visitors on average to be relatively affluent, with multi‐night hotel stays in Kentucky.
The rest of the report is organized as follows. First, we provide and discuss estimates of the size of the industry in Kentucky, in terms of production, jobs, and payroll. Second, we investigate the linkages between distilling and other businesses in Kentucky. This analysis provides a basis of an economic impact statement, including multiplier effects. Third, we provide estimates of tax payments to state and local governments. Finally, we examine the tourism potential of the Kentucky Bourbon Trail® experience.
The Distilling Industry in Kentucky 3
The Size of the Distilling Industry in Kentucky e first examine the economic size of the distilling industry in Kentucky, focusing only on the actual distilling sites and companies in the state. There are several ways to measure the size of the industry, including number of establishments, company
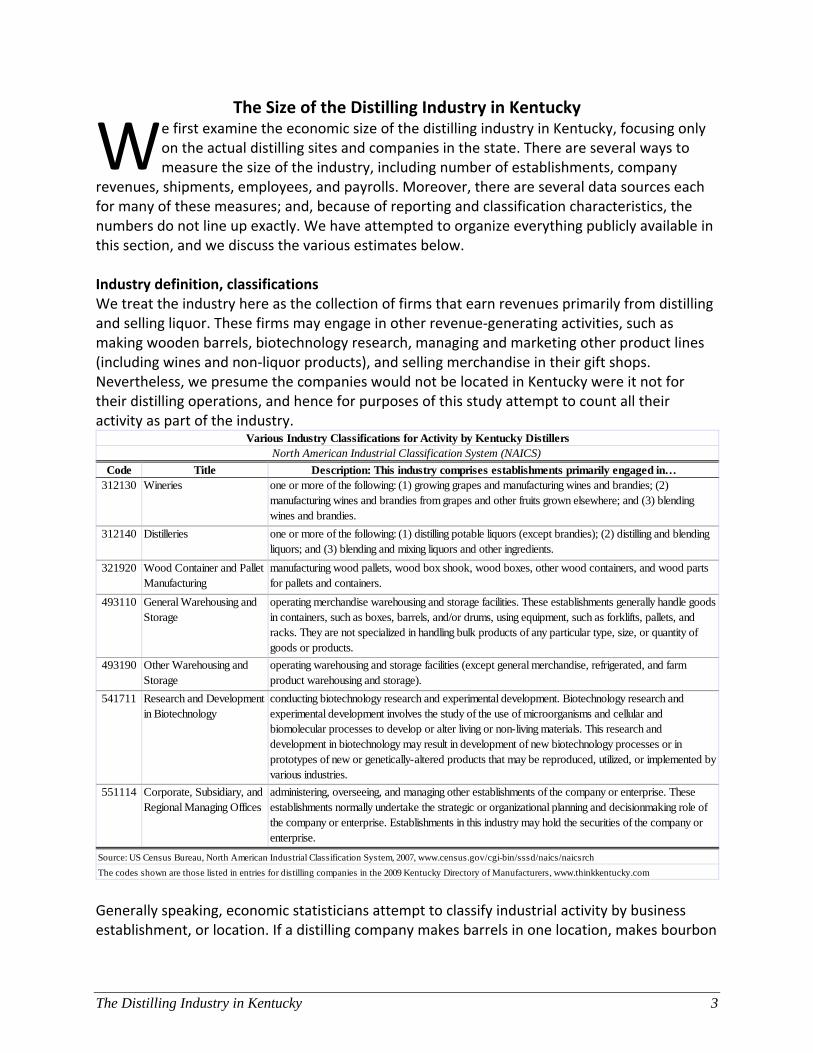
revenues, shipments, employees, and payrolls. Moreover, there are several data sources each for many of these measures; and, because of reporting and classification characteristics, the numbers do not line up exactly. We have attempted to organize everything publicly available in this section, and we discuss the various estimates below. Industry definition, classifications We treat the industry here as the collection of firms that earn revenues primarily from distilling and selling liquor. These firms may engage in other revenue‐generating activities, such as making wooden barrels, biotechnology research, managing and marketing other product lines (including wines and non‐liquor products), and selling merchandise in their gift shops. Nevertheless, we presume the companies would not be located in Kentucky were it not for their distilling operations, and hence for purposes of this study attempt to count all their activity as part of the industry.
Generally speaking, economic statisticians attempt to classify industrial activity by business establishment, or location. If a distilling company makes barrels in one location, makes bourbon
Code Title Description: This industry comprises establishments primarily engaged in…312130 Wineries one or more of the following: (1) growing grapes and manufacturing wines and brandies; (2)
manufacturing wines and brandies from grapes and other fruits grown elsewhere; and (3) blending wines and brandies.
312140 Distilleries one or more of the following: (1) distilling potable liquors (except brandies); (2) distilling and blending liquors; and (3) blending and mixing liquors and other ingredients.
321920 Wood Container and Pallet Manufacturing
manufacturing wood pallets, wood box shook, wood boxes, other wood containers, and wood parts for pallets and containers.
493110 General Warehousing and Storage
operating merchandise warehousing and storage facilities. These establishments generally handle goods in containers, such as boxes, barrels, and/or drums, using equipment, such as forklifts, pallets, and racks. They are not specialized in handling bulk products of any particular type, size, or quantity of goods or products.
493190 Other Warehousing and Storage
operating warehousing and storage facilities (except general merchandise, refrigerated, and farm product warehousing and storage).
541711 Research and Development in Biotechnology
conducting biotechnology research and experimental development. Biotechnology research and experimental development involves the study of the use of microorganisms and cellular and biomolecular processes to develop or alter living or non-living materials. This research and development in biotechnology may result in development of new biotechnology processes or in prototypes of new or genetically-altered products that may be reproduced, utilized, or implemented by various industries.
551114 Corporate, Subsidiary, and Regional Managing Offices
administering, overseeing, and managing other establishments of the company or enterprise. These establishments normally undertake the strategic or organizational planning and decisionmaking role of the company or enterprise. Establishments in this industry may hold the securities of the company or enterprise.
Source: US Census Bureau, North American Industrial Classification System, 2007, www.census.gov/cgi-bin/sssd/naics/naicsrch
The codes shown are those listed in entries for distilling companies in the 2009 Kentucky Directory of Manufacturers, www.thinkkentucky.com
Various Industry Classifications for Activity by Kentucky DistillersNorth American Industrial Classification System (NAICS)
W

The Distilling Industry in Kentucky 4
in another location, ages it at another location, and has corporate offices at yet another location, then the company might have activity listed under four different industrial classifications. According to the 2011 Kentucky Directory of Manufacturers, the distilling companies in Kentucky have activities that span at least seven industrial classifications. These industries are shown in the table above, with their official descriptions. Number of companies, facilities At the time of this study, the Kentucky Distillers Association (KDA) had six major distilling companies represented, along with three new craft distilleries:
Beam, Inc.
Brown‐Forman
Diageo North America
Four Roses
Heaven Hill
Wild Turkey
Alltech (craft)
Barrel House Distilling Co. (craft)
MB Roland Distillery (craft)
Several of the companies operate in multiple locations around Kentucky. The largest non‐member distiller is Sazerac‐North America, which has operations in Bardstown, Frankfort and Owensboro. Moreover, recently there have emerged a number of small ‘craft’ distilleries around Kentucky, several of which have become members of the KDA. As of September 2011, there were actually 22 company locations holding ABC licenses to distill in the state. Licensed craft distillers (or rectifiers1) include Age International (Frankfort), Alltech (Lexington), Barrel House (Lexington), Kentucky Bourbon Distiller (Bardstown), Silver Trail (Hardin) Corsair Artisan (Bowling Green), and MB Roland (Pembroke), Strong Spirits (Bardstown), Three Spirits (Bowling Green). ABC license applications have been filed by Jamieson (Hickman) and Limestone (Lebanon). Benson Creek Farm has announced a distillery in Frankfort, to produce 50,000 gallons of bourbon per year. And Party Source has announced plans to invest over $4 million to build a bourbon distillery and warehouse in Newport. Clearly, there is significant growth and diversification in the bourbon distilling industry occurring now.
1 According to Kentucky Revised Statutes 241.010 (35): "Rectifier" means any person who rectifies,
purifies, or refines distilled spirits or wine by any process other than as provided for on distillery premises, and every person who, without rectifying, purifying, or refining distilled spirits by mixing alcoholic beverages with any materials, manufactures any imitations of or compounds liquors for sale under the name of whiskey, brandy, gin, rum, wine, spirits, cordials, bitters, or any other name.

The Distilling Industry in Kentucky 5
Since publicly available economic data are compiled on an ‘establishment’ basis, as opposed to corporate ownership basis, we find that there are more establishments than companies. The chart summarizes data from three sources over the past two decades. Due to data reporting lags, the chart does not reveal the most recent growth in the industry, particularly among the craft distillers. County Business Patterns (CBP) data (in red) shows sixteen distilling establishments in Kentucky in 2009, with a fairly constant count over the previous decade. CBP is produced by the US Census Bureau and is based primarily on company filings of payroll taxes, including Social Security. The Quarterly Census of Employment and Wages (QCEW) data (in green) is compiled by the US Bureau of Labor Statistics, and is based on company payments of unemployment insurance taxes. Note that the QCEW establishment count tracks the CBP count very closely, with both data sources documenting 14 to 18 distilling establishments in Kentucky. The other data source, the Economic Census, produced by the US Census Bureau, but is only available every five years (years ending in the numbers 2 and 7). The 1997, 2002 and 2007 points are shown in purple in the chart, and align with the other data.
12
13
14
15
16
17
18
19
20
1990 1991 1992 1993 1994 1995 1996 1997 1998 1999 2000 2001 2002 2003 2004 2005 2006 2007 2008 2009 2010
Distilling Industry Establishments, Three DatasetsKentucky, 1990‐2010
County Business Patterns Quarterly Census of Employment and Wages Economic Census

The Distilling Industry in Kentucky 6
The latest listing in the Kentucky Directory of Manufacturers provides a good snapshot of current Kentucky operations, though it does not show the small craft distillers just discussed. See table below. We have enhanced it somewhat to reflect subsequent ownership changes and more recent data on employment. There are eighteen establishments, owned by ten companies, with facilities in nine locations and eight counties. The combined employment is 2,998, led by Brown‐Forman, Jim Beam, Sazerac‐Buffalo Trace, and Heaven Hill. This public data reveals the distribution of establishments by county in Kentucky, and align well with internal information provided by the companies. Clearly, the distilling operations are clustered in a loop stretching from Louisville to Frankfort and Versailles. Owensboro also has an operating distillery listed (Glenmore), and another being renovated and is for sale (Medley). The accompanying map shows the location of all the major distilleries in Kentucky. They are all located in the north central portion of the state, with Makers’ Mark furthest south and Sazerac’s Owensboro operation furthest west. Many small craft distillers have emerged in the last few years, and these are more geographically dispersed, with operations for example in southwestern Kentucky, Lexington, and Bowling Green.
Company/Facilty Name Owner Address County Employment
Barton 1792 Sarerac-Buffalo Trace Bardstown, KY 40004 Nelson 180
Brown-Forman Corp Brown-Forman Corp Louisville, KY 40210-1091 Jefferson 837
Buffalo Trace Sazerac-Buffalo Trace Frankfort, KY 40601-2033 Franklin 318
Charles Medley Distillers Kentucky Jackks, LLC Owensboro, KY 42303 Daviess 2
Constellation Spirits Sazerac-Buffalo Trace Owensboro, KY 42303 Daviess 185
Diageo North America, Inc Diageo North America, Inc Louisville, KY Jefferson 32
Early Times Distillers Co Brown-Forman Corp Louisville, KY 40216-5245 Jefferson 30
Four Roses Distillery LLC* Kirin Brewing Company Limited Lawrenceburg, KY 40342 Anderson 65
Heaven Hill Distilleries Inc Heaven Hill Distilleries Inc Bardstown, KY 40004-2229 Nelson 384
Heaven Hill Distilleries Inc Heaven Hill Distilleries Inc Louisville, KY 40210-1210 Jefferson 45
Jim Beam Brands Co Beam, Inc. Boston, KY 40107-8550 Nelson 69
Jim Beam Brands Co Beam, Inc. Frankfort, KY 40601 Franklin 246
Jim Beam Brands Co Beam, Inc. Clermont, KY 40110 Bullitt 361
Kentucky Bourbon Distillers Kentucky Bourbon Distillers Bardstown, KY 40004-2200 Nelson 20
Maker's Mark Distillery Inc Beam, Inc. Loretto, KY 40037-8027 Marion 88
Sazerac-Buffalo Trace Sazerac-Buffalo Trace Louisville, KY Jefferson 28
Wild Turkey Distillery Gruppo Campari Lawrenceburg, KY 40342-9619 Anderson 88
Woodford Reserve Distillery** Brown-Forman Corp Versailles, KY 40383-9781 Woodford 20
total, 18 establishments 10 owners 9 locations 8 counties 2,998
Bourbon & Whiskey Distilling Companies in Kentucky, July 2011
Source: Kentucky Cabinet for Economic Development, www.thinkkentucky.com, with adjustments to reflect subsequent ownershp changes and more recent data. * The job count for Four Roses includes warehousing employees in Bullitt County.

The Distilling Industry in Kentucky 7
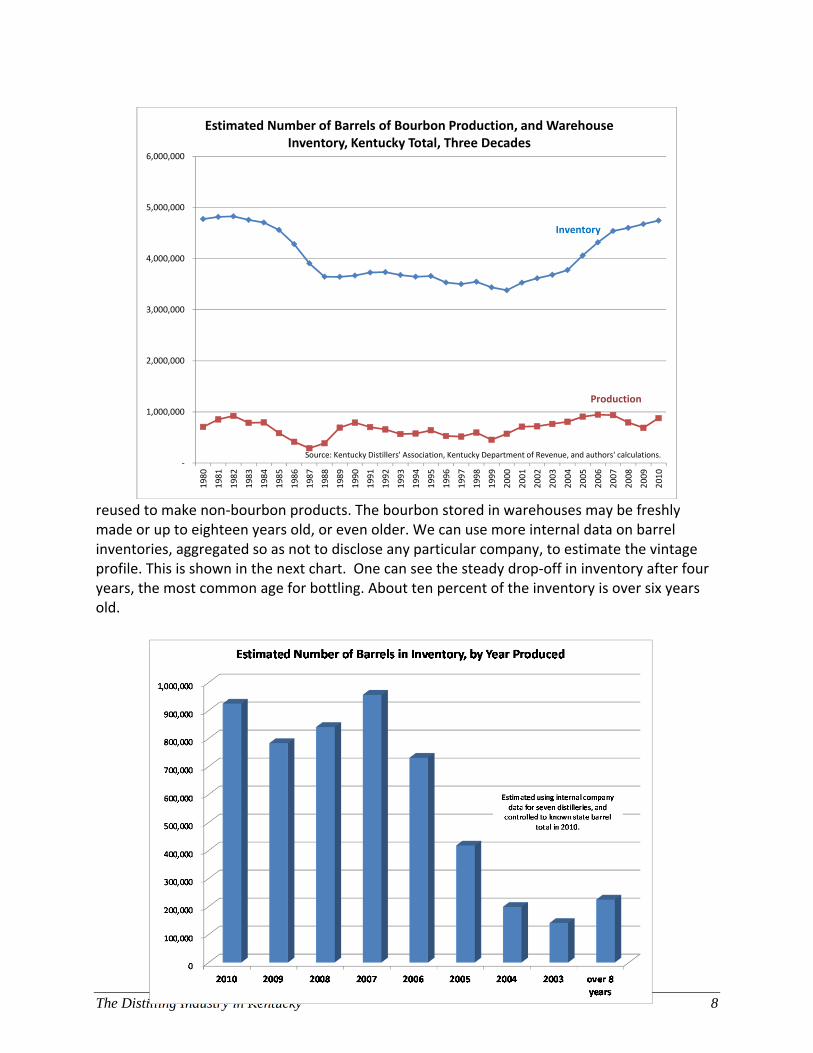
Using national and state QCEW statistics, we see that Kentucky has hosted between 18 and 30 percent of all distilling establishments in the United States over the past nineteen years. Kentucky dominates the bourbon distilling industry, with other types of whiskeys produced in Tennessee and other states. See www.whiskyportal.com/region_overview.asp for a global listing of companies. Other distilling operations in the US produce vodka, rum, tequila, gin, scotch, etc. The whiskey operations outside of Kentucky and Tennessee are generally small. As we will see, Kentucky has about 27 percent of all distilling jobs and payrolls in the US. Production and sales There is no public information on annual production volume or sales by Kentucky distillers. Company‐level data on production and inventory is compiled by the KDA for its members, and total statewide barrel inventory is available from property tax filings. We can use that to make a rough estimate of production and inventory by year. The next chart summarizes our estimates for the last three decades. It shows a pattern of initially high barrel inventories, followed by declining production in the 1980s and 1990s. The industry has come back strong over the last decade, with increasing demand especially for premium products, including small batch and single barrel bourbons. Barrel inventory has returned to 1980 levels, with production adjusting annually to projected sales. The 4.7 million barrels of bourbon in warehouses in 2010 is the basis for the often‐heard statement that there are now more barrels of whiskey in Kentucky than there are residents. The chart does not reflect the approximately 300,000 barrels that are
The Distilling Industry in Kentucky 8
reused to make non‐bourbon products. The bourbon stored in warehouses may be freshly made or up to eighteen years old, or even older. We can use more internal data on barrel inventories, aggregated so as not to disclose any particular company, to estimate the vintage profile. This is shown in the next chart. One can see the steady drop‐off in inventory after four years, the most common age for bottling. About ten percent of the inventory is over six years old.
‐
1,000,000
2,000,000
3,000,000
4,000,000
5,000,000
6,000,000
1980
1981
1982
1983
1984
1985
1986
1987
1988
1989
1990
1991
1992
1993
1994
1995
1996
1997
1998
1999
2000
2001
2002
2003
2004
2005
2006
2007
2008
2009
2010
Estimated Number of Barrels of Bourbon Production, and Warehouse Inventory, Kentucky Total, Three Decades
Source: Kentucky Distillers' Association, Kentucky Department of Revenue, and authors' calculations.
Inventory
Production
The Distilling Industry in Kentucky 9
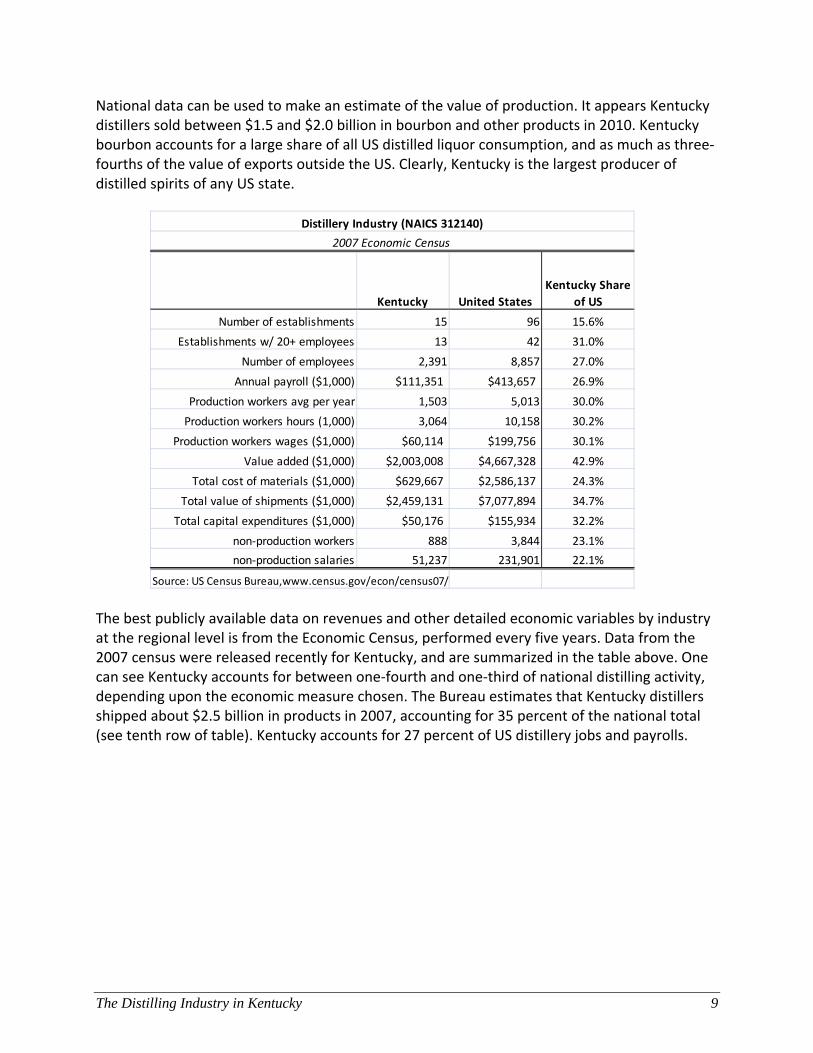
National data can be used to make an estimate of the value of production. It appears Kentucky distillers sold between $1.5 and $2.0 billion in bourbon and other products in 2010. Kentucky bourbon accounts for a large share of all US distilled liquor consumption, and as much as three‐fourths of the value of exports outside the US. Clearly, Kentucky is the largest producer of distilled spirits of any US state.
The best publicly available data on revenues and other detailed economic variables by industry at the regional level is from the Economic Census, performed every five years. Data from the 2007 census were released recently for Kentucky, and are summarized in the table above. One can see Kentucky accounts for between one‐fourth and one‐third of national distilling activity, depending upon the economic measure chosen. The Bureau estimates that Kentucky distillers shipped about $2.5 billion in products in 2007, accounting for 35 percent of the national total (see tenth row of table). Kentucky accounts for 27 percent of US distillery jobs and payrolls.
Kentucky United States
Kentucky Share
of US
Number of establishments 15 96 15.6%
Establishments w/ 20+ employees 13 42 31.0%
Number of employees 2,391 8,857 27.0%
Annual payroll ($1,000) $111,351 $413,657 26.9%
Production workers avg per year 1,503 5,013 30.0%
Production workers hours (1,000) 3,064 10,158 30.2%
Production workers wages ($1,000) $60,114 $199,756 30.1%
Value added ($1,000) $2,003,008 $4,667,328 42.9%
Total cost of materials ($1,000) $629,667 $2,586,137 24.3%
Total value of shipments ($1,000) $2,459,131 $7,077,894 34.7%
Total capital expenditures ($1,000) $50,176 $155,934 32.2%
non‐production workers 888 3,844 23.1%
non‐production salaries 51,237 231,901 22.1%
Source: US Census Bureau,www.census.gov/econ/census07/
Distillery Industry (NAICS 312140)
2007 Economic Census

The Distilling Industry in Kentucky 10
The above data reflects all economic activity of firms classified as distillers, including spirits production but also anything else the firms produce. The Census Bureau also provides estimates on a product basis rather than an industry basis, i.e., measuring sales of distilled spirits only, regardless of the primary industrial classification of the firms. These are shown in the next table, and are the most direct public measure we have of the economic value of distilled spirits sold. Note that unbottled whiskey shipments in 2007 were about $1.5 billion, and bottled whiskey shipments were about $2.0 billion. Combined, then, whiskey accounts for almost half the value of all distilled products in the US.
Domestic sales. The Distilled Spirits Council of the United States (DISCUS) tracks sales in the US, and reports there were 15.4 million cases (9‐liter) of bourbon and Tennessee whiskey sold in 20102. Tennessee whiskey shipments for US consumption account for about one‐third of that total, and thus Kentucky shipped close to 10 million cases of bourbon to US consumers. The national average revenue, including the federal excise tax of $13.50 per proof gallon, was $123 per case according to DISCUS figures. That implies that gross revenues to Kentucky distillers
2 See www.discus.org/pdf/Spirits_Category_Tables_2010.pdf for the latest data.
Product codes Meaning of product code
Product shipments,
value ($1,000)
312140 Distilleries $7,703,820
3121402 Distilled liquor, excluding brandy $2,700,196
31214022 Distilled whiskey, all other distilled liquor, excluding brandy $1,451,656
3121402211 Distilled whiskey, raw (bourban, rye, etc.) $1,387,069
3121402212 Distilled grain neutral spirits, vodka D
3121402213 Other distilled liquors excl applejack D
31214023 Distillers' dried grains (dark and light) and dried solubles $950,824
3121402351 Distillers' dried grains (dark and light) and dried solubles $950,824
3121402Y Distilled liquor, excluding brandy, nsk $297,716
3121402YWV Distilled liquor, excluding brandy, nsk $297,716
3121404 Bottled liquor, excluding brandy $4,837,337
3121404A Bottled liquor, all other types, excl brandy $4,339,801
3121404A11 Bottled whiskey, unprocessed, blends, with(out) neutral spirits $449,053
3121404A12 Bottled whiskey, other types $1,566,098
3121404A13 Bottled gin, cordials, cocktails and similar compounds $494,979
3121404A14 Bottled gin, vodka, rum $848,993
3121404A15 Bottled liquor, all other types, excluding bottled in bond D
3121404A16 Bottled liquor, bottled in bond D
Source: US Census Bureau, 2007 Economic Census.
D: not disclosed due to federal privacy laws; nsk: 'not specified by kind'
US Shipments, by Detailed Distilled Products, 2007

The Distilling Industry in Kentucky 11
from US sales of bourbon were around $1.2 billion in 2010. Kentucky distillers also produce other distilled spirits, like vodka, cocktails, and cordials. But since these are not unique to Kentucky as is bourbon, it is impossible to determine from published figures how much of national shipments originate in Kentucky. Kentucky consumers make up a very small fraction of annual consumption. According to DISCUS estimates, Kentucky consumed 5.7 million wine gallons of distilled spirits, out of a US total consumption of 462 million3. That fraction, 1.2 percent, is almost identical to Kentucky’s share of the US population. According to DISCUS, case sales in the US of bourbon and Tennessee whiskey have grown by 8 percent over the past five years, and gross revenues from those sales have grown by 23 percent. This reflects the continuing shift towards more high end products, as the average revenue per case rose from $112 to $123 between 2005 and 2010. Exports. DISCUS reports that bourbon accounts for $768 million of the total of $1,157 million in distilled spirits exports in 2010. By volume, Kentucky bourbon is by far the biggest export among US distilled spirits, accounting for 28.7 of the 61.5 million proof gallons shipped for all spirits categories in 20104. The biggest importers of bourbon are Germany, Australia, United Kingdom, Japan, New Zealand, and France, which combined account for 73 percent of the total US exports of bourbon. Interestingly, about 56 percent of bourbon exports are in bulk, rather than bottled. Indeed, bulk shipments dominate exports to far away Australia and New Zealand ‐ where presumably it is more cost effective to bottle the product close to consumers than to pay the freight on the bottles shipped around the world.
3 See www.discus.org/pdf/DS_Sales_Volume_December_2010_Preliminary.PDF . 4 For a detailed listing of bourbon shipments by volume and value to each of 126 countries, see the DISCUS web
site and their annual report: www.discus.org/pdf/Distilled_Spirits_Exports_Volume_Dec2010.rtf , and www.discus.org/pdf/Distilled_Spirits_Exports_Value_Dec2010.rtf.

The Distilling Industry in Kentucky 12
Employment and payrolls The 2007 Economic Census, discussed above, provides a detailed snapshot of employment and payroll for distilling establishments in Kentucky. However, there are more current and high frequency measures for employment and wages at the state level, and we examine that history in this section. We have compiled data from many sources, including the Kentucky Directory of Manufacturers, County Business Patterns (CBP), and the Quarterly Census of Employment and Wages (QCEW), as well as internal data provided by the companies. The most comprehensive and consistent data sets are those from QCEW and CBP, and those estimates are shown in the accompanying tables. Note that the number of distilling establishments is almost the same from the two sources, but the employment counts and payroll estimates are quite different. We believe the difference is due to the treatment of some corporate headquarters activity, with the QCEW program including it and CBP excluding it. The large difference in payrolls is consistent with this explanation, since corporate office employees typically have advanced educational credentials and skills, and thus earn much higher incomes than production workers.
Year
Establish‐
ments Employees
Wages and
Salaries
($1000)
1990 16 3,151 $109,381
1991 16 3,210 $119,196
1992 16 3,296 $125,065
1993 16 3,263 $111,177
1994 16 3,068 $126,399
1995 16 3,005 $129,645
1996 18 2,987 $140,245
1997 18 2,978 $147,118
1998 18 2,971 $146,494
1999 18 2,992 $145,717
2000 16 2,974 $156,149
2001 16 2,945 $156,644
2002 16 2,896 $156,832
2003 14 2,907 $168,222
2004 15 2,949 $179,753
2005 15 3,005 $203,317
2006 15 3,062 $225,437
2007 16 3,167 $236,527
2008 17 3,168 $243,959
2009 17 3,100 $225,594
2010 17 3,102 $245,663
Kentucky Distilling Industry ‐ QCEW
Source: US Bureau of Labor Statistics, Quarterly
Census of Employment and Wages program, for
NAICS industry 31214.
Year
Establish‐
ments Employees
Total Wages
and Salaries
($1000)
1993 18 2,488 $86,176
1994 17 2,232 $73,415
1995 16 2,198 $72,932
1996 16 2,109 $74,456
1997 16 2,140 $75,439
1998 16 2,092 $76,375
1999 15 2,077 $77,176
2000 15 1,977 $81,121
2001 15 1,927 $79,331
2002 15 2,075 $87,833
2003 16 2,042 $87,975
2004 15 2,144 $103,086
2005 15 2,047 $99,498
2006 16 2,207 $103,967
2007 14 1,681 $81,081
2008 17 2,209 $117,439
2009 16 1,903 $104,575
Kentucky Distilling Industry ‐ CBP
Source: US Census Bureau, County Business Patterns
program, for NAICS industry 31214.

The Distilling Industry in Kentucky 13
The latest Kentucky Directory of Manufacturers reports 18 establishments with a total of 2,998 jobs under the distillery industry classification. This is closer to the QCEW estimate. The differences may be due to the fact that some cooperage (wooden barrel making) operations are located in a different location than the distilling operations, and thus get counted under a wood products industrial classification even though the workers are employees of a distillery company. We take the QCEW estimates as the most comprehensive, and use it in our impact analysis later in the report. The industry thus directly supports 3,102 employees with an annual payroll of $246 million, excluding fringe benefits. However, the total includes both manufacturing operations and some separate headquarters operations. These two activities have very different linkages with the rest of the economy. We created a split into two industries for modeling purposes. We estimate that in 2010 the distilling (manufacturing) industry (NAICS 31214) employs 1,904 persons with payroll of $114 million; and that the management of companies industry (NAICS 551114) employs 1,198 persons with payroll of $132 million. Office jobs. The most visible aspects of the industry in Kentucky are the distilling operations and the large warehouses used for aging bourbon in barrels. The production side of the business accounts for around two‐thirds of the jobs in Kentucky. However, as suggested above, there are hundreds of office jobs in the state as well. These include many highly paid executives, professionals and managers. One of Kentucky’s ten Fortune 1000 corporate headquarters is Brown‐Forman Corporation, based in Louisville5. The company has about $2.5 billion in revenues, and the corporate headquarters manages worldwide production, distribution, and marketing for the company and its many brands. The headquarters attracts many talented and highly educated workers to Louisville. And the corporate and family foundations associated with the company are ostensibly the largest donors to arts and cultural organizations in Kentucky. Other companies with a significant office presence, as indicated by a corporate headquarters operation in the Kentucky Directory of Manufacturers, include Beam Brands and Heaven Hill. Cyclical stability The distilling industry in Kentucky is much more stable in terms of employment than the manufacturing industry as a whole. This is especially clear over the current decade and recession. Distilling industry employment is up 4 percent this decade while other manufacturing industry employment is down 33 percent. The chart illustrates this, setting employment levels in the year 2000 as the base. Kentucky manufacturing overall has shed 100,000 net jobs since its peak in 2000, falling from 310,000 to 210,000, while the distilling sub‐industry has grown slightly in terms of employment. Distilling’s share of all manufacturing jobs in the state has risen to about 1.5 percent, while its share of all wages and salaries among Kentucky manufacturing has risen to about 2.4 percent. Alcoholic beverages are known to be fairly recession‐proof.
5 The others are Humana, Yum Brands, Ashland, Omnicare, General Cable, Kindred Healthcare, Lexmark
International, Pharmerica, and Res‐Care. See Fortune Magazine, May 3, 2011. Brown‐Forman ranks 729th nationally in terms of 2010 revenues.

The Distilling Industry in Kentucky 14
Kentucky bourbon sales have held up well during the latest downturn, and this has helped mitigate the economic and fiscal impact of the global recession on Kentucky.
60
70
80
90
100
110
120
2000 2001 2002 2003 2004 2005 2006 2007 2008 2009 2010
2000
employm
ent = 100
Employment Growth, Distilling and Other Manufacturing IndustriesLast Decade
Distilling
Other manufacturing
Source: US Bureau of Labor Statistics, Quarterly Census of Employment and Wages program.
The Distilling Industry in Kentucky 15
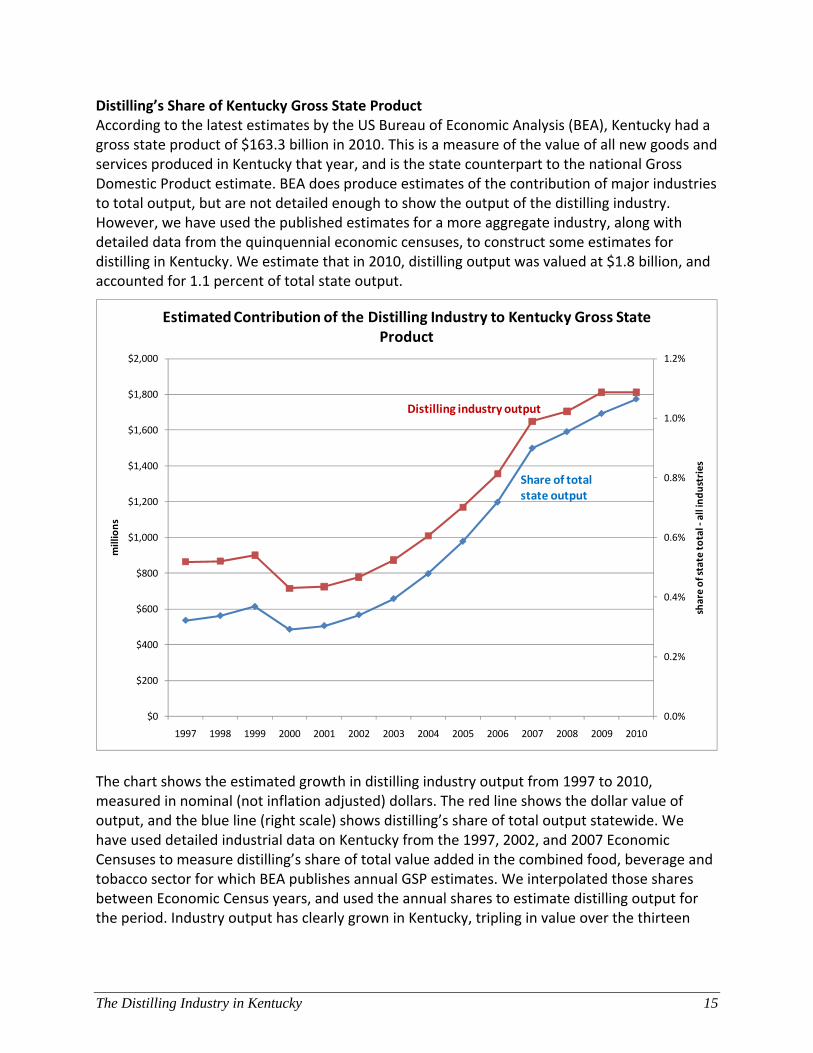
Distilling’s Share of Kentucky Gross State Product According to the latest estimates by the US Bureau of Economic Analysis (BEA), Kentucky had a gross state product of $163.3 billion in 2010. This is a measure of the value of all new goods and services produced in Kentucky that year, and is the state counterpart to the national Gross Domestic Product estimate. BEA does produce estimates of the contribution of major industries to total output, but are not detailed enough to show the output of the distilling industry. However, we have used the published estimates for a more aggregate industry, along with detailed data from the quinquennial economic censuses, to construct some estimates for distilling in Kentucky. We estimate that in 2010, distilling output was valued at $1.8 billion, and accounted for 1.1 percent of total state output.
The chart shows the estimated growth in distilling industry output from 1997 to 2010, measured in nominal (not inflation adjusted) dollars. The red line shows the dollar value of output, and the blue line (right scale) shows distilling’s share of total output statewide. We have used detailed industrial data on Kentucky from the 1997, 2002, and 2007 Economic Censuses to measure distilling’s share of total value added in the combined food, beverage and tobacco sector for which BEA publishes annual GSP estimates. We interpolated those shares between Economic Census years, and used the annual shares to estimate distilling output for the period. Industry output has clearly grown in Kentucky, tripling in value over the thirteen
0.0%
0.2%
0.4%
0.6%
0.8%
1.0%
1.2%
$0
$200
$400
$600
$800
$1,000
$1,200
$1,400
$1,600
$1,800
$2,000
1997 1998 1999 2000 2001 2002 2003 2004 2005 2006 2007 2008 2009 2010
share of state total ‐all industries
millio
ns
Estimated Contribution of the Distilling Industry to Kentucky Gross State Product
Distilling industry output
Share of total state output
The Distilling Industry in Kentucky 16
years. And, its share of total state product has increased from 0.5 to 1.1 percent, more than doubling in importance to state overall economic activity.
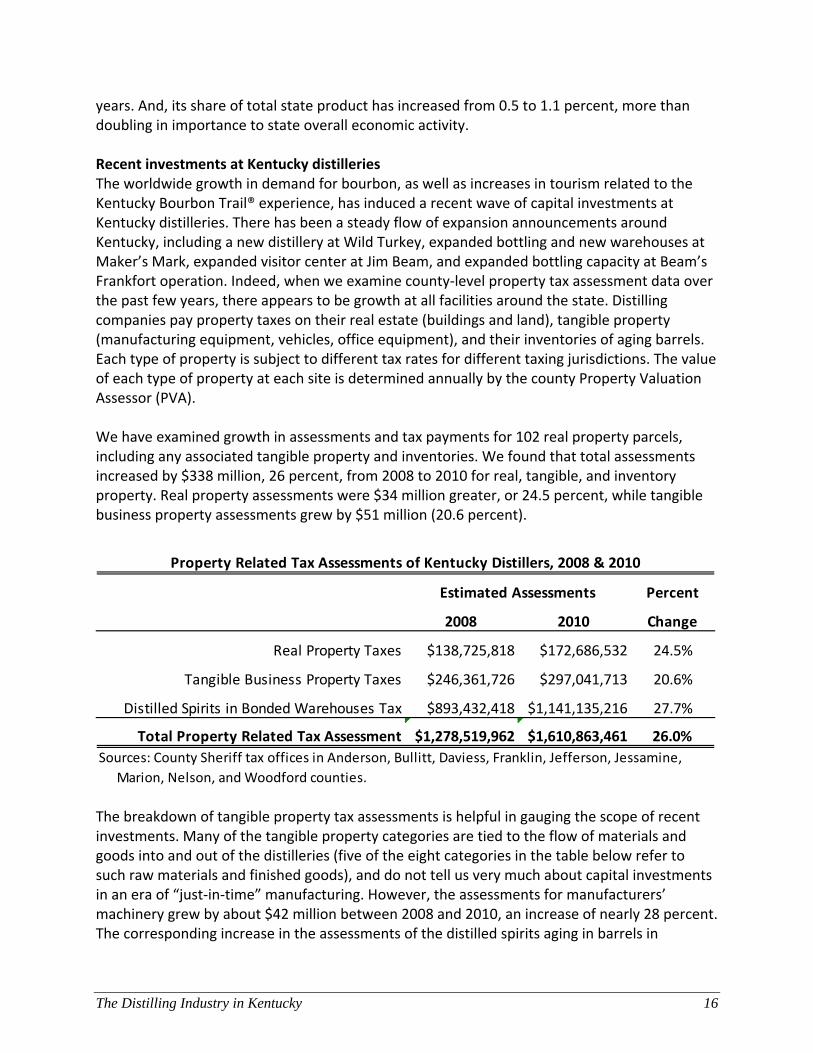
Recent investments at Kentucky distilleries The worldwide growth in demand for bourbon, as well as increases in tourism related to the Kentucky Bourbon Trail® experience, has induced a recent wave of capital investments at Kentucky distilleries. There has been a steady flow of expansion announcements around Kentucky, including a new distillery at Wild Turkey, expanded bottling and new warehouses at Maker’s Mark, expanded visitor center at Jim Beam, and expanded bottling capacity at Beam’s Frankfort operation. Indeed, when we examine county‐level property tax assessment data over the past few years, there appears to be growth at all facilities around the state. Distilling companies pay property taxes on their real estate (buildings and land), tangible property (manufacturing equipment, vehicles, office equipment), and their inventories of aging barrels. Each type of property is subject to different tax rates for different taxing jurisdictions. The value of each type of property at each site is determined annually by the county Property Valuation Assessor (PVA). We have examined growth in assessments and tax payments for 102 real property parcels, including any associated tangible property and inventories. We found that total assessments increased by $338 million, 26 percent, from 2008 to 2010 for real, tangible, and inventory property. Real property assessments were $34 million greater, or 24.5 percent, while tangible business property assessments grew by $51 million (20.6 percent).
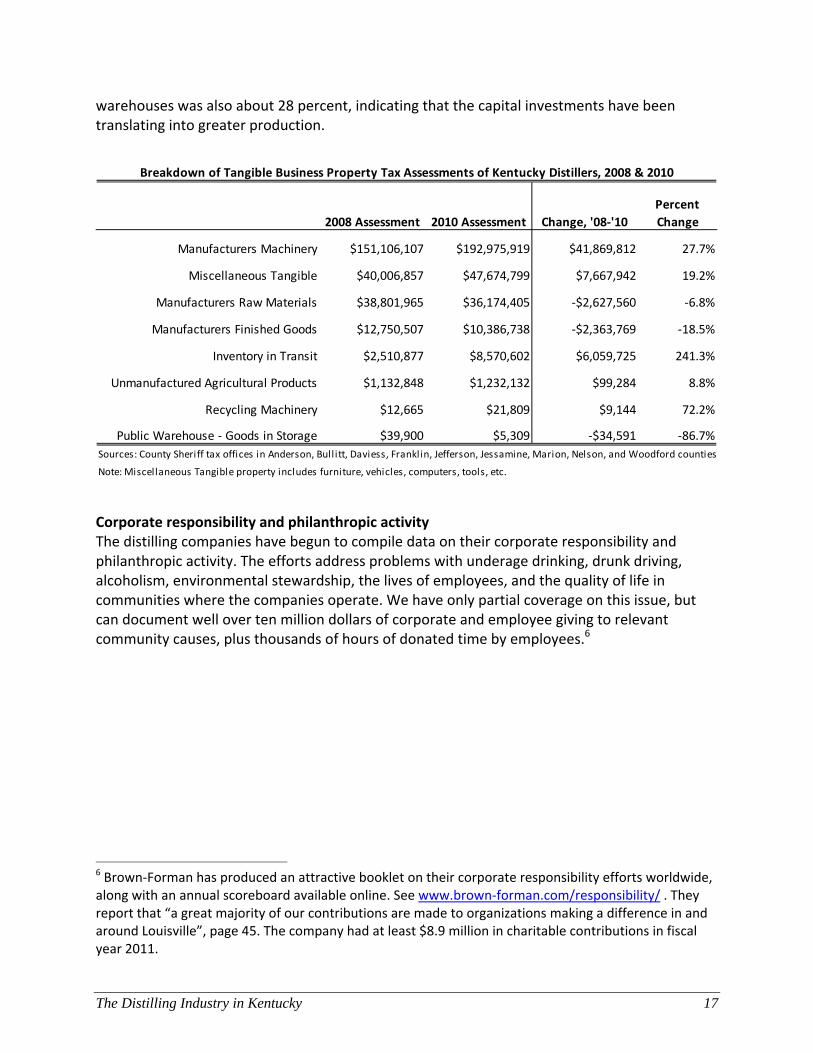
The breakdown of tangible property tax assessments is helpful in gauging the scope of recent investments. Many of the tangible property categories are tied to the flow of materials and goods into and out of the distilleries (five of the eight categories in the table below refer to such raw materials and finished goods), and do not tell us very much about capital investments in an era of “just‐in‐time” manufacturing. However, the assessments for manufacturers’ machinery grew by about $42 million between 2008 and 2010, an increase of nearly 28 percent. The corresponding increase in the assessments of the distilled spirits aging in barrels in
Percent
2008 2010 Change
Real Property Taxes $138,725,818 $172,686,532 24.5%
Tangible Business Property Taxes $246,361,726 $297,041,713 20.6%
Distilled Spirits in Bonded Warehouses Tax $893,432,418 $1,141,135,216 27.7%
Total Property Related Tax Assessment $1,278,519,962 $1,610,863,461 26.0%
Sources: County Sheriff tax offices in Anderson, Bullitt, Daviess, Franklin, Jefferson, Jessamine,
Marion, Nelson, and Woodford counties.
Property Related Tax Assessments of Kentucky Distillers, 2008 & 2010
Estimated Assessments
The Distilling Industry in Kentucky 17
warehouses was also about 28 percent, indicating that the capital investments have been translating into greater production.
Corporate responsibility and philanthropic activity The distilling companies have begun to compile data on their corporate responsibility and philanthropic activity. The efforts address problems with underage drinking, drunk driving, alcoholism, environmental stewardship, the lives of employees, and the quality of life in communities where the companies operate. We have only partial coverage on this issue, but can document well over ten million dollars of corporate and employee giving to relevant community causes, plus thousands of hours of donated time by employees.6
6 Brown‐Forman has produced an attractive booklet on their corporate responsibility efforts worldwide, along with an annual scoreboard available online. See www.brown‐forman.com/responsibility/ . They report that “a great majority of our contributions are made to organizations making a difference in and around Louisville”, page 45. The company had at least $8.9 million in charitable contributions in fiscal year 2011.
2008 Assessment 2010 Assessment Change, '08‐'10
Percent
Change
Manufacturers Machinery $151,106,107 $192,975,919 $41,869,812 27.7%
Miscellaneous Tangible $40,006,857 $47,674,799 $7,667,942 19.2%
Manufacturers Raw Materials $38,801,965 $36,174,405 ‐$2,627,560 ‐6.8%
Manufacturers Finished Goods $12,750,507 $10,386,738 ‐$2,363,769 ‐18.5%
Inventory in Transit $2,510,877 $8,570,602 $6,059,725 241.3%
Unmanufactured Agricultural Products $1,132,848 $1,232,132 $99,284 8.8%
Recycling Machinery $12,665 $21,809 $9,144 72.2%
Public Warehouse ‐ Goods in Storage $39,900 $5,309 ‐$34,591 ‐86.7%
Sources: County Sheriff tax offices in Anderson, Bullitt, Daviess, Franklin, Jefferson, Jessamine, Marion, Nelson, and Woodford counties
Note: Miscellaneous Tangible property includes furniture, vehicles, computers, tools, etc.
Breakdown of Tangible Business Property Tax Assessments of Kentucky Distillers, 2008 & 2010

The Distilling Industry in Kentucky 18
Economic Impacts e characterized Kentucky’s distilling industry in the first section of this report, with estimates of production, sales, jobs and payrolls. In the parlance of economic impact studies, these are called the direct impacts. Of course, the impacts do not end there.
Because the products are purchased primarily by consumers outside the state, the industry brings in new dollars to Kentucky, dollars that recirculate among vendors, employees and households. We turn to these spinoff impacts in this section, and aggregate all components to a total economic impact estimate. Linkages to other sectors We use a custom input‐output model of Kentucky to investigate the linkages between the distilling industry and other industries in the state. Input‐output models are the standard method for measuring sales among industries. Our IMPLAN model of Kentucky has details on 440 industries, and can predict how much each industry buys from every other industry in the state, as well as how much must be imported from outside the state to support a given level of production7. The accompanying table summarizes the predicted makeup of purchases to support distilling in Kentucky. It shows that distillers purchase about 28 cents of goods and services for every dollar of distilling output, about 9 cents of labor services, 26 cents for dividend, interest and rent payments, and an amazing 60 cents in tax payments.
7 For documentation, see www.implan.com .
W
Commodities
purchases per $1 million of
Distillery OutputDistilled liquors except brandies $85,355
Wholesale trade distribution services $73,181Glass containers $21,403
Management of companies and enterprises $14,895Wood containers and pallets $13,863
Grains $12,780Truck transportation services $9,833
Plastics bottles $7,810Paperboard containers $7,245
Wine and brandies $5,042Machined products $3,122
Rail transportation services $3,083Natural gas, and distribution services $2,271
Electricity, and distribution services $1,819Used and secondhand goods $1,676
Flour and malt $1,573Scientific research and development services $1,497
Advertising and related services $1,379Motor vehicle parts $1,192
Material handling equipment $1,127Real estate buying and selling, leasing, managing, and related services $1,058
Water transportation services $979Other fabricated metals $959Paperboard from pulp $595
Petroleum lubricating oils and greases $587Turned products and screws, nuts, and bolts $585
All other chemical products and preparations $544Warehousing and storage services $541
Automotive equipment rental and leasing services $535Refined petroleum products $512
Services to buildings and dwellings $462Employment services $403Telecommunications $383
Maintained and repaired nonresidential structures $377Other electronic components $363
Tires $327Commercial and industrial machinery and equipment repairs and maintenance $251
Automotive repair and maintenance services, except car washes $249Legal services $216
Subtotal $280,072
Other commodities not shown $1,984Total intermediate purchases $282,056
Employee compensation $89,474Proprietors' income $3,865
Other property-type income (dividends, interest rent) $26,362Indirect business taxes $598,241Total value of output $1,000,000
Production Function for Kentucky Distilling Industry
Source: IMPLAN input-output model of Kentucky, version 3, using 2009 economic data, August 2011.

The Distilling Industry in Kentucky 19
These commodities purchased by the distilling industry, as well as the household income created, are the basis for economic multipliers. Output in one industry lifts output in supporting industries, which in turn raises output in industries that support them. Generally speaking, the more an industry purchases in the state the larger the spinoff impacts of that industry’s activity. The more it imports its raw materials and services, the smaller the spinoffs in the state. It is insightful to think of an input‐output table as a set of production recipes, with each industry column showing how much must be purchased from each row industry to produce its annual output. For example, the distilling industry nationally is a large purchaser of glass containers, grain, wood containers and pallets, plastic bottles, truck transportation, and cardboard. These are identified from national industry surveys, with the latest detailed tables available on the website of the US Bureau of Economic Analysis (www.bea.gov/industry/index.htm#benchmark_io). These national tables are ‘regionalized’ by IMPLAN using economic data on the presence and size of industries at the state, MSA, or county level as needed. The resulting regional models and industry multipliers take account of the ability of the regional economy to supply inputs to each industry. In the case of distilling, for example, IMPLAN predicts that most of the plastic bottles needed by the industry can be supplied by Kentucky firms, but that none of the glass bottles can be supplied in‐state. The glass bottles must be imported, with the result that those purchasing dollars leak out to other states (or countries). IMPLAN includes the value of fringe benefits (employee provided social security and medicare taxes, unemployment insurance and workers’ compensation premiums, health insurance, pension contributions, etc) in its compensation estimate, estimating that fringes add about 57 percent to direct wages and salaries. The distilling industry’s purchases of intermediate goods and services in Kentucky, as well as its payments to workers and owners in the state, cause rounds of re‐spending across other industries. The interindustry impacts are often referred to as ‘indirect’ effects, since changes in activity at distillers will quickly cause changes in activity at suppliers. The household spending impacts are often referred to as ‘induced’ effects, since changes in industrial production ultimately also hit the regional economy through employees’ wages and the associated spending on goods and services. At each round of re‐spending, a portion of the dollars leak out due to saving, purchases of imported goods, and tax payments, so that the re‐spending ultimately goes to zero. The cumulative impact of the re‐spending is measured in economic multipliers, which are the ratio of total economic activity to activity in the distilling industry. Economic multipliers The next table provides a summary of important economic multipliers for the distilling industry in Kentucky, with separate calculations for the production side and the corporate headquarters side. The first entry is the job multiplier for distilling, 3.19. This means that if the distilling industry adds an employee, there will be another 2.19 jobs supported elsewhere in Kentucky. About seventy percent of the spinoff impact is due to additional employees among industries that supply distillers, and the rest is due to new employees in retail and other industries that

The Distilling Industry in Kentucky 20
sell to households. This is a large multiplier compared to most other Kentucky industries. Given that (a) almost all distillery products are purchased by out‐of‐state residents and (b) the distilling firms could be located in other states, it is valid to apply this multiplier to entire industry employment base. In other words, it is valid to say that the 1,904 employees primarily involved in production at Kentucky distilling companies support a total of 6,075 jobs statewide.
A similar interpretation can be given to the employee compensation multiplier. The distilling industry’s production‐related payroll of $114 million supports total statewide payroll of $220 million. This represents the wages and salaries, exclusive of fringe benefits, in Kentucky that would disappear if the distilling industry relocated to another state. The reader may be wondering why the output multiplier is much lower than the job and compensation multipliers. The primary reason is that a very large part of the value of distilling output goes to taxes. Thus, if the value of distilling output were to rise by, say, $10 million, around half of that amount is captured in taxes, leaving the remainder to circulate in the private economy where it can generate sales for supplying industries. Total economic impact of distillery company operations In summary, the direct jobs and payroll of distillers and their corporate office activity leads to a total of around 8,700 jobs, with annual payroll of $413 million. This is an estimate of what would happen in the state in the unlikely event that the distilling industry completely disappeared. Since input‐output models are by design linear and symmetric, one can use the economic multipliers (in the more likely case) to estimate the total impact of incremental growth or decline in distilling activity.
Distilling
Corporate
Headquarters
Change in total jobs in Kentucky per job in
industry3.190 2.183
Change in total employee compensation in
Kentucky per employee compensation in
industry
1.929 1.468
Change in value of output among all Kentucky
firms per change in output in industry1.288 1.685
Economic Multipliers, Distilling Companies in Kentucky
Source: IMPLAN Professional model of Kentucky, version 3, using 2009 economic
data.

The Distilling Industry in Kentucky 21
Importance of distilling compared to other industries in Kentucky Our IMPLAN model of Kentucky contains detailed estimates of output, employment, payroll, and value added for 440 detailed industries in the state. We can use those estimates to make some observations about the relative importance of the distilling industries. First, consider manufacturing. IMPLAN provides details for 278 detailed manufacturing industries, of which 244 have operations in Kentucky. Distilling ranks 9th highest in terms of jobs and 21st highest in terms of employment multipliers. Moreoever, most of the industries with very high multipliers have few employees and hence are not that significant. The only manufacturing industries with both more jobs and a higher employment multiplier are automobiles, light truck and utility vehicles, and meatpacking. A few smaller industries have higher estimated multipliers, for example petroleum refining and organic chemicals. Motor vehicle parts production has by far the most employees, but its multiplier is only 2.22, compared to distilling’s multiplier of 3.19. Most of the other detailed industries outside of manufacturing are in retail trade, personal services, health care, education, and other enterprises that primarily serve the local market – and hence are not typically considered as economic development targets. However, there are several non‐manufacturing industries that receive considerable public attention and it is interesting to compare their impacts to that of distilling. Our IMPLAN model estimates that tobacco farming directly supports 12,500 jobs, but has an employment multiplier of only 1.255. Animal production, except cattle and poultry – an industry that includes pig and hog operations, horse farms, and other animal categories – employees 31,992, but has an employment multiplier of only 1.190. And coal mining employs 19,766, but has an employment multiplier of but 2.205. The courier and messenger industry, which includes UPS, Kentucky’s largest private employer, has direct employment of 28,431, but its employment multiplier is only 1.804.
Distilling Headquarters Total
Direct
Jobs 1,904 1,198 3,102
Payroll $113,878,065 $131,784,935 $245,663,000
Total: Direct plus Indirect plus Induced
Jobs 6,075 2,615 8,690
Payroll $219,615,823 $193,415,328 $413,031,151
Annual Economic Impact of Distilling Companies in Kentucky

The Distilling Industry in Kentucky 22
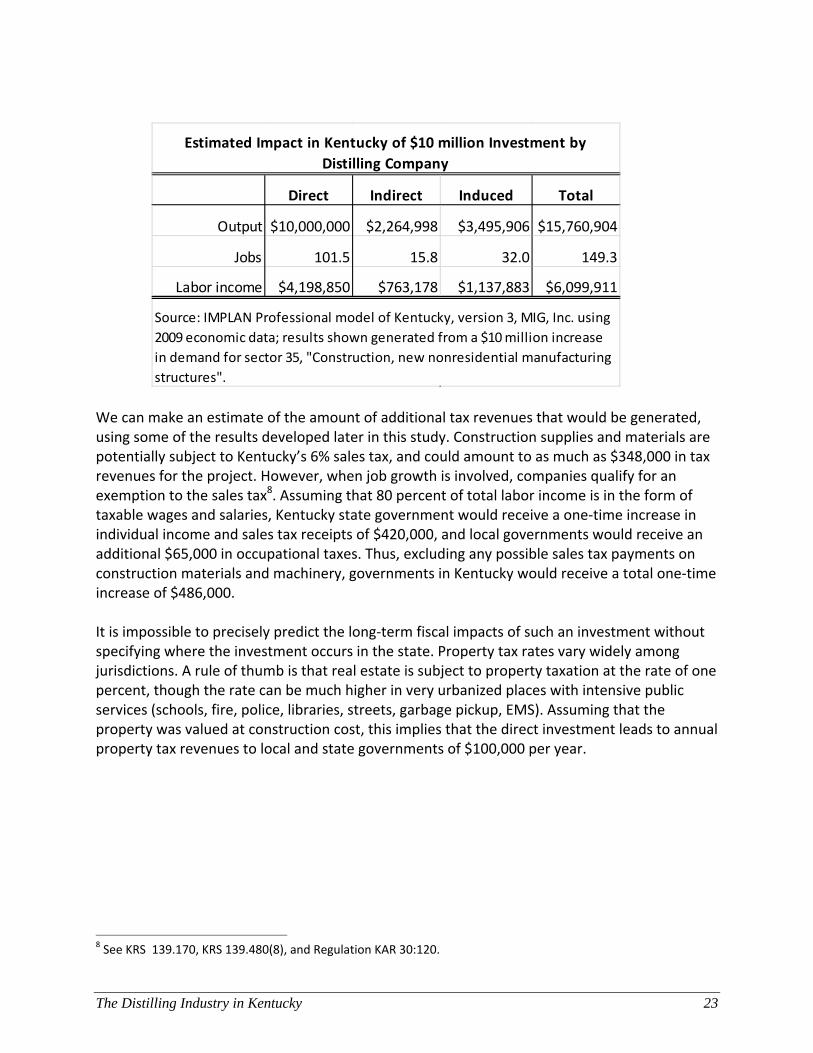
Impact of construction activity Distillery companies have invested billions of dollars in their facilities and equipment over the decades. This is evident from the large property tax payments they make to government jurisdictions each year, a topic we examine in the next section. Here we analyze the one‐time economic impacts of a hypothetical $10 million distillery construction project. Our estimates can be scaled up or down according to the size of the investment under consideration. We use our IMPLAN model of Kentucky to perform the analysis. The model has a sector, number 35, entitled “Construction, new nonresidential manufacturing” that fits this question. We simulated a $10 million increase in demand for that sector, and the model predicted the impacts on business output, jobs, and payrolls. The results are shown in the table below. The first column indicates that the investment is associated with 102 direct construction jobs, with labor income of $4.2 million. The indirect impacts refer to interindustry linkages, wherein the construction project requires purchases from other companies in Kentucky. The induced impacts refer to the cumulative rounds of household spending caused by the increased income flowing to employees. The last column summarizes the total impacts. The $10 million project leads to an increase in sales of about $15.8 million for all Kentucky firms, and increase in jobs of 149, and an increase in labor income statewide of $6.1 million.
0.00
0.50
1.00
1.50
2.00
2.50
3.00
3.50
4.00
4.50
5.00
Light truck and utility vehicle
mfg
Automobile mfg Distilleries Motor vehicle parts mfg
Coal mining Couriers and messengers
Hotels and motels
Tobacco farming Animal production,
except cattle and
poultry and eggs
Employment Multipliers, Selected Industries in Kentucky
Source: IMPLAN input‐output model of Kentucky, version 3, using 2009 economic data. Multipliers refer to SAM‐type, which measure the total jobs in the state per per job in the respective industry.
The Distilling Industry in Kentucky 23
We can make an estimate of the amount of additional tax revenues that would be generated, using some of the results developed later in this study. Construction supplies and materials are potentially subject to Kentucky’s 6% sales tax, and could amount to as much as $348,000 in tax revenues for the project. However, when job growth is involved, companies qualify for an exemption to the sales tax8. Assuming that 80 percent of total labor income is in the form of taxable wages and salaries, Kentucky state government would receive a one‐time increase in individual income and sales tax receipts of $420,000, and local governments would receive an additional $65,000 in occupational taxes. Thus, excluding any possible sales tax payments on construction materials and machinery, governments in Kentucky would receive a total one‐time increase of $486,000. It is impossible to precisely predict the long‐term fiscal impacts of such an investment without specifying where the investment occurs in the state. Property tax rates vary widely among jurisdictions. A rule of thumb is that real estate is subject to property taxation at the rate of one percent, though the rate can be much higher in very urbanized places with intensive public services (schools, fire, police, libraries, streets, garbage pickup, EMS). Assuming that the property was valued at construction cost, this implies that the direct investment leads to annual property tax revenues to local and state governments of $100,000 per year.
8 See KRS 139.170, KRS 139.480(8), and Regulation KAR 30:120.
Direct Indirect Induced Total
Output $10,000,000 $2,264,998 $3,495,906 $15,760,904
Jobs 101.5 15.8 32.0 149.3
Labor income $4,198,850 $763,178 $1,137,883 $6,099,911
Estimated Impact in Kentucky of $10 million Investment by
Distilling Company
Source: IMPLAN Professional model of Kentucky, version 3, MIG, Inc. using
2009 economic data; results shown generated from a $10 million increase
in demand for sector 35, "Construction, new nonresidential manufacturing
structures".
The Distilling Industry in Kentucky 24
Taxation and Fiscal Impacts of the Industry n this section, we investigate and document the large amounts of tax revenues paid directly and indirectly by the industry to state and local governments in Kentucky. There are many types of taxes that distillers and liquor consumers pay, and the taxes go to many different
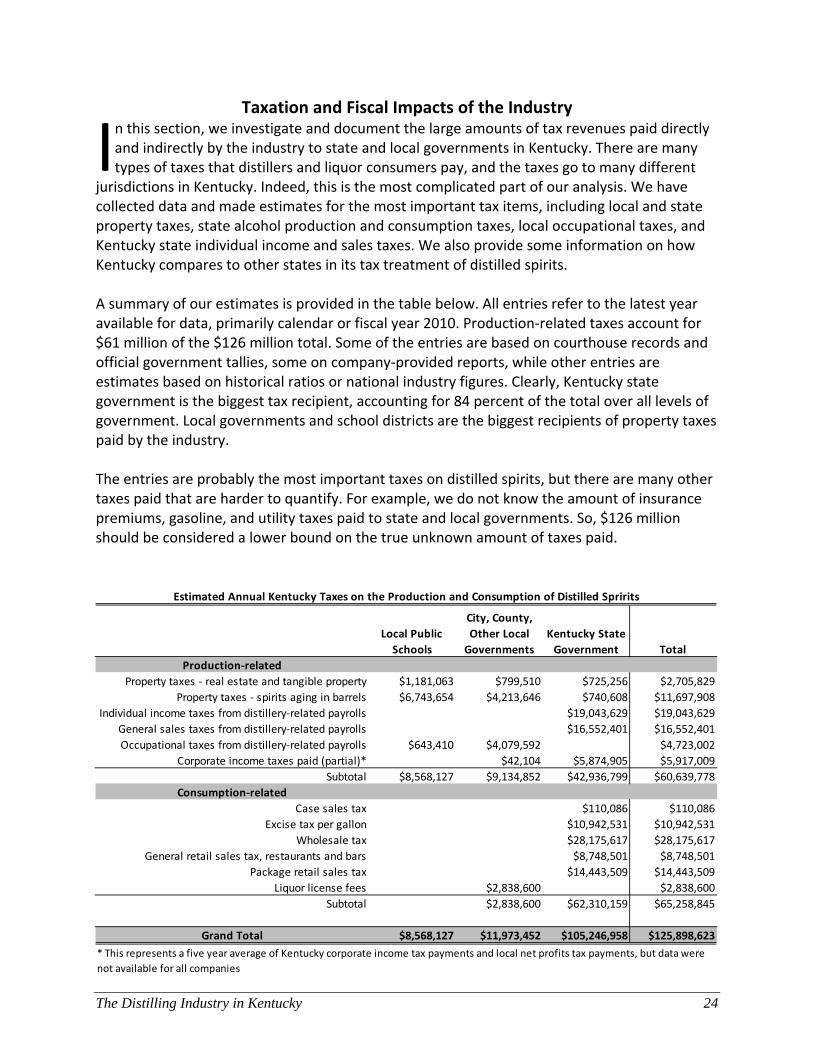
jurisdictions in Kentucky. Indeed, this is the most complicated part of our analysis. We have collected data and made estimates for the most important tax items, including local and state property taxes, state alcohol production and consumption taxes, local occupational taxes, and Kentucky state individual income and sales taxes. We also provide some information on how Kentucky compares to other states in its tax treatment of distilled spirits. A summary of our estimates is provided in the table below. All entries refer to the latest year available for data, primarily calendar or fiscal year 2010. Production‐related taxes account for $61 million of the $126 million total. Some of the entries are based on courthouse records and official government tallies, some on company‐provided reports, while other entries are estimates based on historical ratios or national industry figures. Clearly, Kentucky state government is the biggest tax recipient, accounting for 84 percent of the total over all levels of government. Local governments and school districts are the biggest recipients of property taxes paid by the industry. The entries are probably the most important taxes on distilled spirits, but there are many other taxes paid that are harder to quantify. For example, we do not know the amount of insurance premiums, gasoline, and utility taxes paid to state and local governments. So, $126 million should be considered a lower bound on the true unknown amount of taxes paid.
I
Local Public
Schools
City, County,
Other Local
Governments
Kentucky State
Government Total
Production‐related
Property taxes ‐ real estate and tangible property $1,181,063 $799,510 $725,256 $2,705,829
Property taxes ‐ spirits aging in barrels $6,743,654 $4,213,646 $740,608 $11,697,908
Individual income taxes from distillery‐related payrolls $19,043,629 $19,043,629
General sales taxes from distillery‐related payrolls $16,552,401 $16,552,401
Occupational taxes from distillery‐related payrolls $643,410 $4,079,592 $4,723,002
Corporate income taxes paid (partial)* $42,104 $5,874,905 $5,917,009
Subtotal $8,568,127 $9,134,852 $42,936,799 $60,639,778
Consumption‐related
Case sales tax $110,086 $110,086
Excise tax per gallon $10,942,531 $10,942,531
Wholesale tax $28,175,617 $28,175,617
General retail sales tax, restaurants and bars $8,748,501 $8,748,501
Package retail sales tax $14,443,509 $14,443,509
Liquor license fees $2,838,600 $2,838,600
Subtotal $2,838,600 $62,310,159 $65,258,845
Grand Total $8,568,127 $11,973,452 $105,246,958 $125,898,623
Estimated Annual Kentucky Taxes on the Production and Consumption of Distilled Spririts
* This represents a five year average of Kentucky corporate income tax payments and local net profits tax payments, but data were
not available for all companies

The Distilling Industry in Kentucky 25
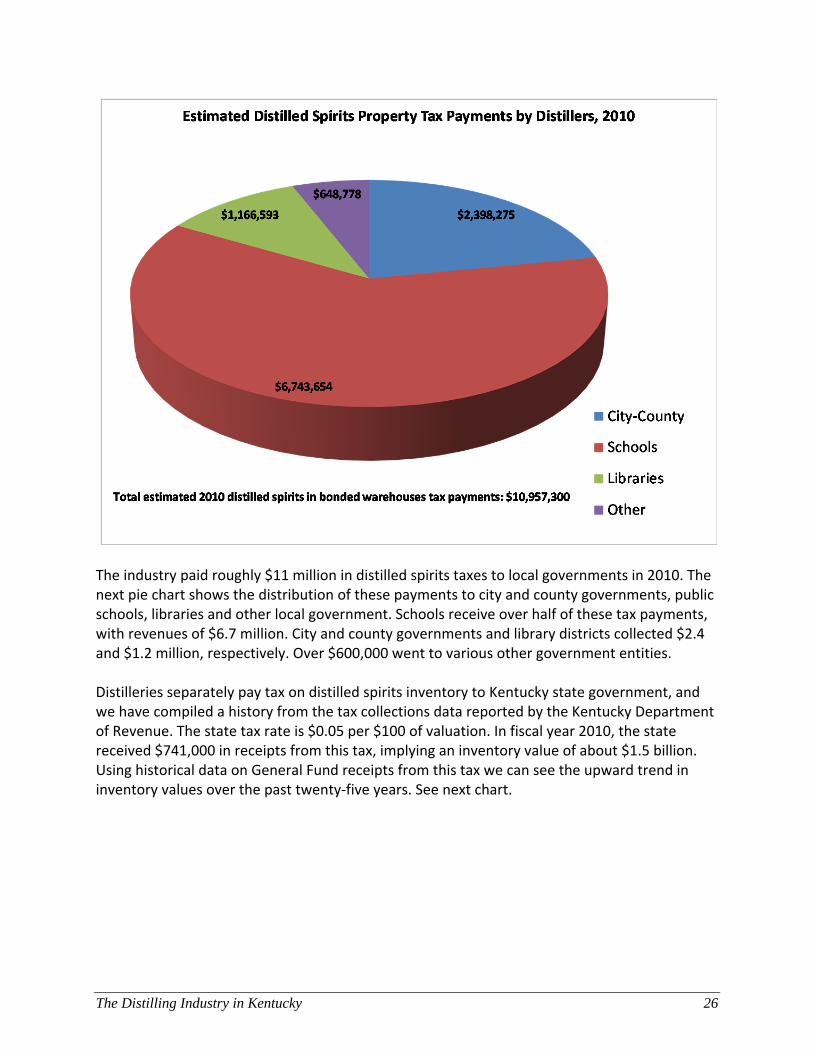
Property taxes A distillery may pay property taxes on its land and buildings to the local school system, the county government, the city government, a fire district, a library, health or agricultural district, and the state of Kentucky. They also pay tangible property taxes to those jurisdictions on the value of machinery, furniture, vehicles, and the distilled spirits in warehouses. We have attempted to track down the various properties owned by the distillery companies, and to organize public information on their tax bills in 2010. We used a combination of web searches, courthouse visits and phone calls to collect data on assessments and taxes paid. We were able to identify a total of about $2.7 million paid to local and state governments. The assessed value of land, buildings, equipment, and inventory (ready to sell) was $470 million, of which $173 million was real estate and $297 million was tangible property. The pie chart shows the distribution of taxes paid by jurisdiction type. Public schools are the biggest recipient of property tax payments, with revenues of about $1,181,000. Kentucky state government is next, with $725,000, followed by city and county governments with nearly $550,000. The ‘Other’ category includes property tax revenues received by local health departments, agricultural extension offices, soil conservation districts, fire districts, and an air board.
The distillery industry also pays property tax on all of their bourbon aging in barrels sitting in bonded warehouses. The tax payments are substantial, most of it going to local jurisdictions.
The Distilling Industry in Kentucky 26
The industry paid roughly $11 million in distilled spirits taxes to local governments in 2010. The next pie chart shows the distribution of these payments to city and county governments, public schools, libraries and other local government. Schools receive over half of these tax payments, with revenues of $6.7 million. City and county governments and library districts collected $2.4 and $1.2 million, respectively. Over $600,000 went to various other government entities. Distilleries separately pay tax on distilled spirits inventory to Kentucky state government, and we have compiled a history from the tax collections data reported by the Kentucky Department of Revenue. The state tax rate is $0.05 per $100 of valuation. In fiscal year 2010, the state received $741,000 in receipts from this tax, implying an inventory value of about $1.5 billion. Using historical data on General Fund receipts from this tax we can see the upward trend in inventory values over the past twenty‐five years. See next chart.

The Distilling Industry in Kentucky 27
Alcohol consumption taxes Kentucky state government levies a number of taxes on alcohol sales generally, and distilled spirits in particular. Kentucky taxes alcohol consumption away from home (restaurants, bars, hotels) at a 6 percent rate, and now (beginning April 2009) levies the same rate on package sales at liquor stores. Kentucky also taxes at the wholesale level, with an 11 percent sales tax collected on transactions from wholesalers to retailers, and an excise tax of $1.92 per wine‐gallon of spirits sold. There is also a ‘case tax’ of $0.05 per case levied on wholesalers, though this brings in only around $100,000 per year in revenues to state government. See the accompanying chart for historical data on tax receipts, some from state government reports and some estimated. Clearly, this has been a growing source of revenue for Kentucky state government. The wholesale tax brought in $28.2 million in revenue to the Kentucky state General Fund in fiscal year 2011, based on the wholesale value of liquor of about $256 million. The excise tax brought in over $10.8 million in revenue the last fiscal year. The newly released 2007 Economic Census provides a nice break out of restaurant and bar sales by type in Kentucky. The Census Bureau estimated that the ‘Food services and drinking places’ industry in Kentucky had $5,348 million in total sales, of which distilled spirits accounted for
$0
$200,000,000
$400,000,000
$600,000,000
$800,000,000
$1,000,000,000
$1,200,000,000
$1,400,000,000
$1,600,000,000
1983
1984
1985
1986
1987
1988
1989
1990
1991
1992
1993
1994
1995
1996
1997
1998
1999
2000
2001
2002
2003
2004
2005
2006
2007
2008
2009
2010
Value of Distilled Spirits Inventory, 1983‐2010
Source: derived from Kentucky state government property tax receipts data, by fiscal year. Current rate is $.05 per $100 of assessed value. Actual value is somewhat higher due to an exemption for property scheduled to be shipped out of state within six months of the assessment date.

The Distilling Industry in Kentucky 28
$122 million, with $55 million from wine, and $160 million from beer9. Also, according to the Census Bureau, sales of distilled spirits account for 1.5 percent of hotel revenues, or about $8.2 million. Thus, sales of distilled spirits (for immediate consumption) at Kentucky restaurants, bars, and hotels was about $130 million in 2007. We use historical growth in wholesale receipts to estimate these retail sales away from home for other years, and multiply by six percent to estimate state tax revenues.
The Kentucky Revenue Cabinet has not provided tax revenue data generated from the new 6% package retail tax. We have made an estimate using retail sales data on liquor stores in Kentucky10. The 2007 Economic Census reported that total retail sales of ‘Beer, wine, and liquor stores’ was $525 million. Details at the federal level show that such stores derived 40.9 percent of their revenues from distilled spirits. This implies that package spirits sales at such stores were 9 Interestingly, restaurants in Kentucky earn much less from alcohol sales than does the industry nationally. For
example, the Census reports that only 6.3 percent of sales by ‘Food services and drinking places’ in Kentucky are from sales of alcoholic beverages, while the national average is 10.3 percent. Presumably, this is due to the preponderance of dry counties in Kentucky – restaurants cannot serve alcohol. Package liquor sales in Kentucky are actually slightly higher than the national average, suggesting that consumers in dry counties make purchases in wet counties for transport home.
10 This method will understate the value of packaged distilled spirits to the extent that spirits are sold in other types of stores, e.g. drug stores.
$0
$10,000,000
$20,000,000
$30,000,000
$40,000,000
$50,000,000
$60,000,000
$70,000,000
1983
1984
1985
1986
1987
1988
1989
1990
1991
1992
1993
1994
1995
1996
1997
1998
1999
2000
2001
2002
2003
2004
2005
2006
2007
2008
2009
2010
2011
Kentucky State Tax Receipts on Consumption of Distilled Spirits, fiscal years 1983‐2011
Retail Package
Retail ‐ away from home
Excise Tax
Wholesale Tax
Source: Kentucky Department of Revenue, Annual Reports. Retail taxes estimated by authors.

The Distilling Industry in Kentucky 29
$215 million that year. A 6 percent retail tax would thus bring in around $12.9 million revenues to state government, and we have brought the estimate forward using the growth in wholesale tax revenues. The four consumption tax streams are shown in the accompanying chart, with Kentucky state tax revenues hitting $65 million in 2010. It is not straightforward to aggregate these different tax rates, or do comparisons over time or with other states, because the tax base may vary by category of tax. Excise taxes are levied by volume (gallons, cases), while wholesale and retail sales taxes are levied by sale price. We have attempted to convert Kentucky’s taxes on consumption of distilled spirits to a single basis to get insight into the total tax per unit, as well as the historic trends. For retail consumption, we assumed a fifty percent split between purchases at restaurants, bars and hotels versus package sales. We divided sales tax receipts by gallons, as revealed from the excise tax paid by wholesalers. This implies that the 6 percent retail tax in Kentucky amounts to tax of $3 per gallon, and package sales are taxed at a rate of $5 per gallon. The combined tax, wholesale and retail, on consumption is now approaching $16 per gallon, double what it was in 1984.
The wholesale and retail taxes are important revenue streams to Kentucky state government. However, because they are based on household consumption, nearly all of these revenues would remain even if Kentucky’s distilling industry were not here. Certainly, high taxes get reflected in higher prices of liquor in Kentucky, and consumers shift purchases to bordering
$0.00
$2.00
$4.00
$6.00
$8.00
$10.00
$12.00
$14.00
$16.00
$18.00
1983 1984 1985 1986 1987 1988 1989 1990 1991 1992 1993 1994 1995 1996 1997 1998 1999 2000 2001 2002 2003 2004 2005 2006 2007 2008 2009 2010
Kentucky Taxes on Consumption of Distilled Spirits (per gallon)
Excise Tax per Gallon (incl case tax)
Wholesale Tax: 11% of B2B transactions
Retail Package Tax: 6% of B2C transactions
Retail Tax ‐ restaurants, bars hotels: 6% of B2C transaction

The Distilling Industry in Kentucky 30
states (and to other products) if their tax rates are lower. But this consumption substitution occurs independently of where the liquor production occurs. Licenses and fees Any business selling alcoholic beverages in Kentucky must pay annual license fees to local governments. This includes restaurants, caterers, hotels, bars, grocery stores, pharmacies, and package stores. The fees vary by type of alcohol sold and by size of city. For example, a restaurant in Louisville offering liquor must pay the City‐County government $1,600 each year, compared to $500 in Morehead. Moreover, jurisdictions typically assess different fee amounts for different types of establishments (e.g., airport, racetrack, restaurant, package store), and even by time of day (higher fees if establishment open after midnight)11. We do not know the total amount of fees paid annually to all the jurisdictions. Some alcohol sales are allowed in 66 counties, many of which have multiple cities of different sizes and liquor laws. Nevertheless, we can make a rough estimate from some published data. In Jefferson County, the Metro government handles all licensing throughout the county, and collects about $2.1 million annually in license fees. The comparable number for the Lexington‐Fayette Urban County Government is $0.7 million. These two counties combined account for 24 percent of the state’s population, but 37 percent of the retail sales by liquor stores, 37 percent of restaurant sales, and 48 percent of hotel sales. So, a reasonable estimate is that statewide alcohol license fees are about three times the collections in Jefferson and Fayette County, or $8.1 million. Of course, not all of that can be attributed to distilled spirits. Using national ratios of retail sales of beer, wine, and spirits, we believe the spirits portion accounts for about 36 percent of alcohol sales. Thus, we estimate that distilled spirits accounts for $2.9 million in license fees for local governments annually in Kentucky. Tax revenues related to payroll of distilleries We have considered the direct property taxes paid by distillers, the excise and sales taxes paid by consumers of distilled spirits, and the license fees paid by retailers. Next we turn to the income and sales tax paid by employees who owe their incomes to distillery operations in Kentucky. The most important categories are the Kentucky individual income tax, the Kentucky general sales tax, and the occupational taxes paid to local governments. In several counties, we suspect that the distillery’s employees are the largest direct payer of occupational taxes among all places of employment, but firm‐specific payroll data is not publicly available.
11 For the Louisville‐Jefferson County schedule of fees, see www.louisvilleky.gov/ipl/LNP/ABC/ABCFees.htm . For
Lexington’s fee schedule, see www.lexingtonky.gov/Modules/ShowDocument.aspx?documentid=10200 .

The Distilling Industry in Kentucky 31
Kentucky income and sales tax receipts related to distillery payrolls can be estimated using effective tax rates12. Effective tax rates are calculated by dividing historical tax revenues by
payrolls, as shown in the accompanying table. We use the average effective tax rates over the 2001‐10 period. The effective income tax rate is 4.61% and the effective sales tax rate is 4.01%. Multiplied times the total distillery‐related payroll of $413 million yields $19.0 million in Kentucky individual income tax receipts and $16.6 million in Kentucky sales tax receipts, for a total of $35.6 million to state government annually. This represents an estimate of how much less in tax receipts Kentucky state government would receive from these two most important categories were the distillery industry to go to another state.
12 It is not valid to apply Kentucky’s top income tax rate of 6 percent to the wages and salaries of distillery‐related
workers, for several reasons. First, only household income above $75,000 is taxed at the top rate. Second, employees and other income earners in their households may have other sources of taxable income beyond wages and salaries, including interest, dividend, and rental income, retirement income, farm income, business income, capital gains, etc. Also, households vary in the number of dependents they claim, as well as deductions claimed for mortgage interest payments, medical care, charitable donations, and the like. The effective tax rate method, shown here, is a standard way to estimate tax receipts to governments as a function of wages and salaries.
tax receipts, FY
effective
tax rate tax receipts, FY
effective
tax rate
2001 $55,463,121,000 $2,778,541,444 5.01% $2,248,471,100 4.05%
2002 $56,681,987,000 $2,702,510,022 4.77% $2,299,990,621 4.06%
2003 $58,506,633,000 $2,746,386,944 4.69% $2,364,182,478 4.04%
2004 $61,446,265,000 $2,796,331,049 4.55% $2,447,584,698 3.98%
2005 $64,175,402,000 $3,036,230,706 4.73% $2,594,966,373 4.04%
2006 $67,432,853,000 $2,918,610,982 4.33% $2,749,765,011 4.08%
2007 $70,808,801,000 $3,041,535,604 4.30% $2,817,652,253 3.98%
2008 $72,575,228,000 $3,483,137,317 4.80% $2,877,814,014 3.97%
2009 $70,685,485,000 $3,315,368,217 4.69% $2,857,665,168 4.04%
2010 $72,302,051,000 $3,154,488,000 4.36% $2,794,057,329 3.86%
average $65,007,782,600 $2,997,314,029 4.61% $2,605,214,905 4.01%
KY individual income tax KY sales tax
Wages and
salaries paid to
workers in state
Effective Tax Rates for Kentucky Income and Sales Taxes
Source: wages and salaries from US Bureau of Economic Analysis; tax receipts from
Kentucky Department of Revenues Annual Report 2009‐10.

The Distilling Industry in Kentucky 32
Next, we turn to occupational taxes received by local governments. We have identified eight local government jurisdictions that levy occupational taxes in locations containing Kentucky distilleries. There is apparently no occupational tax levied in Anderson County, and the Bullitt County distilleries are outside the city jurisdictions that levy an occupational tax. Most of these jurisdictions also levy a ‘net profits tax’ on companies, typically at the same rate as the tax on payrolls, but we do not have data on corporate profits subject to the tax. We have made estimates of the wages and salaries paid by each distillery, based on industry averages and some internal company data. We then applied the rates shown in the table to payrolls by jurisdiction. We estimate that the distillers and their employees directly paid $3.5 million in occupational taxes to local governments in 2010. There is no feasible way to quantify the amount of occupational taxes these (and other jurisdictions) receive from the spinoff impacts of distilling, that is, the taxes paid by employees of vendors and stores where employees spend their paychecks. Assuming that one‐half of the spinoff payrolls from all distillery operations are also subject to these local occupational tax rates, we get a total of $4.7 million in local occupational taxes statewide. The true number is probably higher, since nearly all jurisdictions with significant industrial and retail activity levy an occupational tax.
Distillery mailing addresses County City rate
County rate
School rate
Bardstown Nelson 0.50%
Boston Nelson 0.50%
Clermont Bullitt
Frankfort Franklin 1.75%
Lawrenceburg Anderson
Loretto Marion 1.00%
Louisville* Jefferson 1.45% 0.60%
Owensboro Daviess 1.33%
Versailles Woodford 1.50%
Source: Kentucky Society of CPAs.
* The County rate in Jefferson includes both the Metro Government rate of 1.25%, plus the 0.20% rate for Transit Authority of River City. The school rate applies only to workers who are residents of Jefferson County. The nominal rate is 0.75%; we have adjusted it down to 0.60% to reflect the historic percentage of payrolls of county workers who reside in Jefferson County.
Occupational Tax Rates in Jurisdictions Containing Kentucky Distilleries

The Distilling Industry in Kentucky 33
Taxation of distilled spirits in Kentucky compared to other states
It is difficult to compare taxation of distilled spirits among states, even when limiting the scope to consumption and ignoring the taxation of production. Many states levy excise taxes at the wholesale level, on a per gallon basis. Excise taxes are those levied on specific commodities, based on volume not as a percentage of sales value. Examples include gasoline per gallon, cigarettes per pack, and wine and beer (per gallon). Kentucky also levies a wholesale tax of 11 percent on the value of the transaction between wholesalers and retailers. Eighteen states sell liquor through state‐owned or price‐regulated outlets: Alabama, Idaho, Iowa, Maine, Michigan, Mississippi, Montana, New Hampshire, North Carolina, Ohio, Oregon, Pennsylvania, Utah, Vermont, Virginia, Washington, West Virginia, Wyoming. These are often referred to as ‘control’ states as opposed to ‘open’ states13. These states effectively set retail prices by various mark‐up formulas, with the purpose of enhancing state revenues and, in some cases, limiting access14. Additionally, most states levy a general retail sales tax that covers alcohol sales in restaurants, bars, hotels, and sometimes in package stores. Also, city and county governments in most states levy an additional sales tax. The Tax Foundation compiles a listing of state excise taxes each year. It collaborates with DISCUS to estimate excise taxes in states where liquor is only sold in state‐owned or price‐regulated stores. They adjusted their estimates to include the wholesale tax for Kentucky, converting from a percentage to per gallon basis. The next table shows the rates for Kentucky and its bordering states (that are open), and a figure on the next page shows the rates for all states. Kentucky ranks second highest among the open bordering states in the region, in terms of excise and wholesale taxes combined. Among all open states, Kentucky ranks third highest. This comparison does not reflect differences in additional state taxation at the retail level, at restaurants and bars, or in package stores. Note that Tennessee, second to Kentucky in whiskey production nationally, taxes distilled spirits at about two‐thirds the rate as Kentucky.
13 For a discussion, see http://en.wikipedia.org/wiki/Alcoholic_beverage_control_state . These states maintain a
monopoly on wholesale prices, and in effect control retail prices. 14 In Ohio, for example, the state government is the sole purchaser of beverages with alcohol content above 21
percent. Private businesses contract with the state to retail the spirits products. The state controls the selection of spirits, as well as the prices charged to customers. It uses the pricing power to generate hundreds of millions in profit for the state treasury.
Illinois $8.55
Indiana $2.68
Kentucky $6.85
Missouri $2.00
Tennessee $4.46
Excise and wholesale tax on
distilled spirits, per gallon,
Kentucky and bordering states
that are 'open'
Source: Tax Foundation.

The Distilling Industry in Kentucky 34
We know of one other study that compares Kentucky’s taxation of distilled spirits to that in bordering states15. The authors also examined taxation of beer and wine, and calculated effective tax rates for state and local governments. An effective tax rate is essentially the ratio of tax revenues to governments divided by total sales of the product. Their study included excise taxes, wholesale taxes, general sales taxes, and license fees for alcohol sales. They found that Kentucky had the fourth highest effective tax rate on distilled spirits among the eight states. However, the study was performed before Kentucky raised the wholesale tax rate from 9 to 11 percent, and before Kentucky began applying the six percent sales tax to package sales. Tennessee ranks much higher in the UK study than in the Tax Foundation excise tax comparisons shown here because the UK study includes general sales taxes, including local sales taxes. Tennessee state government levies a 15 percent tax on liquor by the drink, plus a general sales tax rate of 7 percent, plus a local government sales tax which may be as high as 2.75 percent. Finally, the UK study included data on license fees levied on businesses that sell alcohol. These are fairly significant in Kentucky. For example, Jefferson County alone receives about $2 million annually from these fees.
15 See “An Analysis of Taxes on Beer, Wine, and Spirits in Kentucky and Surrounding States”, by William H. Hoyt and
Mark C. Berger, University of Kentucky, sponsored by The Kentucky Beer Wholesalers Association and the Wine and Spirits Wholesalers of Kentucky, March 28, 2002, 24 pages.
$0.00
$5.00
$10.00
$15.00
$20.00
$25.00
$30.00Wash. (b)
Ore. (b)
Va. (b)
Ala. (b)
Alaska
Iowa (b)
N.C. (b)
Utah (b)
Idaho (b)
Mich. (b)
Ohio (b)
Mont. (b)
Ill.
Miss. (b)
Ky. (c)
Pa. (b)
Fla.
N.Y.
N.M
.Haw
aii
Okla.
N.J.
Maine (b)
Minn.
S.C. (d)
Conn.
Tenn.
Mass.
S.D.
Ga.
Del.
Neb
r.R.I.
Nev.
Calif.
Wis.
Ariz.
Ind.
Ark.
Kans.
La.
N.D.
Tex.
Colo.
Mo.
W.Va. (b)
Md.
Vt. (b)
N.H. (b)
Wyo. (b)
Distilled Spirits Tax Rates, by Stateper gallon, 2011, excluding retail sales taxes
Source: Tax Foundation, excise taxes per gallon.(b) state government controls pricing; tax rates estimated by Distilled Spirits Council of United States.(c) (d) includes wholesale taxes
Kentucky
Tennessee

The Distilling Industry in Kentucky 35
It is interesting to see how other major alcohol‐producing states tax production. California, for example, dominates wine production in the United States, followed by New York state. These two states rank near the bottom in wine excise taxes. Similarly, Missouri, Colorado and Wisconsin are the top states for beer production, and they also rank near the bottom in beer excise taxes. See charts.
$0.00
$0.50
$1.00
$1.50
$2.00
$2.50
$3.00
$3.50
Ky.
Alaska
Fla.
Iowa
Ala. (b)
N.M
.
Ga.
Va. Ill.
Haw
aii
Tenn.
S.C.
Mont.
W.Va.
Del.
Neb
r.
S.D.
N.J.
Wash.
Ariz.
N.C.
Ark.
Okla.
Nev.
Ore.
Conn.
Maine
R.I.
Mass.
Vt.
Mich.
N.D.
Ind.
Idaho
Mo.
Md.
Minn.
Colo.
Ohio
Kan
s.
N.Y.
Wis.
Calif.
Tex. La.
Wine Tax Rates by Stateper gallon, 2011, excluding retail sales taxes
Source: Tax Foundation, excise tax rates per gallon, with adjustement for Kentucky's 11% wholesale tax on value of wine. No estimates available for five states where government controls all sales (and taxes are implicit). California
New York
Kentucky
$0.00
$0.20
$0.40
$0.60
$0.80
$1.00
$1.20
$1.40
Tenn.
Alaska
Ala. (a)
Ga. (a)
Haw
aii
S.C.
Ky.
Wash.
N.C.
Fla.
Miss.
N.M
.Utah
Okla.
Maine
La.
Neb
r.N.H.
S.D.
Vt.
Va.
Ark.
Ill.
Calif.
Mich.
Tex.
Conn.
Iowa
Kans.
Ohio
W.Va.
Ariz.
Del.
N.D.
Nev.
Idaho
Minn.
Mont.
N.Y.
Ind.
N.J.
Mass.
R.I.
Md.
Colo.
Ore.
Pa.
Mo.
Wis.
Wyo.
Beer Tax Rates by Stateper gallon, 2011, excluding retail sales taxes
Source: Tax Foundation, excise tax rates per gallon, with adjustmentsby authors to account for the 11% Kentucky and 17% Tennessee wholesale taxes based on value.
Colorado
Missouri
Wisconsin
Kentucky

The Distilling Industry in Kentucky 36
Recent public policy proposals to stimulate the bourbon industry Since our first study there have been proposals from the industry to modify tax laws in ways that would likely spur more growth. In this section, we describe those proposals and comment on their potential impacts. Reinvestment of ad valorem taxes paid by distilleries, aka “Barrel Tax Reinvestment Credit”. In 2011, a Kentucky General Assembly representative introduced HB 418, a bill that would allow Kentucky distillers to reduce the amount of corporate income taxes owed to state government by the amount of property taxes they paid on their aging barrels, provided the dollars were reinvested in distillery operations. However, the distillers would be required to make investments in their Kentucky operations by an amount equivalent to the tax credits. As we documented above, the distillers pay about $14 million annually in property taxes on the barrels in their warehouses around the state, mostly to local school districts. Under the proposed legislation, the distillers would continue to pay the property taxes to local and state governments, but could take an equivalent credit against their Kentucky corporate income tax. State government would lose tax revenues by the amount of the credit claimed annually. There are several arguments used by the industry in support of HB 418. First, they argue that other alcoholic beverages around the world are not burdened with this extra tax. Alcoholic beverages like beer, wine, vodka, gin, and tequila are generally produced to meet current demand, do not require aging, and therefore these industries can function with low inventories of their products. Bourbon, by contrast, needs to be aged for many years, and hence needs large warehouses and inventories. Local and state governments levy a property tax on these inventories every year they sit in warehouses, thus driving up production costs and retail prices. This hurts bourbon in the competition for consumers’ spending among the various alcohol products. Continuing, the industry argues that the reduction of their special tax burden would cause retail prices to be lower, thus stimulating demand for bourbon and therefore production of bourbon in Kentucky. The increased production would lead to more Kentucky jobs, investment, and tax revenues. Since, nearly all the bourbon in the world is made in Kentucky, and since it is already very highly taxed, the industry argues that the state should be encouraging growth through a more competitive tax structure. These arguments all make sense to us. As shown in the previous section of this report, states where beer and wine production are concentrated have very favorable tax climates for those industries. Overall, Kentucky taxes distilled spirits at near the highest rate in the United States. Given the decades‐long decline in manufacturing jobs around Kentucky, but steady production and job levels in the distilling industry, it seems public policy should be more supportive. Indeed, some of the corporate income tax revenues lost to Kentucky state government would be recouped in other taxes paid to the state. On pages 22‐23, we analyze the economic and fiscal impact of a $10 million investment by distillers in new plant and equipment. We estimate that nearly one‐half million dollars in new tax revenues would flow to Kentucky governments due simply to the one‐time construction activity. Of course, once new investments in plant and

The Distilling Industry in Kentucky 37
equipment are made and production expanded, governments receive additional tax revenues annually from the growth in payrolls and the property tax base. It is impossible to predict with any precision the stimulative impact on spirits sales from implementing HB 418. Corporate income tax liabilities vary from year to year with profitability, so the amount of credit taken will vary accordingly. Presumably, the corporate income tax relief would translate in higher productivity at the distilleries, thus lowering bourbon case prices to wholesalers. Then, the economic effect becomes a question of price elasticities. If, for example, a bottle of Kentucky bourbon were priced at $19.50 retail instead of $20, how many more bottles would be sold around the world? Price elasticities within a product category, like alcoholic beverages, are much greater than those between product categories, say between alcoholic beverage and clothing. The economics literature reports price elasticities for alcohol overall at between ‐0.29 and ‐0.6516. The price elasticity of bourbon relative to other alcohol products is not known, but is certainly above one. Thus, a five percent reduction in the retail price of bourbon would lead to at least a five percent increase in demand for bourbon. Given that bourbon production process is labor intensive, the number of direct distilling jobs in Kentucky would go up accordingly, and would be supplemented by many spinoff jobs. Annual deduction of interest expense to carry aging bourbon. This is a proposed changed to the federal tax code, with a bill called “The Aged Distilled Spirits Competitiveness Act of 2011”, and sponsored by all members of the Kentucky delegation to Congress17. As with the barrel tax just discussed, the argument is that bourbon is at a tax disadvantage compared other alcohol products, since it must store its product for many years before selling. Current tax law does not allow distillers to deduct their inventory‐related interest expenses each year, but rather can only deduct them when the bourbon is bottled.
16 See “The Effects of Price on Alcohol Consumption and Alcohol‐Related Problems”, Frank J. Chaloupka, Ph.D., Michael Grossman, Ph.D., Henry Saffer, Ph.D. , National Institutes of Health, 2002, http://pubs.niaaa.nih.gov/publications/arh26‐1/22‐34.htm
17 See media coverage at www.foxnews.com/politics/2011/05/26/whiskey‐rebellion‐kentucky‐lawmakers‐want‐tax‐change‐bourbon‐distillers/
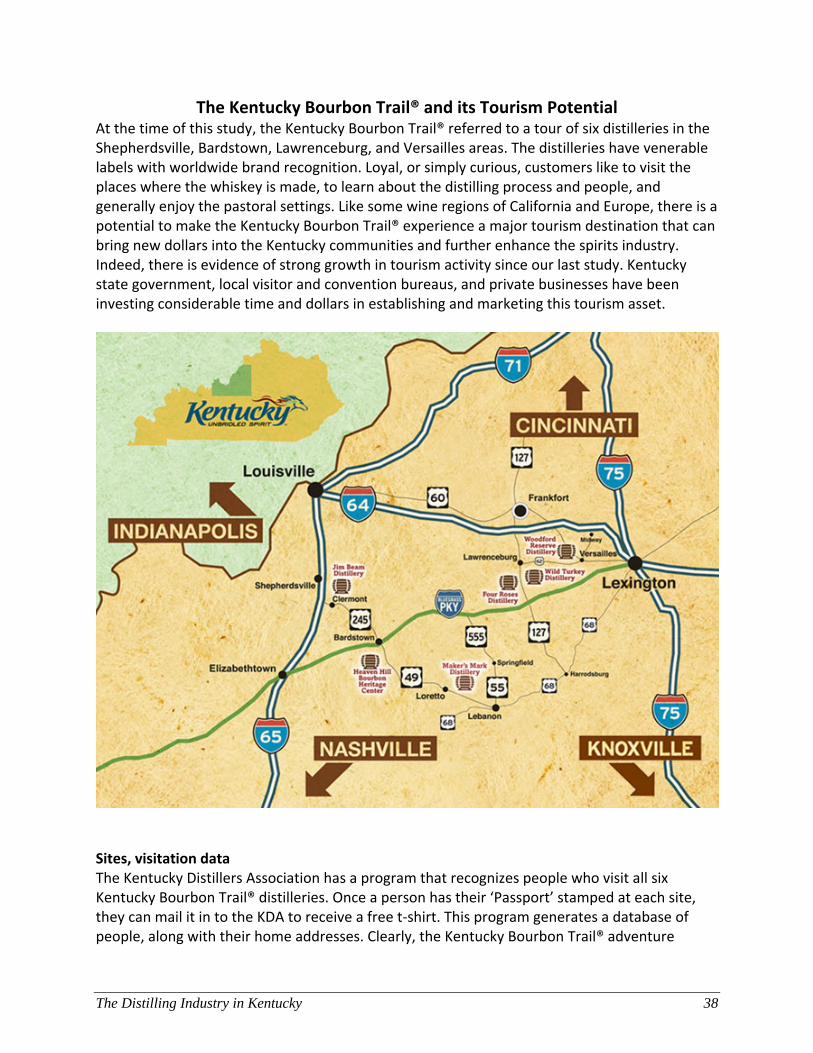
The Distilling Industry in Kentucky 38
The Kentucky Bourbon Trail® and its Tourism Potential At the time of this study, the Kentucky Bourbon Trail® referred to a tour of six distilleries in the Shepherdsville, Bardstown, Lawrenceburg, and Versailles areas. The distilleries have venerable labels with worldwide brand recognition. Loyal, or simply curious, customers like to visit the places where the whiskey is made, to learn about the distilling process and people, and generally enjoy the pastoral settings. Like some wine regions of California and Europe, there is a potential to make the Kentucky Bourbon Trail® experience a major tourism destination that can bring new dollars into the Kentucky communities and further enhance the spirits industry. Indeed, there is evidence of strong growth in tourism activity since our last study. Kentucky state government, local visitor and convention bureaus, and private businesses have been investing considerable time and dollars in establishing and marketing this tourism asset.
Sites, visitation data The Kentucky Distillers Association has a program that recognizes people who visit all six Kentucky Bourbon Trail® distilleries. Once a person has their ‘Passport’ stamped at each site, they can mail it in to the KDA to receive a free t‐shirt. This program generates a database of people, along with their home addresses. Clearly, the Kentucky Bourbon Trail® adventure
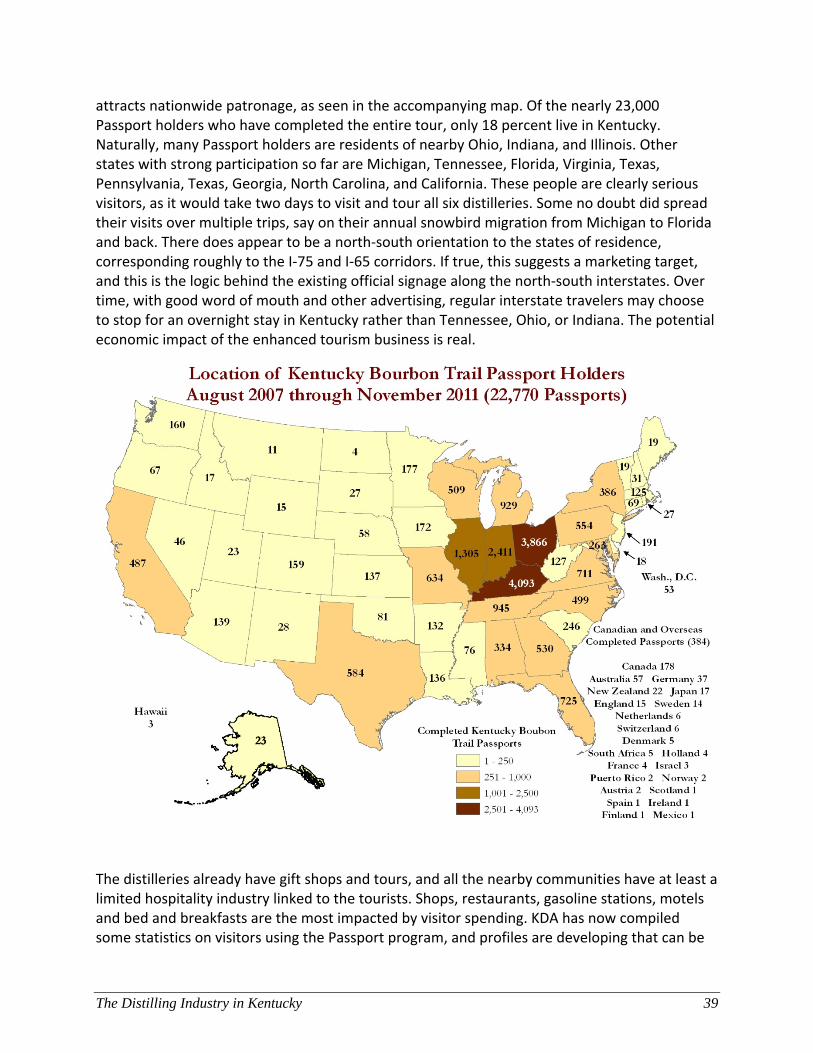
The Distilling Industry in Kentucky 39
attracts nationwide patronage, as seen in the accompanying map. Of the nearly 23,000 Passport holders who have completed the entire tour, only 18 percent live in Kentucky. Naturally, many Passport holders are residents of nearby Ohio, Indiana, and Illinois. Other states with strong participation so far are Michigan, Tennessee, Florida, Virginia, Texas, Pennsylvania, Texas, Georgia, North Carolina, and California. These people are clearly serious visitors, as it would take two days to visit and tour all six distilleries. Some no doubt did spread their visits over multiple trips, say on their annual snowbird migration from Michigan to Florida and back. There does appear to be a north‐south orientation to the states of residence, corresponding roughly to the I‐75 and I‐65 corridors. If true, this suggests a marketing target, and this is the logic behind the existing official signage along the north‐south interstates. Over time, with good word of mouth and other advertising, regular interstate travelers may choose to stop for an overnight stay in Kentucky rather than Tennessee, Ohio, or Indiana. The potential economic impact of the enhanced tourism business is real.
The distilleries already have gift shops and tours, and all the nearby communities have at least a limited hospitality industry linked to the tourists. Shops, restaurants, gasoline stations, motels and bed and breakfasts are the most impacted by visitor spending. KDA has now compiled some statistics on visitors using the Passport program, and profiles are developing that can be

The Distilling Industry in Kentucky 40
used to more precisely gauge the economic importance under plausible assumptions. This is the approach we take here18. Visitor profiles, impacts We know from the sample of 3,279 Passport holders who responded to a survey that:
o 68 percent reported that the Kentucky Bourbon Trail® tour was the primary reason for their visit to Kentucky, with only 4 percent reporting that they were just passing through the state;
o the average party contained 2.93 persons, and the average length of stay was 2.80 days (as estimated using midpoints of ranges reported);
o 70 percent stayed in area hotels or B&Bs, with only 7 percent staying at the homes of family or friends;
o one‐third of the Passport visitors reported household income above $100,000 annually. The respondents were asked to choose an income category, rather than revealing their exact income. Nevertheless, using the midpoints of the income ranges, it appears that the average household income of the group was $91,000;
o the average age of the responding visitor was 48, as estimated using midpoint of ranges reported;
o only 16 percent of the responding Passport holders are Kentucky residents, nearly identical to the share for those issued Passports. This suggests that the survey respondents are representative of the whole group of holders.
Based upon the survey results we have constructed estimates of the economic and fiscal impacts on communities near the Kentucky Bourbon Trail® distilleries, per 1,000 parties completing their Passports. The next table summarizes these estimates and represents the average of various market segments (e.g. whether visiting the Kentucky Bourbon Trail® distilleries is the primary purpose or not, whether area hotels are used or not, and different levels of household incomes). We assigned plausible estimates of spending on lodging, meals,
18 We had hoped to base Kentucky estimates on studies done in other states, particularly for wine regions like
Napa Valley, California. However, unfortunately, after reviewing ten such studies we could not find any solid basis for making Kentucky estimates. The tourism component of the studies relied upon educated guesses and unsupported assumptions, as opposed to surveys of visitors or administrative records of businesses. Some are rife with double‐counting of industrial impacts and invalid application of economic multipliers. Six of the studies –for California, Michigan, Napa County, North Carolina, Texas, and the US ‐ were prepared by MKF Research, a consulting firm. Their studies attempted to estimate the impact of the entire grape and grape products industry, and while they provide some good supporting detail on the production side, offer no documentation on the tourism side. They report very large estimates of the tourism impact, but provide no concrete basis for the estimates. As best we could determine, no area – not even Napa, the biggest wine tourism region in the US – has made the effort to carefully track their visitors and their spending.

The Distilling Industry in Kentucky 41
retail shopping, and fuel. We also constructed a separate input‐output model of the 22‐county region that incorporates the Kentucky Bourbon Trail® distilleries. The model represents the interindustry and household spending linkages within the region, and in particular reveals how hospitality‐related spending impacts the regional economy. We used the multipliers from the model to arrive at an estimated economic and fiscal impact on the region. We estimate that each set of 1,000 parties completing their Kentucky Bourbon Trail® Passports is likely to spend about $585,000 in the region. Of that, the largest share is for food and beverages ($235,000), retail shopping (including at the distilleries) and gas accounting for about $200,000 and lodging at area hotels, motels, and B&B’s another $150,000. Of course, the extra demand causes the patronized businesses to spend more on labor and supplies, and any added take home labor income is incorporated into household spending, thus multiplying the impact of the direct spending. Taking this into account, we estimate that the total economic impact on the region resulting from 1,000 parties completing the Kentucky Bourbon Trail® tour is about $737,000. This spending impact could support about nine jobs. Using current tax rates (and effective tax rates based on historical collection and income data for tax collections resulting from new payroll) we estimate that the fiscal impact on state and local governments would be around $72,000, with roughly half that total going to state government via sales and lodging taxes. Of course, all of our assumptions in the table, though based on years of experience with these issues, are best guesses and actual spending by parties may be quite different. We did conduct an exercise in which we broke out the visitors into eight different market segments divided according to household income, whether visiting the Kentucky Bourbon Trail® tour was the primary or only a secondary reason for traveling, and whether they stayed overnight or were daytrippers. We assigned a percentage of visitors to each market segment based upon the survey results and varied the amounts spent per party per day in the various spending categories. The result of this exercise was remarkably close to the table we present here, lending credence to the estimates. Nevertheless, survey work could be done that would flesh out the spending patterns of parties in the different market segments. Other tourism‐related activity The Kentucky Bourbon Trail® tour is a daily attraction; other multi‐day events also bring tourism dollars into Kentucky, though we do not have sufficient research available to quantify the economic impacts. The Kentucky Bourbon Festival, in Bardstown, has events throughout the week in the middle of September. Last year’s Festival attracted 50,000 attendees, hailing from 38 states and 14 foreign countries. The Bourbon Chase is a 200‐mile race in late September, beginning in Clermont and ending in Lexington. Last year’s Chase attracted several thousand runners, from 44 states and 3 foreign countries. Clearly, these events generate many hotel stays, plus restaurant and other spending.
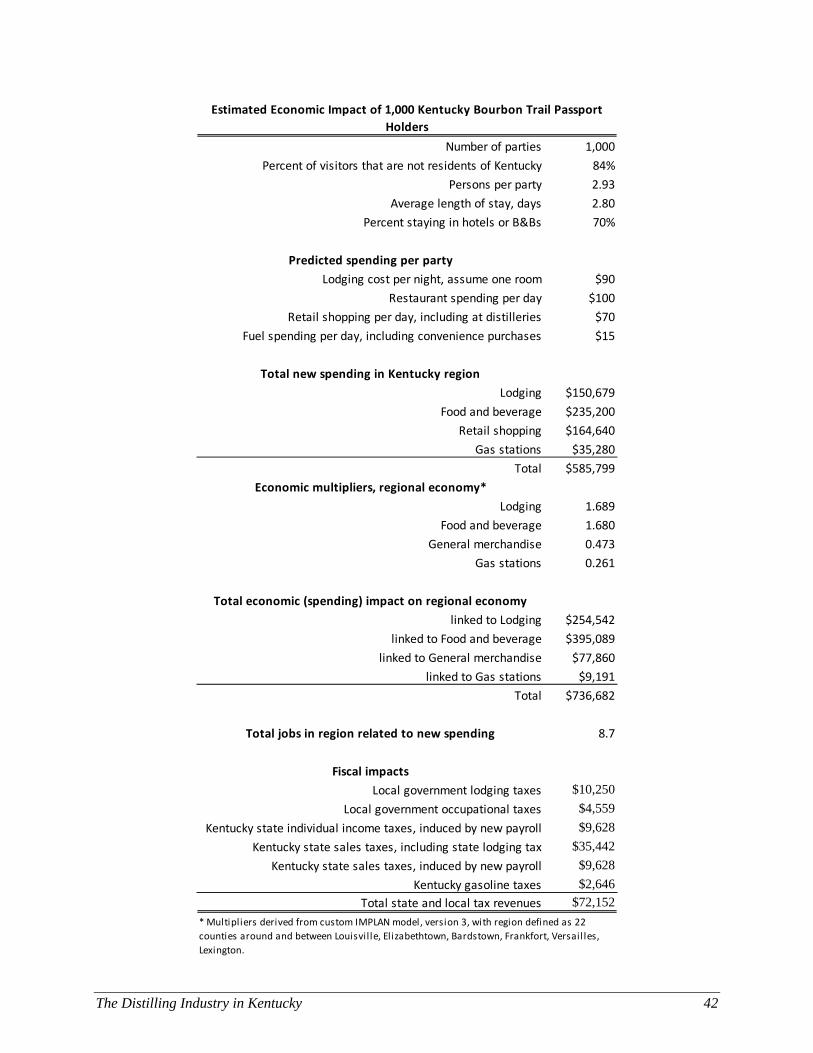
The Distilling Industry in Kentucky 42
Number of parties 1,000
Percent of visitors that are not residents of Kentucky 84%
Persons per party 2.93
Average length of stay, days 2.80
Percent staying in hotels or B&Bs 70%
Predicted spending per party
Lodging cost per night, assume one room $90
Restaurant spending per day $100
Retail shopping per day, including at distilleries $70
Fuel spending per day, including convenience purchases $15
Total new spending in Kentucky region
Lodging $150,679
Food and beverage $235,200
Retail shopping $164,640
Gas stations $35,280
Total $585,799
Economic multipliers, regional economy*
Lodging 1.689
Food and beverage 1.680
General merchandise 0.473
Gas stations 0.261
Total economic (spending) impact on regional economy
linked to Lodging $254,542
linked to Food and beverage $395,089
linked to General merchandise $77,860
linked to Gas stations $9,191
Total $736,682
Total jobs in region related to new spending 8.7
Fiscal impacts
Local government lodging taxes $10,250
Local government occupational taxes $4,559
Kentucky state individual income taxes, induced by new payroll $9,628
Kentucky state sales taxes, including state lodging tax $35,442
Kentucky state sales taxes, induced by new payroll $9,628
Kentucky gasoline taxes $2,646
Total state and local tax revenues $72,152
Estimated Economic Impact of 1,000 Kentucky Bourbon Trail Passport
Holders
* Multipliers derived from custom IMPLAN model, version 3, with region defined as 22
counties around and between Louisville, Elizabethtown, Bardstown, Frankfort, Versail les,
Lexington.