Embed Size (px)
Citation preview
Economic importance of Economic importance of wilderness in Alaska,wilderness in Alaska, in the very long run in the very long run
Steve ColtInstitute of Social and Economic
ResearchUniversity of Alaska Anchorage
8th World Wilderness Conference Anchorage
3 October 2005
2
AcknowledgmentsAcknowledgments
• Alaska Conservation Foundation• University of Alaska Foundation / BP
and ConocoPhilips • Darcy Dugan, Hannah Griego, Scott
Goldsmith (ISER)• Ginny Fay (Eco-Systems)• Joseph Kalt
3
PreviewPreview• Economic benefits of wilderness
are uncertain, but growing• Some benefits may have an infinite
discounted net present value• It all boils down to:
n + y + e + s >= d ?????• If demand is growing fast, can
Alaska lands meet it?
4
What on Earth is “Value” ?What on Earth is “Value” ?•Value is subjective
“There is no accounting for taste”• Value is determined partly by:
Circumstances (water, in the desert; hiking, today)Skills and interests (piano, to Beethoven)Income
• Markets reveal value• Economists try to measure value
5
What benefits are we talking What benefits are we talking about?about?
• Usesubsistencerecreationecosystem services
• Non-useexistence

6
Over what period are we Over what period are we measuring?measuring?
• [typically] Annual flows of valueThis year?In 2010?
[much better would be]:[much better would be]:• Present (discounted (!)(?)) value of
all future flows (= asset value)What discount rate?
7
Idea: an infinite legacyIdea: an infinite legacy• “Environmentalists make lousy
neighbors, but they make great ancestors”
Attribution can be found in Fox, S. John Muir and his legacy :the American conservation movement

8
Problem with idea:Problem with idea:• The cold logic of discounting:• Economic benefits tomorrow do
not seem to have the same market value as economic benefits today
People are impatient
….You can’t eat the scenery You can’t eat the scenery while waiting for its value to while waiting for its value to soar.soar.
9
Possible ResolutionPossible Resolution
Discounted present Discounted present value of future benefits value of future benefits of wilderness is infiniteof wilderness is infinite
What would it take to What would it take to make this true?make this true?

10
TheoryTheory• Total value = present value of all
future flows of benefits
• Or,
...)1()1(1 3
32
21
d
B
d
B
d
B
forever
nowt
t
d
B
)1(

11
Dismal science result:Dismal science result:• If the annual benefits have an
upper bound or if they grow more slowly than rate d, then,
• The denominators win, and total NPV is finite.
forever
nowt
t Vd
B
)1(
12
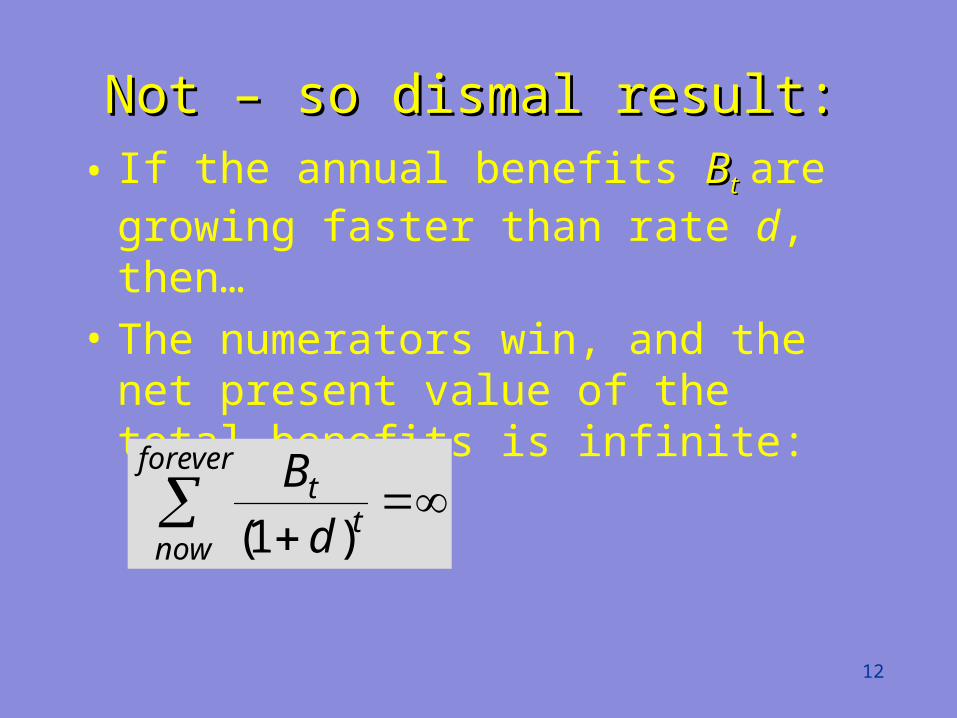
Not – so dismal result:Not – so dismal result:• If the annual benefits BBtt are
growing faster than rate d, then…• The numerators win, and the net
present value of the total benefits is infinite:
forever
nowt
t
d
B
)1(
13
In other words:In other words:
Annual benefits of Annual benefits of wilderness wilderness mightmight grow grow faster than the re-invested faster than the re-invested fruits of any alternative fruits of any alternative land use (timber, housing, land use (timber, housing, agriculture, etc.)agriculture, etc.)
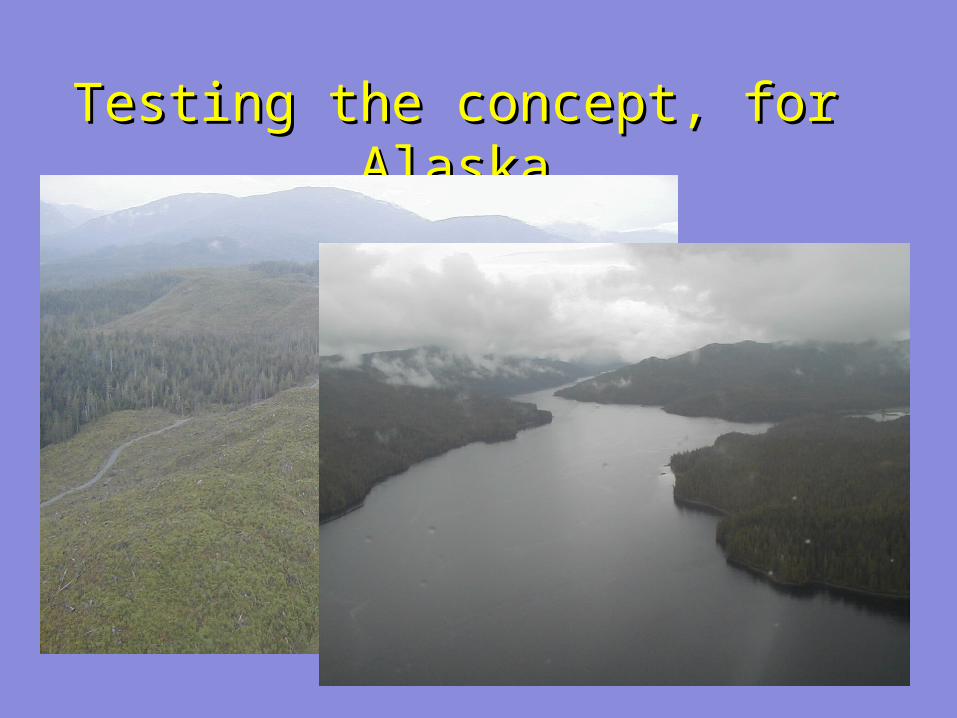
Testing the concept, for Testing the concept, for AlaskaAlaska
15
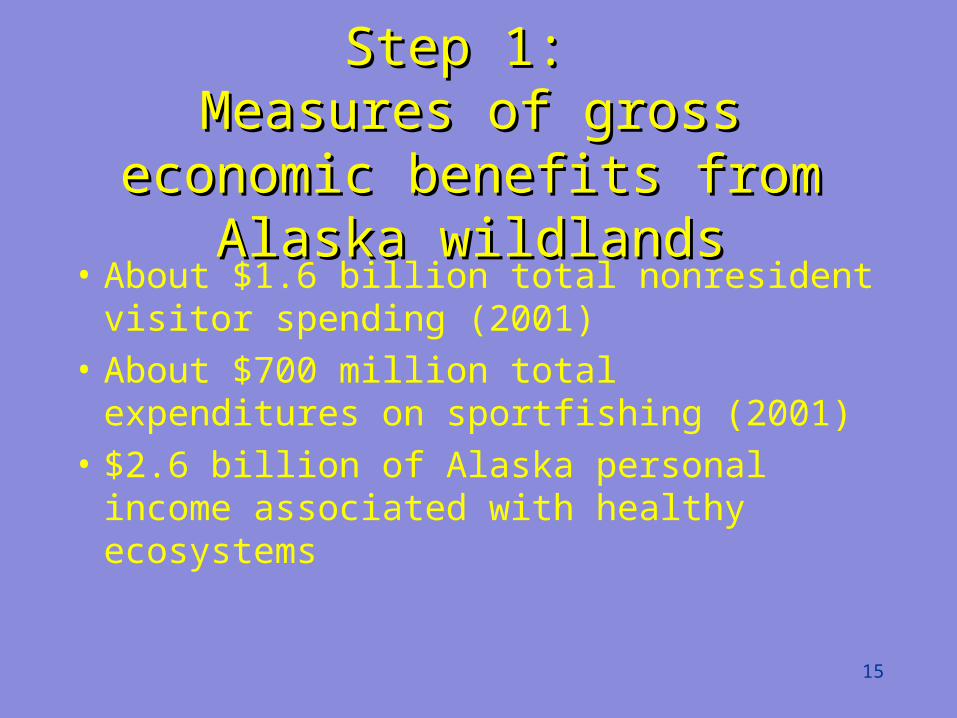
Step 1: Step 1: Measures of gross economic Measures of gross economic
benefits from Alaska benefits from Alaska wildlandswildlands
• About $1.6 billion total nonresident visitor spending (2001)
• About $700 million total expenditures on sportfishing (2001)
• $2.6 billion of Alaska personal income associated with healthy ecosystems
16
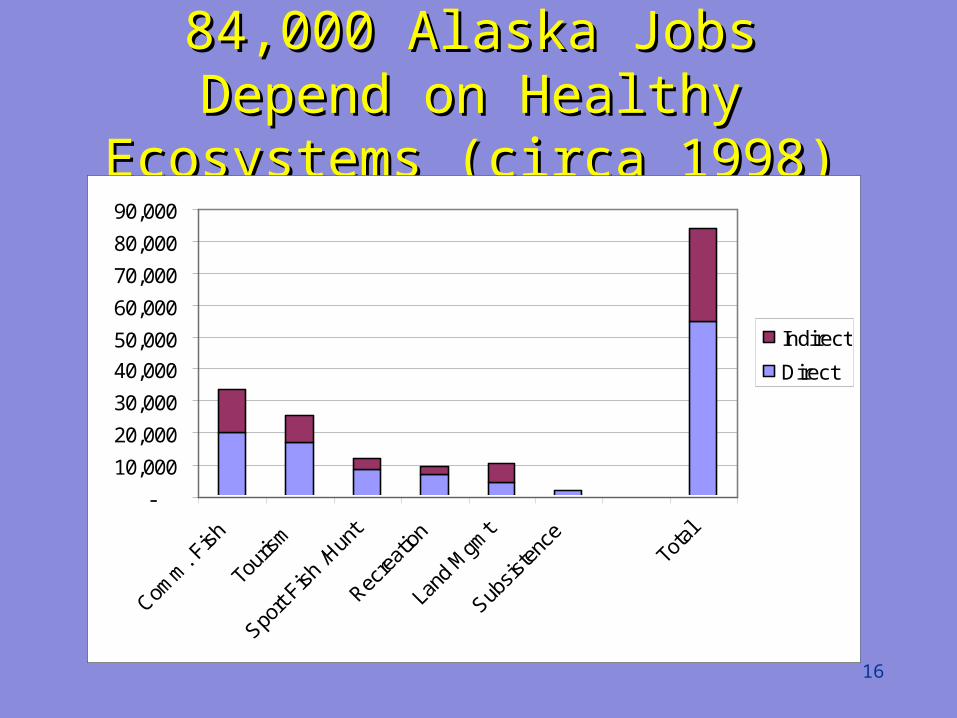
84,000 Alaska Jobs Depend 84,000 Alaska Jobs Depend on Healthy Ecosystems (circa on Healthy Ecosystems (circa
1998)1998)
-
10,000
20,000
30,000
40,000
50,000
60,000
70,000
80,000
90,000
Indirect
Direct
17
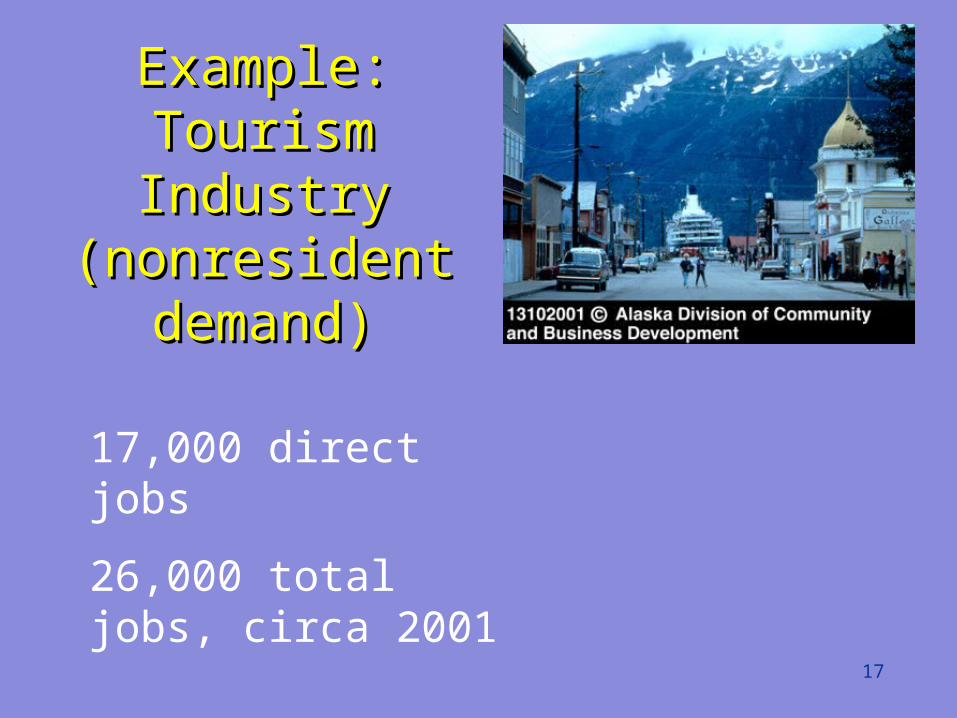
Example: Example: Tourism Industry Tourism Industry
(nonresident (nonresident demand)demand)
17,000 direct jobs
26,000 total jobs, circa 2001
18
Step 2: Step 2: Attribution of total value to Attribution of total value to “wilderness” or “wildness”“wilderness” or “wildness”
19
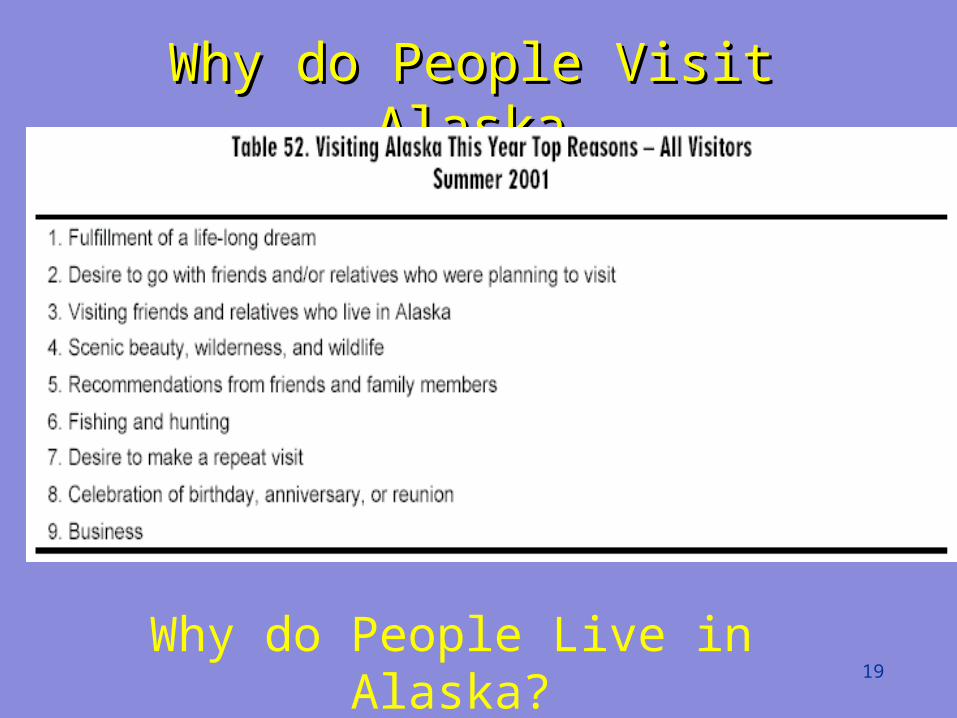
Why do People Visit AlaskaWhy do People Visit Alaska
Why do People Live in Alaska?
20
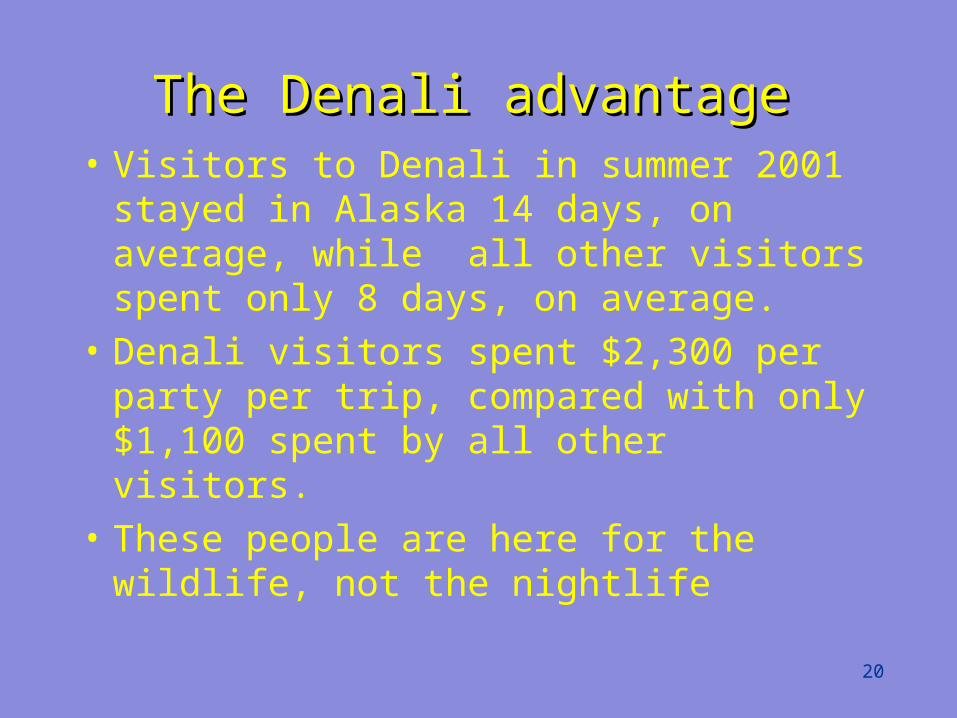
The Denali advantageThe Denali advantage• Visitors to Denali in summer 2001
stayed in Alaska 14 days, on average, while all other visitors spent only 8 days, on average.
• Denali visitors spent $2,300 per party per trip, compared with only $1,100 spent by all other visitors.
• These people are here for the wildlife, not the nightlife
21
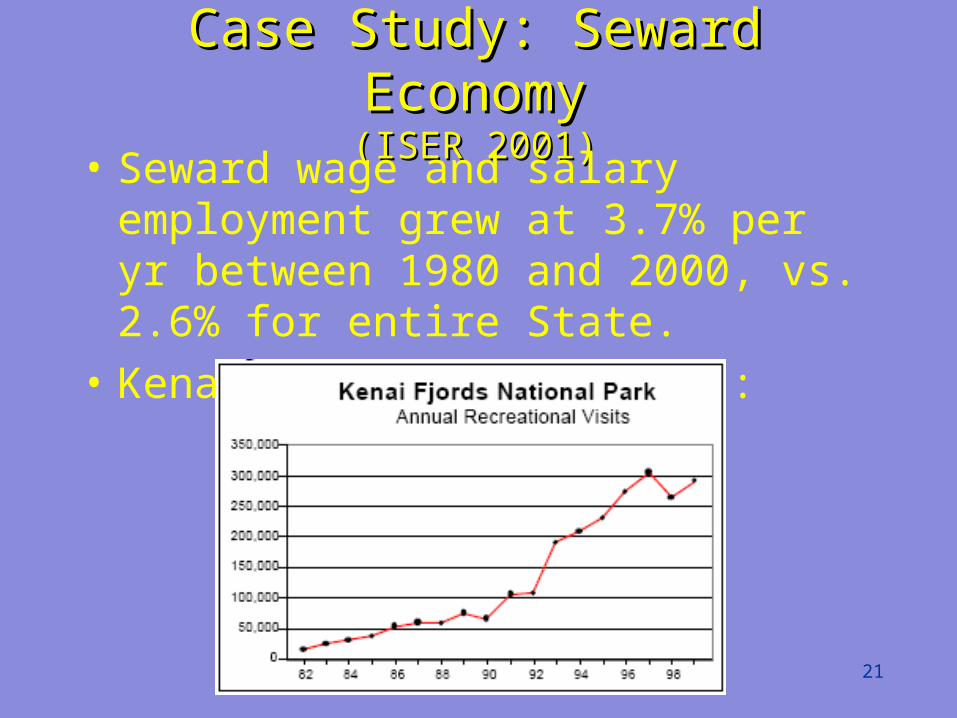
Case Study: Seward EconomyCase Study: Seward Economy(ISER 2001)(ISER 2001)
• Seward wage and salary employment grew at 3.7% per yr between 1980 and 2000, vs. 2.6% for entire State.
• Kenai Fjords Park visits:
22
Step 3:Step 3:Growth ratesGrowth rates
• Use valueDepends on visitorsAnd in-migrants
• Existence valueDepends on population, income per capita, and education
23
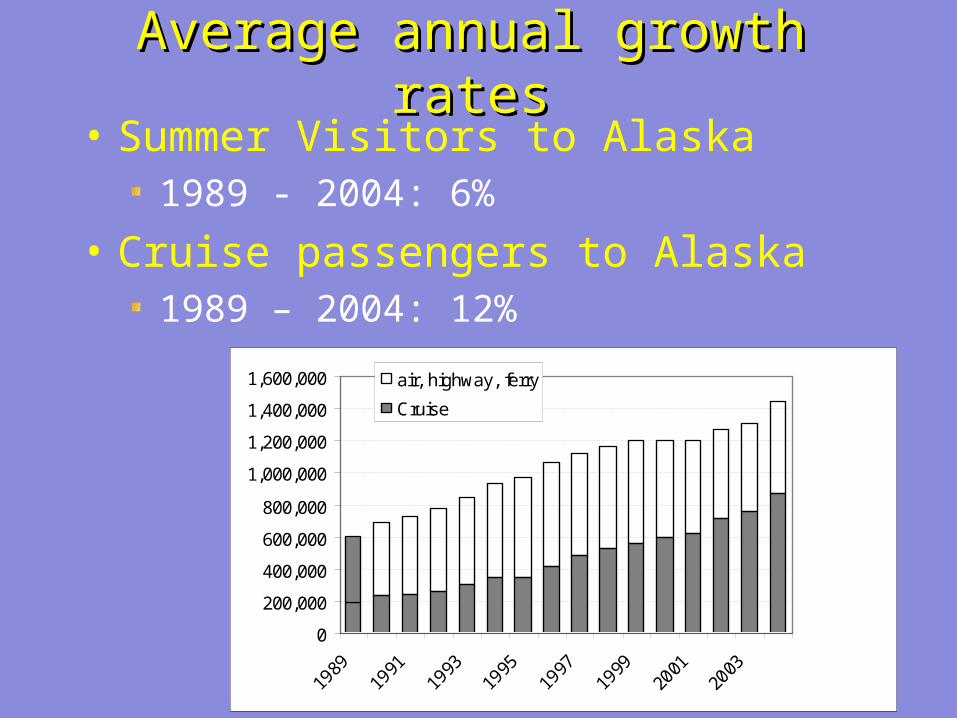
Average annual growth ratesAverage annual growth rates• Summer Visitors to Alaska
1989 - 2004: 6%
• Cruise passengers to Alaska1989 – 2004: 12%
0
200,000
400,000
600,000
800,000
1,000,000
1,200,000
1,400,000
1,600,000 air, highway, ferry
Cruise
24
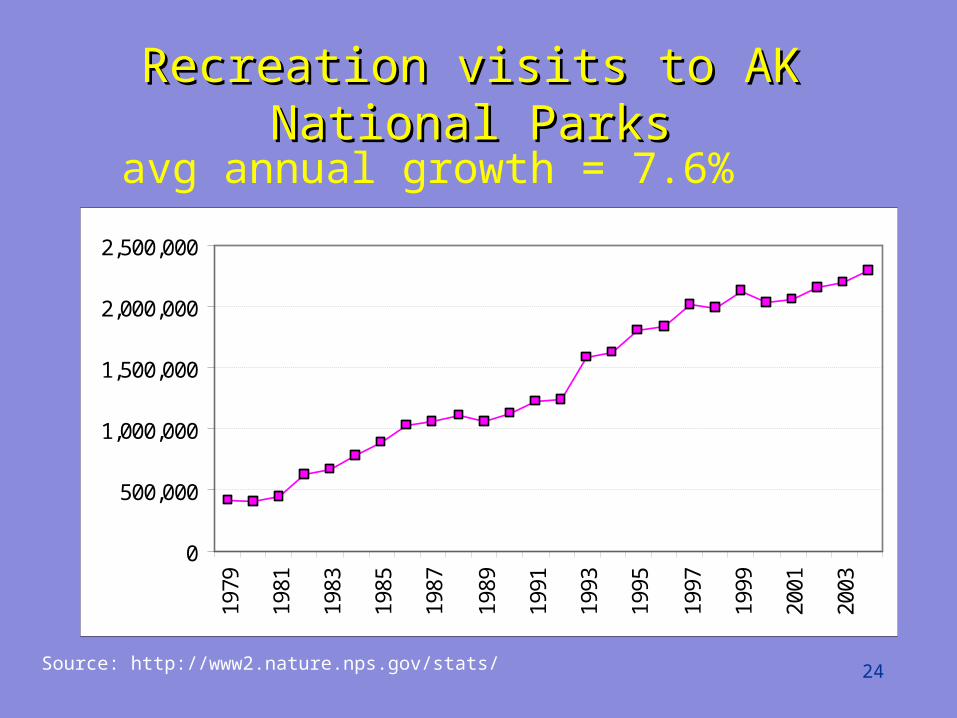
Recreation visits to AK National Recreation visits to AK National ParksParks
Source: http://www2.nature.nps.gov/stats/
avg annual growth = 7.6%
0
500,000
1,000,000
1,500,000
2,000,000
2,500,00019
79
1981
1983
1985
1987
1989
1991
1993
1995
1997
1999
2001
2003
25
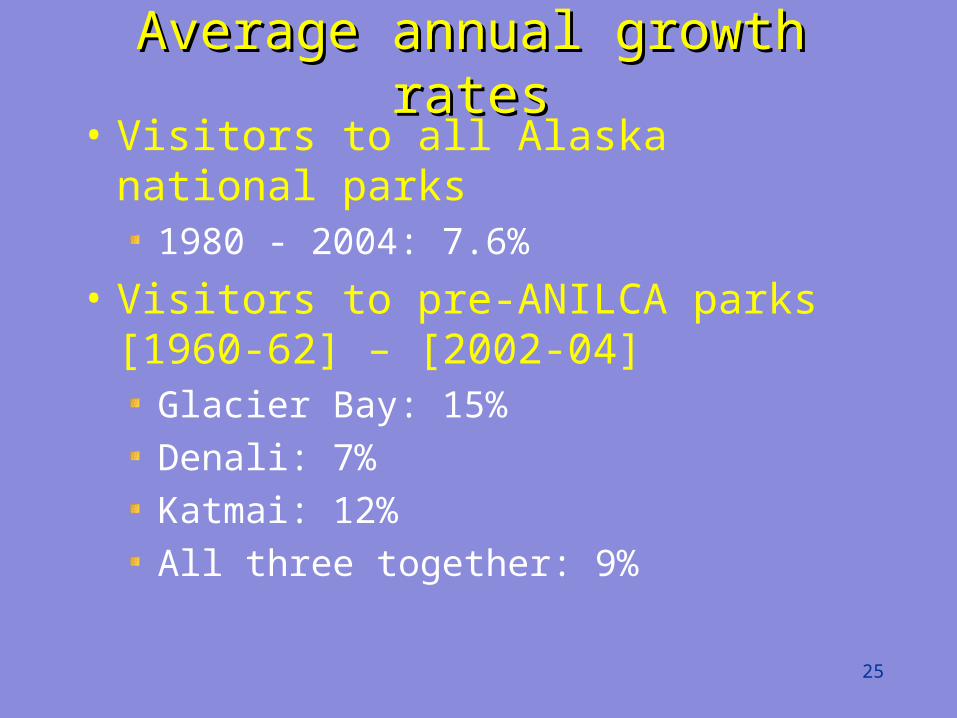
Average annual growth ratesAverage annual growth rates• Visitors to all Alaska national parks
1980 - 2004: 7.6%
• Visitors to pre-ANILCA parks[1960-62] – [2002-04]
Glacier Bay: 15%Denali: 7%Katmai: 12%All three together: 9%
26
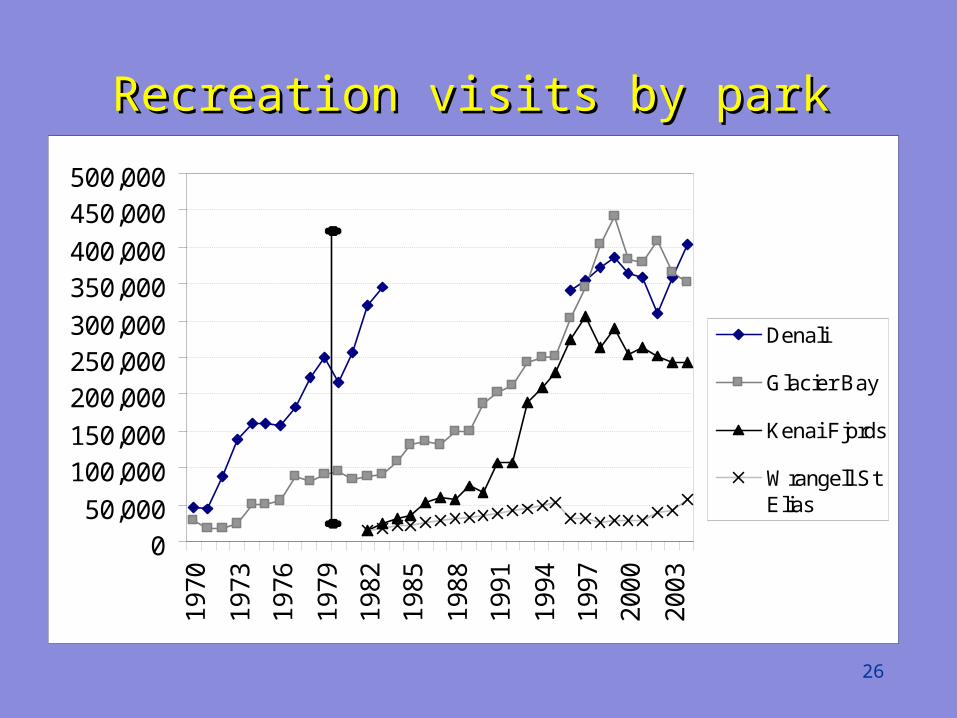
Recreation visits by parkRecreation visits by park
050,000
100,000150,000
200,000250,000300,000
350,000400,000
450,000500,000
19
70
19
73
19
76
19
79
19
82
19
85
19
88
19
91
19
94
19
97
20
00
20
03
Denali
Glacier Bay
Kenai Fjords
Wrangell StElias
27
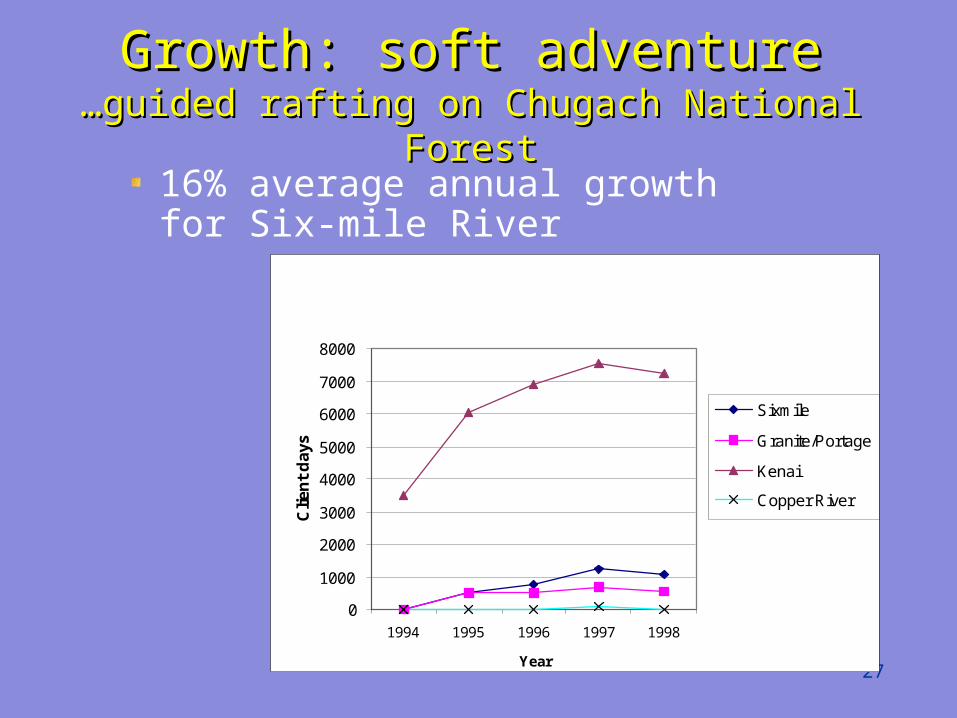
Growth: soft adventureGrowth: soft adventure…guided rafting on Chugach National …guided rafting on Chugach National
ForestForest
0
1000
2000
3000
4000
5000
6000
7000
8000
1994 1995 1996 1997 1998
Clie
nt
day
s
Sixmile
Granite/Portage
Kenai
Copper River
Year
16% average annual growth for Six-mile River
28
Average annual growth ratesAverage annual growth rates• Real per capita income, 1960-2000
World: 2.2%Richest billion people: 2.7%China: 4.3%
• Real total income, 1960-2000World: 4.1%Richest billion people: 3.8%China: 6.0%

29
U.S. Educational U.S. Educational AttainmentAttainment
Share of adults with some Share of adults with some college or more:college or more:
1984: 39% of adults1984: 39% of adults
2001: 53%2001: 53%
30
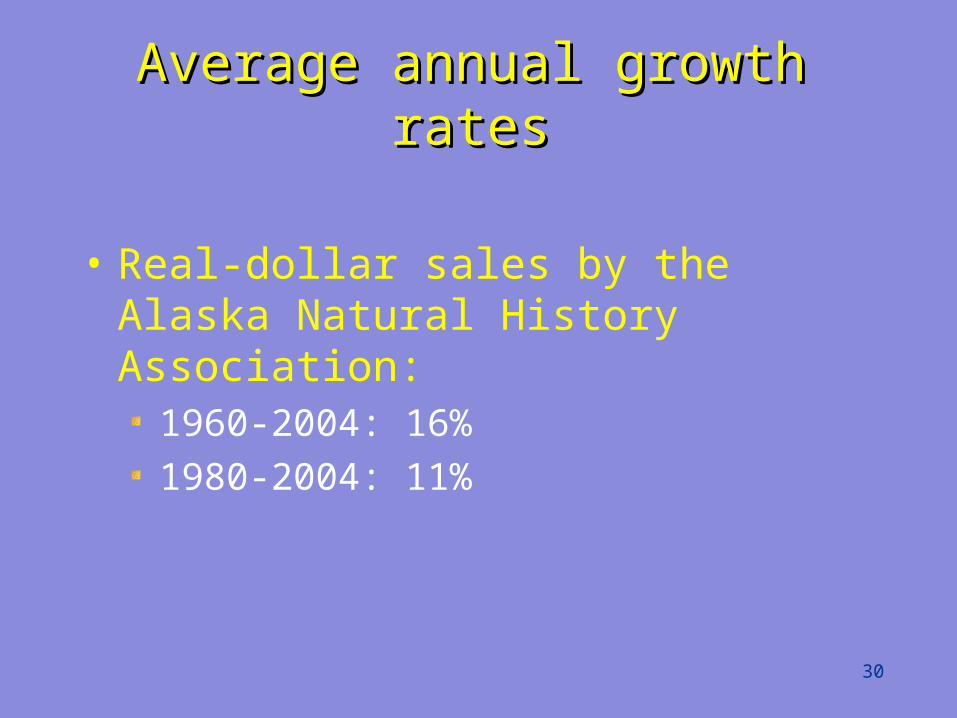
Average annual growth ratesAverage annual growth rates
• Real-dollar sales by the Alaska Natural History Association:
1960-2004: 16%1980-2004: 11%
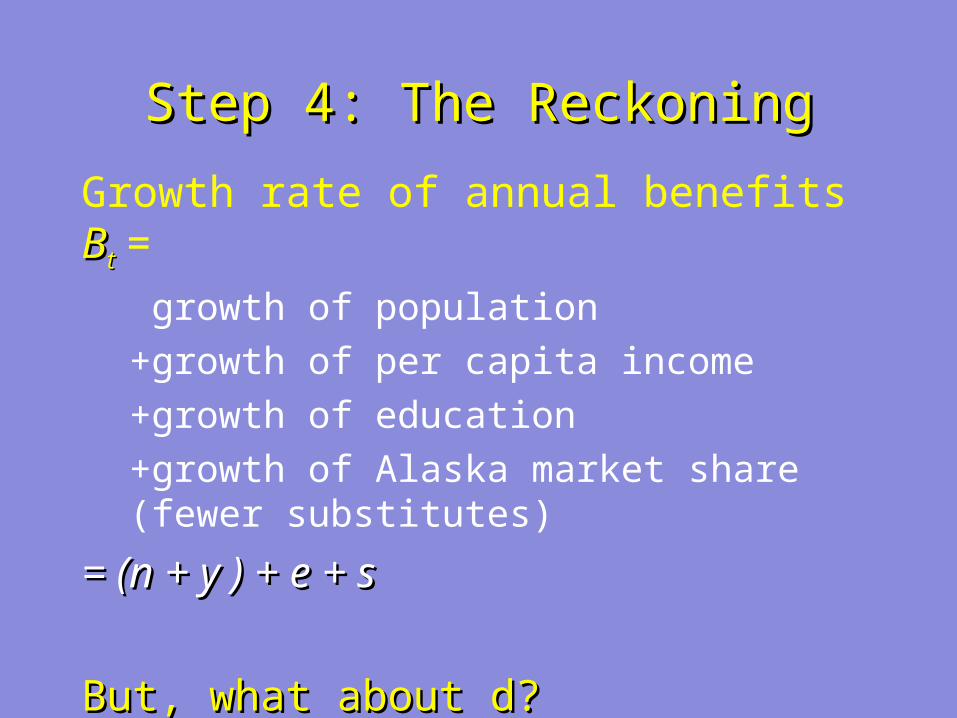
Step 4: The ReckoningStep 4: The Reckoning
Growth rate of annual benefits BBtt =
growth of population+growth of per capita income+growth of education+growth of Alaska market share (fewer substitutes)
= (n + y ) + e + s= (n + y ) + e + s
But, what about d?But, what about d?

32
• Direct use value:Direct use value:n + y + e + s = growth of touristsn + y + e + s = growth of tourists
= at least 10%= at least 10%
• Ecosystem services valueEcosystem services value??? Need help from the ecologists??? Need help from the ecologists
• Existence value:Existence value:(n+y) + e + s = at least 4 + 1 + 1(n+y) + e + s = at least 4 + 1 + 1
= at least 6% = at least 6%
• But, what about d?But, what about d?
33
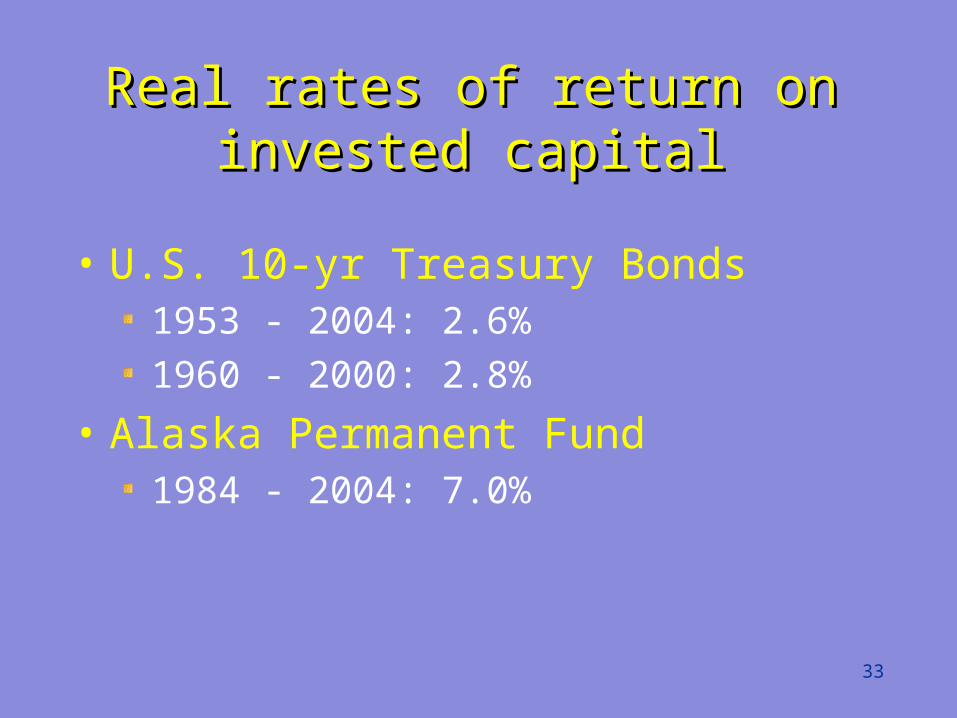
Real rates of return on Real rates of return on invested capitalinvested capital
• U.S. 10-yr Treasury Bonds1953 - 2004: 2.6%1960 - 2000: 2.8%
• Alaska Permanent Fund1984 - 2004: 7.0%

34
The Alaska challenge:The Alaska challenge:• Alaska healthy ecosystems are
increasingly scarcescarce from a global perspective, but:
• First, they are still viewed as relatively abundant by most Alaskans
“I have plenty of wilderness outside my home in Peters Creek.”
• Second, how can we get the growing direct use benefits without “killing the golden goose?”
35
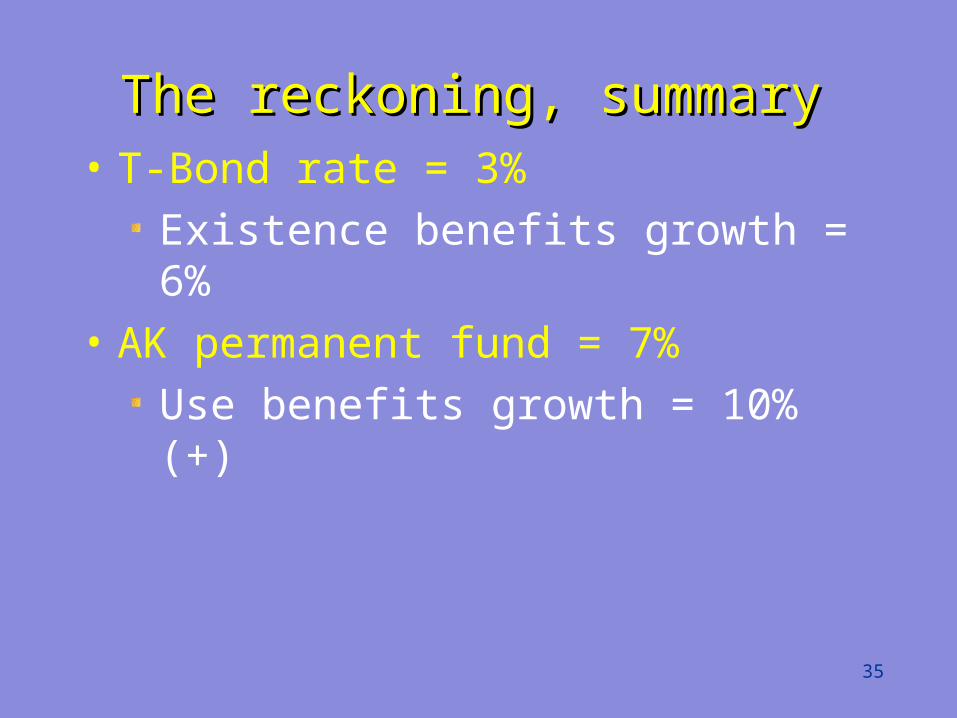
The reckoning, summaryThe reckoning, summary• T-Bond rate = 3%
Existence benefits growth = 6%• AK permanent fund = 7%
Use benefits growth = 10% (+)

This talk is at:This talk is at:www.iser.uaa.alaska.eduwww.iser.uaa.alaska.edu
~The End
Slides from Economics of Slides from Economics of tourismtourism
38
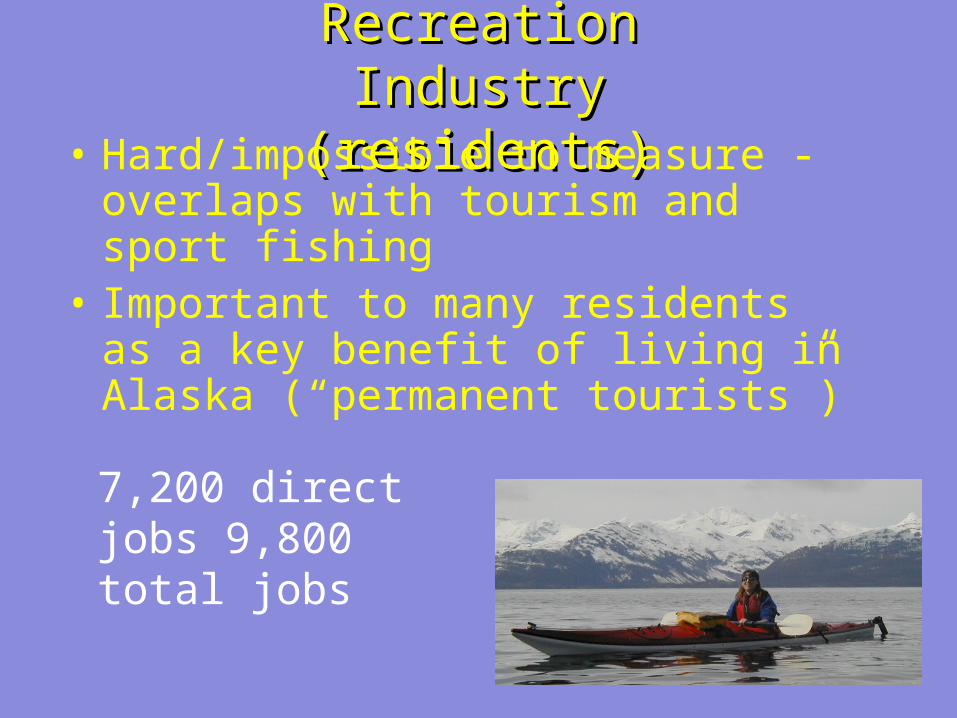
Recreation Recreation Industry Industry
(residents)(residents)• Hard/impossible to measure - overlaps with tourism and sport fishing
• Important to many residents as a key benefit of living in Alaska (“permanent tourists”)
7,200 direct jobs 9,800 total jobs
39
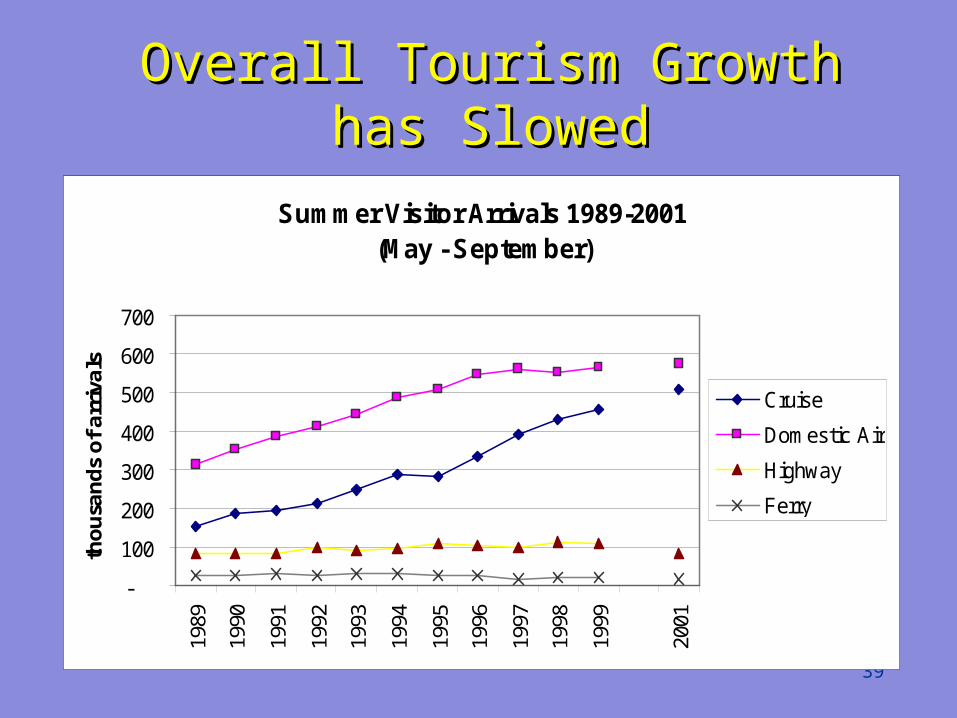
Overall Tourism Growth has Overall Tourism Growth has SlowedSlowed
Summer Visitor Arrivals 1989-2001(May - September)
-
100
200
300
400
500
600
700
1989
1990
1991
1992
1993
1994
1995
1996
1997
1998
1999
2001
tho
usa
nd
s o
f a
rriv
als
Cruise
Domestic Air
Highway
Ferry
40
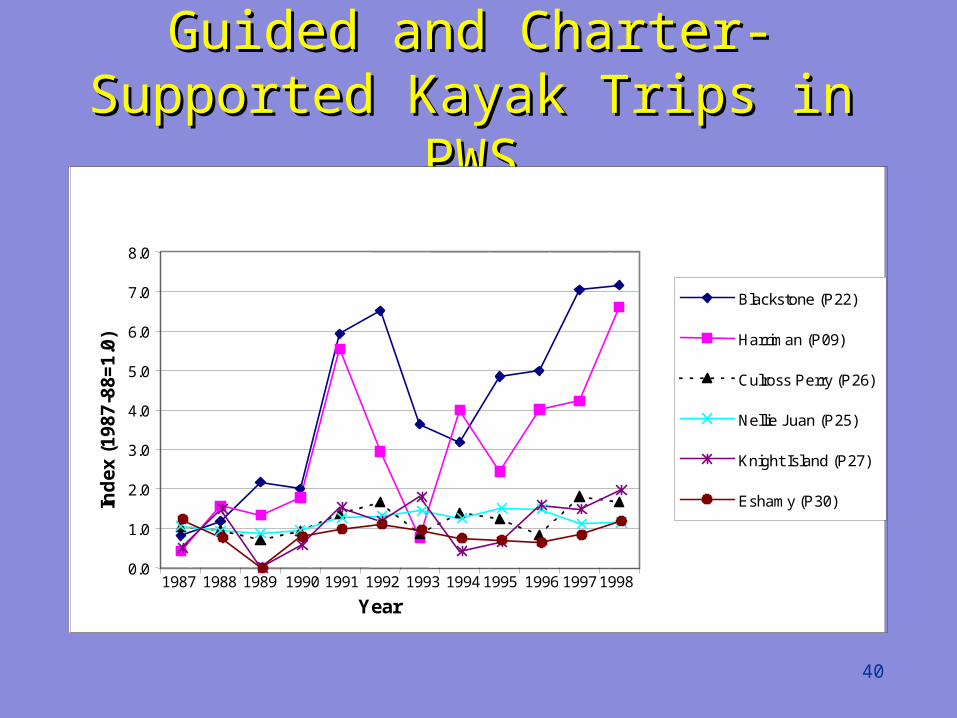
Guided and Charter-Guided and Charter-Supported Kayak Trips in Supported Kayak Trips in
PWSPWS
0.0
1.0
2.0
3.0
4.0
5.0
6.0
7.0
8.0
1987 1988 1989 1990 1991 1992 1993 1994 1995 1996 1997 1998
Ind
ex (
1987
-88=
1.0)
Blackstone (P22)
Harriman (P09)
Culross Perry (P26)
Nellie Juan (P25)
Knight Island (P27)
Eshamy (P30)
Year
41
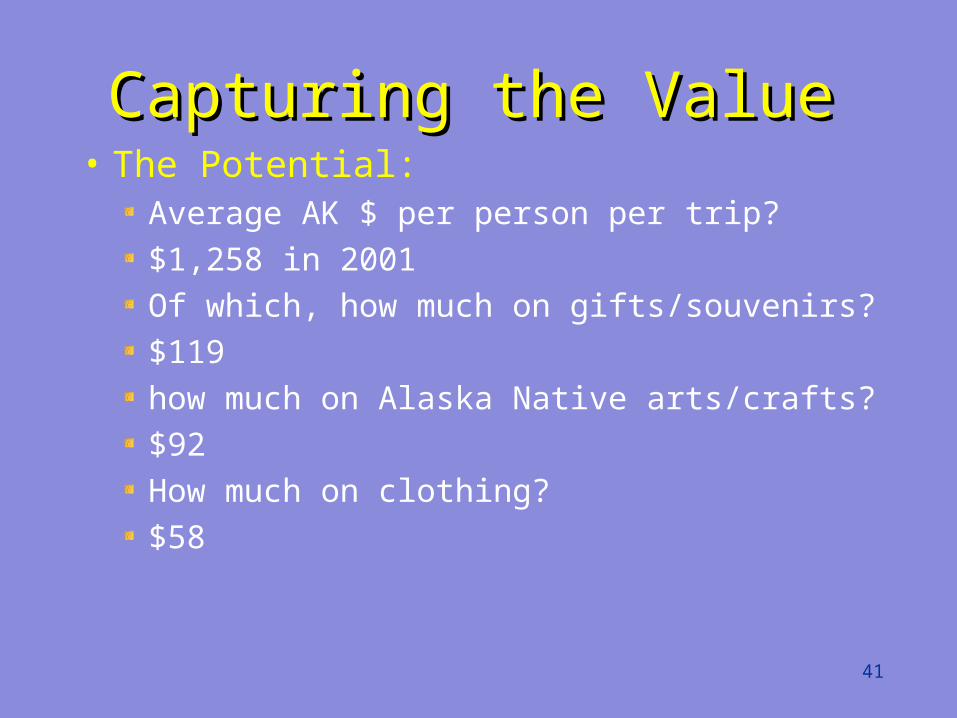
Capturing the ValueCapturing the Value• The Potential:
Average AK $ per person per trip?$1,258 in 2001Of which, how much on gifts/souvenirs?$119how much on Alaska Native arts/crafts?$92How much on clothing?$58

Slides from AWRTA AprilSlides from AWRTA April
43
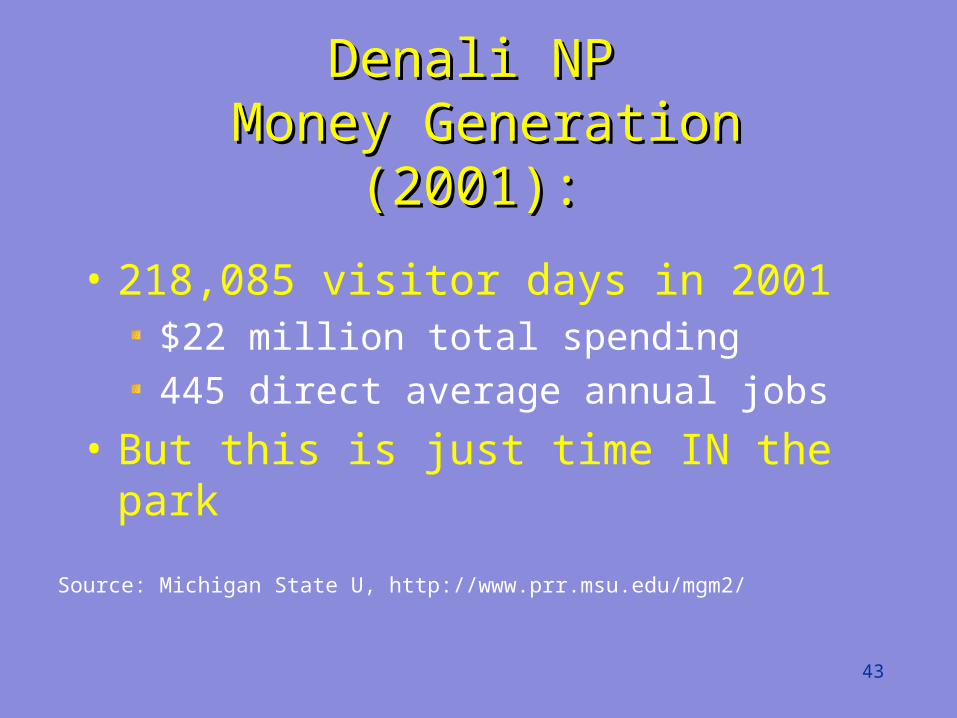
Denali NPDenali NP Money Generation (2001): Money Generation (2001):
• 218,085 visitor days in 2001$22 million total spending445 direct average annual jobs
• But this is just time IN the park
Source: Michigan State U, http://www.prr.msu.edu/mgm2/
44
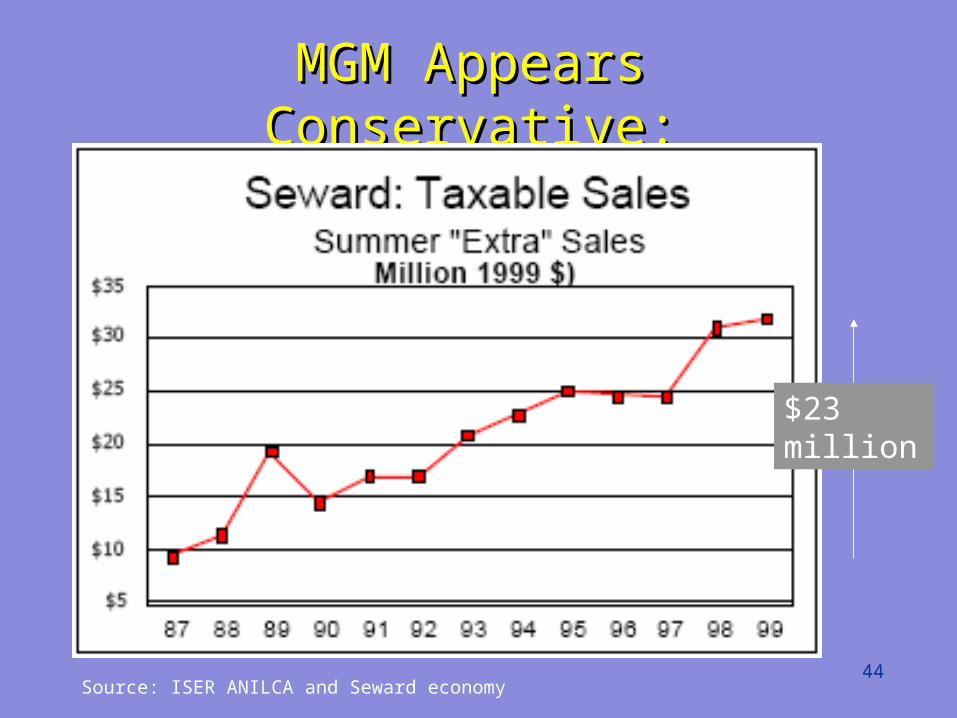
MGM Appears Conservative:MGM Appears Conservative:
Source: ISER ANILCA and Seward economy
$23 million
45
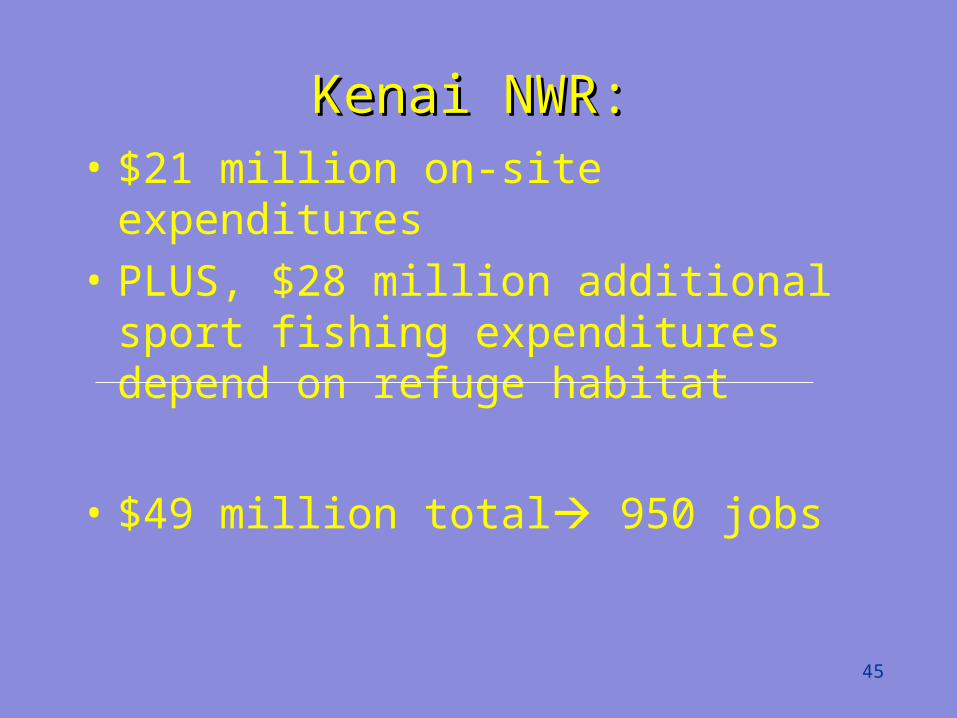
Kenai NWR:Kenai NWR:• $21 million on-site expenditures• PLUS, $28 million additional sport
fishing expenditures depend on refuge habitat
• $49 million total 950 jobs
46
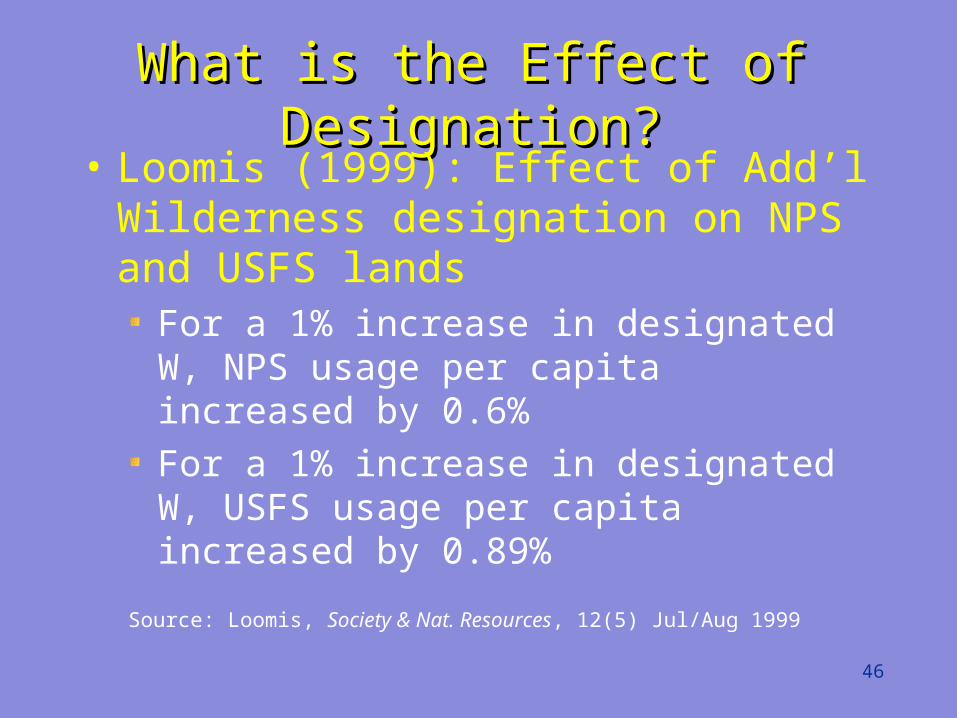
What is the Effect of What is the Effect of Designation?Designation?
• Loomis (1999): Effect of Add’l Wilderness designation on NPS and USFS lands
For a 1% increase in designated W, NPS usage per capita increased by 0.6%For a 1% increase in designated W, USFS usage per capita increased by 0.89%
Source: Loomis, Society & Nat. Resources, 12(5) Jul/Aug 1999
47
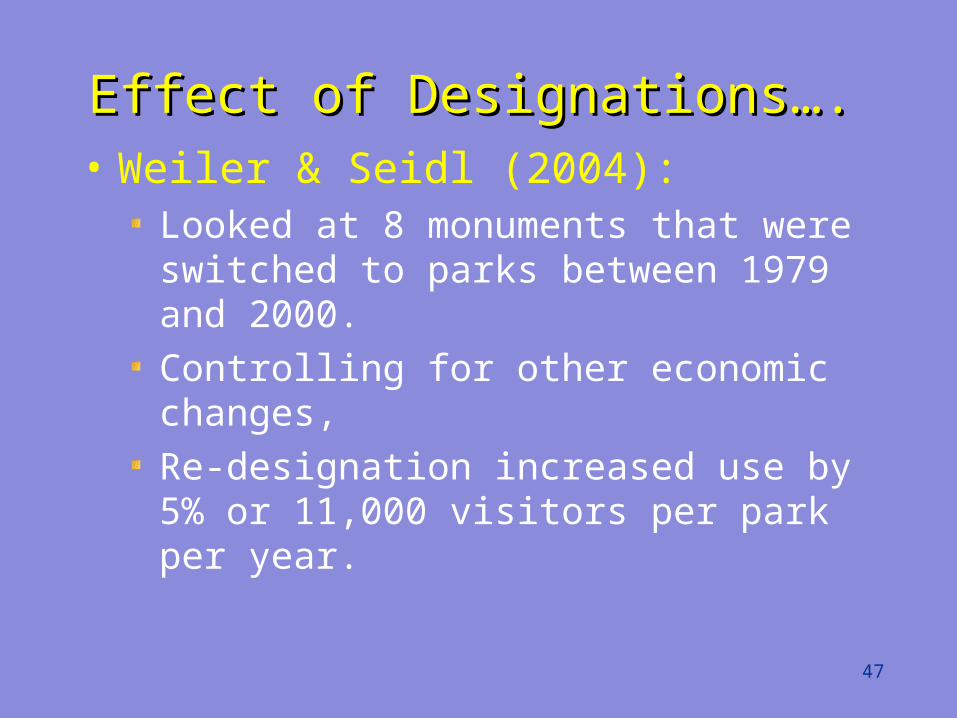
Effect of Designations….Effect of Designations….• Weiler & Seidl (2004):
Looked at 8 monuments that were switched to parks between 1979 and 2000.Controlling for other economic changes, Re-designation increased use by 5% or 11,000 visitors per park per year.
48
Effect of Designations….Effect of Designations….• Costa Rica in 1980s designated
20% of its entire territory as national parks
• Send me there and I will report back to you….!

Slides from ANILCA paperSlides from ANILCA paper