Embed Size (px)
Citation preview

CITY OF NEW HAVEN
JUSTIN ELICKER, MAYOR
July 12, 2021
ECONOMIC
INDICATORS REPORT
May 2021

SUPPORTING OUR BUSINESS COMMUNITY, PEOPLE & PLACES
Our response to the coronavirus supports small business, helping
owners stabilize and reopen to a changing world; builds up the
great places of our city to instill market confidence; and advocates for our people in a time of uncertainty.
CITY OF NEW HAVEN
JUSTIN ELICKER, MAYOR
May 27, 2021
2

SMALL BUSINESS
▪ Regular Communications▪ Ongoing Marketing Support ▪ Technical & Financial Assistance▪ Together New Haven Marketplace▪ Public Health Outreach & Enforcement
PEOPLE
▪ Together New Haven Partnership▪ Creative Sector Relief Fund▪ Financial Empowerment Center▪ Civic Space Conference▪ Workforce Development
PLACES
▪ Bioscience / Medical Center▪ Mill River District Redevelopment▪ Neighborhood Districts▪ Downtown & Wooster Square
3

3
COVID-19 and
Employment

COVID-19 Employment Impact5
Source: ADP National Employment Report History
-5000000
0
5000000
10000000
15000000
20000000
25000000
Jun
-02
De
c-0
2
Jun
-03
De
c-0
3
Jun
-04
De
c-0
4
Jun
-05
De
c-0
5
Jun
-06
De
c-0
6
Jun
-07
De
c-0
7
Jun
-08
De
c-0
8
Jun
-09
De
c-0
9
Jun
-10
De
c-1
0
Jun
-11
De
c-1
1
Jun
-12
De
c-1
2
Jun
-13
De
c-1
3
Jun
-14
De
c-1
4
Jun
-15
De
c-1
5
Jun
-16
De
c-1
6
Jun
-17
De
c-1
7
Jun
-18
De
c-1
8
Jun
-19
De
c-1
9
Jun
-20
De
c-2
0
Jun
-21
Cumulative Monthly Change in National Employment

-5000000
0
5000000
10000000
15000000
20000000
25000000
Ap
r-0
2
Oct
-02
Ap
r-0
3
Oct
-03
Ap
r-0
4
Oct
-04
Ap
r-0
5
Oct
-05
Ap
r-0
6
Oct
-06
Ap
r-0
7
Oct
-07
Ap
r-0
8
Oct
-08
Ap
r-0
9
Oct
-09
Ap
r-1
0
Oct
-10
Ap
r-1
1
Oct
-11
Ap
r-1
2
Oct
-12
Ap
r-1
3
Oct
-13
Ap
r-1
4
Oct
-14
Ap
r-1
5
Oct
-15
Ap
r-1
6
Oct
-16
Ap
r-1
7
Oct
-17
Ap
r-1
8
Oct
-18
Ap
r-1
9
Oct
-19
Ap
r-2
0
Oct
-20
Ap
r-2
1
Cumulative Monthly Change in National Employment
COVID-19 Employment Impact6
Source: ADP National Employment Report History
-200000
0
200000
400000
600000
800000
1000000
1200000
Monthly Change in National Employment
July 2020 to June 2021

Monthly Reported Unemployment %
Source: CT Local Area Unemployment Statistics (LAUS)
7
0.0%
2.0%
4.0%
6.0%
8.0%
10.0%
12.0%
14.0%
0
10,000
20,000
30,000
40,000
50,000
60,000
70,000
80,000
New Haven Unemployment Rate and Labor Force
Labor Force Unemployed Workers Unemployment Rate (%)

Continued Unemployment Claims8
0
2,000
4,000
6,000
8,000
10,000
12,000
Processed Continued Claims in New Haven
Source: CT Dept. of Labor Continued Claims by Town Data

Initial Unemployment Claims9
0
500
1,000
1,500
2,000
2,500
3,000
Processed Initial Claims in New Haven
Source: CT Dept. of Labor Initial Claims by Town Data

Unemployment Claims / Labor Force10
0.00%
2.00%
4.00%
6.00%
8.00%
10.00%
12.00%
14.00%
16.00%
18.00%
0
2,000
4,000
6,000
8,000
10,000
12,000
03
/07
/20
03
/21
/20
04
/04
/20
04
/18
/20
05
/02
/20
05
/16
/20
05
/30
/20
06
/13
/20
06
/27
/20
07
/11
/20
07
/25
/20
08
/08
/20
08
/22
/20
09
/05
/20
09
/19
/20
10
/03
/20
10
/17
/20
10
/31
/20
11
/14
/20
11
/28
/20
12
/12
/20
12
/26
/20
01
/09
/21
01
/23
/21
02
/06
/21
02
/20
/21
03
/06
/21
03
/20
/21
04
/03
/21
04
/17
/21
05
/01
/21
05
/15
/21
05
/29
/21
New Haven Continued Claims as a Share of Labor Force
Continued Claims Share of Labor Force
Note: To calculate the Claims as % of Labor Force statistic, the Weekly Continued Unemployment Claims were divided by monthly LAUS work force figures for New Haven.
Source: CT Local Area Unemployment Statistics (LAUS) and CT Dept. of Labor Continued Claims by Town Data
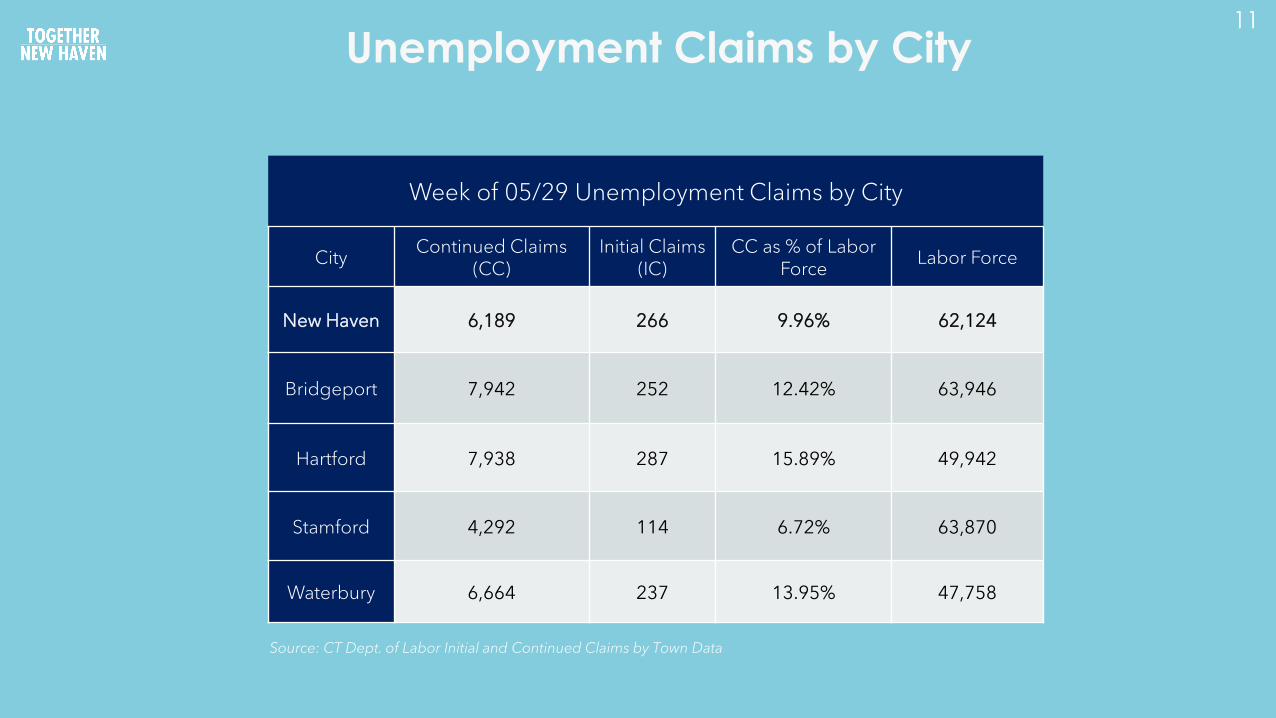
Unemployment Claims by City
Week of 05/29 Unemployment Claims by City
CityContinued Claims
(CC)Initial Claims
(IC)CC as % of Labor
ForceLabor Force
New Haven 6,189 266 9.96% 62,124
Bridgeport 7,942 252 12.42% 63,946
Hartford 7,938 287 15.89% 49,942
Stamford 4,292 114 6.72% 63,870
Waterbury 6,664 237 13.95% 47,758
Source: CT Dept. of Labor Initial and Continued Claims by Town Data
11

Unemployment in CT and USA12
0
2,000
4,000
6,000
8,000
10,000
03
/15
/20
03
/25
/20
04
/04
/20
04
/14
/20
04
/24
/20
05
/04
/20
05
/14
/20
05
/24
/20
06
/03
/20
06
/13
/20
06
/23
/20
07
/03
/20
07
/13
/20
07
/23
/20
08
/02
/20
08
/12
/20
08
/22
/20
09
/01
/20
09
/11
/20
09
/21
/20
10
/01
/20
10
/11
/20
10
/21
/20
10
/31
/20
11
/10
/20
11
/20
/20
11
/30
/20
12
/10
/20
12
/20
/20
12
/30
/20
01
/09
/21
01
/19
/21
01
/29
/21
02
/08
/21
02
/18
/21
02
/28
/21
03
/10
/21
03
/20
/21
03
/30
/21
04
/09
/21
04
/19
/21
04
/29
/21
05
/09
/21
05
/19
/21
05
/29
/21
Normalized Continued Claims Trends
New Haven State USA
*Data normalized on a scale of 10,000Source: CT Department of Labor and US Department of Labor

Unemployment in CT and USA13
0
2,000
4,000
6,000
8,000
10,000
03
/15
/20
03
/25
/20
04
/04
/20
04
/14
/20
04
/24
/20
05
/04
/20
05
/14
/20
05
/24
/20
06
/03
/20
06
/13
/20
06
/23
/20
07
/03
/20
07
/13
/20
07
/23
/20
08
/02
/20
08
/12
/20
08
/22
/20
09
/01
/20
09
/11
/20
09
/21
/20
10
/01
/20
10
/11
/20
10
/21
/20
10
/31
/20
11
/10
/20
11
/20
/20
11
/30
/20
12
/10
/20
12
/20
/20
12
/30
/20
01
/09
/21
01
/19
/21
01
/29
/21
02
/08
/21
02
/18
/21
02
/28
/21
03
/10
/21
03
/20
/21
03
/30
/21
04
/09
/21
04
/19
/21
Normalized Continued Claims Trends
New Haven State USA
*Data normalized on a scale of 10,000Source: CT Department of Labor and US Department of Labor
New Haven’s unemployment claims have declined 39% since peaking (57% in CT and 86% in
the USA) at an average rate of .8% per week, trailing the rate of decrease across the Nation
at large and slightly slower than the state.
Peak Date Decline % Weekly Average # of Weeks
New Haven 7/12/2020 -39.2% -0.8% 47
Connecticut 5/3/2020 -56.6% -1.0% 57
United States 5/10/2020 -85.5% -1.5% 57

Monthly Unemployment Top Ten Industries
Source: CT Dept. of Labor Continued Claims by Industry Data
14
0% 10% 20% 30% 40% 50% 60% 70% 80% 90% 100%
2/27/2021
1/30/2021
12/26/2020
11/28/2020
10/31/2020
09/26/2020
08/29/2020
07/26/2020
06/28/2020
05/31/2020
04/26/2020
03/29/2020
Accommodation & Food Services Admin. & Support Svces. Construction
Educational Services Health Care & Soc Assistance Manufacturing
Mining/Quarrying Other Services Retail Trade
Self Employed Transp. & Warehousing
* The relatively small number of employees in these sectors explains the large percentage change despite the relatively small change in number.
Industry # Change % Change
Accommodation & Food Services -1015 -5%
Construction -1011 -12%
Admin. & Support Svces. -858 -11%
Retail Trade -612 -4%
Manufacturing -422 -12%
Health Care & Soc Assistance -370 -4%
Other Services -321 -5%
Educational Services -292 -18%
Arts, Ent., & Recreation -285 -2%
Transp. & Warehousing -283 -3%
Change in Unemployment from 04/24 to 05/29

Labor Force Participation: National Insights
▪ The labor force participation rate fell slightly in May and increased slightly in June. The rate increased
again among Black Americans (+.04%) and increased among Hispanic Americans, (+.02%) while falling
slightly among White Americans (-.02%).
▪ The labor force participation rate increased by 0.3% among women since April and remained unchanged
among men.
Source: US Bureau of Labor Statistics(https://www.bls.gov/charts/employment-situation/civilian-labor-force-participation-rate.htm)
15

16
Broad Economic
Impacts

Impacts on Consumer Confidence17
An indicator above 100 signals a boost in the consumers’ confidence towards the future economic situation, because of which they are less prone to save, and more inclined to spend money on major purchases in the next 12 months.
Values below 100 indicate a pessimistic attitude towards future developments in the economy, possibly resulting in a tendency to save more and consume less.
Source: OECD (2020), Consumer Confidence Index (CCI)
96
97
98
99
100
101
102
Monthly Consumer Confidence Index (CCI)

Downtown Pedestrian Traffic by Week
Source: Town Green District
18
0
10000
20000
30000
40000
50000
60000
70000
80000
01
/05
/20
01
/19
/20
02
/02
/20
02
/16
/20
03
/01
/20
03
/15
/20
03
/29
/20
04
/12
/20
04
/26
/20
05
/10
/20
05
/24
/20
06
/07
/20
06
/21
/20
07
/05
/20
07
/19
/20
08
/02
/20
08
/16
/20
08
/30
/20
09
/13
/20
09
/27
/20
10
/11
/20
10
/25
/20
11
/08
/20
11
/22
/20
12
/06
/20
12
/20
/20
01
/03
/21
01
/17
/21
01
/31
/21
02
/14
/21
02
/28
/21
03
/14
/21
03
/28
/21
04
/11
/21
04
/25
/21
05
/09
/21
05
/23
/21
06
/06
/21
06
/20
/21
07
/04
/21
Downtown Weekly Pedestrian Traffic
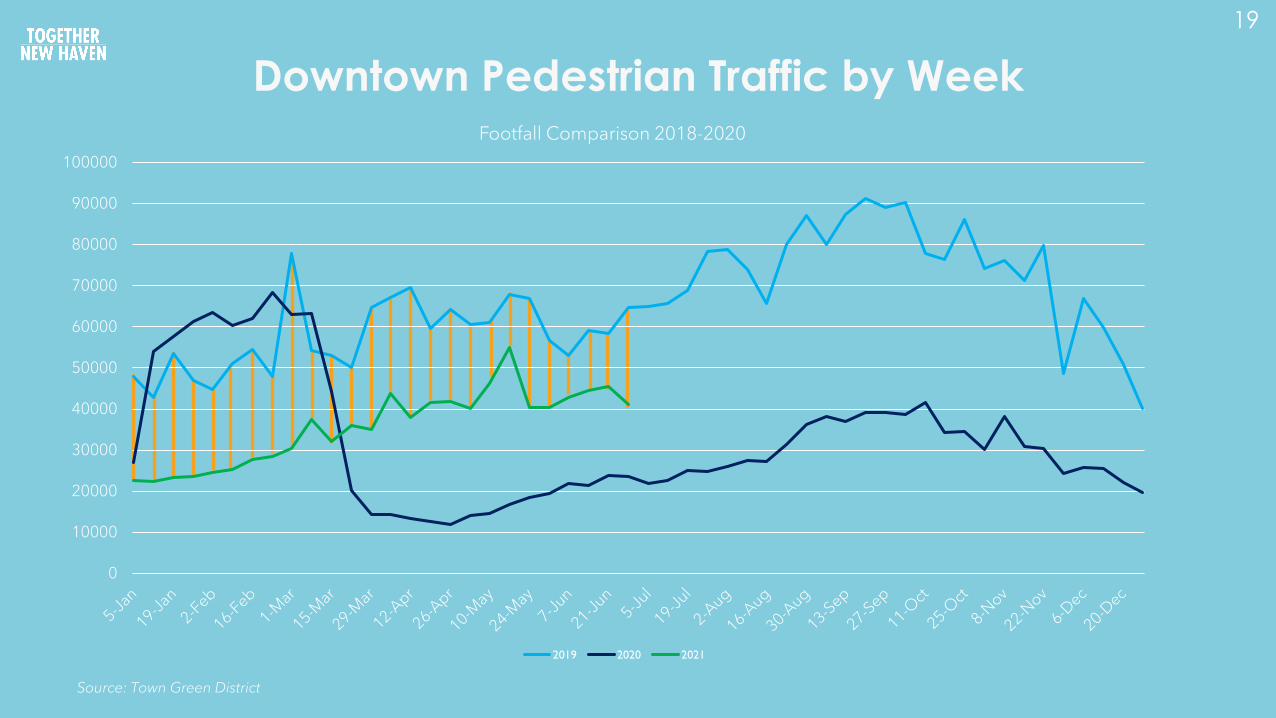
Downtown Pedestrian Traffic by Week
Source: Town Green District
19
0
10000
20000
30000
40000
50000
60000
70000
80000
90000
100000
Footfall Comparison 2018-2020
2019 2020 2021

TTP Parking Revenue by Week
Source: Smarking Data
20
$0
$20,000
$40,000
$60,000
$80,000
$100,000
$120,000
1-J
an
13
-Ja
n
27
-Ja
n
10
-Fe
b
24
-Fe
b
9-M
ar
23
-Ma
r
6-A
pr
20
-Ap
r
4-M
ay
18
-Ma
y
1-J
un
15
-Ju
n
29
-Ju
n
13
-Ju
l
27
-Ju
l
10
-Au
g
24
-Au
g
7-S
ep
21
-Se
p
5-O
ct
19
-Oct
2-N
ov
16
-No
v
30
-No
v
14
-De
c
28
-De
c
11
-Ja
n
25
-Ja
n
8-F
eb
22
-Fe
b
8-M
ar
22
-Ma
r
5-A
pr
19
-Ap
r
3-M
ay
17
-Ma
y
31
-Ma
y
14
-Ju
n
28
-Ju
n

TTP Parking Revenue by Week
Source: Smarking Data
21
-120.0%
-100.0%
-80.0%
-60.0%
-40.0%
-20.0%
0.0%
20.0%
40.0%
1-J
an
13
-Ja
n
27
-Ja
n
10
-Fe
b
24
-Fe
b
9-M
ar
23
-Ma
r
6-A
pr
20
-Ap
r
4-M
ay
18
-Ma
y
1-J
un
15
-Ju
n
29
-Ju
n
13
-Ju
l
27
-Ju
l
10
-Au
g
24
-Au
g
7-S
ep
21
-Se
p
5-O
ct
19
-Oct
2-N
ov
16
-No
v
30
-No
v
14
-De
c
28
-De
c
11
-Ja
n
25
-Ja
n
8-F
eb
22
-Fe
b
8-M
ar
22
-Ma
r
5-A
pr
19
-Ap
r
3-M
ay
17
-Ma
y
31
-Ma
y
14
-Ju
n
28
-Ju
n
2020-2021 vs. 2019 Parking Revenues

Citywide Vacant Storefront Surveys
Source: New Haven EDA and LCI Staff, August 2020, Downtown SSD Feb 2021, and Westville SSD
22
0.0% 5.0% 10.0% 15.0% 20.0% 25.0%
Upper State St
Grand Ave
Kimberly Ave
Dixwell BD
Upper Whalley Ave (BD)
WVRA
Whalley Ave (SSD)
Chapel West
9th Square
Audubon
Chapel (SSD)
Average
Percent of Vacant Storefronts08/2020 and 04/2021
8/2020 4/2021 -10.0% -5.0% 0.0% 5.0% 10.0%
Cedar Hill
Upper State St
Grand Ave
Kimberly Ave
Dixwell BD
Upper Whalley Ave (BD)
WVRA
Whalley Ave (SSD)
Chapel West
Change in Vacancy Percent08/2020 - 04/2021
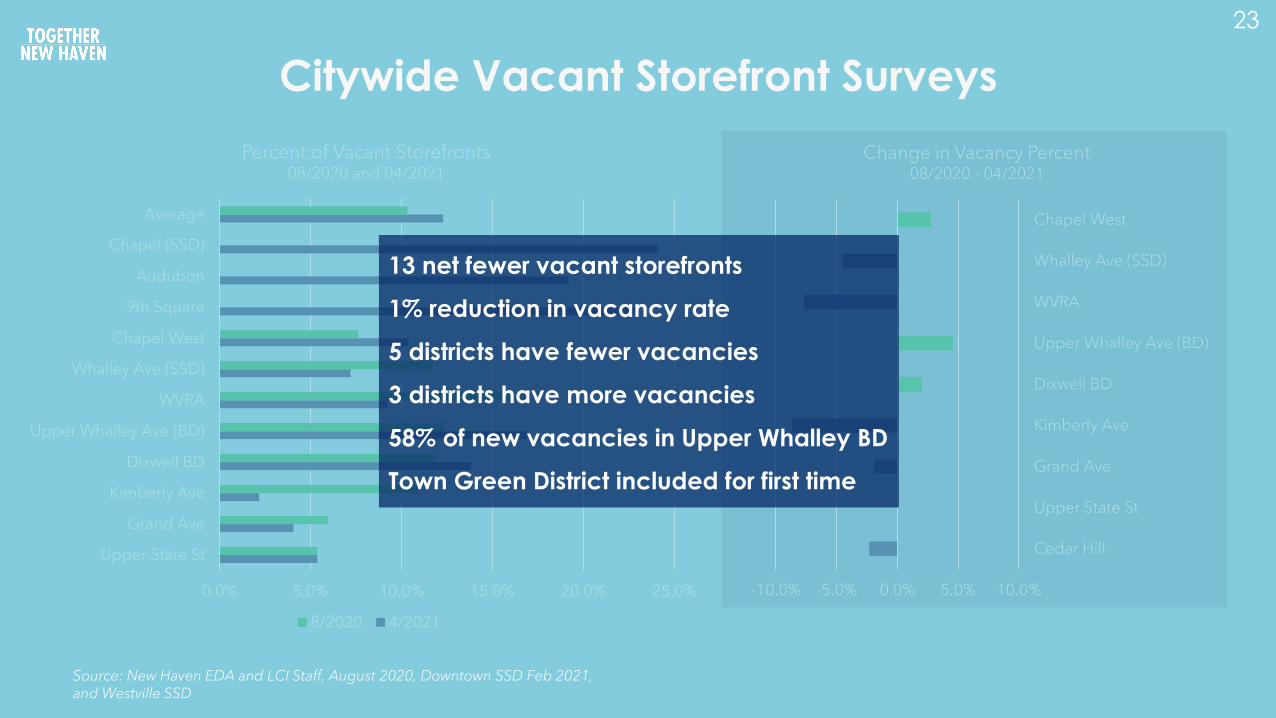
Citywide Vacant Storefront Surveys
Source: New Haven EDA and LCI Staff, August 2020, Downtown SSD Feb 2021, and Westville SSD
23
0.0% 5.0% 10.0% 15.0% 20.0% 25.0%
Upper State St
Grand Ave
Kimberly Ave
Dixwell BD
Upper Whalley Ave (BD)
WVRA
Whalley Ave (SSD)
Chapel West
9th Square
Audubon
Chapel (SSD)
Average
Percent of Vacant Storefronts08/2020 and 04/2021
8/2020 4/2021
-10.0% -5.0% 0.0% 5.0% 10.0%
Cedar Hill
Upper State St
Grand Ave
Kimberly Ave
Dixwell BD
Upper Whalley Ave (BD)
WVRA
Whalley Ave (SSD)
Chapel West
Change in Vacancy Percent08/2020 - 04/2021
13 net fewer vacant storefronts
1% reduction in vacancy rate
5 districts have fewer vacancies
3 districts have more vacancies
58% of new vacancies in Upper Whalley BD
Town Green District included for first time

24
Tracking
Business
Status
*This is a working list based on media reports, visual inspections and other information sources for first-floor commercial businesses.
Openings Closures
Blue Orchid (Court Street) Ayah-H Market (Orange Street)
Boba Company Loose Leaf (High Street) Barbarossa's (Whalley Avenue)
Doc’s Baja and Surf Shack (Crown Street) Cask Republic (Crown Street)
Dre’s Soulfood Kitchen (Kimberly Avenue) Dunkin Donuts (Whitney Avenue)
Madeline’s Empanaderia (Middletown Avenue) Halal Guys (Chapel Street)
New Haven Crab House (Amity Road) Joyce & Davinas Good N Plenty Soul Food (Whalley Avenue)
Off The Tracks (State Street) Miya’s Sushi (Howe Street)
T.O.P. That BBQ (Whalley Avenue) Sesame Falafel (Chapel Street)
The Neighborhood Café (Upper State Street) Supreme Eatery Carryout (Dixwell Avenue)
Viva Zapata (Park Street)
Commercial/Industrial
Openings Closures
Retail and Services
Openings Closures
7-Eleven (State Street) Americana Cleaners (Amity Road)
Alexicare (Dixwell Avenue) Borinquen Barber Shop (State Street)
Angela's Unique Creations (Kimberly Avenue) Cecilia's Beauty Salon (Dixwell Avenue)
Bark & Vine (Orange Street) Chapel Street Pediatric Group (Chapel Street)
B'wok Productions (Dixwell Avenue) Dix Deli (Dixwell Avenue)
Citizens Bank (Church Street) Drastik Cutz (State Street)
Envios Ecua-Mex (Grand Avenue) Fina's African Hair Braiding (Whalley Avenue)
Green's Cleaners (Grand Avenue) Great Clips (Amity Road)
Hairapeutic, The Salon (State Street) High Performance Auto Detailing (Dixwell Avenue)
Hazelnut Properties (Dixwell Avenue) JR's Auto Body (Dixwell Avenue)
Herbalife Energy Nutrition (Kimberly Avenue) M & M Dominican Beauty (Whalley Avenue)
In & Out Smokeshop (State Street) Pape Store (State Street)
Jax Deli Grocery (State Street) Power Gas Station (Howe Street)
JLY Construction Managers (State Street) Riri's Kings and Queen's Playhouse (Whalley Avenue)
Le Paris Spa (Grand Avenue) Supercuts (Whalley Avenue)
Liberty Tax (Whalley Avenue) Wells Fargo (Foxon Boulevard)
Mae's Flower and Gift Shop (Dixwell Avenue) Wooster Auto Body Inc (Amity Road)
Marcks Barber Shop (State Street)
Mindless Thoughts Clothing (State Street)
New Haven Apparel Boutique (Dixwell Avenue)
Silvia Haire Studio (Kimberly Avenue)
Smoke Shop (Kimberly Avenue)
Sofia's Boutique (Grand Avenue)
Star Jewelers (Whalley Avenue)
The Lab (State Street Downtown)
Turner Construction (Chapel Street)
Veronica’s Hair Loft (Whalley Avenue)
Whalley Sample Shop (Whalley Avenue)
Business Openings and Closings 2021
Hospitality and RelatedOpen Close
Hospitality 9 10
Commercial 0 0
Retail 27 17
Total 36 27
2021
Open Temp Close
Hospitality 37 7 29
Commercial 2 0 0
Retail 9 0 10
Total 48 7 39
2020

Housing Permit Activity
• New Haven led the state with 786
housing permits in 2020.
• New Haven has had 1485 housing
permits issued since 2019, the most
in the state. Stamford (1399) and
Shelton (421) were the two next
towns with the most permits.
25
0 500 1000 1500
Ellington
Simsbury
Danbury
Norwalk
Greenwich
Milford
Fairfield
Shelton
Stamford
New Haven
CT Housing Permits by TownTop Ten Towns 2019 + 2020
2019 2020 (Year to Date)
Source: The Connecticut Economic Digest.
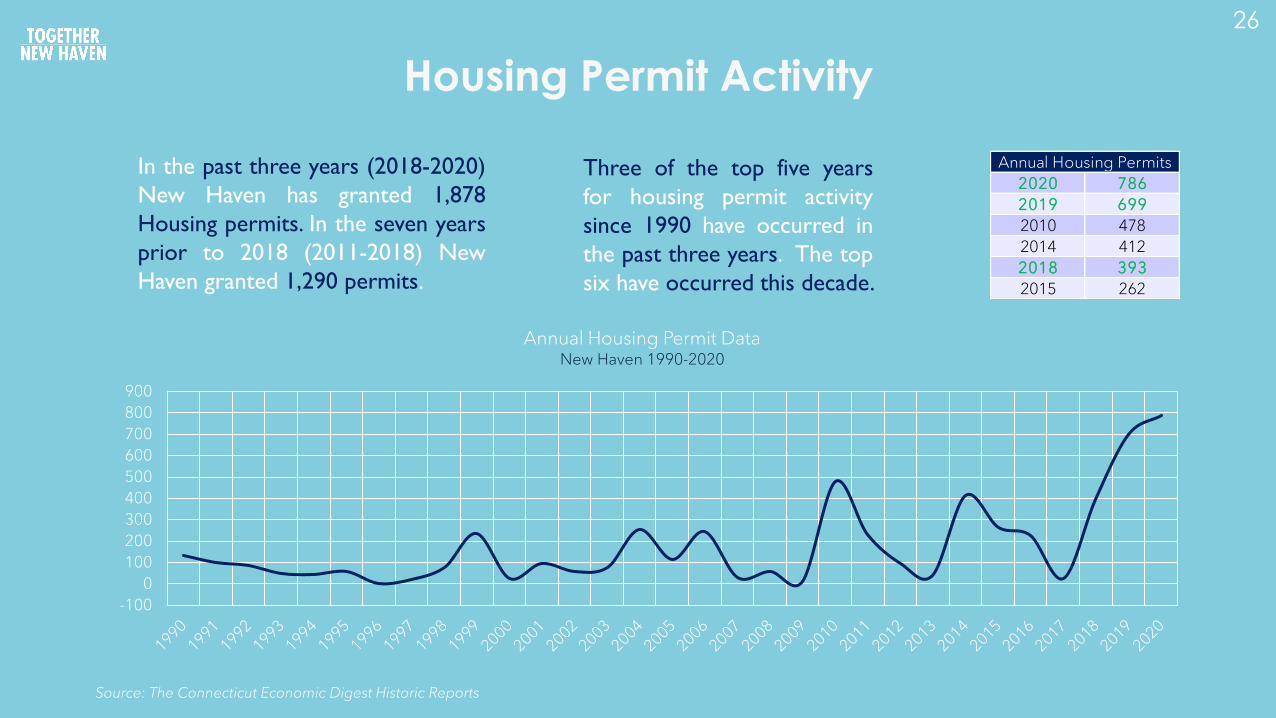
Housing Permit Activity
In the past three years (2018-2020)
New Haven has granted 1,878
Housing permits. In the seven years
prior to 2018 (2011-2018) New
Haven granted 1,290 permits.
Three of the top five years
for housing permit activity
since 1990 have occurred in
the past three years. The top
six have occurred this decade.
26
Source: The Connecticut Economic Digest Historic Reports
-100
0
100
200
300
400
500
600
700
800
900
Annual Housing Permit Data New Haven 1990-2020
2020 786
2019 699
2010 478
2014 412
2018 393
2015 262
Annual Housing Permits

Town Green Storefront Survey
Vacancy Rate: 25.4%
Source: Town Green District Nov. 2020 – Mar. 2021
27
5
10
TGSSD Business Openings and ClosingsNov. 2020 - Mar. 2021
Opened Closed

Economic Health Indicator
The Connecticut Town Economic Indexes (CTEI) reflect changes in four categories: business establishments, employment, real wages and unemployment rate. The baseline is the state of the economy in 2010.
Source: Connecticut DOL Office of Research
28

PPP Assistance Round One
0
20
40
60
80
100
120
140
160
180
$150k-350k $350k-1 mil $1-2 mil $2-5 mil
PPP Loans in New Haven Over $150k
Total Count Non Profit
New Haven small businesses received $47.7M in loans below $150k
29
Source: US SBA PPP Loan Data

Off-Street Downtown Parking Count
POINT IN TIME
PARKING COUNT
July 1, 2020
• Overall 42% occupancy
• Low 85 at Union Station
• High 1,441 at Air Rights
Source: New Haven EDA Staff
30
Lot Name Spots Occupied Total Spots Occupancy Rate
2 Howe 636 845 75.27%
Connecticut Financial Center Lot 668
Gateway Garage 30 600 5.00%
Century Garage 98 599 16.36%
Grove St Garage 100 599 16.69%
Coliseum Lot 222 471 47.13%
360 State 223 467 47.75%
9th Sq/George Street 135 366 36.89%
Chapel Square Garage 40 325 12.31%
Chapel Square Garage (Omni) 40 325 12.31%
Audobon Court Garage 39 283 13.78%
Kirk's Lot 43 168 25.60%
Courtyard Marriot 10 129 7.75%
Kresge's Garage 46 114 40.35%
Elm/Orange Lot 17 80 21.25%
7 Orange Street/ 53 George Street 13 78 16.67%
Center Bank Lot 28 76 36.84%
Kresge's Lot 39 65 60.00%
Horowitz Lot 9 60 15.00%
Crown b/w Temple + Chapel 29 60 48.33%
250 Orange Street Lot 18 48 37.50%
Wachovia Lot 12 46 26.09%
Bromley Lot 15 42 35.71%
Bulllard Lot (Lot 59) 15 42 35.71%
Court Street Lot 11 42 26%
YMCA Lot on Chapel 14 28 50.00%
388 Crown Lot 14 14 100%
Air Rights Garage 1441 2552 56.47%
Crown Street Garage 179 708 25%
Union Station 85 1133 7.50%
Temple Medical Garage 115 371 31%
Temple Street Garage 208 1235 16.84%
Large City Lots Subtotal 2028 5999 34%
Smarking New Haven Total* 2739 6000 45.65%
Total 8691 24638 35.27%
*Smarking occupancy totals for all lots and meters from the peak hour on 07/02/2020

THANK YOU