Embed Size (px)
Citation preview

Economic Outlook
November 4, 2009
2| Economics
Table of Contents
I. National Economic Overview
II. Residential Real Estate Summary
III. North Carolina
Appendix

3| Economics
National Economic Overview
4| Economics
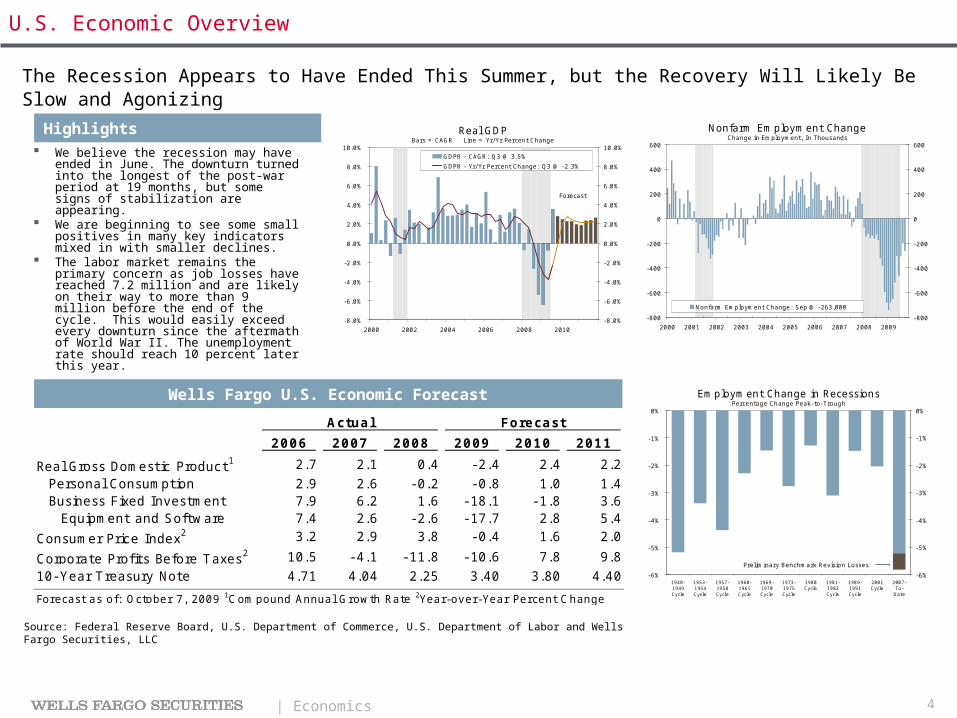
We believe the recession may have ended in June. The downturn turned into the longest of the post-war period at 19 months, but some signs of stabilization are appearing.
We are beginning to see some small positives in many key indicators mixed in with smaller declines.
The labor market remains the primary concern as job losses have reached 7.2 million and are likely on their way to more than 9 million before the end of the cycle. This would easily exceed every downturn since the aftermath of World War II. The unemployment rate should reach 10 percent later this year.
Level One Level Two
Level Three Level Four
Highlights
The Recession Appears to Have Ended This Summer, but the Recovery Will Likely Be Slow and Agonizing
U.S. Economic Overview
Real GDP Bars = CAGR Line = Yr/ Yr Percent Change
-8.0%
-6.0%
-4.0%
-2.0%
0.0%
2.0%
4.0%
6.0%
8.0%
10.0%
2000 2002 2004 2006 2008 2010
-8.0%
-6.0%
-4.0%
-2.0%
0.0%
2.0%
4.0%
6.0%
8.0%
10.0%GDPR - CAGR: Q3 @ 3.5%
GDPR - Yr/ Yr Percent Change: Q3 @ -2.3%
Forecast
Nonfarm Employment ChangeChange in Employment, In Thousands
-800
-600
-400
-200
0
200
400
600
2000 2001 2002 2003 2004 2005 2006 2007 2008 2009
-800
-600
-400
-200
0
200
400
600
Nonfarm Employment Change: Sep @ -263,000
Employment Change in RecessionsPercentage Change Peak- to-Trough
-6%
-5%
-4%
-3%
-2%
-1%
0%
1948-1949Cycle
1953-1954Cycle
1957-1958Cycle
1960-1961Cycle
1969-1970Cycle
1973-1975Cycle
1980Cycle
1981-1982Cycle
1989-1991Cycle
2001Cycle
2007-To-
Date
- 6%
-5%
-4%
-3%
-2%
-1%
0%
Preliminary Benchmark Revision Losses
Actual Forecast
2006 2007 2008 2009 2010 2011
Real Gross Domestic Product1 2.7 2.1 0.4 - 2.4 2.4 2.2
Personal Consumption 2.9 2.6 - 0.2 - 0.8 1.0 1.4Business Fixed Investment 7.9 6.2 1.6 - 18.1 - 1.8 3.6
Equipment and Software 7.4 2.6 - 2.6 - 17.7 2.8 5.4
Consumer Price Index2 3.2 2.9 3.8 - 0.4 1.6 2.0
Corporate Profits Before Taxes2 10.5 - 4.1 - 11.8 - 10.6 7.8 9.8
10- Year Treasury Note 4.71 4.04 2.25 3.40 3.80 4.40
Forecast as of: October 7, 2009 1C ompound Annual Growth Rate 2Year-over-Year Percent C hange
Wells Fargo U.S. Economic Forecast
Source: Federal Reserve Board, U.S. Department of Commerce, U.S. Department of Labor and Wells Fargo Securities, LLC

5| Economics
Real “core” GDP, or private domestic final sales, line up well with the persistent weakness in the domestic economy more clearly than does GDP. The measure has been negative in the past six quarters, and we expect it to turn sustainably positive next year.
International trade collapsed last year. Imports have fallen dramatically this year, while exports have fallen less.
Businesses have struggled to bring inventories in line with demand. Massive liquidations occurred in the first three quarters of this year. We expect the drawdown process to proceed, albeit more slowly, for several more quarters.
Nominal GDP, a measure of revenue growth for the economy, has already seen the steepest decline since 1958 and will likely turn positive in the second half of this year.
Highlights
The Domestic Economy Has Been Extremely Weak but Is on Track for a Modest Recovery
U.S. Economic Overview
Real "Core" GDPBars = CAGR Line = Yr/ Yr Percent Change
-12.5%
-10.0%
-7.5%
-5.0%
-2.5%
0.0%
2.5%
5.0%
7.5%
10.0%
2000 2002 2004 2006 2008 2010
-12.5%
-10.0%
-7.5%
-5.0%
-2.5%
0.0%
2.5%
5.0%
7.5%
10.0%
"Core" GDP - CAGR: Q3 @ 3.2%"Core" GDP - Yr/ Yr Percent Change: Q3 @ -3.4%
Forecast
Trade Balance in Goods3-Month Moving Average, Billions of Dollars
-$80
-$70
-$60
-$50
-$40
-$30
-$20
-$10
$0
97 98 99 00 01 02 03 04 05 06 07 08 09
-$80
-$70
-$60
-$50
-$40
-$30
-$20
-$10
$0Nominal Trade Balance: Aug @ -$41.0 BillionReal Trade Balance: Aug @ -$37.4 Billion
Change in Real I nventories Billions of Dollars, Annual Rate
-$200
-$175
-$150
-$125
-$100
-$75
-$50
-$25
$0
$25
$50
$75
$100
$125
2000 2002 2004 2006 2008 2010
-$200
-$175
-$150
-$125
-$100
-$75
-$50
-$25
$0
$25
$50
$75
$100
$125
Change in Private Inventories: Q3 @ -$130.8B
Forecast
Nominal GDP Compound Annual Growth Rate
-9.0%
-6.0%
-3.0%
0.0%
3.0%
6.0%
9.0%
12.0%
2000 2002 2004 2006 2008 2010
-9.0%
-6.0%
-3.0%
0.0%
3.0%
6.0%
9.0%
12.0%
Nominal GDP - CAGR: Q3 @ 4.3%Nominal GDP - Yr/ Yr Percent Change: Q3 @ -1.7%
Forecast
Source: U.S. Department of Commerce and Wells Fargo Securities, LLC
6| Economics
Discretionary Spending
Non-Discretionary56%
Other Discretionary
20%Housing Away
from Home1%
Food Away from Home
5%
Motor Vehicles3%
Alcohol & Tobacco3%
Clothing & Shoes4%
Recreation4% Furniture &
HHEquip4%
May-2009
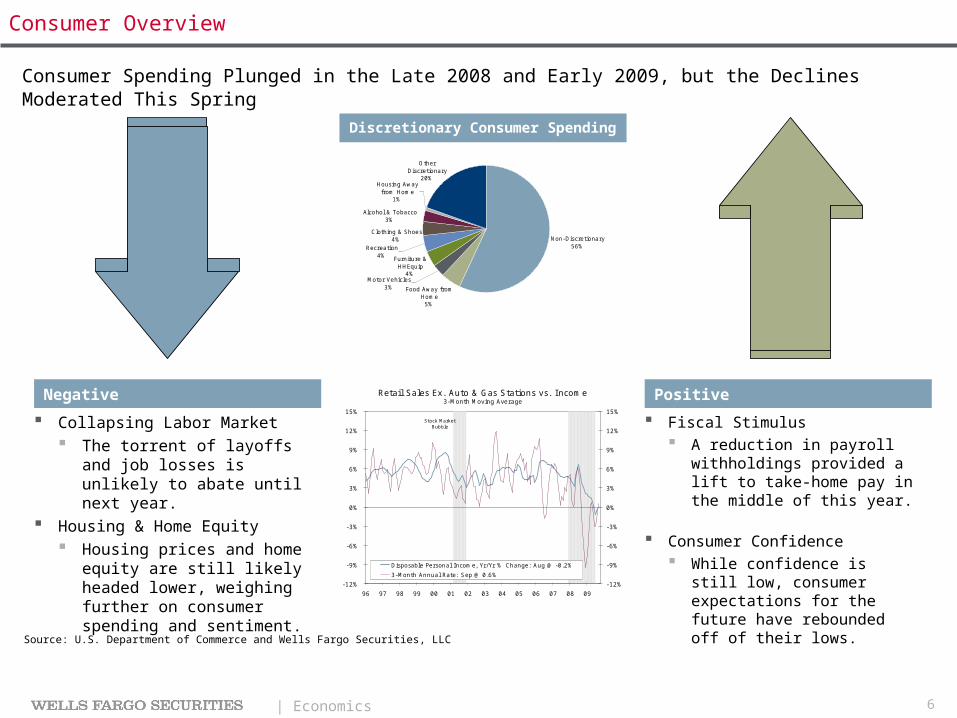
Collapsing Labor Market The torrent of layoffs and
job losses is unlikely to abate until next year.
Housing & Home Equity Housing prices and home
equity are still likely headed lower, weighing further on consumer spending and sentiment.
Fiscal Stimulus A reduction in payroll
withholdings provided a lift to take-home pay in the middle of this year.
Consumer Confidence While confidence is still
low, consumer expectations for the future have rebounded off of their lows.
Negative Retail Sales Ex. Auto & Gas Stations vs. I ncome3-Month Moving Average
-12%
-9%
-6%
-3%
0%
3%
6%
9%
12%
15%
96 97 98 99 00 01 02 03 04 05 06 07 08 09
-12%
-9%
-6%
-3%
0%
3%
6%
9%
12%
15%
Disposable Personal Income, Yr/Yr % Change: Aug @ -0.2%
3-Month Annual Rate: Sep @ 0.6%
Stock Market Bubble
Tax Cut 1
Tax Cut 2 Housing Refi Boom
Tax Rebates
Positive
Discretionary Consumer Spending
Consumer Spending Plunged in the Late 2008 and Early 2009, but the Declines Moderated This Spring
Consumer Overview
Source: U.S. Department of Commerce and Wells Fargo Securities, LLC
7| Economics
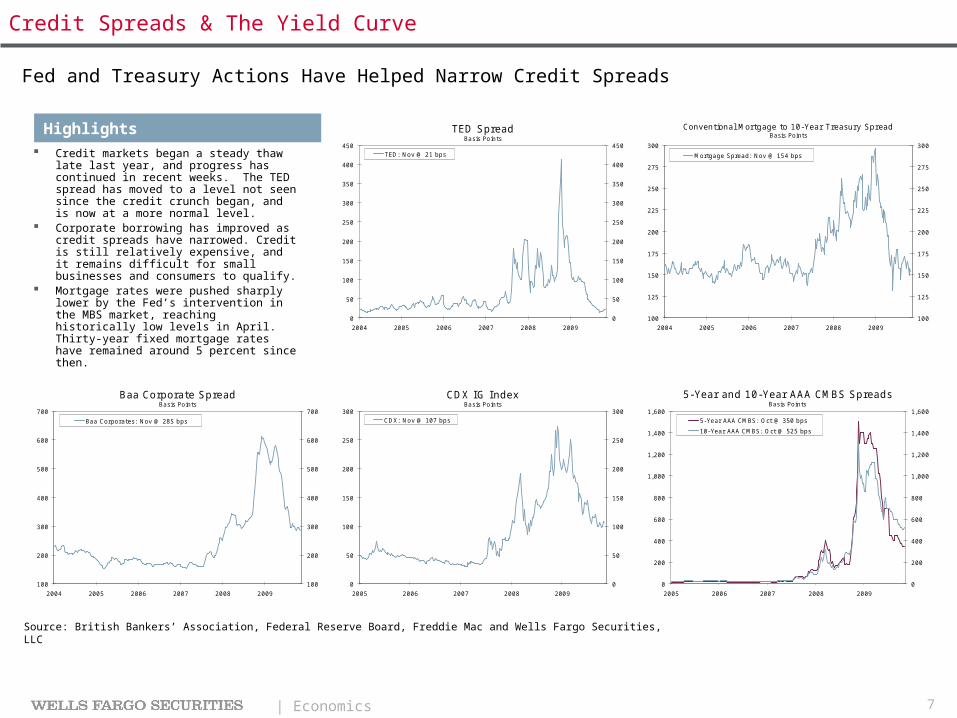
Credit markets began a steady thaw late last year, and progress has continued in recent weeks. The TED spread has moved to a level not seen since the credit crunch began, and is now at a more normal level.
Corporate borrowing has improved as credit spreads have narrowed. Credit is still relatively expensive, and it remains difficult for small businesses and consumers to qualify.
Mortgage rates were pushed sharply lower by the Fed’s intervention in the MBS market, reaching historically low levels in April. Thirty-year fixed mortgage rates have remained around 5 percent since then.
Baa Corporate Spread Basis Points
100
200
300
400
500
600
700
2004 2005 2006 2007 2008 2009
100
200
300
400
500
600
700
Baa Corporates: Nov @ 285 bps
CDX I G I ndexBasis Points
0
50
100
150
200
250
300
2005 2006 2007 2008 2009
0
50
100
150
200
250
300CDX: Nov @ 107 bps
5-Year and 10-Year AAA CMBS SpreadsBasis Points
0
200
400
600
800
1,000
1,200
1,400
1,600
2005 2006 2007 2008 2009
0
200
400
600
800
1,000
1,200
1,400
1,6005-Year AAA CMBS: Oct @ 350 bps
10-Year AAA CMBS: Oct @ 525 bps
Highlights TED Spread Basis Points
0
50
100
150
200
250
300
350
400
450
2004 2005 2006 2007 2008 2009
0
50
100
150
200
250
300
350
400
450TED: Nov @ 21 bps
Conventional Mortgage to 10-Year Treasury SpreadBasis Points
100
125
150
175
200
225
250
275
300
2004 2005 2006 2007 2008 2009
100
125
150
175
200
225
250
275
300
Mortgage Spread: Nov @ 154 bps
Fed and Treasury Actions Have Helped Narrow Credit Spreads
Credit Spreads & The Yield Curve
Source: British Bankers’ Association, Federal Reserve Board, Freddie Mac and Wells Fargo Securities, LLC
8| Economics
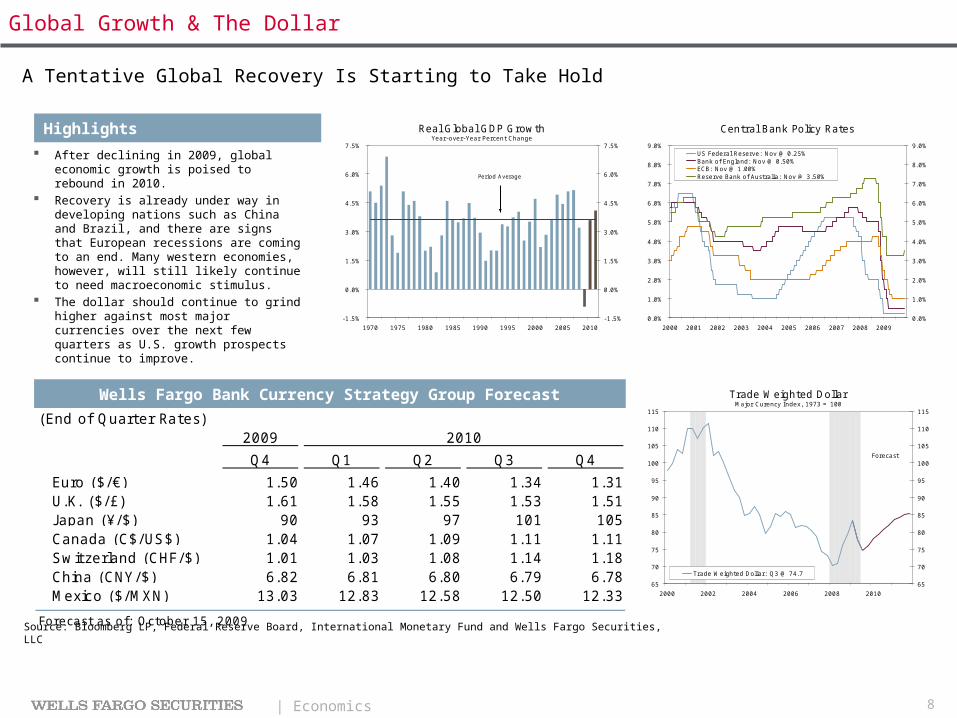
After declining in 2009, global economic growth is poised to rebound in 2010.
Recovery is already under way in developing nations such as China and Brazil, and there are signs that European recessions are coming to an end. Many western economies, however, will still likely continue to need macroeconomic stimulus.
The dollar should continue to grind higher against most major currencies over the next few quarters as U.S. growth prospects continue to improve.
Wells Fargo Bank Currency Strategy Group Forecast Trade Weighted DollarMajor Curency Index, 1973 = 100
65
70
75
80
85
90
95
100
105
110
115
2000 2002 2004 2006 2008 2010
65
70
75
80
85
90
95
100
105
110
115
Trade Weighted Dollar: Q3 @ 74.7
Forecast
Highlights Real Global GDP GrowthYear-over-Year Percent Change
-1.5%
0.0%
1.5%
3.0%
4.5%
6.0%
7.5%
1970 1975 1980 1985 1990 1995 2000 2005 2010
-1.5%
0.0%
1.5%
3.0%
4.5%
6.0%
7.5%
Period Average
Central Bank Policy Rates
0.0%
1.0%
2.0%
3.0%
4.0%
5.0%
6.0%
7.0%
8.0%
9.0%
2000 2001 2002 2003 2004 2005 2006 2007 2008 2009
0.0%
1.0%
2.0%
3.0%
4.0%
5.0%
6.0%
7.0%
8.0%
9.0%US Federal Reserve: Nov @ 0.25%Bank of England: Nov @ 0.50%ECB: Nov @ 1.00%Reserve Bank of Australia: Nov @ 3.50%
A Tentative Global Recovery Is Starting to Take Hold
Global Growth & The Dollar
(End of Quarter Rates)2009 2010
Q4 Q1 Q2 Q3 Q4
Euro ($/€) 1.50 1.46 1.40 1.34 1.31U.K. ($/£) 1.61 1.58 1.55 1.53 1.51J apan (¥/$) 90 93 97 101 105Canada (C$/US$) 1.04 1.07 1.09 1.11 1.11Switzerland (CHF/$) 1.01 1.03 1.08 1.14 1.18China (CNY/$) 6.82 6.81 6.80 6.79 6.78Mexico ($/MXN) 13.03 12.83 12.58 12.50 12.33
Forecast as of: October 15, 2009
Source: Bloomberg LP, Federal Reserve Board, International Monetary Fund and Wells Fargo Securities, LLC
9| Economics
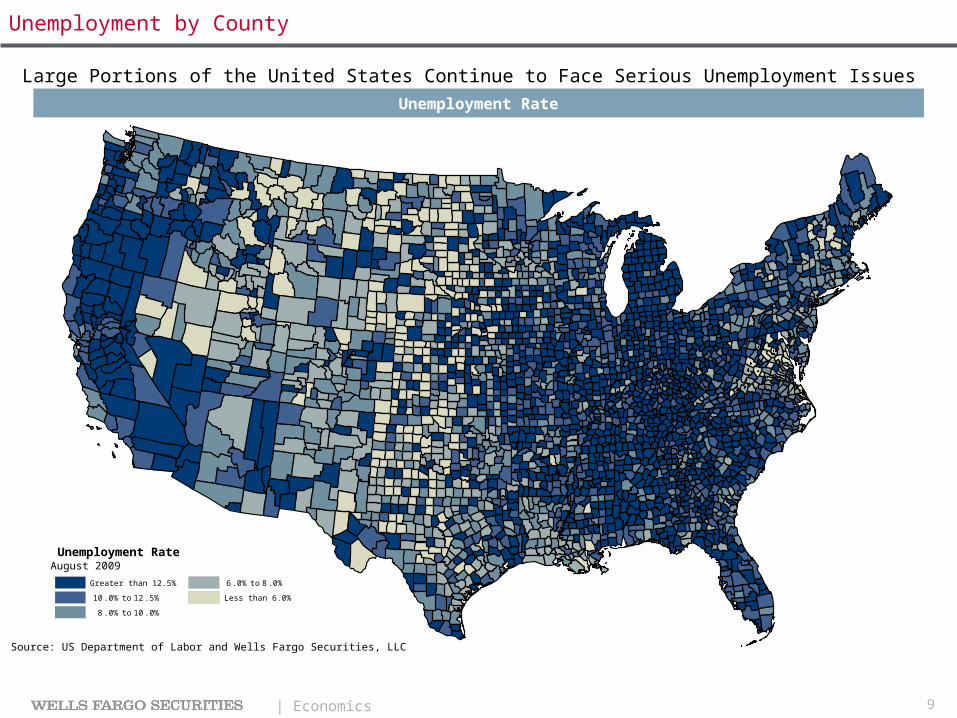
Unemployment by County
Unemployment RateAugust 2009
Greater than 12.5%
10.0% to 12.5%
8.0% to 10.0%
6.0% to 8.0%
Less than 6.0%
Unemployment Rate
Large Portions of the United States Continue to Face Serious Unemployment Issues
Source: US Department of Labor and Wells Fargo Securities, LLC

10| Economics
Residential Real Estate Summary

11| Economics
We estimate an overbuild of roughly 2.0 million units occurred at the cycle peak, and, unfortunately, little progress was made in reducing inventories in 2008 despite the collapse in new home construction. Although inventory levels have improved this year, they still remain elevated. This will likely continue to pressure new construction activity and prices.
Housing starts remain at low levels, although they have inched up recently. Starts probably bottomed during the first half of this year, but we are at least two years away from seeing starts move back above 1 million units.
Excess supply from builders and the rising tide of foreclosed properties have driven prices sharply lower. Price declines have moderated in recent months. Progress will likely remain uneven, and we do not expect to see house prices trough until 2010.
Wells Fargo Housing Outlook Home PricesYear-over-Year Percentage Change
-24%
-20%
-16%
-12%
-8%
-4%
0%
4%
8%
12%
16%
20%
24%
97 99 01 03 05 07 09
-24%
-20%
-16%
-12%
-8%
-4%
0%
4%
8%
12%
16%
20%
24%
Median Sale Price: Sep @ $174,900
Median Sales Price 3-M Mov. Avg.: Sep @ -11.2%
FHFA (OFHEO) Purchase Only Index: J ul @ -4.2%
S&P Case-Shiller Composite 10: Aug @ -10.6%
Highlights Housing StartsMillions of Units
0.0
0.3
0.6
0.9
1.2
1.5
1.8
2.1
2.4
80 82 84 86 88 90 92 94 96 98 00 02 04 06 08 10
0.0
0.3
0.6
0.9
1.2
1.5
1.8
2.1
2.4
Dashed Line is Underlying Demographic Trend
Construction May Have Bottomed, but This Will Likely Not Be the End of the Problems for Housing
Homebuilding
Actual Forecast
2006 2007 2008 2009 2010 2011
Home ConstructionTotal Housing Starts, in thousands 1,811.9 1,341.8 900.3 580.0 790.0 990.0Single- Family Starts, in thousands 1,473.6 1,035.8 615.8 440.0 590.0 770.0Multi- Family Starts, in thousands 338.3 306.1 284.5 140.0 200.0 220.0
Home SalesNew Home Sales, Single- Family, in thousands 1,049.3 768.7 481.3 390.0 550.0 750.0Total Existing Home Sales, in thousands 6,482.9 5,652.8 4,913.0 4,800.0 5,200.0 5,300.0
Home PricesFHFA (OFHEO) Home Price Index, % Change 7.5 2.2 - 2.5 - 4.6 - 0.6 0.5Case-Shiller C-10 Home Price I ndex, % Change 7.4 - 4.4 - 16.7 - 15.4 - 3.0 0.0
Forecast as of: September 25, 2009
Source: Federal Housing Finance Agency, National Association of Realtors, S&P Corp, U.S. Department of Commerce and Wells Fargo Securities, LLC
12| Economics
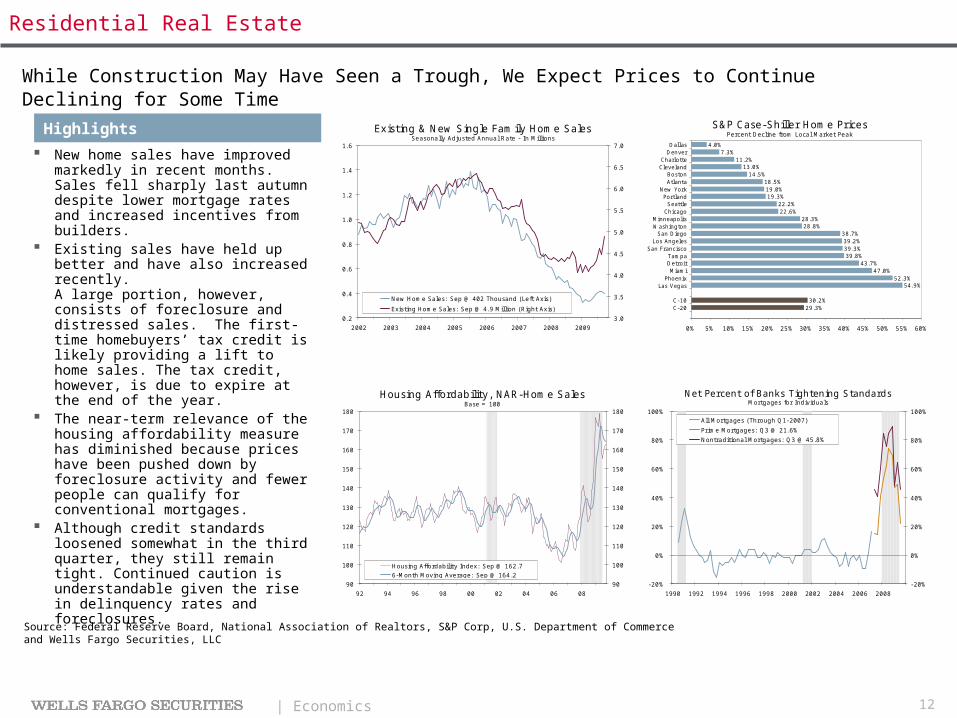
New home sales have improved markedly in recent months. Sales fell sharply last autumn despite lower mortgage rates and increased incentives from builders.
Existing sales have held up better and have also increased recently. A large portion, however, consists of foreclosure and distressed sales. The first-time homebuyers’ tax credit is likely providing a lift to home sales. The tax credit, however, is due to expire at the end of the year.
The near-term relevance of the housing affordability measure has diminished because prices have been pushed down by foreclosure activity and fewer people can qualify for conventional mortgages.
Although credit standards loosened somewhat in the third quarter, they still remain tight. Continued caution is understandable given the rise in delinquency rates and foreclosures.
Housing Affordability, NAR-Home Sales Base = 100
90
100
110
120
130
140
150
160
170
180
92 94 96 98 00 02 04 06 08
90
100
110
120
130
140
150
160
170
180
Housing Affordability Index: Sep @ 162.76-Month Moving Average: Sep @ 164.2
Net Percent of Banks Tightening StandardsMortgages for Individuals
-20%
0%
20%
40%
60%
80%
100%
1990 1992 1994 1996 1998 2000 2002 2004 2006 2008
-20%
0%
20%
40%
60%
80%
100%All Mortgages (Through Q1-2007)
Prime Mortgages: Q3 @ 21.6%
Nontraditional Mortgages: Q3 @ 45.8%
Highlights Existing & New Single Family Home SalesSeasonally Adjusted Annual Rate - In Millions
0.2
0.4
0.6
0.8
1.0
1.2
1.4
1.6
2002 2003 2004 2005 2006 2007 2008 2009
3.0
3.5
4.0
4.5
5.0
5.5
6.0
6.5
7.0
New Home Sales: Sep @ 402 Thousand (Left Axis)
Existing Home Sales: Sep @ 4.9 Million (Right Axis)
S&P Case-Shiller Home PricesPercent Decline from Local Market Peak
4.0%7.3%
11.2%13.0%
14.5%18.5%19.0%19.3%
22.2%22.6%
28.3%28.8%
38.7%39.2%39.3%39.8%
43.7%47.0%
52.3%54.9%
30.2%29.3%
0% 5% 10% 15% 20% 25% 30% 35% 40% 45% 50% 55% 60%
DallasDenver
CharlotteCleveland
BostonAtlanta
New YorkPortland
SeattleChicago
MinneapolisWashington
San DiegoLos Angeles
San FranciscoTampaDetroitMiami
PhoenixLas Vegas
C-10C-20
While Construction May Have Seen a Trough, We Expect Prices to Continue Declining for Some Time
Residential Real Estate
Source: Federal Reserve Board, National Association of Realtors, S&P Corp, U.S. Department of Commerce and Wells Fargo Securities, LLC
13| Economics
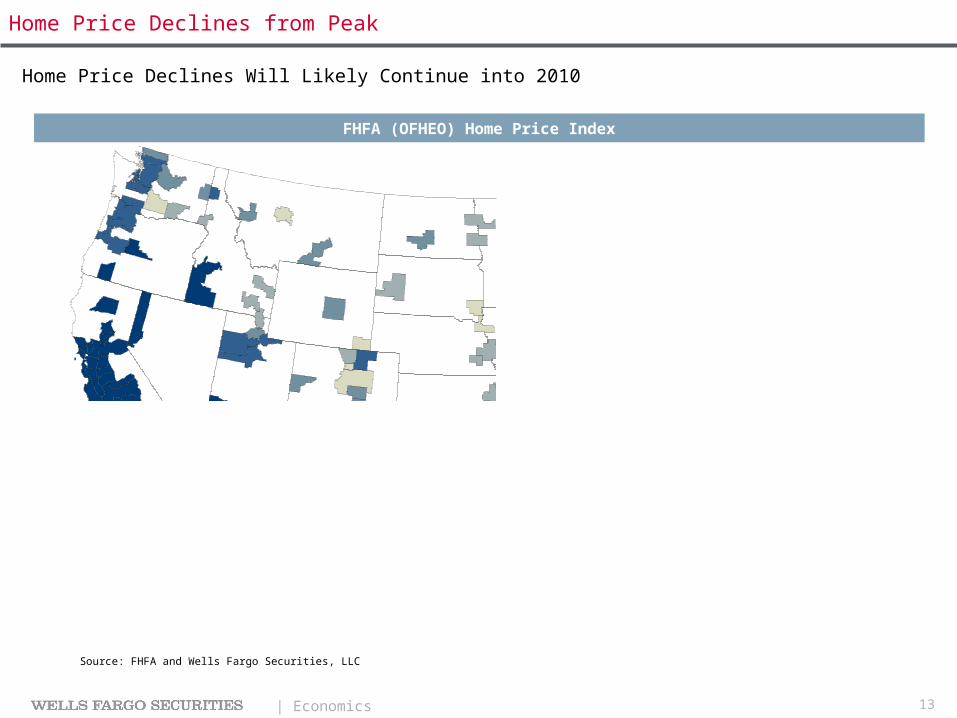
FHFA (OFHEO) Home Price Index
Home Price Declines Will Likely Continue into 2010
Home Price Declines from Peak
Source: FHFA and Wells Fargo Securities, LLC
FHFA: Q1-2009Percent Decline from Peak Value
No Change
0% to 1%
1% to 3%
3% to 9%
More than 9%

14| Economics
North Carolina

15| Economics
North Carolina’s unemployment rate has more than doubled since the start of the recession. Labor force growth has certainly contributed to the rise in the unemployment rate, but layoffs have also mounted at an alarming rate. Layoffs are most notable in the construction and manufacturing sectors, which still account for about 20 percent of total employment in the state.
Payroll employment declined more than five percent from its peak in several major metro areas including Charlotte and Greensboro. Recently, however, the declines have been slowing. With such severe job losses, personal income will likely fall this year, hitting the state’s retailers and consumer sectors.
New single-family building activity has declined considerably from cycle highs as local and national builders scaled back. Construction likely bottomed earlier this year, and single-family construction activity has inched up recently.
Most of the state did not experience the same rapid home price appreciation during the housing boom as other parts of the country. Home prices declined more than six percent in the second quarter, and we do not expect price appreciation to return for at least another year.
North Carolina Unemployment RateSeasonally Adjusted
2%
3%
4%
5%
6%
7%
8%
9%
10%
11%
12%
90 92 94 96 98 00 02 04 06 08
2%
3%
4%
5%
6%
7%
8%
9%
10%
11%
12%Unemployment Rate: Sep @ 10.8%
12-Month Moving Average: Sep @ 9.7%
North Carolina Housing PermitsThousands of Permits, Seasonally Adjusted Annual Rate
0
20
40
60
80
100
120
90 92 94 96 98 00 02 04 06 08
0
20
40
60
80
100
120Single-Family: Sep @ 27,288Single-Family, 12-Month Moving Avg.: Sep @ 25,234Multi-Family, 12-Month Moving Avg.: Sep @ 9,394
Highlights North Carolina Nonfarm Employment3-Month Moving Averages
-9%
-6%
-3%
0%
3%
6%
90 92 94 96 98 00 02 04 06 08
-9%
-6%
-3%
0%
3%
6%
3-Month Annual Rate: Sep @ -2.6%Year-over-Year Percent Change: Sep @ -5.1%
Household: Year/ Year Percent Change: Sep @ -5.1%
North Carolina Relative EmploymentJ anuary 2000 = 100
92
96
100
104
108
112
116
120
124
00 01 02 03 04 05 06 07 08 09
92
96
100
104
108
112
116
120
124North Carolina: Sep @ 101.0Raleigh: Sep @ 116.6Charlotte: Sep @ 107.1Asheville: Sep @ 103.5Greensboro: Sep @ 95.0
Unemployment and Housing Freeze the Economy
North Carolina
Source: U.S. Department of Commerce, U.S. Department of Labor and Wells Fargo Securities, LLC
16| Economics
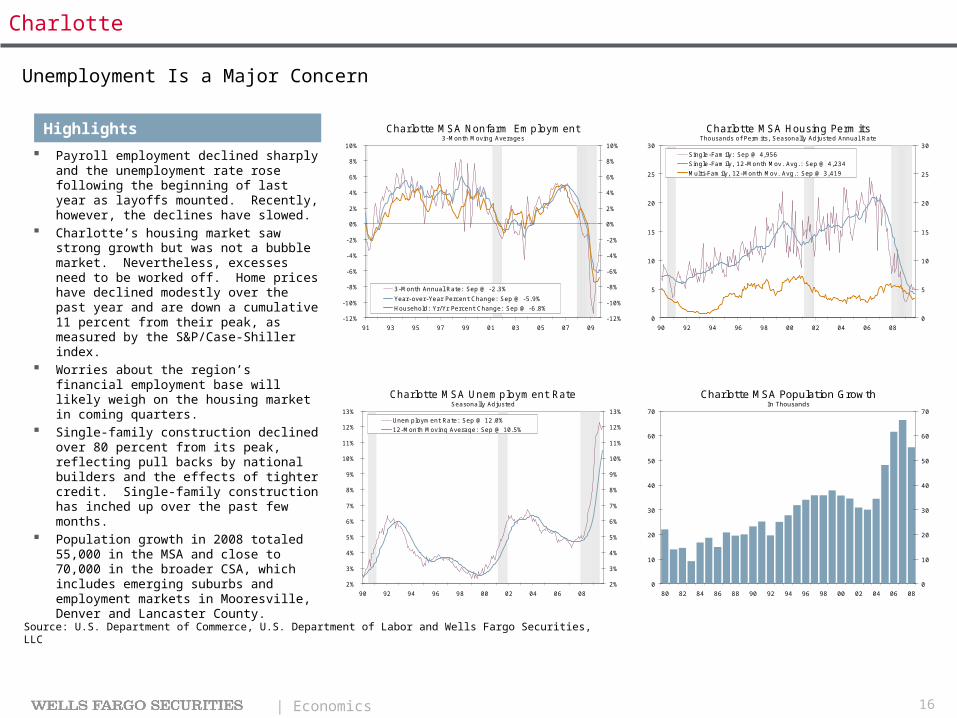
Payroll employment declined sharply and the unemployment rate rose following the beginning of last year as layoffs mounted. Recently, however, the declines have slowed.
Charlotte’s housing market saw strong growth but was not a bubble market. Nevertheless, excesses need to be worked off. Home prices have declined modestly over the past year and are down a cumulative 11 percent from their peak, as measured by the S&P/Case-Shiller index.
Worries about the region’s financial employment base will likely weigh on the housing market in coming quarters.
Single-family construction declined over 80 percent from its peak, reflecting pull backs by national builders and the effects of tighter credit. Single-family construction has inched up over the past few months.
Population growth in 2008 totaled 55,000 in the MSA and close to 70,000 in the broader CSA, which includes emerging suburbs and employment markets in Mooresville, Denver and Lancaster County.
Charlotte MSA Unemployment RateSeasonally Adjusted
2%
3%
4%
5%
6%
7%
8%
9%
10%
11%
12%
13%
90 92 94 96 98 00 02 04 06 08
2%
3%
4%
5%
6%
7%
8%
9%
10%
11%
12%
13%Unemployment Rate: Sep @ 12.0%
12-Month Moving Average: Sep @ 10.5%
Charlotte MSA Population GrowthIn Thousands
0
10
20
30
40
50
60
70
80 82 84 86 88 90 92 94 96 98 00 02 04 06 08
0
10
20
30
40
50
60
70
Highlights Charlotte MSA Nonfarm Employment3-Month Moving Averages
-12%
-10%
-8%
-6%
-4%
-2%
0%
2%
4%
6%
8%
10%
91 93 95 97 99 01 03 05 07 09
-12%
-10%
-8%
-6%
-4%
-2%
0%
2%
4%
6%
8%
10%
3-Month Annual Rate: Sep @ -2.3%
Year-over-Year Percent Change: Sep @ -5.9%
Household: Yr/ Yr Percent Change: Sep @ -6.8%
Charlotte MSA Housing PermitsThousands of Permits, Seasonally Adjusted Annual Rate
0
5
10
15
20
25
30
90 92 94 96 98 00 02 04 06 08
0
5
10
15
20
25
30Single-Family: Sep @ 4,956
Single-Family, 12-Month Mov. Avg.: Sep @ 4,234
Multi- Family, 12-Month Mov. Avg.: Sep @ 3,419
Unemployment Is a Major Concern
Charlotte
Source: U.S. Department of Commerce, U.S. Department of Labor and Wells Fargo Securities, LLC
17| Economics
Charlotte CSA
Charlotte CSA Population GrowthThousands of Persons
0
10
20
30
40
50
60
70
80
90
80 82 84 86 88 90 92 94 96 98 00 02 04 06 08
0
10
20
30
40
50
60
70
80
90Greater Charlotte: 2008 @ 12.1
Charlotte MSA: 2008 @ 55.4
Charlotte CMSA: 2008 @ 67.5
Charlotte CSA Employment GrowthAnnual Growth, Thousands of J obs
-30
-20
-10
0
10
20
30
40
50
1992 1994 1996 1998 2000 2002 2004 2006 2008
-30
-20
-10
0
10
20
30
40
50
Charlotte CMSA: 2008 @ -8.3
Greater Charlotte: 2008 @ -4.6
Charlotte MSA: 2008 @ -3.7
2008 is year-to-date
Charlotte CSA J ob GrowthYear-over-Year Percent Change
-8%
-6%
-4%
-2%
0%
2%
4%
6%
8%
1991 1993 1995 1997 1999 2001 2003 2005 2007 2009
-8%
-6%
-4%
-2%
0%
2%
4%
6%
8%
Year-over-Year Percent Change: Mar @ -6.91%
Charlotte CSA Unemployment RatePercent of Labor Force
0%
2%
4%
6%
8%
10%
12%
14%
1990 1992 1994 1996 1998 2000 2002 2004 2006 2008
0%
2%
4%
6%
8%
10%
12%
14%
Unemployment Rate: Sep @ 12.6%
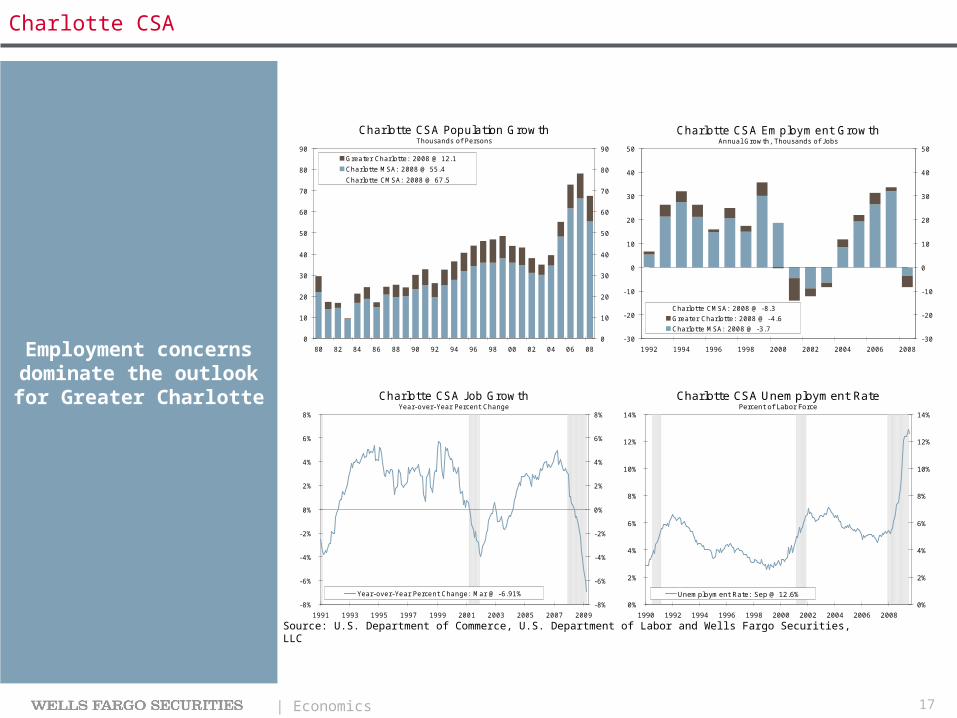
Employment concerns dominate the outlook for Greater Charlotte
Source: U.S. Department of Commerce, U.S. Department of Labor and Wells Fargo Securities, LLC

18| Economics
Appendix

19| Economics
Monthly Economic Outlook
Weekly Economic & Financial Commentary
Special Reports
Economic Indicators
Global Economic Commentary
Federal Reserve Commentary
Real Estate & Housing
Consumer & Retail
Chief Economist List
To join any of our research distribution lists, please visit our website: http://www.wachovia.com/econo
micsemail
Distribution Lists Recent Special Commentary
A Sampling of Our Recent Special, Regional and Industry Commentary
Economics Group Publications
Date Title Authors
November- 03 How Bleak Is the Brit ish Consumer Spending Outlook Bryson
October- 20 What Is Gold Telling Us? Bryson, Khan & Kama.October- 19 Housing Chartbook: October 2009 Vitner & YorkOctober- 15 Beyond America, Canadian Economic Prospects Bryson & QuinlanOctober- 06 Georgia Economic Outlook: October 2009 Vitner & KamaruddinOctober- 05 Comments Before Federal Reserve Advisory Panel Silvia
September- 24 What's Wrong With the Dollar? BrysonSeptember- 03 Commercial Real Estate Chartbook: Second Quarter Vitner, Khan & Kamar.September- 02 Clunkernomics: Auto Sales Set to Boost Real GDP Vitner & Khan
August- 31 Benchmarking Recovery: Rhyming not Repeating SilviaAugust- 26 Will Debt Restrain Euro- zone Consumer Spending? BrysonAugust- 24 State & Local Financial Woes Still Building Vitner & KhanAugust- 18 Wobbly Fundamentals for Business Spending Silvia & QuinlanAugust- 14 Housing Chartbook: August 2009 Vitner & YorkAugust- 14 Healthcare Employment Stays out of the Sick Ward Silvia, York & WhelanAugust- 13 Early Recoveries are Typically “J obless” Silvia & York
J uly- 29 Recession Probability Drops Again Silvia & IqbalJ uly- 21 Decision- Makers’ Guide to Stimulus Part Deux SilviaJ uly- 16 Is China the Next Bubble? BrysonJ uly- 08 Macro Clouds, Micro Foundations SilviaJ uly- 01 Pass- Through Effect of Housing Weakness Vitner & Whelan
J une- 30 New J ersey Outlook - J une 2009 Vitner, Khan & Kamar.J une- 30 Cash- for- Clunkers Boost Likely Unsustainable Vitner & KhanJ une- 29 Breakdown, Adjustment & Rebuilding in Finance SilviaJ une- 25 Recession Probability Drops Again to 37 Percent Silvia & IqbalJ une- 19 Labor Market Evolution: Realit ies and Romantics Silvia, York & WhelanJ une- 18 What Drives Consumer Delinquency Rates? Vitner & IqbalJ une- 11 Florida Economic Outlook - J une 2009 Vitner & Kamaruddin
20| Economics
Wells Fargo Securities, LLC Economics Group
Wells Fargo Securities Economics Group publications are produced by Wells Fargo Securities, LLC, a U.S broker-dealer registered with the U.S. Securities and Exchange Commission, the Financial Industry Regulatory Authority, and the Securities Investor Protection Corp. Wells Fargo Securities, LLC, distributes these publications directly and through subsidiaries including, but not limited to, Wells Fargo & Company, Wachovia Bank N.A., Wells Fargo Bank N.A, Wells Fargo Advisors, LLC, and Wells Fargo Securities International Limited. The information and opinions herein are for general information use only. Wells Fargo Securities, LLC does not guarantee their accuracy or completeness, nor does Wells Fargo Securities, LLC assume any liability for any loss that may result from the reliance by any person upon any such information or opinions. Such information and opinions are subject to change without notice, are for general information only and are not intended as an offer or solicitation with respect to the purchase or sales of any security or as personalized investment advice. Wells Fargo Securities, LLC is a separate legal entity and distinct from affiliated banks and is a wholly owned subsidiary of Wells Fargo & Company © 2009 Wells Fargo Securities, LLC.
SECURITIES: NOT FDIC-INSURED/NOT BANK-GUARANTEED/MAY LOSE VALUE
John E. Silvia, Ph.D.Chief Economist
Diane Schumaker-Krieg Global Head of Research & Economics
[email protected] [email protected]
Sam BullardEconomist
Desk OperationsFinancial Services
Anika KhanEconomist
Real EstateRetail & Automotive
Azhar IqbalEconometrician
Quantitative Macro-Economic Modeling
Adam G. YorkEconomist
[email protected]. ConsumerReal Estate
Ed KashmarekEconomist
U.S. Macro Economy
Tim QuinlanEconomic Analyst
Global EconomiesBusiness Investment
Kim WhelanEconomic Analyst
U.S. Macro EconomyBusiness Investment
Yasmine KamaruddinEconomic Analyst
U.S. Macro Economy
Mark VitnerSenior Economist
U.S. Macro EconomyReal Estate
Jay H. Bryson, Ph.D.Global Economist
[email protected] EconomiesForeign Exchange
Scott Anderson, Ph.D. Senior Economist
U.S. Macro Economy
Eugenio Aleman, Ph.D. Senior Economist
U.S. Macro Economy