Embed Size (px)
Citation preview

March 4, 2009
Economic Outlook

CCIM Institute 2
Table of Contents
I. National Economic Overview
II. Residential Real Estate Summary
III. North Carolina
Appendix

CCIM Institute 3
National Economic Overview
CCIM Institute 4
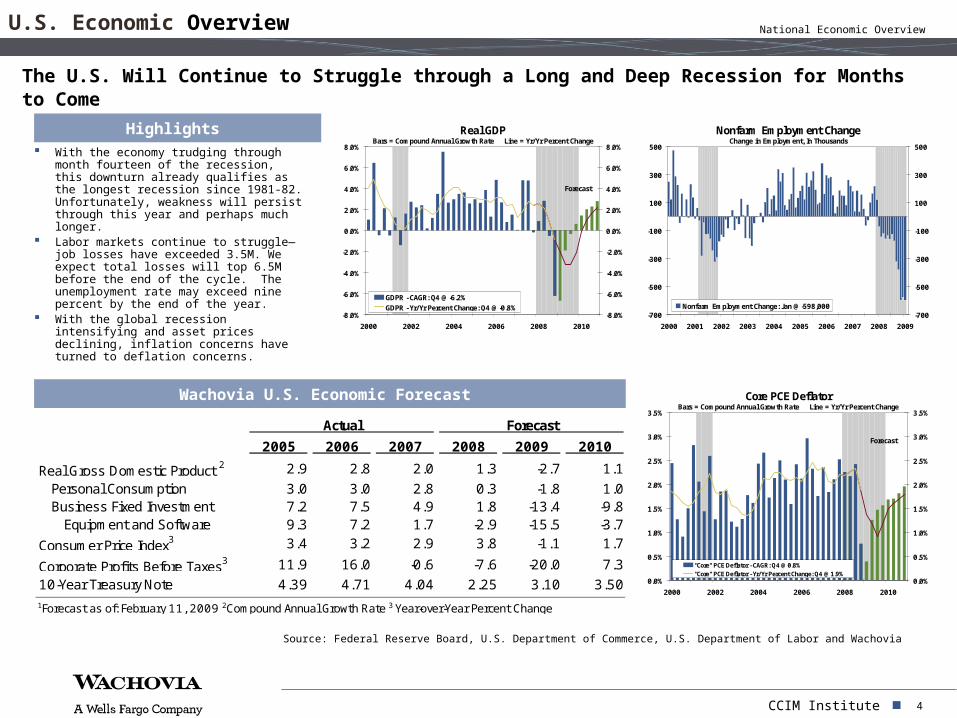
With the economy trudging through month fourteen of the recession, this downturn already qualifies as the longest recession since 1981-82. Unfortunately, weakness will persist through this year and perhaps much longer.
Labor markets continue to struggle—job losses have exceeded 3.5M. We expect total losses will top 6.5M before the end of the cycle. The unemployment rate may exceed nine percent by the end of the year.
With the global recession intensifying and asset prices declining, inflation concerns have turned to deflation concerns.
Actual Forecast
2005 2006 2007 2008 2009 2010
Real Gross Domestic Product 2 2.9 2.8 2.0 1.3 -2.7 1.1
Personal Consumption 3.0 3.0 2.8 0.3 -1.8 1.0Business Fixed Investment 7.2 7.5 4.9 1.8 -13.4 -9.8
Equipment and Software 9.3 7.2 1.7 -2.9 -15.5 -3.7
Consumer Price Index3 3.4 3.2 2.9 3.8 -1.1 1.7
Corporate Profits Before Taxes3 11.9 16.0 -0.6 -7.6 -20.0 7.3
10-Year Treasury Note 4.39 4.71 4.04 2.25 3.10 3.501Forecast as of: February 11, 2009 2Compound Annual Growth Rate 3 Year-over-Year Percent Change
Wachovia U.S. Economic Forecast
Highlights Real GDP Bars = Compound Annual Growth Rate Line = Yr/Yr Percent Change
-8.0%
-6.0%
-4.0%
-2.0%
0.0%
2.0%
4.0%
6.0%
8.0%
2000 2002 2004 2006 2008 2010
-8.0%
-6.0%
-4.0%
-2.0%
0.0%
2.0%
4.0%
6.0%
8.0%
GDPR - CAGR: Q4 @ -6.2%GDPR - Yr/Yr Percent Change: Q4 @ -0.8%
Forecast
Nonfarm Employment ChangeChange in Employment, In Thousands
-700
-500
-300
-100
100
300
500
2000 2001 2002 2003 2004 2005 2006 2007 2008 2009
-700
-500
-300
-100
100
300
500
Nonfarm Employment Change: Jan @ -598,000
The U.S. Will Continue to Struggle through a Long and Deep Recession for Months to Come
U.S. Economic Overview
Source: Federal Reserve Board, U.S. Department of Commerce, U.S. Department of Labor and Wachovia
Core PCE DeflatorBars = Compound Annual Growth Rate Line = Yr/Yr Percent Change
0.0%
0.5%
1.0%
1.5%
2.0%
2.5%
3.0%
3.5%
2000 2002 2004 2006 2008 2010
0.0%
0.5%
1.0%
1.5%
2.0%
2.5%
3.0%
3.5%
"Core" PCE Deflator - CAGR: Q4 @ 0.8%"Core" PCE Deflator - Yr/Yr Percent Change: Q4 @ 1.9%
Forecast
National Economic Overview

CCIM Institute 5
Real "core" GDP, or private domestic final sales, lines up with the recession and shows the persistent weakness in the domestic economy more clearly than GDP. The measure has been negative in four of the last five quarters and we expect it will continue to contract until early 2010.
The nation's trade balance added significantly to growth in 2008. Export growth remained strong for most of the year while the domestic economy weakened. However, by year-end both export and import activity were collapsing; on net we see little impact from trade on GDP in 2009.
Inventory growth has been weak for some time, yet businesses have shown indications of unintentional builds. We expect massive liquidations in coming months as retailers and manufacturers alike cut back.
Nominal GDP, a measure of revenue growth for the economy, will likely continue to fall, having already seen the steepest decline since 1958.
Nominal GDP Compound Annual Growth Rate
-8.0%
-6.0%
-4.0%
-2.0%
0.0%
2.0%
4.0%
6.0%
8.0%
10.0%
2000 2002 2004 2006 2008 2010
-8.0%
-6.0%
-4.0%
-2.0%
0.0%
2.0%
4.0%
6.0%
8.0%
10.0%
Nominal GDP - CAGR: Q4 @ -5.8%Nominal GDP - Yr/Yr Percent Change: Q4 @ 1.2%
Forecast
Change in Real Inventories Billions of Dollars, Annual Rate
-$100
-$75
-$50
-$25
$0
$25
$50
$75
$100
$125
2000 2002 2004 2006 2008 2010
-$100
-$75
-$50
-$25
$0
$25
$50
$75
$100
$125Change in Private Inventories: Q4 @ -$19.9B
Forecast
Highlights Trade Balance in Goods3-Month Moving Average, Billions of Dollars
-$80
-$70
-$60
-$50
-$40
-$30
-$20
-$10
$0
97 98 99 00 01 02 03 04 05 06 07 08
-$80
-$70
-$60
-$50
-$40
-$30
-$20
-$10
$0
Nominal Trade Balance: Dec @ -$58.1 Billion
Real Trade Balance: Dec @ -$43.1 Billion
Real "Core" GDPBars = Compound Annual Growth Rate Line = Yr/Yr Percent Change
-10.0%
-7.5%
-5.0%
-2.5%
0.0%
2.5%
5.0%
7.5%
10.0%
2000 2002 2004 2006 2008 2010
-10.0%
-7.5%
-5.0%
-2.5%
0.0%
2.5%
5.0%
7.5%
10.0%
"Core" GDP - CAGR: Q4 @ -7.5%"Core" GDP - Yr/Yr Percent Change: Q4 @ -2.8%
Forecast
The Domestic Economy Has Been and Will Continue to Be Extremely Weak
U.S. Economic Overview
Source: U.S. Department of Commerce and Wachovia
National Economic Overview

CCIM Institute 6
Consumer Overview
Consumer Spending Is Plunging at Unprecedented Rates, but Gains may Return by the Second Half
Collapsing Labor Market The torrent of layoffs and job
losses is unlikely to abate before year-end.
Housing & Home Equity Housing prices and home equity
are falling, weighing on consumer spending and sentiment.
Consumer Confidence Nervous consumers are in no
mood to shop for big ticket items.
Discretionary Spending
Furniture & HHEquip
4%
Recreation4%
Clothing & Shoes4%
Alcohol & Tobacco3%
Motor Vehicles3% Food Away from
Home5%
Housing Away from Home
1%
Other Discretionary
19%
Non-Discretionary57%
December-2008
Declining Energy Prices Positives are few and far
between for U.S. consumers, thus the declines in energy prices in late 2008 were a welcome respite.
Fiscal Stimulus A reduction in payroll
withholdings may provide a lift to take-home pay by mid-year.
Negative
Discretionary Consumer Spending
PositiveRetail Sales Ex. Auto and Gas vs. Income Growth3-Month Moving Averages
-12.5%
-10.0%
-7.5%
-5.0%
-2.5%
0.0%
2.5%
5.0%
7.5%
10.0%
12.5%
15.0%
96 97 98 99 00 01 02 03 04 05 06 07 08 09
-12.5%
-10.0%
-7.5%
-5.0%
-2.5%
0.0%
2.5%
5.0%
7.5%
10.0%
12.5%
15.0%
Disposable Personal Income Yr/Yr % Change: Dec @ 2.7%3-Month Annual Rate: Jan @ -8.9%
Stock Market Bubble
Tax Cut 1
Tax Cut 2 Housing Refi Boom
Tax Rebates
dis
Source: U.S. Department of Commerce and Wachovia
National Economic Overview

CCIM Institute 7
Credit markets have begun a slow thaw and the TED spread, one of our favorite measures of fixed income market stress, has fallen to its lowest level since last summer. The risk for new shocks still remains, however.
Credit remains expensive for businesses and consumers alike and is extremely constrained.
Mortgage rates have been volatile in recent weeks. Lower rates have the potential to speed a housing bottom, but credit availability remains a major concern.
5-Year and 10-Year AAA CMBS SpreadsBasis Points
0
200
400
600
800
1000
1200
1400
1600
2005 2006 2007 2008 2009
0
200
400
600
800
1000
1200
1400
16005-Year AAA CMBS: Feb @ 1,300 bps
10-Year AAA CMBS: Feb @ 1,100 bps
Highlights TED Spread Basis Points
0
50
100
150
200
250
300
350
400
450
2004 2005 2006 2007 2008 2009
0
50
100
150
200
250
300
350
400
450TED: Feb @ 95 bps
Conventional Mortgage to 10-Year Treasury SpreadBasis Points
100
125
150
175
200
225
250
275
300
2004 2005 2006 2007 2008 2009
100
125
150
175
200
225
250
275
300Mortgages: Feb @ 229 bps
We are not of the Woods yet, but Some Signs are Looking Up
Credit Spreads & The Yield Curve
Source: Bloomberg LP, Federal Reserve Board, Freddie Mac, Wachovia Securities and Wachovia
CDX IG IndexBasis Points
0
50
100
150
200
250
300
2005 2006 2007 2008 2009
0
50
100
150
200
250
300CDX: Feb @ 217 bps
Baa Corporate Spread Basis Points
100
200
300
400
500
600
700
2004 2005 2006 2007 2008 2009
100
200
300
400
500
600
700Baa Corporates: Feb @ 526 bps
National Economic Overview

CCIM Institute 8
The global economy will likely contract for the first time since IMF records began.
Weakness in Europe may even exceed that of the U.S., with the Euro-zone and the U.K. now both in recession. Central banks across Europe have cut their policy rates aggressively in response.
The dollar should continue to grind higher against most major currencies over the next year, but may give back all of those gains over the following year.
(End of Quarter Rates)2009 2010
Q1 Q2 Q3 Q4 Q1 Q2 Q3 Q4
Major CurrenciesEuro ($/ €) 1.25 1.18 1.16 1.16 1.20 1.25 1.30 1.35U.K. ($/ £) 1.44 1.42 1.40 1.45 1.48 1.54 1.58 1.64U.K. (£/ €) 0.87 0.83 0.83 0.80 0.81 0.81 0.82 0.82Japan (¥/ $) 94 100 105 108 105 102 100 98
Other IndustrializedCanada (C$/ US$) 1.25 1.28 1.30 1.28 1.22 1.15 1.10 1.08Switzerland (CHF/ $) 1.20 1.28 1.32 1.32 1.30 1.26 1.22 1.18Norway (NOK/ $) 6.90 7.00 6.90 6.70 6.40 6.20 5.90 5.70Sweden (SEK/ $) 8.30 8.60 8.60 8.40 8.00 7.60 7.30 7.00Australia (US$/ A$) 0.66 0.65 0.64 0.68 0.72 0.76 0.78 0.80
1Data as of: February 11, 2009
Wachovia Major Currency Forecast Trade Weighted DollarMajor Curency Index, 1973 = 100
65
70
75
80
85
90
95
100
105
110
115
2000 2002 2004 2006 2008 2010
65
70
75
80
85
90
95
100
105
110
115
Trade Weighted Dollar: Q4 @ 79.4
Forecast
Highlights Real Global GDP GrowthYear-over-Year Percent Change
-1.5%
0.0%
1.5%
3.0%
4.5%
6.0%
7.5%
1970 1975 1980 1985 1990 1995 2000 2005 2010
-1.5%
0.0%
1.5%
3.0%
4.5%
6.0%
7.5%
Period Average
Central Bank Policy Rates
0.0%
1.0%
2.0%
3.0%
4.0%
5.0%
6.0%
7.0%
8.0%
9.0%
2000 2001 2002 2003 2004 2005 2006 2007 2008 2009
0.0%
1.0%
2.0%
3.0%
4.0%
5.0%
6.0%
7.0%
8.0%
9.0%US Federal Reserve: Feb @ 0.25%Bank of England: Feb @ 1.00%ECB: Feb @ 2.00%Reserve Bank of Australia: Feb @ 3.25%
The Global Recession Intensifies
Global Growth and the Dollar
Source: Bloomberg LP, Federal Reserve Board, International Monetary Fund and Wachovia
National Economic Overview

CCIM Institute 9
Residential Real Estate Summary
CCIM Institute 10
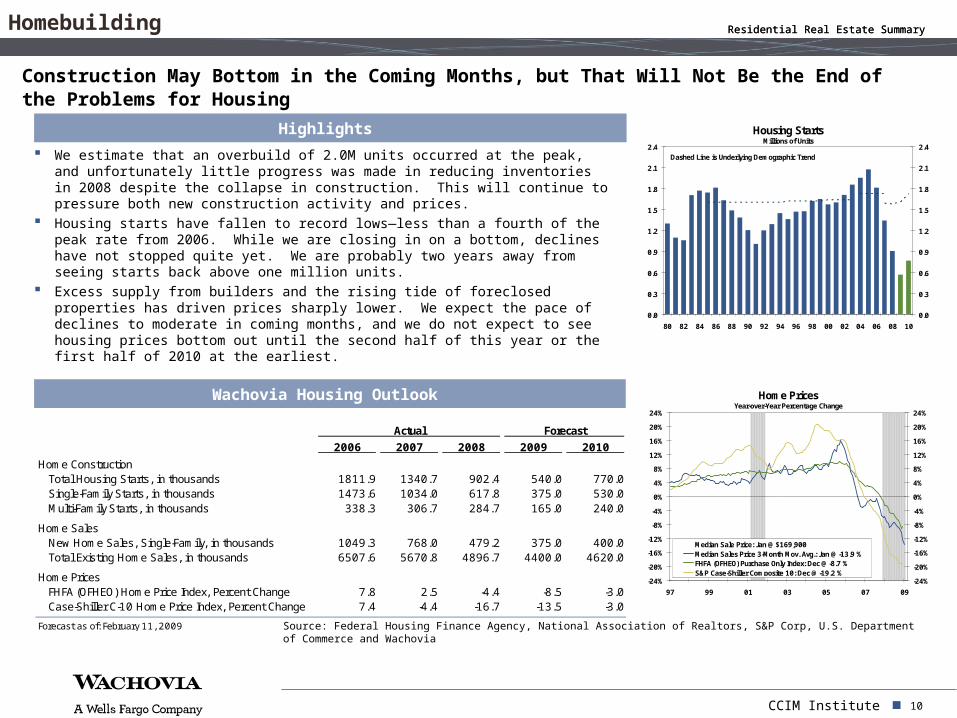
We estimate that an overbuild of 2.0M units occurred at the peak, and unfortunately little progress was made in reducing inventories in 2008 despite the collapse in construction. This will continue to pressure both new construction activity and prices.
Housing starts have fallen to record lows—less than a fourth of the peak rate from 2006. While we are closing in on a bottom, declines have not stopped quite yet. We are probably two years away from seeing starts back above one million units.
Excess supply from builders and the rising tide of foreclosed properties has driven prices sharply lower. We expect the pace of declines to moderate in coming months, and we do not expect to see housing prices bottom out until the second half of this year or the first half of 2010 at the earliest.
Home PricesYear-over-Year Percentage Change
-24%
-20%
-16%
-12%
-8%
-4%
0%
4%
8%
12%
16%
20%
24%
97 99 01 03 05 07 09
-24%
-20%
-16%
-12%
-8%
-4%
0%
4%
8%
12%
16%
20%
24%
Median Sale Price: Jan @ $169,900Median Sales Price 3-Month Mov. Avg.: Jan @ -13.9 %FHFA (OFHEO) Purchase Only Index: Dec @ -8.7 %S&P Case-Shiller Composite 10: Dec @ -19.2 %
Housing StartsMillions of Units
0.0
0.3
0.6
0.9
1.2
1.5
1.8
2.1
2.4
80 82 84 86 88 90 92 94 96 98 00 02 04 06 08 10
0.0
0.3
0.6
0.9
1.2
1.5
1.8
2.1
2.4Dashed Line is Underlying Demographic Trend
Residential Real Estate Summary
Construction May Bottom in the Coming Months, but That Will Not Be the End of the Problems for Housing
Homebuilding
Highlights
Actual Forecast
2006 2007 2008 2009 2010
Home ConstructionTotal Housing Starts, in thousands 1811.9 1340.7 902.4 540.0 770.0Single-Family Starts, in thousands 1473.6 1034.0 617.8 375.0 530.0Multi-Family Starts, in thousands 338.3 306.7 284.7 165.0 240.0
Home SalesNew Home Sales, Single-Family, in thousands 1049.3 768.0 479.2 375.0 400.0Total Existing Home Sales, in thousands 6507.6 5670.8 4896.7 4400.0 4620.0
Home PricesFHFA (OFHEO) Home Price Index, Percent Change 7.8 2.5 -4.4 -8.5 -3.0Case-Shiller C-10 Home Price Index, Percent Change 7.4 -4.4 -16.7 -13.5 -3.0
Forecast as of: February 11, 2009
Wachovia Housing Outlook
Source: Federal Housing Finance Agency, National Association of Realtors, S&P Corp, U.S. Department of Commerce and Wachovia
Residential Real Estate Summary

CCIM Institute 11
New home sales fell sharply during the latter part of 2008 despite lower mortgage rates and incentives from builders. Unfortunately, sales will continue to struggle in the first half.
Existing sales held up better, but since such a large proportion were distressed, sales could actually fall sharply if foreclosure moratoriums and other efforts to modify existing mortgages gain traction. We would not necessarily see that as a bad thing.
Affordability measures soared to multi-decade highs as mortgage rates and median home prices fell rapidly. The near-term relevance of the measure has diminished because prices are being pushed lower by foreclosure activity, and tighter credit standards mean fewer consumers have access to today’s lower rates.
Credit standards remain exceptionally tight for all types of borrowers—about half of loan officers indicated they were still tightening standards in the first quarter, despite all of their previous tightening. The continued caution is understandable given the rise in delinquency rates and foreclosures.
Housing Affordability Index, NAR-Home Sales Base = 100
90
100
110
120
130
140
150
160
92 94 96 98 00 02 04 06 08
90
100
110
120
130
140
150
160
Housing Affordability Index: Dec @ 158.86-Month Moving Average: Dec @ 136.5
Net Percent of Banks Tightening StandardsMortgages for Individuals
-20%
0%
20%
40%
60%
80%
100%
1990 1992 1994 1996 1998 2000 2002 2004 2006 2008
-20%
0%
20%
40%
60%
80%
100%All Mortgages (Through Q1-2007)Prime Mortgages: Q1 @ 47.1%Subprime Mortgages: Q1 @ 50.0%Nontraditional Mortgages: Q1 @ 48.0%
Highlights Existing and New Single Family Home SalesSeasonally Adjusted Annual Rate - In Millions
0.2
0.4
0.6
0.8
1.0
1.2
1.4
1.6
2002 2003 2004 2005 2006 2007 2008 2009
3.0
3.5
4.0
4.5
5.0
5.5
6.0
6.5
7.0
New Home Sales: Jan @ 309 Thousand (Left Axis)Existing Home Sales: Jan @ 4.1 Million (Right Axis)
S&P Case-Shiller Home PricesPercent Decline from Local Market Peak8.6%
9.9%10.4%
14.8%15.0%15.0%
16.1%16.6%16.7%
18.6%25.8%
29.8%34.5%
36.3%37.4%
39.2%40.4%41.3%
44.0%45.5%
28.3%27.0%
0% 5% 10% 15% 20% 25% 30% 35% 40% 45% 50%
DallasCharlotte
DenverClevelandNew YorkPortlandBostonAtlantaSeattle
ChicagoMinneapolisWashington
TampaDetroit
Los AngelesSan Diego
San FranciscoMiami
Los VegasPhoenix
C-10C-20
Residential Real Estate Summary
While Construction May See a Trough in Coming Months, Prices Will Continue to Decline for Some Time
Residential Real Estate
Source: Federal Reserve, National Association of Realtors, S&P Corp, U.S. Department of Commerce and Wachovia
Residential Real Estate Summary

CCIM Institute 12
FHFA (OFHEO) Home Price Index
Home Price Declines Have Become Quite Pervasive and are Likely to Continue into 2010
Home Price Declines From Peak
Source: FHFA and Wachovia
FHFA (OFHEO): Q4-2008Percent Change from Peak Value
No Change
-2% to 0%
-4% to -2%
-10% to -4%
Less than -10%
Residential Real Estate Summary

CCIM Institute 13
North Carolina

CCIM Institute 14
North Carolina’s unemployment rate has spiked significantly higher over the past year. While labor force growth has contributed to the rise, layoffs will continue to mount going forward.
North Carolina saw near-record population gains again in 2008, with the Charlotte and Raleigh-Durham regions leading the way.
With the exception of some coastal areas, the state did not experience the same rapid price appreciation during the housing boom as was seen in other parts of the country. Home prices just barely rose in the fourth quarter after a notable decline in the third. We do not expect meaningful growth anytime in 2009.
New single-family building activity has declined considerably from cycle highs as local and national builders have scaled back to bolster their balance sheets and reduce inventories.
North Carolina Population GrowthIn Thousands
0
25
50
75
100
125
150
175
200
225
80 83 86 89 92 95 98 01 04 07
0
25
50
75
100
125
150
175
200
225
North Carolina Home PricesFHFA (OFHEO) Home Price Index
-4%
-2%
0%
2%
4%
6%
8%
10%
12%
90 92 94 96 98 00 02 04 06 08
-4%
-2%
0%
2%
4%
6%
8%
10%
12%
Quarterly Change, Annual Rate: Q4 @ 0.5%
Year-over-Year Percent Change: Q4 @ 1.1%
Highlights North Carolina MSA Unemployment RateSeasonally Adjusted
2%
3%
4%
5%
6%
7%
8%
9%
90 92 94 96 98 00 02 04 06 08
2%
3%
4%
5%
6%
7%
8%
9%
Unemployment Rate: Dec @ 8.7%
12-Month Moving Average: Dec @ 6.2%
Unemployment and Housing Cool the Economy
North Carolina
Source: Federal Housing Finance Agency, U.S. Department of Commerce, U.S. Department of Labor and Wachovia
North Carolina Housing PermitsThousands of Permits, Seasonally Adjusted Annual Rate
0
20
40
60
80
100
120
90 92 94 96 98 00 02 04 06 08
0
20
40
60
80
100
120Single-Family: Dec @ 18,852Single-Family, 12-Month Moving Avg.: Dec @ 39,538Multi-Family, 12-Month Moving Avg.: Dec @ 14,770
North Carolina

CCIM Institute 15
The labor market has shown considerable weakness in Greensboro since late 2007. Employment growth has turned negative, and the unemployment rate has risen more than two percentage points in just six months, now sitting well above the national average.
New activity has slowed significantly in the housing market, but not to the same degree that it has in the bubble markets. The Triad did not see the same run-up in activity or prices during the boom time and thus should avoid some of the fallout. However, prices in the fourth quarter declined at an alarming six percent annual rate.
Population growth remains steady in the Greensboro metro area, which added near record numbers in both 2006 and 2007. Relatively attractive labor and housing markets brought employers to the area.
Greensboro MSA Population GrowthIn Thousands
0
3
6
9
12
15
80 82 84 86 88 90 92 94 96 98 00 02 04 06
0
3
6
9
12
15
Greensboro MSA Home PricesFHFA (OFHEO) Home Price Index
-6%
-3%
0%
3%
6%
9%
12%
15%
90 92 94 96 98 00 02 04 06 08
-6%
-3%
0%
3%
6%
9%
12%
15%
Quarterly Change, Annual Rate: Q4 @ -5.8%Year-over-Year Percent Change: Q4 @ -0.8%
Highlights Greensboro MSA Unemployment RateSeasonally Adjusted
2%
3%
4%
5%
6%
7%
8%
9%
90 92 94 96 98 00 02 04 06 08
2%
3%
4%
5%
6%
7%
8%
9%Unemployment Rate: Dec @ 8.8%
12-Month Moving Average: Dec @ 6.5%
Greensboro MSA Housing PermitsSeasonally Adjusted Annual Rate
0
1
2
3
4
5
6
7
90 92 94 96 98 00 02 04 06 08
0
1
2
3
4
5
6
7Single-Family, 12-Month Mov. Avg.: Dec @ 2,049Multi-Family, 12-Month Mov. Avg.: Dec @ 1,159Single-Family: Dec @ 1,248
Greensboro
Source: Federal Housing Finance Agency, U.S. Department of Commerce, U.S. Department of Labor and Wachovia
North Carolina
Unemployment Is a Growing Concern

CCIM Institute 16
Winston-Salem has seen a spike in the unemployment rate in recent months. The labor market has clearly weakened over the past year. The recent spike in the jobless rate likely reflects a moderation in overall job growth coupled with still steady labor force growth.
Nonfarm employment declined late last year, with layoffs in manufacturing and construction offset by gains in education and health care.
Home prices are moderating and likely to decline between 5 and 10 percent peak-to-trough
New home construction has fallen to the lowest level in the modern era, reflecting tightening credit conditions
Population growth continues to support Winston-Salem. This will benefit businesses in the future.
Winston-Salem MSA Population GrowthIn Thousands
0
2
4
6
8
10
80 82 84 86 88 90 92 94 96 98 00 02 04 06
0
2
4
6
8
10
Winston-Salem MSA Home PricesFHFA (OFHEO) Home Price Index
-15%
-12%
-9%
-6%
-3%
0%
3%
6%
9%
12%
90 92 94 96 98 00 02 04 06 08
-15%
-12%
-9%
-6%
-3%
0%
3%
6%
9%
12%
Quarterly Change, Annual Rate: Q4 @ 11.1%
Year-over-Year Percent Change: Q4 @ -0.4%
Highlights Winston-Salem MSA Unemployment RateSeasonally Adjusted
1%
2%
3%
4%
5%
6%
7%
8%
90 92 94 96 98 00 02 04 06 08
1%
2%
3%
4%
5%
6%
7%
8%
Unemployment Rate: Dec @ 7.8%
12-Month Moving Average: Dec @ 5.9%
Winston-Salem MSA Housing PermitsSeasonally Adjusted Annual Rate
0
1
2
3
4
5
6
7
90 92 94 96 98 00 02 04 06 08
0
1
2
3
4
5
6
7Single-Family: Jan @ 384Single-Family, 12-Month Mov. Avg.: Jan @ 1,186Multi-Family, 12-Month Mov. Avg.: Jan @ 295
Winston-Salem
Source: Office of Federal Housing Enterprise Oversight, U.S. Department of Commerce, U.S. Department of Labor and Wachovia
North Carolina

CCIM Institute 17
Appendix

CCIM Institute 18
Monthly Economic Outlook
Weekly Economic & Financial Commentary
Special Reports
Economic Indicators
Global Economic Commentary
Federal Reserve Commentary
Real Estate & Housing
Consumer & Retail
Chief Economist List
To join any of our research distribution lists please visit our website: http://www.wachovia.com/eco
nomicsemail
Date Title Authors
February-23 This Is Not the End of America VitnerFebruary-23 Housing & Finance: Still Searching for a New Equilibrium SilviaFebruary-12 Global Chartbook - February 2009 Bryson & QuinlanFebruary-12 Housing Chartbook - February 2009 Vitner & YorkFebruary-10 Five Key Questions for Decision-Makers SilviaFebruary-04 Economic Downturn Challenges State and Local Tax Revenue Vitner & Khan
January-28 State Employment: December 2008 Vitner, York & WhelanJanuary-27 Employment: Digging Under the Headlines Silvia, York & WhelanJanuary-26 Florida's Labor Market Takes it on the Chin Vitner & YorkJanuary-16 A Holiday Season for the Record Books Vitner & YorkJanuary-15 Global Chartbook - J anuary 2009 Bryson & Quinlan
December-18 Inflation Chartbook - December 2008 Vitner, York & WhelanDecember-16 Global Chartbook - December 2008 Bryson & QuinlanDecember-16 Commercial Real Estate Quarterly: 3rd Quarter Vitner & KhanDecember-11 Housing Chartbook - December 2008 Vitner & YorkDecember-05 Partial Eclipse in the Lone Star State Vitner, York & WhelanDecember-01 NBER Recession Call: Official Now, But Still Not Over SilviaDecember-01 The Outlook for U.S. Exports Yet Again Bryson
November-25 Home Price Data: Third Quarter 2008 Vitner & YorkNovember-25 Consumer Credit Weakening Amid Economic Downturn Vitner & KhanNovember-25 Linear Models in a Non-linear World: Case Against Complacency Silvia & IqbalNovember-24 Employment Chartbook: November 2008 Silvia, York & WhelanNovember-24 Recession to Persist for Next Six Months Silvia & IqbalNovember-14 Trends, Cycles and Dangers of Historical Extrapolation Silvia & IqbalNovember-13 Global Chartbook - November 2008 Bryson & QuinlanNovember-05 The Grinch May Roil Holiday Sales This Year Vitner & York
Distribution Lists Recent Special Commentary
A Sampling of Our Recent Special, Regional & Industry Commentary
Economics Group Publications Appendix

CCIM Institute 19
U.S. Macro Economy
Comprehensive Coverage of the U.S. Economy Monthly Economic Forecast Weekly Analysis & Outlook Timely Commentary on Daily Economic Data
Releases
Global Economies
Macro Level Coverage of Major Foreign Economies Macro Forecasts of 11 Economies Monthly Forecasts of 19 Dollar Exchange Rates Weekly Analysis & Outlook
U.S. RegionalEconomics
Regional and MSA Level Expertise Extensive Coverage Across the Wachovia
Footprint Ground level Analysis & Commentary of Local
Markets
Industry
Coverage Across CIB Industry Groups Regular Commentary on Economic
Developments by Industries
Econ
om
ics G
rou
p C
overa
ge
Economics Group
Real Estate
Tech, Media
& Teleco
m
Consumer &
Healthcare
Industrial
Growth
Energy &
Power
FinancialInstituti
ons
Appendix
CCIM Institute 20
Economics Group
John E. Silvia, Ph.D.Chief Economist
[email protected]. Macro EconomyInterest Rates Monetary Policy
Mark VitnerSenior Economist
[email protected]. Macro EconomyReal EstateRegional Economics
Jay H. Bryson, Ph.D.Global Economist
[email protected] EconomiesForeign Exchange
Sam BullardEconomist
Desk OperationsFinancial Services
Anika KhanEconomist
U.S. Macro EconomyReal EstateRetail & Automotive
Azhar IqbalEconometrician
Quantitative Macro-Economic Modeling
Adam G. YorkEconomic Analyst
U.S. Macro EconomyU.S. ConsumerReal Estate
Tim QuinlanEconomic Analyst
U.S. Macro EconomyBusiness InvestmentGlobal Economies
Kim WhelanEconomic Analyst
U.S. Macro Economy
Yasmine KamaruddinEconomic Analyst
U.S. Macro Economy
Wachovia Corporation Economics Group publications are distributed by Wachovia Corporation directly and through subsidiaries including, but not limited to, Wachovia Capital Markets, LLC, Wachovia Securities, LLC and Wachovia Securities International Limited.
The information and opinions herein are for general information use only. Wachovia does not guarantee their accuracy or completeness, nor does Wachovia assume any liability for any loss that may result from the reliance by any person upon any such information or opinions. Such information and opinions are subject to change without notice, are for general information only and are not intended as an offer or solicitation with respect to the purchase or sales of any security or as personalized investment advice. © 2009 Wachovia
Appendix