Embed Size (px)
Citation preview
Kent and Medway Economic Renewal and Resilience Plan
August 2020
Economic impacts evidence base
Summary
This report sets out a high-level assessment of the impacts of the Covid-19 crisis on the Kent and
Medway economy to inform a Renewal and Resilience Plan for the next 12-18 months.
Output fell sharply from the start of lockdown. Between March and May, the economy shrank by
about 20%. All sectors experienced contraction, with hospitality and tourism the worst hit.
Since then, there has been some recovery as restrictions have eased. But over the course of
2020, the economy is still likely to shrink by 11-14%
Unemployment has risen rapidly, with the claimant count across Kent and Medway increasing by
around 36,000 between March and May. However, potential unemployment has been mitigated by
the Government’s furlough scheme, which currently accounts for 232,000 workers in Kent and
Medway. There is a significant risk of a rise in unemployment as the furlough scheme unwinds
into the autumn, and a series of Government initiatives seek to mitigate this.
The outlook – even in the near term – is uncertain, and will depend on the prevention of further
outbreaks of Covid-19, the extent to which emergency support to businesses can be withdrawn
without extensive disruption, and the way in which the crisis evolves in the UK’s trading partners.
Building on recent analysis by the Office for Budget Responsibility, this paper sets out three
scenarios for the medium term and applies these to Kent and Medway’s major economic sectors.
All of these scenarios anticipate a very sharp downturn in 2020, although the depth and length of
the downturn varies. At this stage, all three scenarios are plausible, and can help to guide thinking
in planning the actions we should take to support economic recovery and renewal. But the
situation will evolve over the second half of 2020, and the analysis in this report should be kept
under review.
1
Contents
Introduction
Output, jobs and businesses: Overall
impacts➢ Before the crisis: ‘Business as usual’
➢ Into the crisis: Lockdown and gradual
relaxation
➢ Thinking through the economic impacts
➢ Output
➢ Jobs
➢ Businesses
Scenarios for 2020 and beyond
2
Sectoral prospects➢ Agriculture and horticulture
➢ Energy, utilities and environmental
technologies
➢ Manufacturing
➢ Development and construction
➢ Transport and logistics
➢ Retail and wholesale
➢ Visitor economy
➢ Digital tech
➢ Financial, professional and business
services
➢ Cultural and creative industries
➢ Health and social care
➢ Life sciences
➢ Education
Annexes
For the latest economic data, including the Covid-
19 Economic Dashboard, please visit the Kent
County Council Strategic Commissioning Analytics
page at www.kent.gov.uk/research
Introduction
In July 2020, many of the public health restrictions imposed to contain the Covid-19 pandemic have been
lifted, and the Government has taken far-reaching action to mitigate the impacts of the economic crisis.
However, output has fallen sharply, unemployment has risen, and it is likely that the economic downturn
will be severe in the medium term.
In this context, Kent and Medway Economic Partnership is developing an Economic Renewal and
Resilience Plan, setting out the actions that must be taken over the next 12-18 months to support jobs,
businesses and a sustainable path to economic growth.
To inform the Economic Renewal and Resilience Plan, this report sets out an assessment of the
economic impacts of the crisis on Kent and Medway so far. It outlines:
➢ the state of the Kent and Medway economy and its strengths and weaknesses as it entered the
crisis
➢ the impacts (and potential impacts) on output, businesses and the labour market
➢ some high-level scenarios for economic recovery
➢ a review of impacts by sector – taking account of opportunities for future growth, as well as
mitigation
It is important to note that the speed of the crisis means that the evidence of impact is changing rapidly.
‘Conventional’ economic data is also of limited use, given the time lag within many datasets. This report
builds on an earlier review of emerging impacts published in May and draws on a range of sources, both
official and unofficial, to provide a ‘best estimate’ of the economic impacts on Kent and Medway.
However, it the picture is changing rapidly and the evidence base will need to be updated as further, and
more accurate, information becomes available.
3
Kent and Medway Economic Renewal and Resilience Plan
Economic impacts evidence base
Output, jobs and businesses: Overall impacts
Before the crisis: ‘Business as usual’
What was the outlook before the crisis hit?
In terms of output, Kent and Medway’s GVA was
growing steadily, albeit slowly, in line with the UK
picture, following a relatively slow recovery from
recession at the start of the last decade.
Average national forecasts in February anticipated
modest GDP growth of 1.2% in 2020, rising to
1.4% in 20211.
Unemployment was low by historical standards,
at around 3.8% of the workforce (slightly below the
national average)2. Claimant count levels rose
somewhat in the first months of 2020 (although
partly linked with the rollout of Universal Credit).
Business stock had grown steadily over the past
decade – by around 27% between 2010 and
20193. Recent survival rates in Kent and Medway
have also been slightly better than the national
average.
Historically, the county’s economy has been
resilient (given sectoral diversity and proximity to
London and the Greater South East), with a strong
SME base – although there is substantial variation
in local assets, opportunities and weaknesses.
5
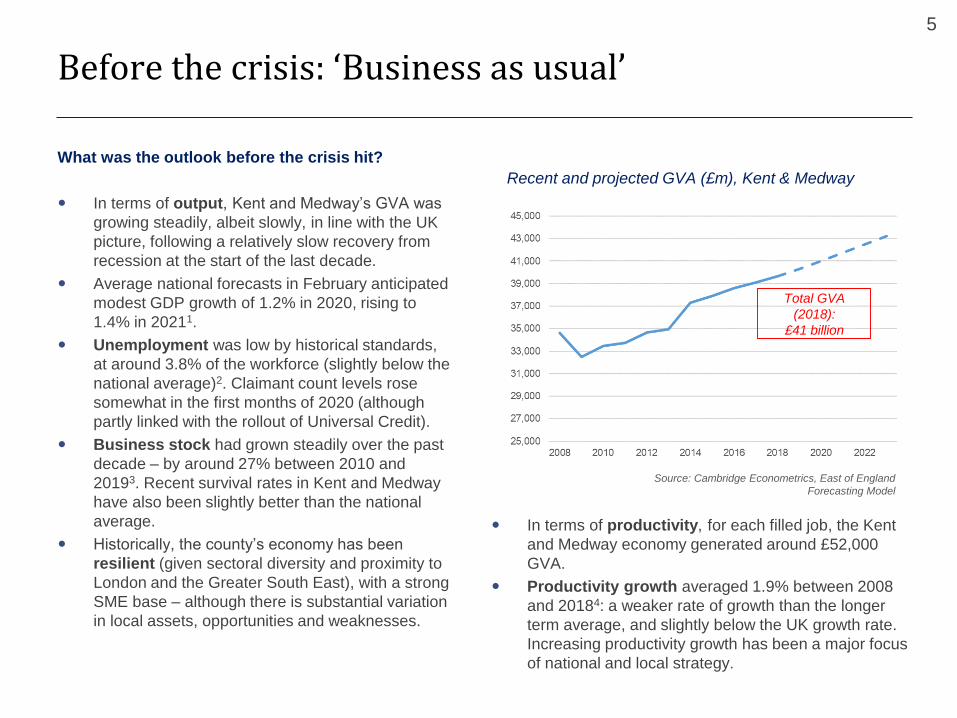
Recent and projected GVA (£m), Kent & Medway
In terms of productivity, for each filled job, the Kent
and Medway economy generated around £52,000
GVA.
Productivity growth averaged 1.9% between 2008
and 20184: a weaker rate of growth than the longer
term average, and slightly below the UK growth rate.
Increasing productivity growth has been a major focus
of national and local strategy.
Total GVA
(2018):
£41 billion
Source: Cambridge Econometrics, East of England
Forecasting Model
Into the crisis: Lockdown and gradual relaxation
Economic activity was already falling in March, in the
light of the crisis in China and Italy and the likelihood of
restrictions in the UK. The ONS business survey in
mid-March showed that almost half of firms had
experienced reduced turnover, and about a quarter
had reduced staffing levels.
The Government announced legal restrictions on travel
and economic activity on 23 March, in the context of
the growing public health crisis. This resulted in the
temporary closure of a large part of the economy,
including most non-food retail activity, and virtually all
tourism, hospitality and leisure services.
6
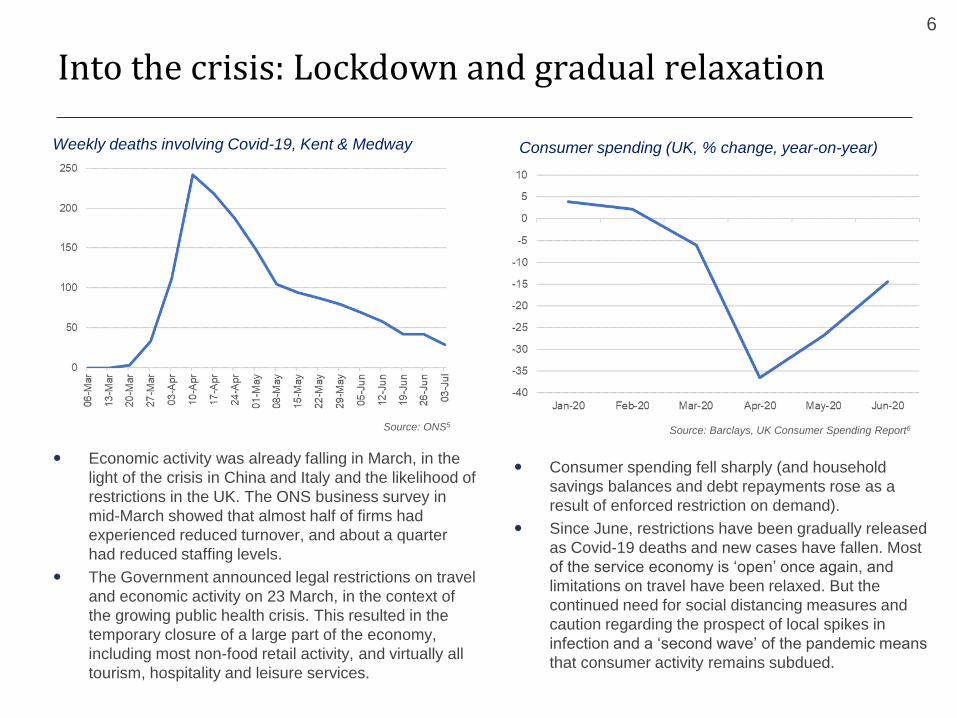
Weekly deaths involving Covid-19, Kent & Medway Consumer spending (UK, % change, year-on-year)
Consumer spending fell sharply (and household
savings balances and debt repayments rose as a
result of enforced restriction on demand).
Since June, restrictions have been gradually released
as Covid-19 deaths and new cases have fallen. Most
of the service economy is ‘open’ once again, and
limitations on travel have been relaxed. But the
continued need for social distancing measures and
caution regarding the prospect of local spikes in
infection and a ‘second wave’ of the pandemic means
that consumer activity remains subdued.
Source: ONS5Source: Barclays, UK Consumer Spending Report6
Thinking through the economic impacts
7
The immediate ‘emergency’ presented a major shock to demand and supply:
➢ On the demand side, people were forced to curtail normal activities and much everyday trade temporarily
ceased. Demand may continue to be weak, due to ongoing restrictions, public health concerns and
uncertainty regarding future prospects
➢ On the supply side, the pandemic caused some bottlenecks in production and access to labour – some of
which could be persistent
In the UK, we are moving out of the immediate emergency phase. But the crisis isn’t over yet:
➢ Ongoing measures to prevent the spread of the virus are still in place and are likely to remain for some time
– and restrictions may need to be reimposed
➢ Short-term shocks can have longer term impacts, as businesses and jobs are permanently lost and markets
are restructured.
The crisis is global:
➢ All of the UK’s main trading partners are impacted and face significant falls in output this year. Although
responses to the crisis are largely driven by national governments, it could lead to significant disruption
The crisis has (so far) impacted different sectors in different ways:
➢ Some industries were largely shut down, and some remain in that state (parts of the creative and cultural
sector for instance). As restrictions are released, we might expect activity in these industries to return
➢ However, some changes will be permanent and structural.
But…
➢ Government has taken active measures to support economic activity
➢ While the crisis has had a universal impact, there is no loss of physical capital stock and not much loss of
human capital: the building blocks are there for ‘recovery’, although the post-Covid economy will present
different opportunities and challenges
The diagram on the next page sets out a framework for thinking through the impacts
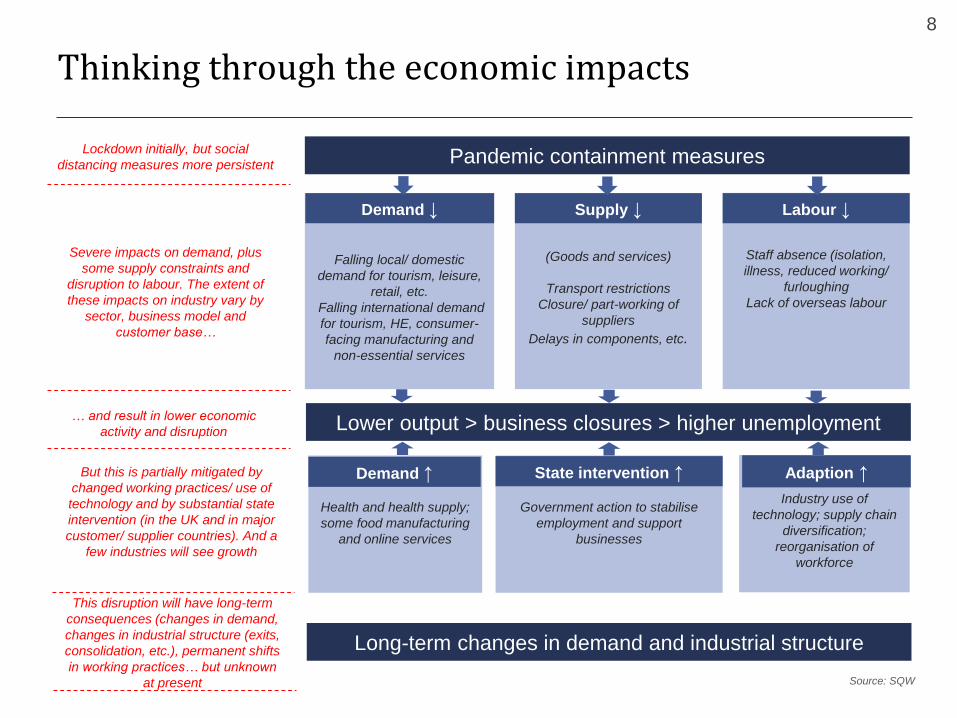
Thinking through the economic impacts
8
Pandemic containment measures
Falling local/ domestic
demand for tourism, leisure,
retail, etc.
Falling international demand
for tourism, HE, consumer-
facing manufacturing and
non-essential services
(Goods and services)
Transport restrictions
Closure/ part-working of
suppliers
Delays in components, etc.
Staff absence (isolation,
illness, reduced working/
furloughing
Lack of overseas labour
Lower output > business closures > higher unemployment
Health and health supply;
some food manufacturing
and online services
Government action to stabilise
employment and support
businesses
Industry use of
technology; supply chain
diversification;
reorganisation of
workforce
Long-term changes in demand and industrial structure
Demand ↓ Supply ↓ Labour ↓
Demand ↑ Adaption ↑State intervention ↑
Lockdown initially, but social
distancing measures more persistent
Severe impacts on demand, plus
some supply constraints and
disruption to labour. The extent of
these impacts on industry vary by
sector, business model and
customer base…
This disruption will have long-term
consequences (changes in demand,
changes in industrial structure (exits,
consolidation, etc.), permanent shifts
in working practices… but unknown
at present
But this is partially mitigated by
changed working practices/ use of
technology and by substantial state
intervention (in the UK and in major
customer/ supplier countries). And a
few industries will see growth
… and result in lower economic
activity and disruption
Source: SQW
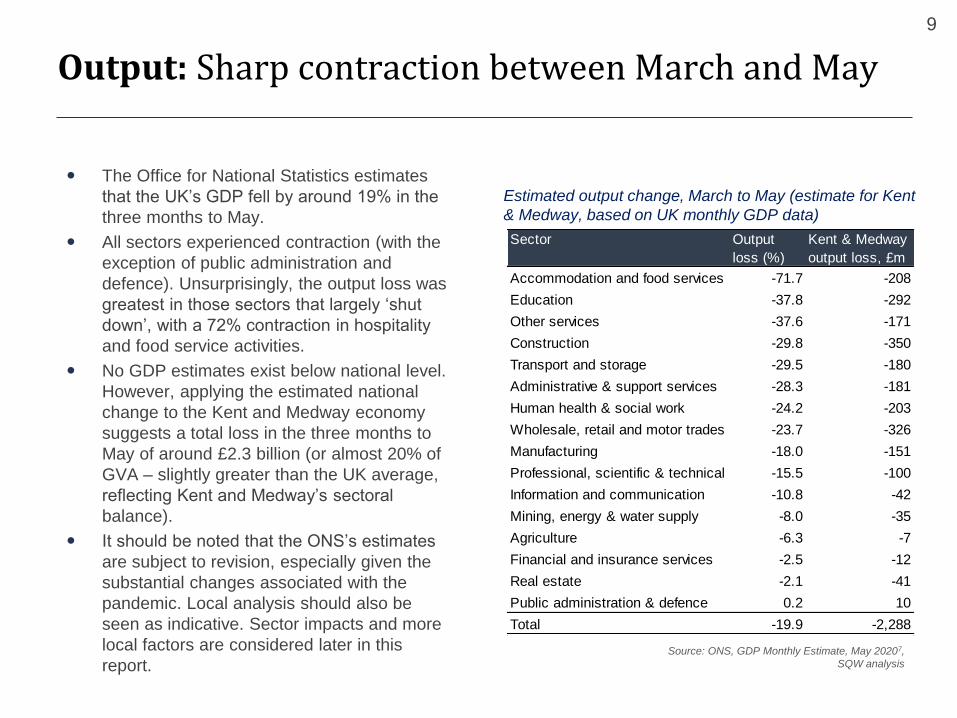
Output: Sharp contraction between March and May
9
The Office for National Statistics estimates
that the UK’s GDP fell by around 19% in the
three months to May.
All sectors experienced contraction (with the
exception of public administration and
defence). Unsurprisingly, the output loss was
greatest in those sectors that largely ‘shut
down’, with a 72% contraction in hospitality
and food service activities.
No GDP estimates exist below national level.
However, applying the estimated national
change to the Kent and Medway economy
suggests a total loss in the three months to
May of around £2.3 billion (or almost 20% of
GVA – slightly greater than the UK average,
reflecting Kent and Medway’s sectoral
balance).
It should be noted that the ONS’s estimates
are subject to revision, especially given the
substantial changes associated with the
pandemic. Local analysis should also be
seen as indicative. Sector impacts and more
local factors are considered later in this
report.
Sector Output
loss (%)
Kent & Medway
output loss, £m
Accommodation and food services -71.7 -208
Education -37.8 -292
Other services -37.6 -171
Construction -29.8 -350
Transport and storage -29.5 -180
Administrative & support services -28.3 -181
Human health & social work -24.2 -203
Wholesale, retail and motor trades -23.7 -326
Manufacturing -18.0 -151
Professional, scientific & technical -15.5 -100
Information and communication -10.8 -42
Mining, energy & water supply -8.0 -35
Agriculture -6.3 -7
Financial and insurance services -2.5 -12
Real estate -2.1 -41
Public administration & defence 0.2 10
Total -19.9 -2,288
Estimated output change, March to May (estimate for Kent
& Medway, based on UK monthly GDP data)
Source: ONS, GDP Monthly Estimate, May 20207,
SQW analysis
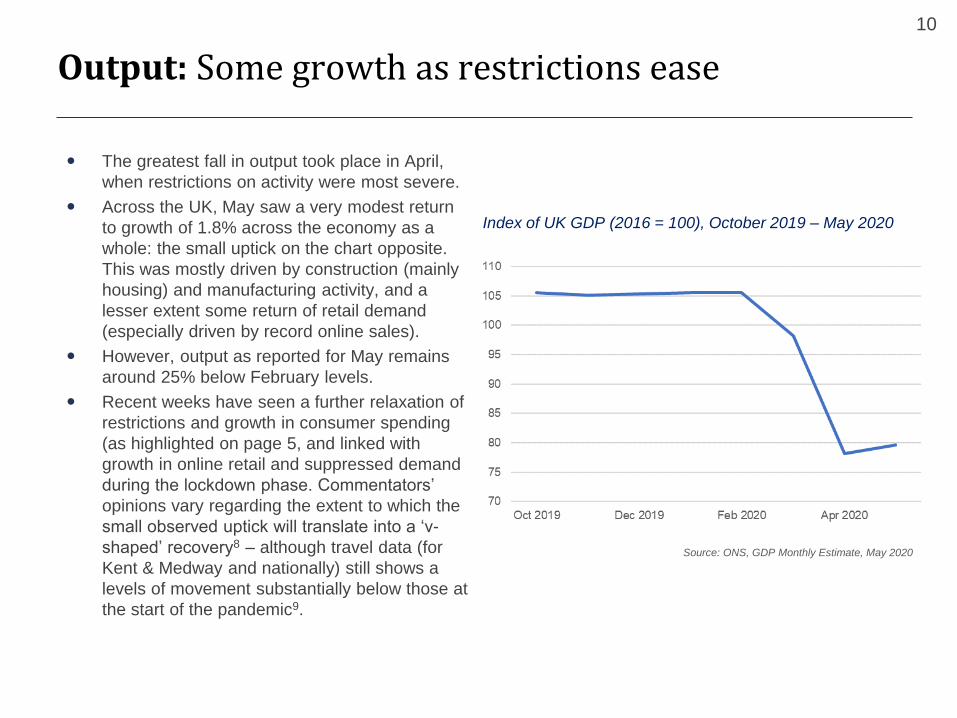
Output: Some growth as restrictions ease
10
The greatest fall in output took place in April,
when restrictions on activity were most severe.
Across the UK, May saw a very modest return
to growth of 1.8% across the economy as a
whole: the small uptick on the chart opposite.
This was mostly driven by construction (mainly
housing) and manufacturing activity, and a
lesser extent some return of retail demand
(especially driven by record online sales).
However, output as reported for May remains
around 25% below February levels.
Recent weeks have seen a further relaxation of
restrictions and growth in consumer spending
(as highlighted on page 5, and linked with
growth in online retail and suppressed demand
during the lockdown phase. Commentators’
opinions vary regarding the extent to which the
small observed uptick will translate into a ‘v-
shaped’ recovery8 – although travel data (for
Kent & Medway and nationally) still shows a
levels of movement substantially below those at
the start of the pandemic9.
Index of UK GDP (2016 = 100), October 2019 – May 2020
Source: ONS, GDP Monthly Estimate, May 2020
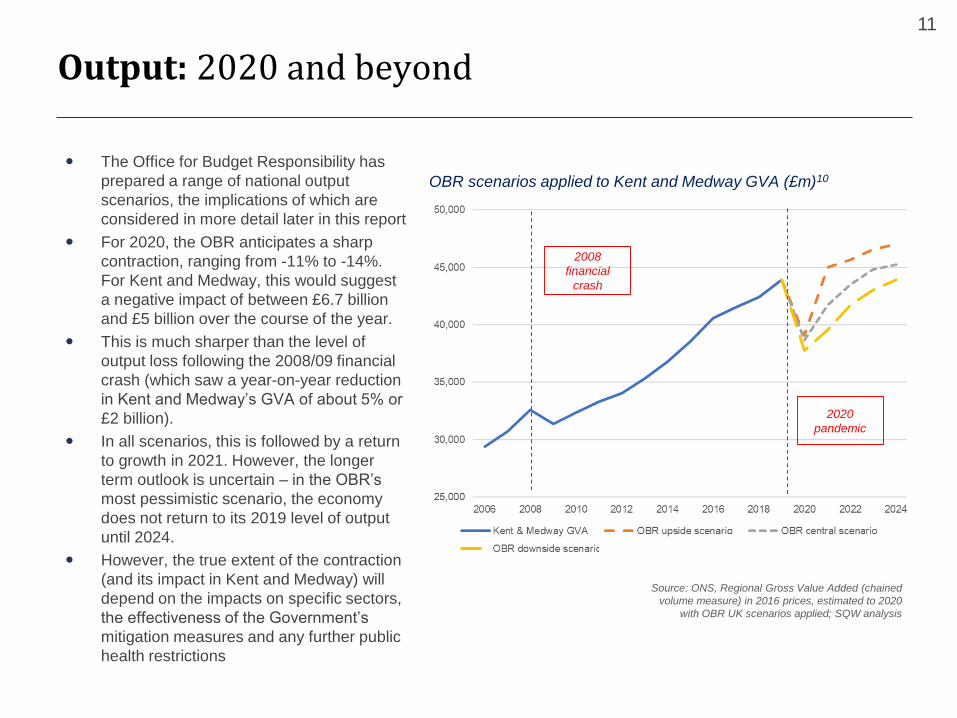
Output: 2020 and beyond
11
The Office for Budget Responsibility has
prepared a range of national output
scenarios, the implications of which are
considered in more detail later in this report
For 2020, the OBR anticipates a sharp
contraction, ranging from -11% to -14%.
For Kent and Medway, this would suggest
a negative impact of between £6.7 billion
and £5 billion over the course of the year.
This is much sharper than the level of
output loss following the 2008/09 financial
crash (which saw a year-on-year reduction
in Kent and Medway’s GVA of about 5% or
£2 billion).
In all scenarios, this is followed by a return
to growth in 2021. However, the longer
term outlook is uncertain – in the OBR’s
most pessimistic scenario, the economy
does not return to its 2019 level of output
until 2024.
However, the true extent of the contraction
(and its impact in Kent and Medway) will
depend on the impacts on specific sectors,
the effectiveness of the Government’s
mitigation measures and any further public
health restrictions
OBR scenarios applied to Kent and Medway GVA (£m)10
Source: ONS, Regional Gross Value Added (chained
volume measure) in 2016 prices, estimated to 2020
with OBR UK scenarios applied; SQW analysis
2008
financial
crash
2020
pandemic
Output: Sectoral impacts
12
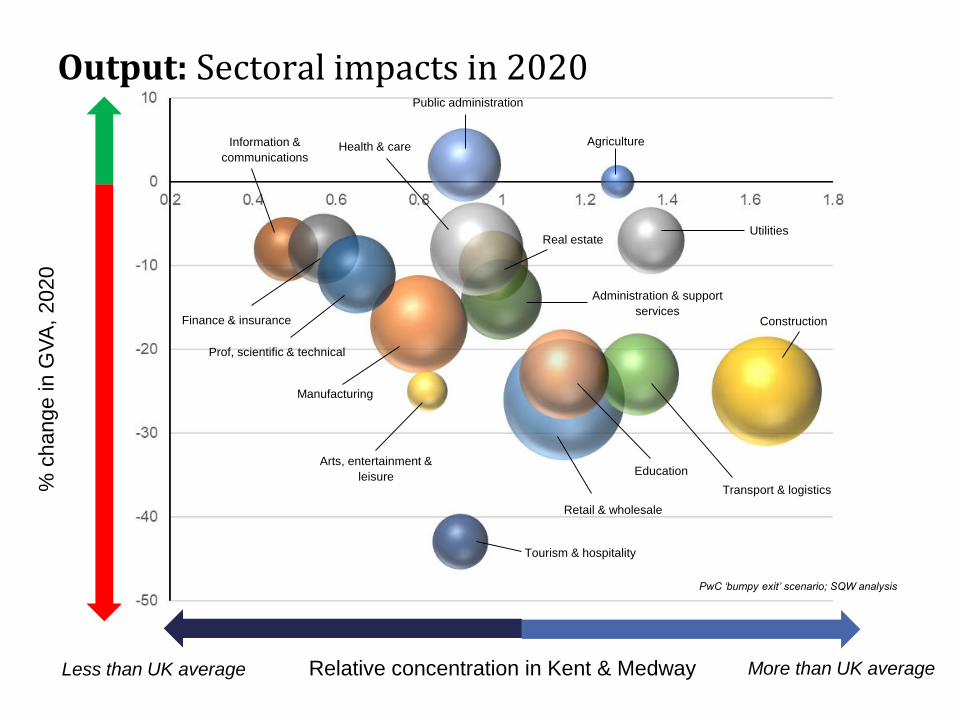
As the data for the early impacts in March – May
indicate, the crisis has divergent sectoral impacts.
The chart on the next page illustrates the impact by
sector across Kent and Medway, highlighting:
➢ The size of each sector in terms of its
contribution to Kent and Medway’s GVA (the
size of each bubble on the chart)
➢ The relative concentration of each sector (in
summary, sectors further to the right on the
chart are larger in Kent and Medway (as a
contribution to GVA) relative to the UK
average; those to the left are relatively
smaller
➢ The estimated change in each sector’s overall
GVA in 2020. This is based on a scenario
developed by PwC, which anticipates a
contraction of around 15% this year (slightly
worse than the OBR’s downside scenario)11.
Overall, those sectors that were impacted the most
in the immediate shutdown phase will still be worst
hit at the end of the year – as growth fails to make
up for the sharp contraction at the start and
continuing restrictions still have an impact
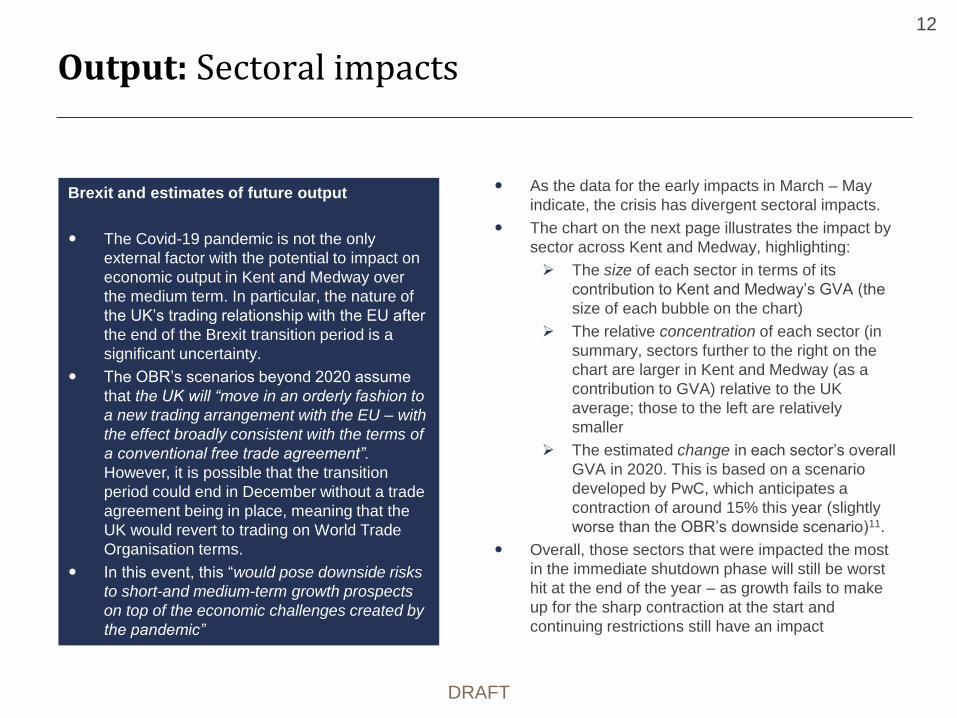
Brexit and estimates of future output
The Covid-19 pandemic is not the only
external factor with the potential to impact on
economic output in Kent and Medway over
the medium term. In particular, the nature of
the UK’s trading relationship with the EU after
the end of the Brexit transition period is a
significant uncertainty.
The OBR’s scenarios beyond 2020 assume
that the UK will “move in an orderly fashion to
a new trading arrangement with the EU – with
the effect broadly consistent with the terms of
a conventional free trade agreement”.
However, it is possible that the transition
period could end in December without a trade
agreement being in place, meaning that the
UK would revert to trading on World Trade
Organisation terms.
In this event, this “would pose downside risks
to short-and medium-term growth prospects
on top of the economic challenges created by
the pandemic”
DRAFT
% c
hange in G
VA
, 2020
Relative concentration in Kent & MedwayLess than UK average More than UK average
Construction
Hospitality
Retail & wholesale
Manufacturing
Transport & logistics
Arts, leisure and culture
PwC ‘bumpy exit’ scenario; SQW analysis
Public administration
Agriculture
Utilities
Construction
Transport & logistics
Education
Retail & wholesale
Tourism & hospitality
Arts, entertainment &
leisure
Manufacturing
Prof, scientific & technical
Finance & insurance
Information &
communicationsHealth & care
Real estate
Administration & support
services
Output: Sectoral impacts in 2020
Jobs: The rising unemployment challenge
14
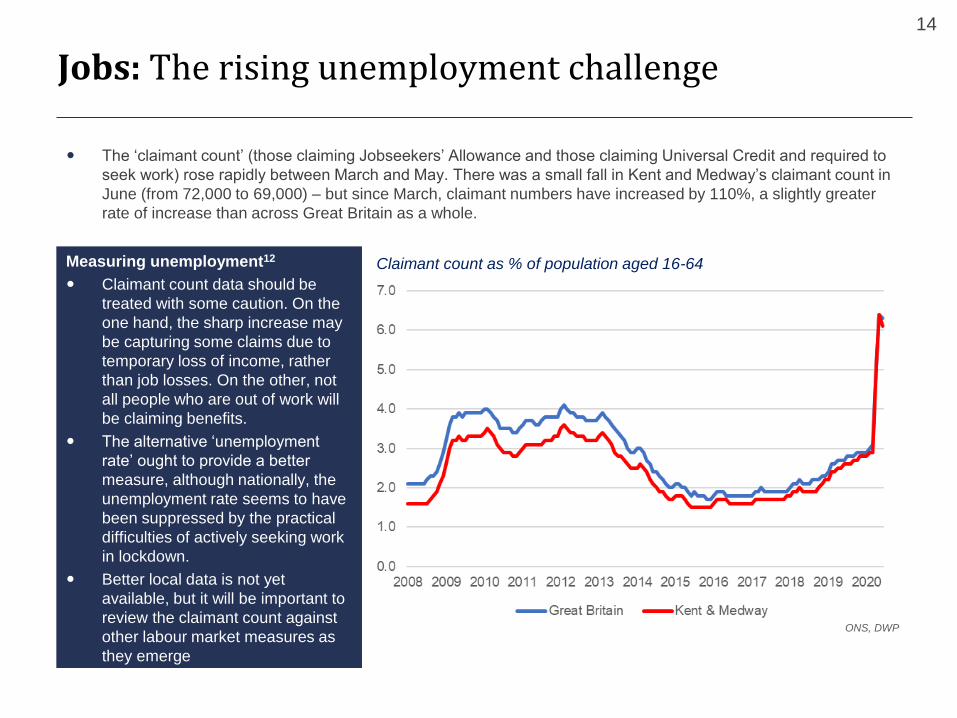
The ‘claimant count’ (those claiming Jobseekers’ Allowance and those claiming Universal Credit and required to
seek work) rose rapidly between March and May. There was a small fall in Kent and Medway’s claimant count in
June (from 72,000 to 69,000) – but since March, claimant numbers have increased by 110%, a slightly greater
rate of increase than across Great Britain as a whole.
Claimant count as % of population aged 16-64
ONS, DWP
Measuring unemployment12
Claimant count data should be
treated with some caution. On the
one hand, the sharp increase may
be capturing some claims due to
temporary loss of income, rather
than job losses. On the other, not
all people who are out of work will
be claiming benefits.
The alternative ‘unemployment
rate’ ought to provide a better
measure, although nationally, the
unemployment rate seems to have
been suppressed by the practical
difficulties of actively seeking work
in lockdown.
Better local data is not yet
available, but it will be important to
review the claimant count against
other labour market measures as
they emerge
Jobs: Local unemployment
15
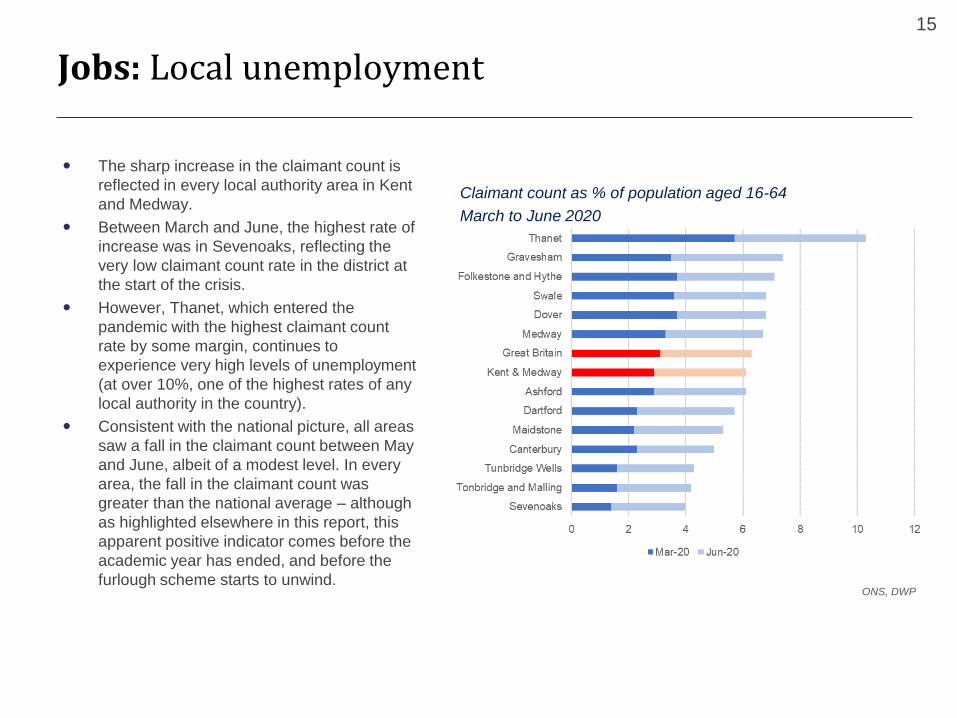
The sharp increase in the claimant count is
reflected in every local authority area in Kent
and Medway.
Between March and June, the highest rate of
increase was in Sevenoaks, reflecting the
very low claimant count rate in the district at
the start of the crisis.
However, Thanet, which entered the
pandemic with the highest claimant count
rate by some margin, continues to
experience very high levels of unemployment
(at over 10%, one of the highest rates of any
local authority in the country).
Consistent with the national picture, all areas
saw a fall in the claimant count between May
and June, albeit of a modest level. In every
area, the fall in the claimant count was
greater than the national average – although
as highlighted elsewhere in this report, this
apparent positive indicator comes before the
academic year has ended, and before the
furlough scheme starts to unwind.
Claimant count as % of population aged 16-64
March to June 2020
ONS, DWP
Jobs: Retention of existing employment
16
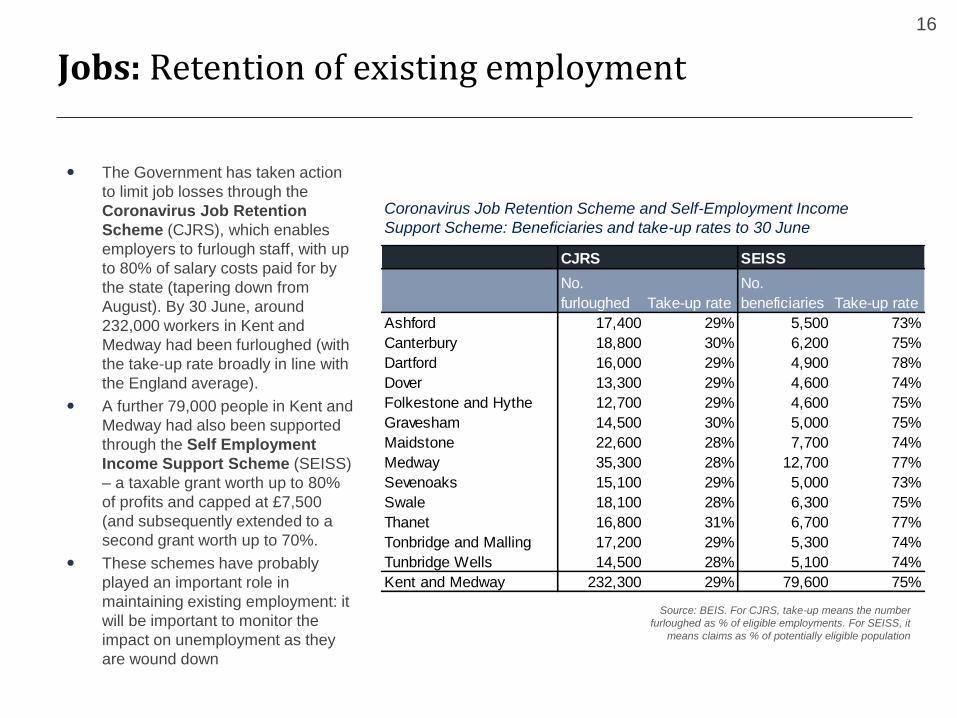
The Government has taken action
to limit job losses through the
Coronavirus Job Retention
Scheme (CJRS), which enables
employers to furlough staff, with up
to 80% of salary costs paid for by
the state (tapering down from
August). By 30 June, around
232,000 workers in Kent and
Medway had been furloughed (with
the take-up rate broadly in line with
the England average).
A further 79,000 people in Kent and
Medway had also been supported
through the Self Employment
Income Support Scheme (SEISS)
– a taxable grant worth up to 80%
of profits and capped at £7,500
(and subsequently extended to a
second grant worth up to 70%.
These schemes have probably
played an important role in
maintaining existing employment: it
will be important to monitor the
impact on unemployment as they
are wound down
CJRS SEISS
No.
furloughed Take-up rate
No.
beneficiaries Take-up rate
Ashford 17,400 29% 5,500 73%
Canterbury 18,800 30% 6,200 75%
Dartford 16,000 29% 4,900 78%
Dover 13,300 29% 4,600 74%
Folkestone and Hythe 12,700 29% 4,600 75%
Gravesham 14,500 30% 5,000 75%
Maidstone 22,600 28% 7,700 74%
Medway 35,300 28% 12,700 77%
Sevenoaks 15,100 29% 5,000 73%
Swale 18,100 28% 6,300 75%
Thanet 16,800 31% 6,700 77%
Tonbridge and Malling 17,200 29% 5,300 74%
Tunbridge Wells 14,500 28% 5,100 74%
Kent and Medway 232,300 29% 79,600 75%
Coronavirus Job Retention Scheme and Self-Employment Income
Support Scheme: Beneficiaries and take-up rates to 30 June
Source: BEIS. For CJRS, take-up means the number
furloughed as % of eligible employments. For SEISS, it
means claims as % of potentially eligible population
Jobs: Job losses and vulnerabilities
17
Despite the mitigation measures put in place by the
Government, several firms have announced
redundancies. These include a number of national
retailers and leisure operators that have been
structurally impacted by the crisis; in Kent, major
employers announcing job losses include P&O and
Saga, both of which have significant exposure to
the travel and tourism industry.
Currently, furloughed jobs are especially
concentrated in retail, hospitality, manufacturing
and construction (and the SEISS scheme has very
strong take-up in construction and related trades).
This highlights areas of vulnerability as these
schemes come to an end.
Further analysis of employment in ‘shutdown’
sectors (hospitality, retail, personal service and
leisure) highlights specific distributional
vulnerabilities, with employment in these sectors
disproportionately female, composed of younger
workers and dominated by lower earners: those in
the lowest decile of earnings are seven times more
likely to work in ‘shutdown’ sectors than those in the
highest13. So overall, impacts are likely to be
greatest on groups with relatively low incomes in
the first place.
Unemployment and younger workers
Evidence from previous recessions
suggests that younger workers and new
entrants to the labour market are especially
at risk of unemployment. Younger workers
are also especially vulnerable to longer
term ‘scarring’, with periods out of work at
the start of their career affecting job and
wage prospects in future years14.
This has informed the Government’s
measures to support employment among
younger people, including the Kickstart job
guarantee scheme and additional funding
to support Traineeships and
Apprenticeships.
In June 2020, there were around 14,600
people aged 18-24 claiming out-of-work
benefits in Kent and Medway. This
represents an increase of 111% since
March – roughly in line with the growth of
the claimant count overall, although there is
a risk that this could increase further as the
academic year comes to an end.
Jobs: Vacancies
18
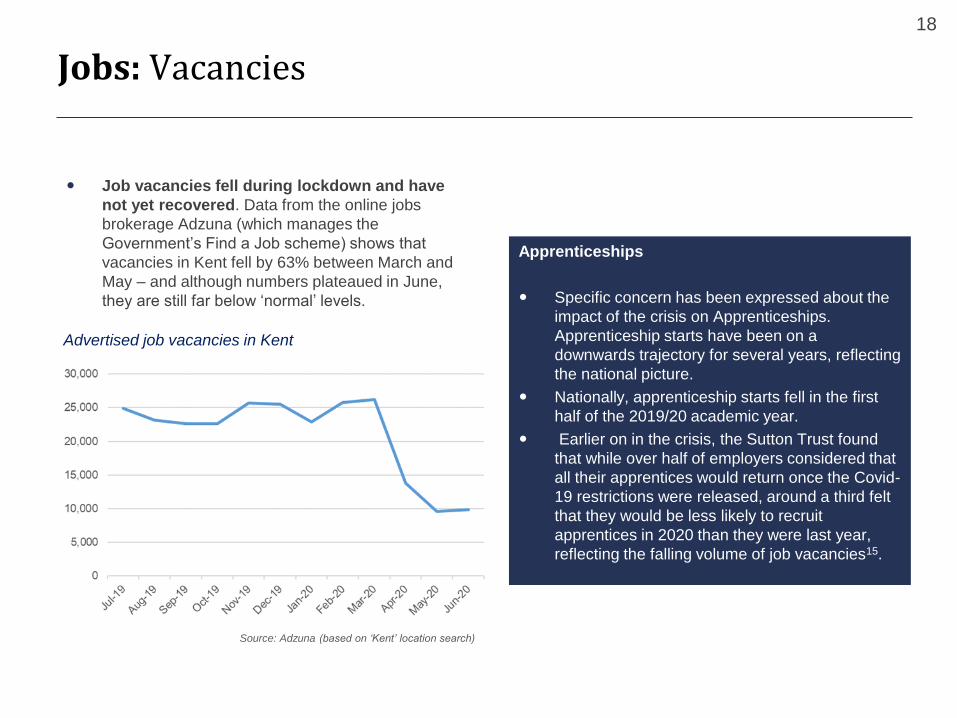
Job vacancies fell during lockdown and have
not yet recovered. Data from the online jobs
brokerage Adzuna (which manages the
Government’s Find a Job scheme) shows that
vacancies in Kent fell by 63% between March and
May – and although numbers plateaued in June,
they are still far below ‘normal’ levels.
Advertised job vacancies in Kent
Source: Adzuna (based on ‘Kent’ location search)
Apprenticeships
Specific concern has been expressed about the
impact of the crisis on Apprenticeships.
Apprenticeship starts have been on a
downwards trajectory for several years, reflecting
the national picture.
Nationally, apprenticeship starts fell in the first
half of the 2019/20 academic year.
Earlier on in the crisis, the Sutton Trust found
that while over half of employers considered that
all their apprentices would return once the Covid-
19 restrictions were released, around a third felt
that they would be less likely to recruit
apprentices in 2020 than they were last year,
reflecting the falling volume of job vacancies15.
Jobs: The future employment outlook
19
Historically, the unemployment rate in Kent and
Medway tracks the national average (usually slightly
below), although there is substantial diversity at
local level. Given the universal nature of the crisis,
and Kent and Medway’s sectoral composition, it is
reasonable to assume that this should continue to
apply in the medium term.
The key issue in the future labour market outlook is
what happens as the CJRS and the SEISS
schemes unwind. The OBR assumes that between
10% and 20% of those currently furloughed will
move into unemployment when the subsidy ends –
so unemployment will continue to rise later in 2020,
even as output returns to growth.
Within the OBR’s three scenarios:
➢ In the ‘upside’ scenario, unemployment
peaks at 9.7% and quickly falls, returning to
pre-crisis levels in 2022
➢ In the ‘central’ scenario, unemployment
peaks at about 12% at the end of 2020 and is
still above pre-crisis levels in 2025
➢ In the ‘downside’ scenario, unemployment
rises until early 2021, peaking at 13.2%
The point is that on all scenarios, unemployment
rises substantially, despite the apparent
plateauing in the claimant count that occurred in
June.
This is consistent with the aftermath of previous
recessions, in which employment lagged behind
output growth (as firms remain cautious about new
hiring commitments and workers dislocated from
previous activities are hard to absorb into new
industries). But the scale of the furlough scheme is
unprecedented, and in some industries, demand for
labour is likely to remain very limited.
The Government has announced a raft of measures
to support the labour market as CJRS and other
mitigation schemes unwind. Making these work and
ensuring that the employment outcome is close to
the upside scenario is likely to be an important pillar
of the recovery strategy.
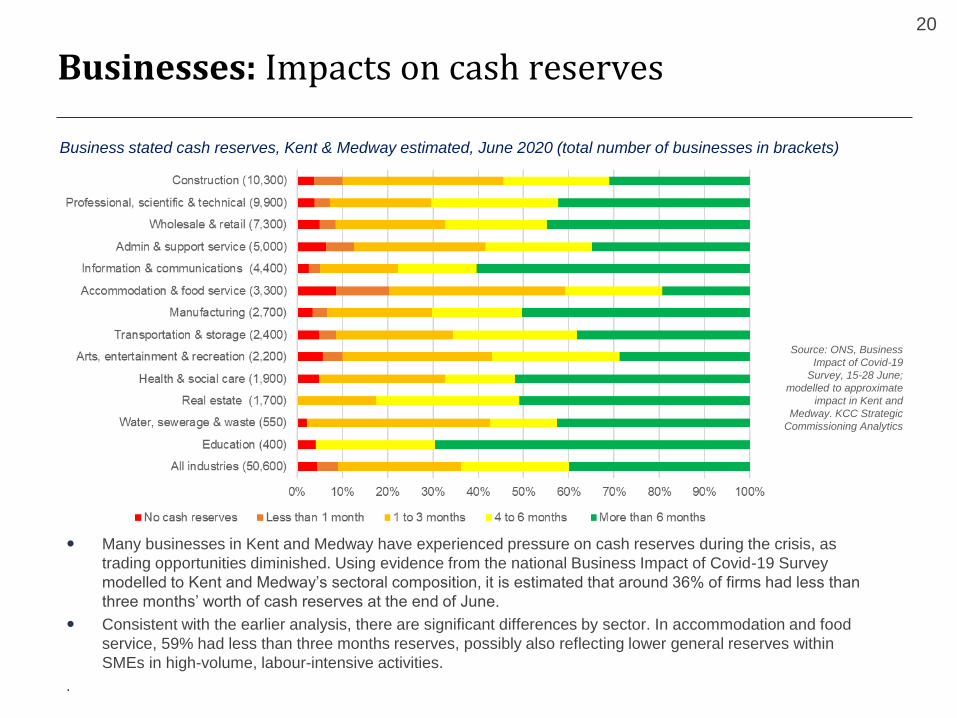
Businesses: Impacts on cash reserves
20
Many businesses in Kent and Medway have experienced pressure on cash reserves during the crisis, as
trading opportunities diminished. Using evidence from the national Business Impact of Covid-19 Survey
modelled to Kent and Medway’s sectoral composition, it is estimated that around 36% of firms had less than
three months’ worth of cash reserves at the end of June.
Consistent with the earlier analysis, there are significant differences by sector. In accommodation and food
service, 59% had less than three months reserves, possibly also reflecting lower general reserves within
SMEs in high-volume, labour-intensive activities.
.
Business stated cash reserves, Kent & Medway estimated, June 2020 (total number of businesses in brackets)
Source: ONS, Business
Impact of Covid-19
Survey, 15-28 June;
modelled to approximate
impact in Kent and
Medway. KCC Strategic
Commissioning Analytics
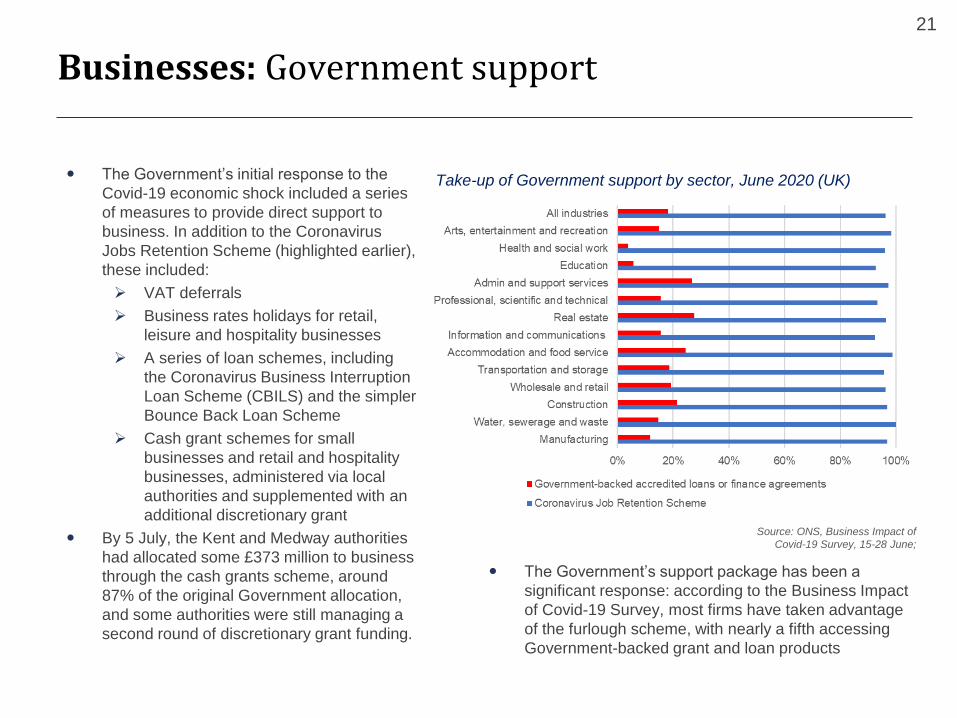
Businesses: Government support
21
The Government’s initial response to the
Covid-19 economic shock included a series
of measures to provide direct support to
business. In addition to the Coronavirus
Jobs Retention Scheme (highlighted earlier),
these included:
➢ VAT deferrals
➢ Business rates holidays for retail,
leisure and hospitality businesses
➢ A series of loan schemes, including
the Coronavirus Business Interruption
Loan Scheme (CBILS) and the simpler
Bounce Back Loan Scheme
➢ Cash grant schemes for small
businesses and retail and hospitality
businesses, administered via local
authorities and supplemented with an
additional discretionary grant
By 5 July, the Kent and Medway authorities
had allocated some £373 million to business
through the cash grants scheme, around
87% of the original Government allocation,
and some authorities were still managing a
second round of discretionary grant funding.
The Government’s support package has been a
significant response: according to the Business Impact
of Covid-19 Survey, most firms have taken advantage
of the furlough scheme, with nearly a fifth accessing
Government-backed grant and loan products
Take-up of Government support by sector, June 2020 (UK)
Source: ONS, Business Impact of
Covid-19 Survey, 15-28 June;
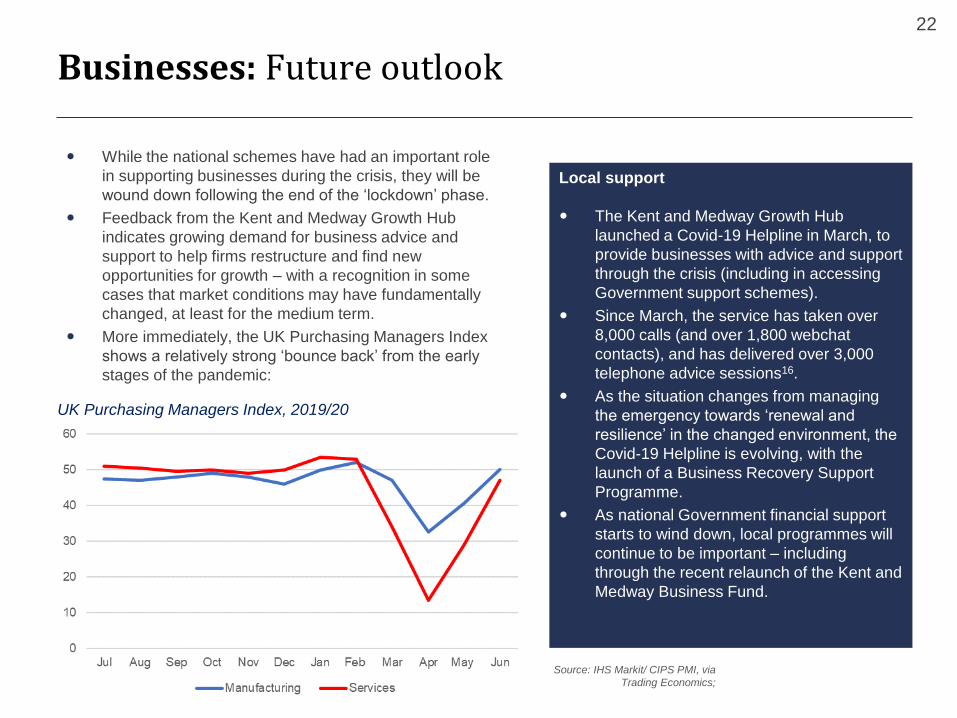
Businesses: Future outlook
22
While the national schemes have had an important role
in supporting businesses during the crisis, they will be
wound down following the end of the ‘lockdown’ phase.
Feedback from the Kent and Medway Growth Hub
indicates growing demand for business advice and
support to help firms restructure and find new
opportunities for growth – with a recognition in some
cases that market conditions may have fundamentally
changed, at least for the medium term.
More immediately, the UK Purchasing Managers Index
shows a relatively strong ‘bounce back’ from the early
stages of the pandemic:
Local support
The Kent and Medway Growth Hub
launched a Covid-19 Helpline in March, to
provide businesses with advice and support
through the crisis (including in accessing
Government support schemes).
Since March, the service has taken over
8,000 calls (and over 1,800 webchat
contacts), and has delivered over 3,000
telephone advice sessions16.
As the situation changes from managing
the emergency towards ‘renewal and
resilience’ in the changed environment, the
Covid-19 Helpline is evolving, with the
launch of a Business Recovery Support
Programme.
As national Government financial support
starts to wind down, local programmes will
continue to be important – including
through the recent relaunch of the Kent and
Medway Business Fund.
UK Purchasing Managers Index, 2019/20
Source: IHS Markit/ CIPS PMI, via
Trading Economics;
Businesses: Productivity and growth
23
The Covid-19 pandemic has involved a short-term
collapse in hours worked (so far, mostly through
furloughing, rather than through unemployment).
The consequence of this is that there is likely to be
a sharp rise in productivity (measured as output per
hour worked) in 2020: the OBR’s central scenario
anticipates a 5% increase in output per hour worked
this year, although this will fall back as the economy
stabilises in future years.
Potentially, some of this productivity growth could
be permanent, if (for example) the crisis leads to
better use of technology or a shift to more
productive activities and ways of working.
But in any case, in the longer term, we will need
productivity growth to drive economic expansion:
this was a policy concern before the crisis, and will
continue to be afterwards – especially given the
need for growth to offset substantially increased
public debt.
This suggests support for technology adoption and
adaption; innovation and the commercialisation of
innovation; and SMEs with the potential for growth
and the capacity to bring new competition to
markets. This might be especially important if there
is a countervailing pressure towards consolidation
in some markets.
Reporting the impacts on high-growth
businesses17
• The business data firm Beauhurst has tracked
around 28,500 ‘high growth’ businesses
nationally to measure the potential impact of
Covid-19:
• Across the dataset, Beauhurst report that
around 68% are able to broadly able to maintain
operations with a low to moderate level of
disruption, with around 15% potentially
benefiting from the crisis (mostly tech
businesses operating in sectors where there is
likely to be greater demand for digitally-based
services).
• But scaleup businesses are seen as especially
vulnerable during the pandemic: increased staff
levels reduces agility to respond, and a high
proportion of those within the dataset operate in
areas of activity that demand high levels of
interaction and are therefore vulnerable to
shutdown.
• Later stage businesses also face significant
risks, especially in the leisure and industrial
sectors.
Kent and Medway Economic Renewal and Resilience Plan
Economic impacts evidence base
Scenarios for 2020 and beyond
Future scenarios: Overview
25
In the previous Economic Impacts Report, we set out three high-level economic scenarios, based on
analysis prepared by think tanks, banks and the major consultancies. These reflected the Reference
Scenario published by the OBR in April; a scenario which anticipated a slower rebound; and a scenario
which anticipated a lengthy depression.
Since then, we have ‘hard evidence’ of the impact to date on output and the labour market, and while
the outlook remains uncertain, substantial new analysis has been prepared by Government and
independent observers. Following the ‘mini-Budget’ in July, the OBR published further analysis of the
medium-term outlook within its Fiscal Sustainability Report: this set out three quantified scenarios,
which we have outlined in the pages that follow as a basis for considering potential impacts on Kent and
Medway.
The three scenarios should be considered indicative. They are not ‘predictions’; rather, they are
intended to set out the range of possibilities which should be borne in mind when thinking about the
further actions that the UK Government might take to support economic recovery, and the actions that
might be considered at more local level.
The three scenarios all assume a sharp downturn in 2020 – and this has already happened. However,
there is still uncertainty about the length and severity of recession. Several variables will influence this,
most fundamentally the future direction of public health restrictions; the effectiveness of Government
action in mitigating the effects of the shock; and the wider international context.
There is probably not much that can be done locally to fundamentally change the nature of each
scenario (and each scenario has been developed based on national data). But each will imply local
action, whether as ‘Government agent’, filling the gaps in the national offer, reorienting existing services
and priorities to meet changed demand, and planning for longer-term investment.
Future scenarios: Scenario 1 – Upside scenario
26
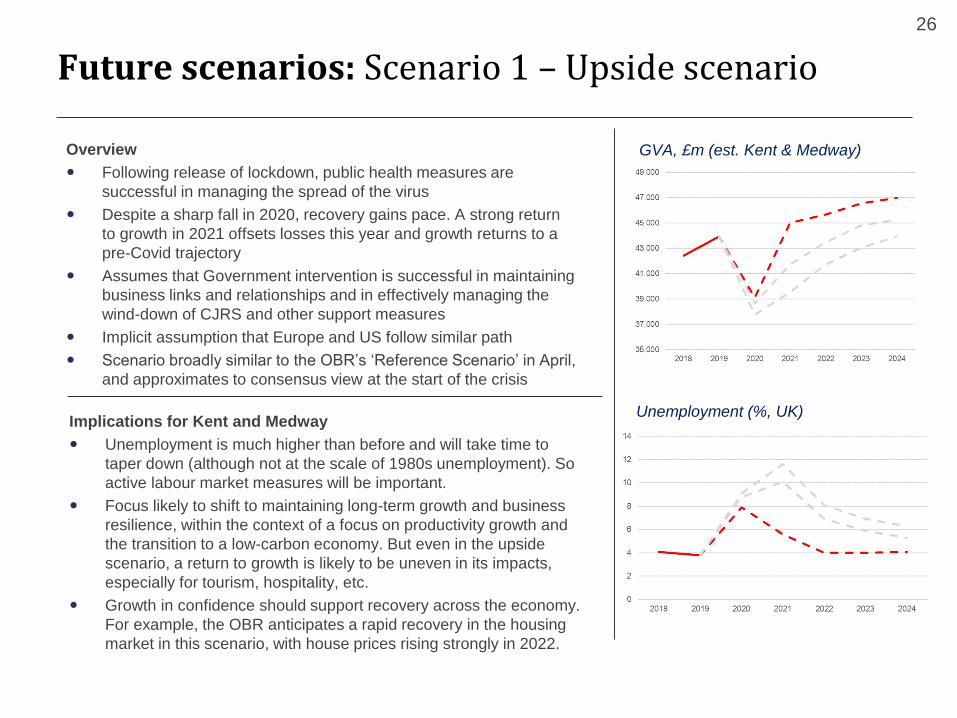
Overview
Following release of lockdown, public health measures are
successful in managing the spread of the virus
Despite a sharp fall in 2020, recovery gains pace. A strong return
to growth in 2021 offsets losses this year and growth returns to a
pre-Covid trajectory
Assumes that Government intervention is successful in maintaining
business links and relationships and in effectively managing the
wind-down of CJRS and other support measures
Implicit assumption that Europe and US follow similar path
Scenario broadly similar to the OBR’s ‘Reference Scenario’ in April,
and approximates to consensus view at the start of the crisis
GVA, £m (est. Kent & Medway)
Unemployment (%, UK)Implications for Kent and Medway
Unemployment is much higher than before and will take time to
taper down (although not at the scale of 1980s unemployment). So
active labour market measures will be important.
Focus likely to shift to maintaining long-term growth and business
resilience, within the context of a focus on productivity growth and
the transition to a low-carbon economy. But even in the upside
scenario, a return to growth is likely to be uneven in its impacts,
especially for tourism, hospitality, etc.
Growth in confidence should support recovery across the economy.
For example, the OBR anticipates a rapid recovery in the housing
market in this scenario, with house prices rising strongly in 2022.
Future scenarios: Scenario 2 – Central scenario
27
GVA, £m (est. Kent & Medway)
Unemployment (%, UK)
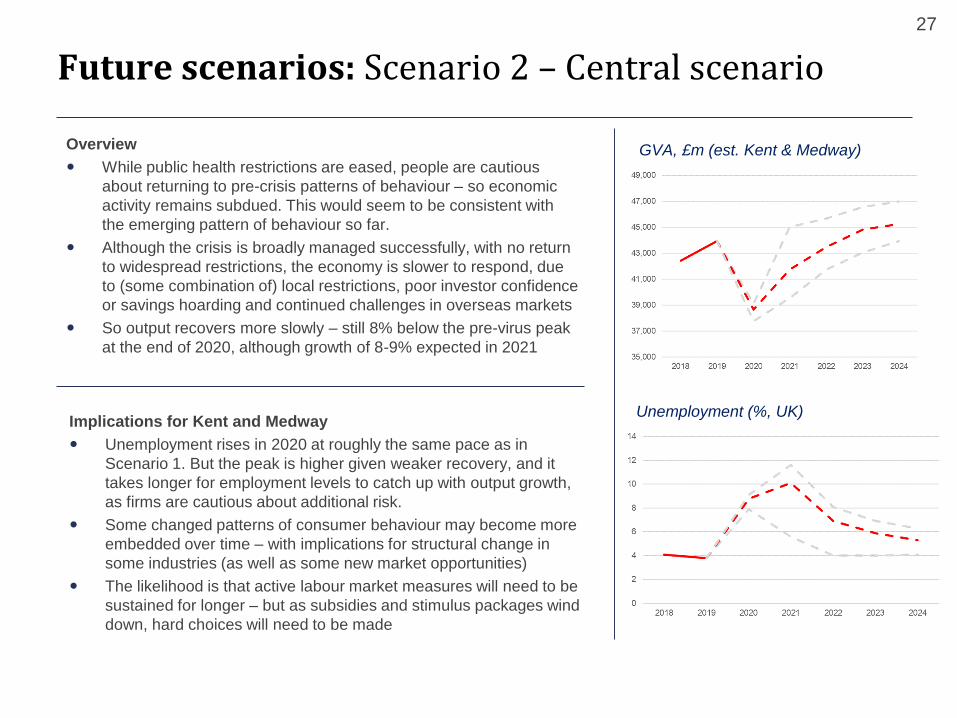
Overview
While public health restrictions are eased, people are cautious
about returning to pre-crisis patterns of behaviour – so economic
activity remains subdued. This would seem to be consistent with
the emerging pattern of behaviour so far.
Although the crisis is broadly managed successfully, with no return
to widespread restrictions, the economy is slower to respond, due
to (some combination of) local restrictions, poor investor confidence
or savings hoarding and continued challenges in overseas markets
So output recovers more slowly – still 8% below the pre-virus peak
at the end of 2020, although growth of 8-9% expected in 2021
Implications for Kent and Medway
Unemployment rises in 2020 at roughly the same pace as in
Scenario 1. But the peak is higher given weaker recovery, and it
takes longer for employment levels to catch up with output growth,
as firms are cautious about additional risk.
Some changed patterns of consumer behaviour may become more
embedded over time – with implications for structural change in
some industries (as well as some new market opportunities)
The likelihood is that active labour market measures will need to be
sustained for longer – but as subsidies and stimulus packages wind
down, hard choices will need to be made
Future scenarios: Scenario 3 – Downside scenario
28
GVA, £m (est. Kent & Medway)
Unemployment (%, UK)
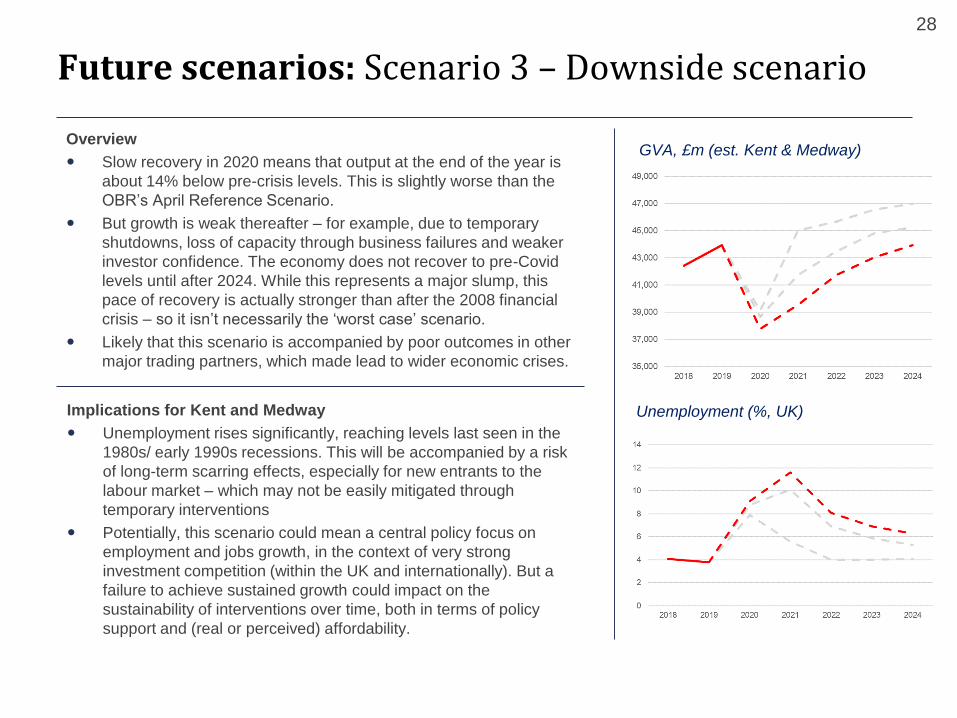
Overview
Slow recovery in 2020 means that output at the end of the year is
about 14% below pre-crisis levels. This is slightly worse than the
OBR’s April Reference Scenario.
But growth is weak thereafter – for example, due to temporary
shutdowns, loss of capacity through business failures and weaker
investor confidence. The economy does not recover to pre-Covid
levels until after 2024. While this represents a major slump, this
pace of recovery is actually stronger than after the 2008 financial
crisis – so it isn’t necessarily the ‘worst case’ scenario.
Likely that this scenario is accompanied by poor outcomes in other
major trading partners, which made lead to wider economic crises.
Implications for Kent and Medway
Unemployment rises significantly, reaching levels last seen in the
1980s/ early 1990s recessions. This will be accompanied by a risk
of long-term scarring effects, especially for new entrants to the
labour market – which may not be easily mitigated through
temporary interventions
Potentially, this scenario could mean a central policy focus on
employment and jobs growth, in the context of very strong
investment competition (within the UK and internationally). But a
failure to achieve sustained growth could impact on the
sustainability of interventions over time, both in terms of policy
support and (real or perceived) affordability.
Kent and Medway Economic Renewal and Resilience Plan
Economic impacts evidence base
Sectoral prospects
Introduction to the sectoral analysis
30
This section considers the implications of the Covid-19 crisis for each of
the main sector groups in Kent and Medway.
Consistent with the OBR’s analysis, we have mostly used the main SIC
sections, as set out on page 8 of this report. However, we have….
➢ Considered ‘construction’ and ‘real estate’ together under a
‘development and construction’ heading, covering the property
market as a whole
➢ Included ‘accommodation and food service’ within a broader
category of ‘visitor economy’, reflecting the importance of the latter
to the county’s economy and the existence of a strong sector
identity
➢ Included ‘information and communications’ within a broader
definition of ‘digital tech’, elements of which overlap with other
sectors
➢ Set out specifically the implications for the cultural and creative
sector (included within the OBR’s analysis within the ‘other
services’ definition
➢ Included a additional reference to the life sciences sector – a very
small sector in employment terms, but one in which Kent and
Medway is seen as having some key strengths.
This analysis has limitations: there are many businesses which in reality
are in multiple sectors, and sectoral definitions are becoming less useful
as technology converges. But they are a useful way of subdividing the
economy into recognisable categories, and help us to understand the
impacts on groups of businesses.
Sectoral vulnerability
Sectors are not always useful
units of analysis: increasingly,
technology convergence and
complex supply chain links make
sector definitions somewhat
arbitrary.
However, the sectoral dimension
has been important in the way the
crisis has played out: as the
output estimates in the past
quarter illustrate, the impact of the
crisis has varied substantially by
sector.
In the lockdown phase, the
vulnerability of the retail,
hospitality and creative sectors
was obvious, and ‘enforced
contraction’ was the driver of the
collapse in output this year. But
over time, changes in structural
demand and productivity will
return as key determinants of
sector growth
Agriculture and horticulture: Overview
31
.
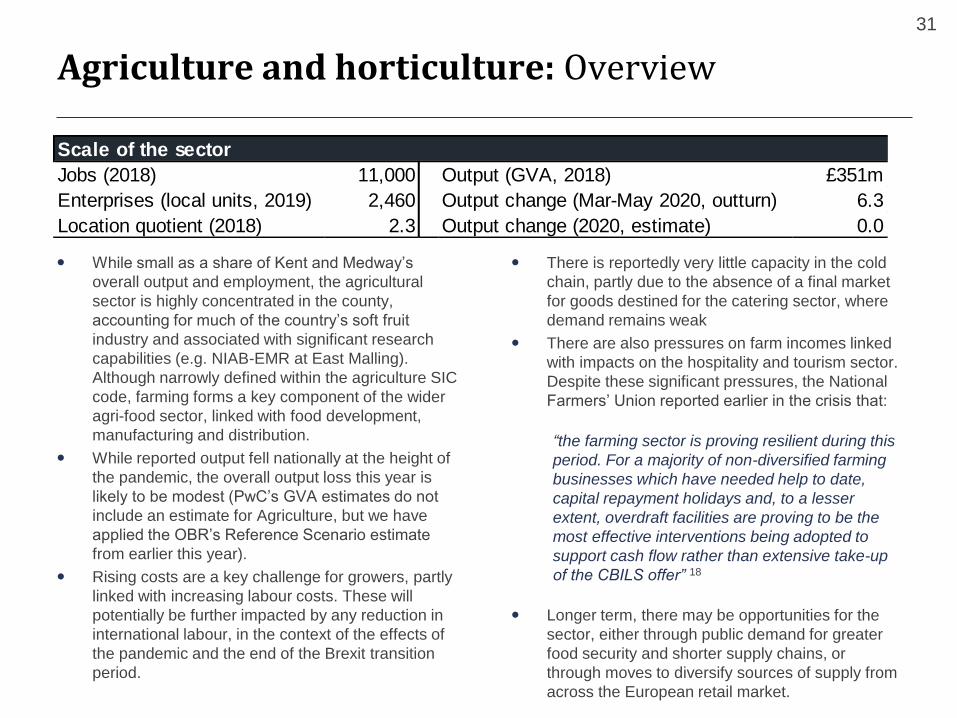
Scale of the sector
Jobs (2018) 11,000 Output (GVA, 2018) £351m
Enterprises (local units, 2019) 2,460 Output change (Mar-May 2020, outturn) 6.3
Location quotient (2018) 2.3 Output change (2020, estimate) 0.0
While small as a share of Kent and Medway’s
overall output and employment, the agricultural
sector is highly concentrated in the county,
accounting for much of the country’s soft fruit
industry and associated with significant research
capabilities (e.g. NIAB-EMR at East Malling).
Although narrowly defined within the agriculture SIC
code, farming forms a key component of the wider
agri-food sector, linked with food development,
manufacturing and distribution.
While reported output fell nationally at the height of
the pandemic, the overall output loss this year is
likely to be modest (PwC’s GVA estimates do not
include an estimate for Agriculture, but we have
applied the OBR’s Reference Scenario estimate
from earlier this year).
Rising costs are a key challenge for growers, partly
linked with increasing labour costs. These will
potentially be further impacted by any reduction in
international labour, in the context of the effects of
the pandemic and the end of the Brexit transition
period.
There is reportedly very little capacity in the cold
chain, partly due to the absence of a final market
for goods destined for the catering sector, where
demand remains weak
There are also pressures on farm incomes linked
with impacts on the hospitality and tourism sector.
Despite these significant pressures, the National
Farmers’ Union reported earlier in the crisis that:
“the farming sector is proving resilient during this
period. For a majority of non-diversified farming
businesses which have needed help to date,
capital repayment holidays and, to a lesser
extent, overdraft facilities are proving to be the
most effective interventions being adopted to
support cash flow rather than extensive take-up
of the CBILS offer” 18
Longer term, there may be opportunities for the
sector, either through public demand for greater
food security and shorter supply chains, or
through moves to diversify sources of supply from
across the European retail market.
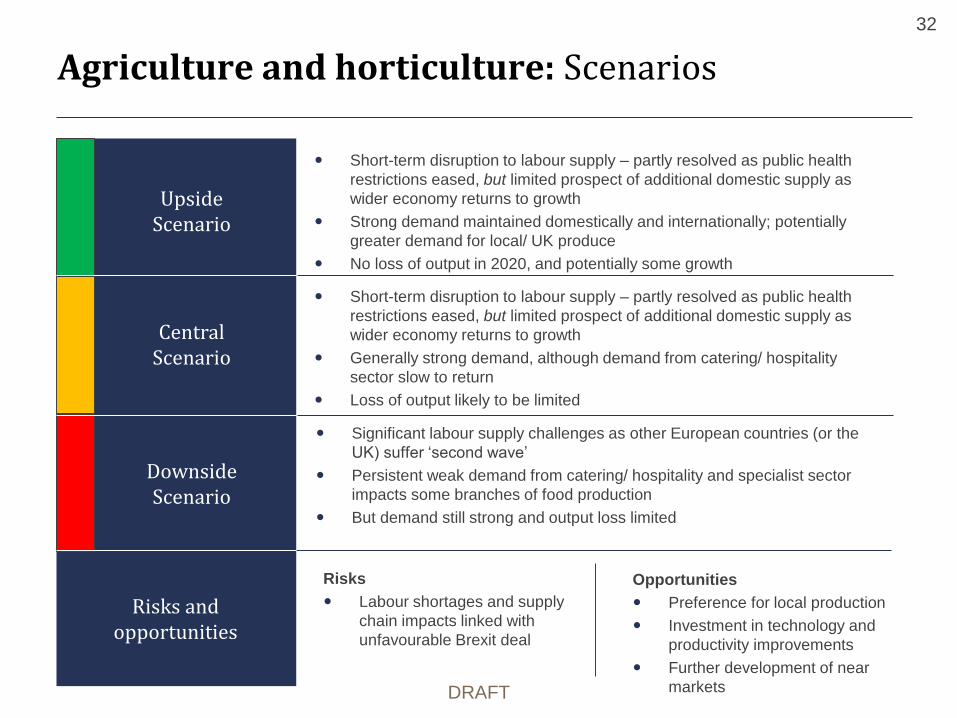
Agriculture and horticulture: Scenarios
32
Upside Scenario
CentralScenario
Downside Scenario
Risks and opportunities
Short-term disruption to labour supply – partly resolved as public health
restrictions eased, but limited prospect of additional domestic supply as
wider economy returns to growth
Strong demand maintained domestically and internationally; potentially
greater demand for local/ UK produce
No loss of output in 2020, and potentially some growth
Short-term disruption to labour supply – partly resolved as public health
restrictions eased, but limited prospect of additional domestic supply as
wider economy returns to growth
Generally strong demand, although demand from catering/ hospitality
sector slow to return
Loss of output likely to be limited
Significant labour supply challenges as other European countries (or the
UK) suffer ‘second wave’
Persistent weak demand from catering/ hospitality and specialist sector
impacts some branches of food production
But demand still strong and output loss limited
Risks
Labour shortages and supply
chain impacts linked with
unfavourable Brexit deal
Opportunities
Preference for local production
Investment in technology and
productivity improvements
Further development of near
marketsDRAFT
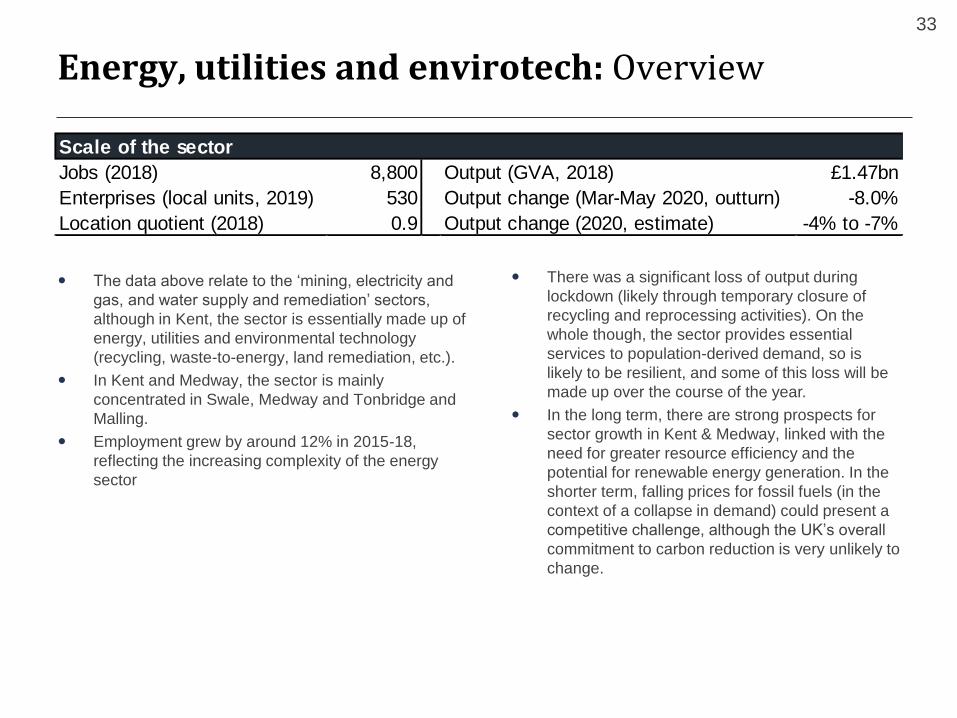
Energy, utilities and envirotech: Overview
33
Scale of the sector
Jobs (2018) 8,800 Output (GVA, 2018) £1.47bn
Enterprises (local units, 2019) 530 Output change (Mar-May 2020, outturn) -8.0%
Location quotient (2018) 0.9 Output change (2020, estimate) -4% to -7%
The data above relate to the ‘mining, electricity and
gas, and water supply and remediation’ sectors,
although in Kent, the sector is essentially made up of
energy, utilities and environmental technology
(recycling, waste-to-energy, land remediation, etc.).
In Kent and Medway, the sector is mainly
concentrated in Swale, Medway and Tonbridge and
Malling.
Employment grew by around 12% in 2015-18,
reflecting the increasing complexity of the energy
sector
There was a significant loss of output during
lockdown (likely through temporary closure of
recycling and reprocessing activities). On the
whole though, the sector provides essential
services to population-derived demand, so is
likely to be resilient, and some of this loss will be
made up over the course of the year.
In the long term, there are strong prospects for
sector growth in Kent & Medway, linked with the
need for greater resource efficiency and the
potential for renewable energy generation. In the
shorter term, falling prices for fossil fuels (in the
context of a collapse in demand) could present a
competitive challenge, although the UK’s overall
commitment to carbon reduction is very unlikely to
change.

Energy, utilities and envirotech: Scenarios
34
Upside Scenario
CentralScenario
Downside Scenario
Risks and opportunities
Domestic demand remains constant; limited contraction this year and
strong return to growth
Some projects temporarily delayed due to earlier lockdown phase and
wider disruption
Positive impacts from Government decarbonisation measures and
businesses’ willingness to invest
Market uncertainty and investor reluctance delays some new projects
Continuing weak general demand places downward pressure on energy
and commodity prices, potentially weakening the case for new
investments
Firms focus on short-term cost savings rather than long-term investments
Persistently weak energy and commodity prices, coupled with a lengthy
contraction mean that investment projects are cancelled or postponed
indefinitely; fewer opportunities for supply chain firms
Climate change and decarbonisation become less of a priority in the face
of extended economic recession
Risks
Persistently low energy prices
linked with global over-capacity
Opportunities
Long term opportunities
associated with
decarbonisation and demand
for greater resource efficiency
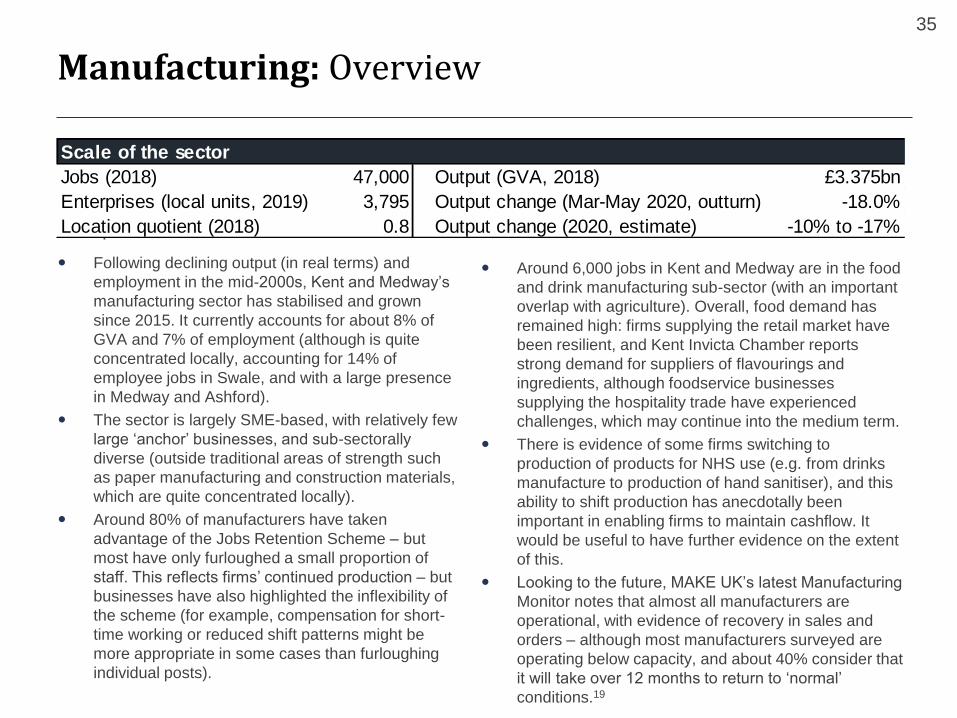
Manufacturing: Overview
35
.
Scale of the sector
Jobs (2018) 47,000 Output (GVA, 2018) £3.375bn
Enterprises (local units, 2019) 3,795 Output change (Mar-May 2020, outturn) -18.0%
Location quotient (2018) 0.8 Output change (2020, estimate) -10% to -17%
Following declining output (in real terms) and
employment in the mid-2000s, Kent and Medway’s
manufacturing sector has stabilised and grown
since 2015. It currently accounts for about 8% of
GVA and 7% of employment (although is quite
concentrated locally, accounting for 14% of
employee jobs in Swale, and with a large presence
in Medway and Ashford).
The sector is largely SME-based, with relatively few
large ‘anchor’ businesses, and sub-sectorally
diverse (outside traditional areas of strength such
as paper manufacturing and construction materials,
which are quite concentrated locally).
Around 80% of manufacturers have taken
advantage of the Jobs Retention Scheme – but
most have only furloughed a small proportion of
staff. This reflects firms’ continued production – but
businesses have also highlighted the inflexibility of
the scheme (for example, compensation for short-
time working or reduced shift patterns might be
more appropriate in some cases than furloughing
individual posts).
Around 6,000 jobs in Kent and Medway are in the food
and drink manufacturing sub-sector (with an important
overlap with agriculture). Overall, food demand has
remained high: firms supplying the retail market have
been resilient, and Kent Invicta Chamber reports
strong demand for suppliers of flavourings and
ingredients, although foodservice businesses
supplying the hospitality trade have experienced
challenges, which may continue into the medium term.
There is evidence of some firms switching to
production of products for NHS use (e.g. from drinks
manufacture to production of hand sanitiser), and this
ability to shift production has anecdotally been
important in enabling firms to maintain cashflow. It
would be useful to have further evidence on the extent
of this.
Looking to the future, MAKE UK’s latest Manufacturing
Monitor notes that almost all manufacturers are
operational, with evidence of recovery in sales and
orders – although most manufacturers surveyed are
operating below capacity, and about 40% consider that
it will take over 12 months to return to ‘normal’
conditions.19
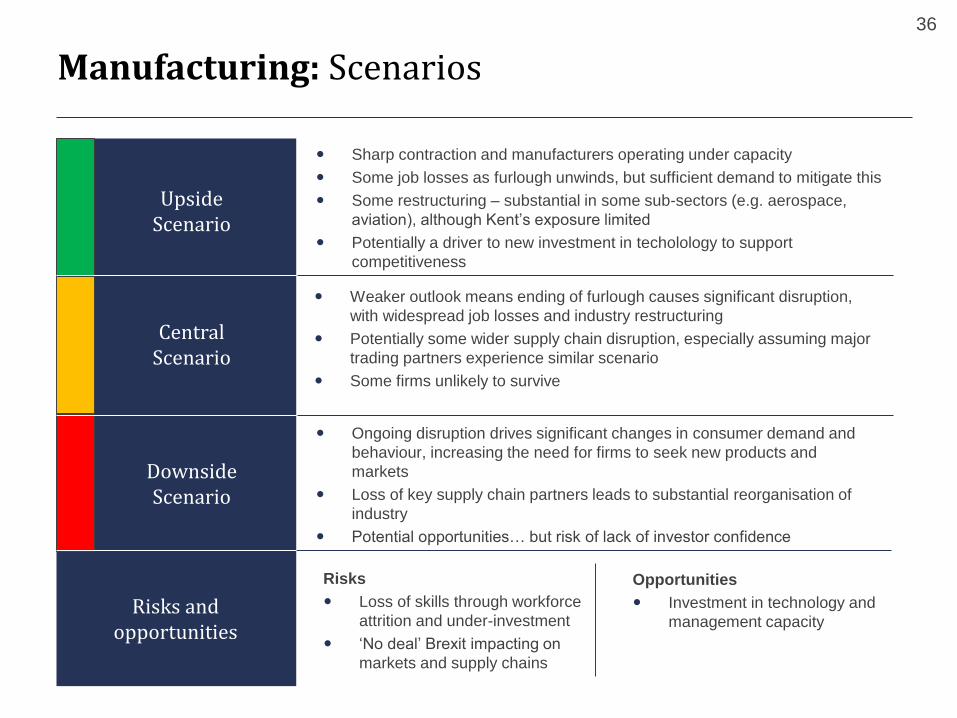
Manufacturing: Scenarios
36
Upside Scenario
CentralScenario
Downside Scenario
Risks and opportunities
Sharp contraction and manufacturers operating under capacity
Some job losses as furlough unwinds, but sufficient demand to mitigate this
Some restructuring – substantial in some sub-sectors (e.g. aerospace,
aviation), although Kent’s exposure limited
Potentially a driver to new investment in techolology to support
competitiveness
Weaker outlook means ending of furlough causes significant disruption,
with widespread job losses and industry restructuring
Potentially some wider supply chain disruption, especially assuming major
trading partners experience similar scenario
Some firms unlikely to survive
Ongoing disruption drives significant changes in consumer demand and
behaviour, increasing the need for firms to seek new products and
markets
Loss of key supply chain partners leads to substantial reorganisation of
industry
Potential opportunities… but risk of lack of investor confidence
Risks
Loss of skills through workforce
attrition and under-investment
‘No deal’ Brexit impacting on
markets and supply chains
Opportunities
Investment in technology and
management capacity
Development and construction: Overview
37
Scale of the sector
Construction
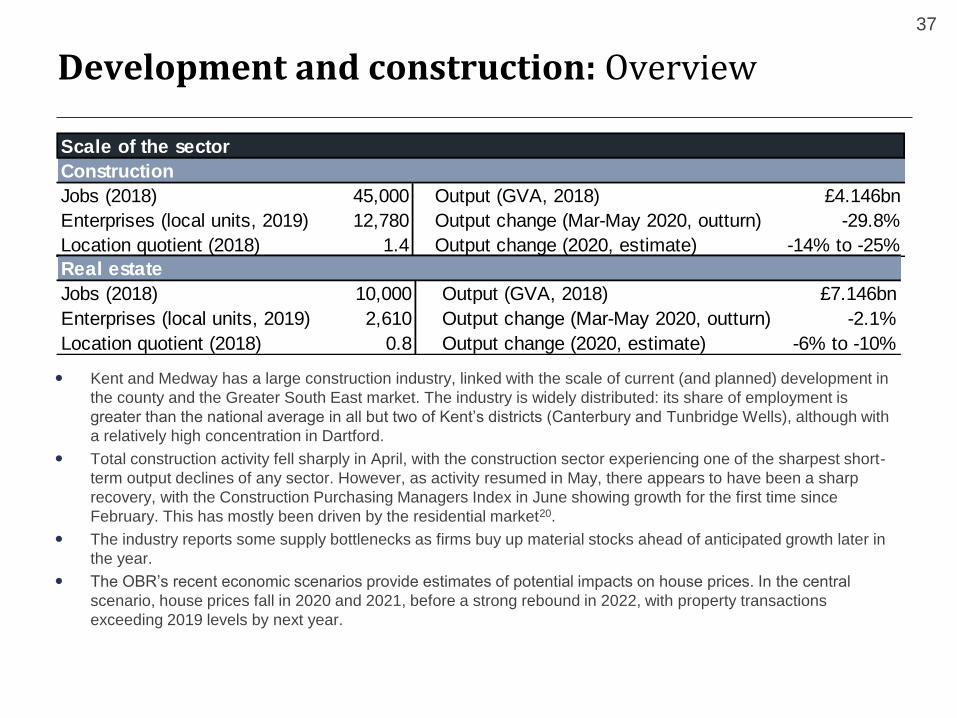
Jobs (2018) 45,000 Output (GVA, 2018) £4.146bn
Enterprises (local units, 2019) 12,780 Output change (Mar-May 2020, outturn) -29.8%
Location quotient (2018) 1.4 Output change (2020, estimate) -14% to -25%
Real estate
Jobs (2018) 10,000 Output (GVA, 2018) £7.146bn
Enterprises (local units, 2019) 2,610 Output change (Mar-May 2020, outturn) -2.1%
Location quotient (2018) 0.8 Output change (2020, estimate) -6% to -10%
Kent and Medway has a large construction industry, linked with the scale of current (and planned) development in
the county and the Greater South East market. The industry is widely distributed: its share of employment is
greater than the national average in all but two of Kent’s districts (Canterbury and Tunbridge Wells), although with
a relatively high concentration in Dartford.
Total construction activity fell sharply in April, with the construction sector experiencing one of the sharpest short-
term output declines of any sector. However, as activity resumed in May, there appears to have been a sharp
recovery, with the Construction Purchasing Managers Index in June showing growth for the first time since
February. This has mostly been driven by the residential market20.
The industry reports some supply bottlenecks as firms buy up material stocks ahead of anticipated growth later in
the year.
The OBR’s recent economic scenarios provide estimates of potential impacts on house prices. In the central
scenario, house prices fall in 2020 and 2021, before a strong rebound in 2022, with property transactions
exceeding 2019 levels by next year.
Development and construction: Scenarios
38
Upside Scenario
CentralScenario
Downside Scenario
Risks and opportunities
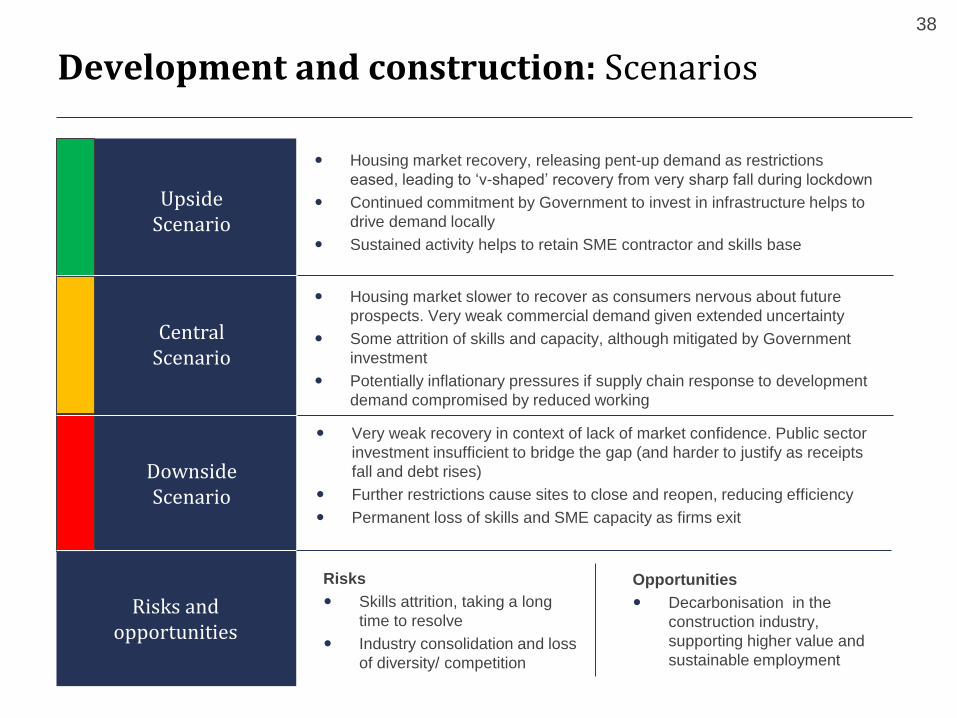
Housing market recovery, releasing pent-up demand as restrictions
eased, leading to ‘v-shaped’ recovery from very sharp fall during lockdown
Continued commitment by Government to invest in infrastructure helps to
drive demand locally
Sustained activity helps to retain SME contractor and skills base
Housing market slower to recover as consumers nervous about future
prospects. Very weak commercial demand given extended uncertainty
Some attrition of skills and capacity, although mitigated by Government
investment
Potentially inflationary pressures if supply chain response to development
demand compromised by reduced working
Very weak recovery in context of lack of market confidence. Public sector
investment insufficient to bridge the gap (and harder to justify as receipts
fall and debt rises)
Further restrictions cause sites to close and reopen, reducing efficiency
Permanent loss of skills and SME capacity as firms exit
Risks
Skills attrition, taking a long
time to resolve
Industry consolidation and loss
of diversity/ competition
Opportunities
Decarbonisation in the
construction industry,
supporting higher value and
sustainable employment
Transport and logistics: Overview
39
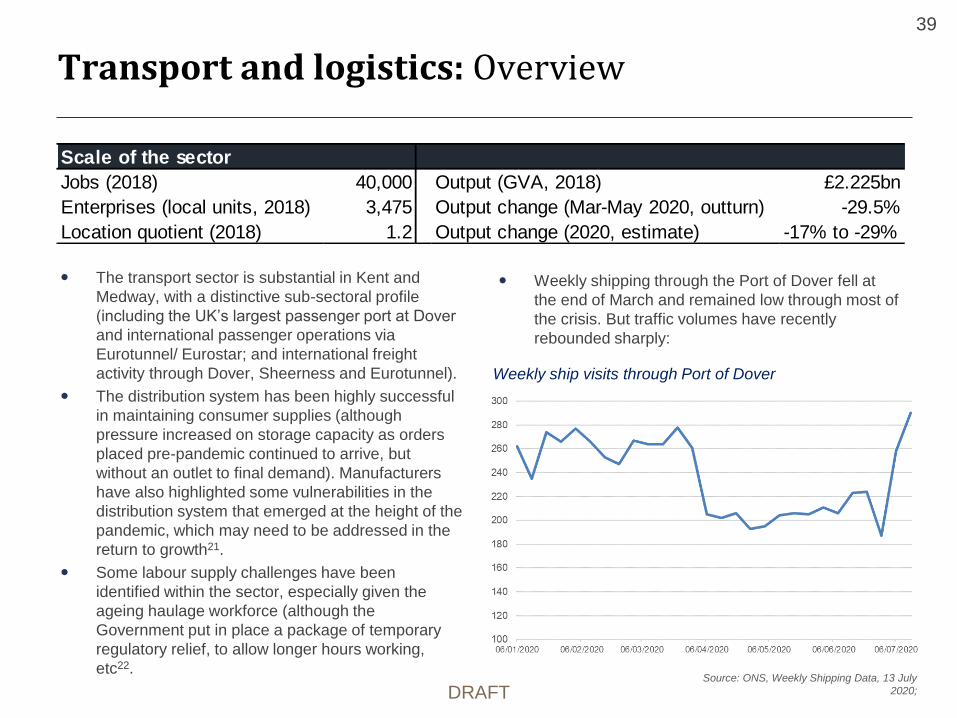
The transport sector is substantial in Kent and
Medway, with a distinctive sub-sectoral profile
(including the UK’s largest passenger port at Dover
and international passenger operations via
Eurotunnel/ Eurostar; and international freight
activity through Dover, Sheerness and Eurotunnel).
The distribution system has been highly successful
in maintaining consumer supplies (although
pressure increased on storage capacity as orders
placed pre-pandemic continued to arrive, but
without an outlet to final demand). Manufacturers
have also highlighted some vulnerabilities in the
distribution system that emerged at the height of the
pandemic, which may need to be addressed in the
return to growth21.
Some labour supply challenges have been
identified within the sector, especially given the
ageing haulage workforce (although the
Government put in place a package of temporary
regulatory relief, to allow longer hours working,
etc22.
Scale of the sector
Jobs (2018) 40,000 Output (GVA, 2018) £2.225bn
Enterprises (local units, 2018) 3,475 Output change (Mar-May 2020, outturn) -29.5%
Location quotient (2018) 1.2 Output change (2020, estimate) -17% to -29%
Weekly ship visits through Port of Dover
Weekly shipping through the Port of Dover fell at
the end of March and remained low through most of
the crisis. But traffic volumes have recently
rebounded sharply:
Source: ONS, Weekly Shipping Data, 13 July
2020; DRAFT

Transport and logistics: Scenarios
40
Upside Scenario
CentralScenario
Downside Scenario
Risks and opportunities
Reduced demand for freight services in short term – but rapid bounce
back as general activity resumes this year, and online purchasing grows
Passenger travel remains very subdued for the remainder of this year,
with some behavour change likely to be permanent. This leads to some
job losses and restructuring
Continued investment in port operations
Steady return to growth similar to upside scenario, although weaker
demand plays this out over a longer period. Investment continues, given
long-term outlook
Passenger transport experiences continued weak demand and some
services become unviable.
Overall demand sluggish and similarly severe downturns overseas cause
international freight volumes to decrease – potentially leading to reduced
capacity at major ports and logistics operations.
Risks
Skills attrition, given aging
logistics workforce
End of Brexit transition and
specific impacts on Kent
Opportunities
Growth of LogiTech and
automation in logistics sector
New Government proposals
(including Freeports proposition)
Retail and wholesale: Overview
41
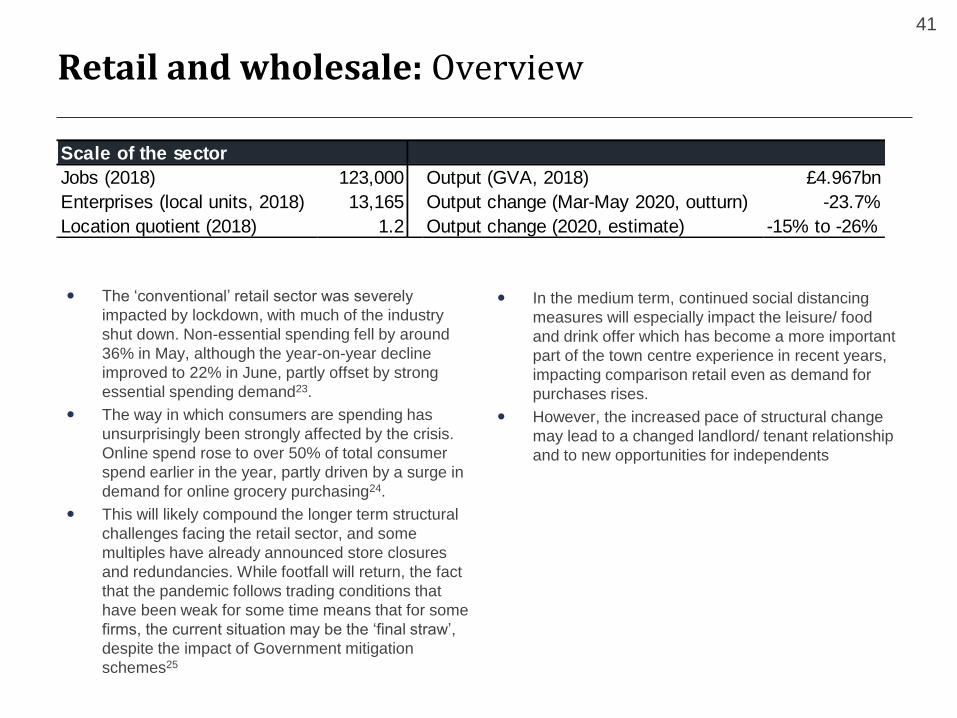
The ‘conventional’ retail sector was severely
impacted by lockdown, with much of the industry
shut down. Non-essential spending fell by around
36% in May, although the year-on-year decline
improved to 22% in June, partly offset by strong
essential spending demand23.
The way in which consumers are spending has
unsurprisingly been strongly affected by the crisis.
Online spend rose to over 50% of total consumer
spend earlier in the year, partly driven by a surge in
demand for online grocery purchasing24.
This will likely compound the longer term structural
challenges facing the retail sector, and some
multiples have already announced store closures
and redundancies. While footfall will return, the fact
that the pandemic follows trading conditions that
have been weak for some time means that for some
firms, the current situation may be the ‘final straw’,
despite the impact of Government mitigation
schemes25
Scale of the sector
Jobs (2018) 123,000 Output (GVA, 2018) £4.967bn
Enterprises (local units, 2018) 13,165 Output change (Mar-May 2020, outturn) -23.7%
Location quotient (2018) 1.2 Output change (2020, estimate) -15% to -26%
In the medium term, continued social distancing
measures will especially impact the leisure/ food
and drink offer which has become a more important
part of the town centre experience in recent years,
impacting comparison retail even as demand for
purchases rises.
However, the increased pace of structural change
may lead to a changed landlord/ tenant relationship
and to new opportunities for independents
Retail and wholesale: Scenarios
42
Upside Scenario
CentralScenario
Downside Scenario
Risks and opportunities
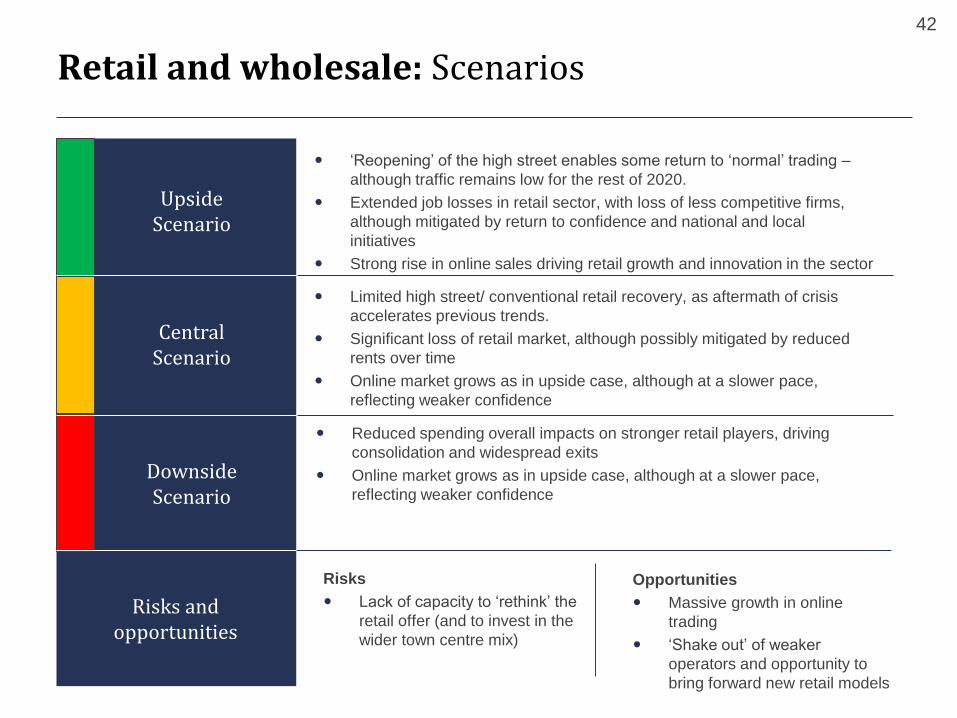
‘Reopening’ of the high street enables some return to ‘normal’ trading –
although traffic remains low for the rest of 2020.
Extended job losses in retail sector, with loss of less competitive firms,
although mitigated by return to confidence and national and local
initiatives
Strong rise in online sales driving retail growth and innovation in the sector
Limited high street/ conventional retail recovery, as aftermath of crisis
accelerates previous trends.
Significant loss of retail market, although possibly mitigated by reduced
rents over time
Online market grows as in upside case, although at a slower pace,
reflecting weaker confidence
Reduced spending overall impacts on stronger retail players, driving
consolidation and widespread exits
Online market grows as in upside case, although at a slower pace,
reflecting weaker confidence
Risks
Lack of capacity to ‘rethink’ the
retail offer (and to invest in the
wider town centre mix)
Opportunities
Massive growth in online
trading
‘Shake out’ of weaker
operators and opportunity to
bring forward new retail models
Visitor economy: Overview
43
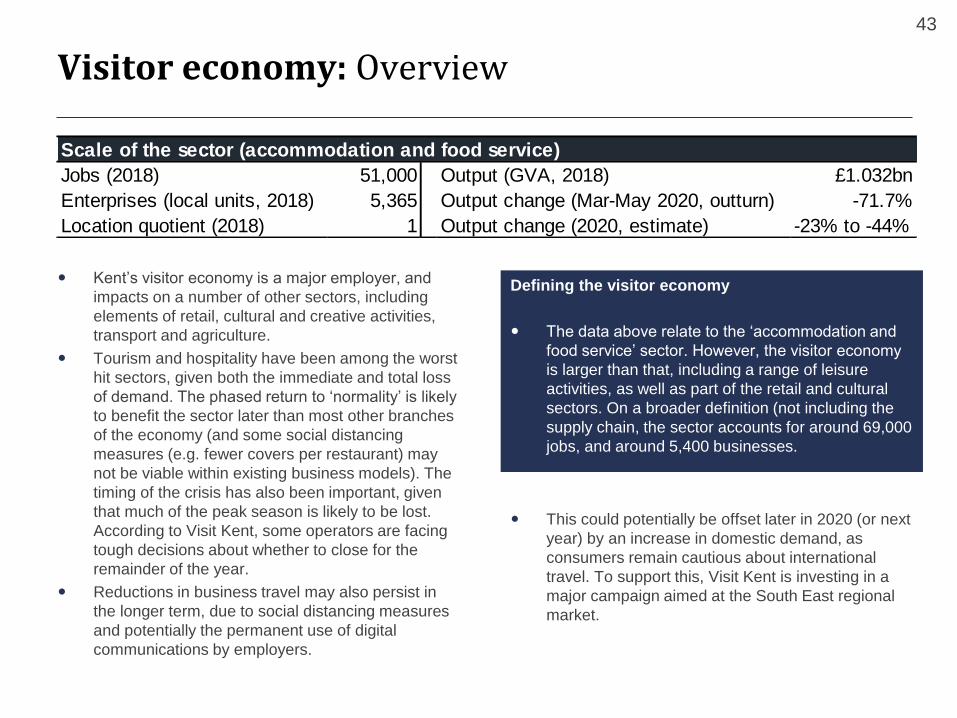
Kent’s visitor economy is a major employer, and
impacts on a number of other sectors, including
elements of retail, cultural and creative activities,
transport and agriculture.
Tourism and hospitality have been among the worst
hit sectors, given both the immediate and total loss
of demand. The phased return to ‘normality’ is likely
to benefit the sector later than most other branches
of the economy (and some social distancing
measures (e.g. fewer covers per restaurant) may
not be viable within existing business models). The
timing of the crisis has also been important, given
that much of the peak season is likely to be lost.
According to Visit Kent, some operators are facing
tough decisions about whether to close for the
remainder of the year.
Reductions in business travel may also persist in
the longer term, due to social distancing measures
and potentially the permanent use of digital
communications by employers.
Scale of the sector (accommodation and food service)
Jobs (2018) 51,000 Output (GVA, 2018) £1.032bn
Enterprises (local units, 2018) 5,365 Output change (Mar-May 2020, outturn) -71.7%
Location quotient (2018) 1 Output change (2020, estimate) -23% to -44%
This could potentially be offset later in 2020 (or next
year) by an increase in domestic demand, as
consumers remain cautious about international
travel. To support this, Visit Kent is investing in a
major campaign aimed at the South East regional
market.
Defining the visitor economy
The data above relate to the ‘accommodation and
food service’ sector. However, the visitor economy
is larger than that, including a range of leisure
activities, as well as part of the retail and cultural
sectors. On a broader definition (not including the
supply chain, the sector accounts for around 69,000
jobs, and around 5,400 businesses.
Visitor economy: Scenarios
44
Upside Scenario
CentralScenario
Downside Scenario
Risks and opportunities
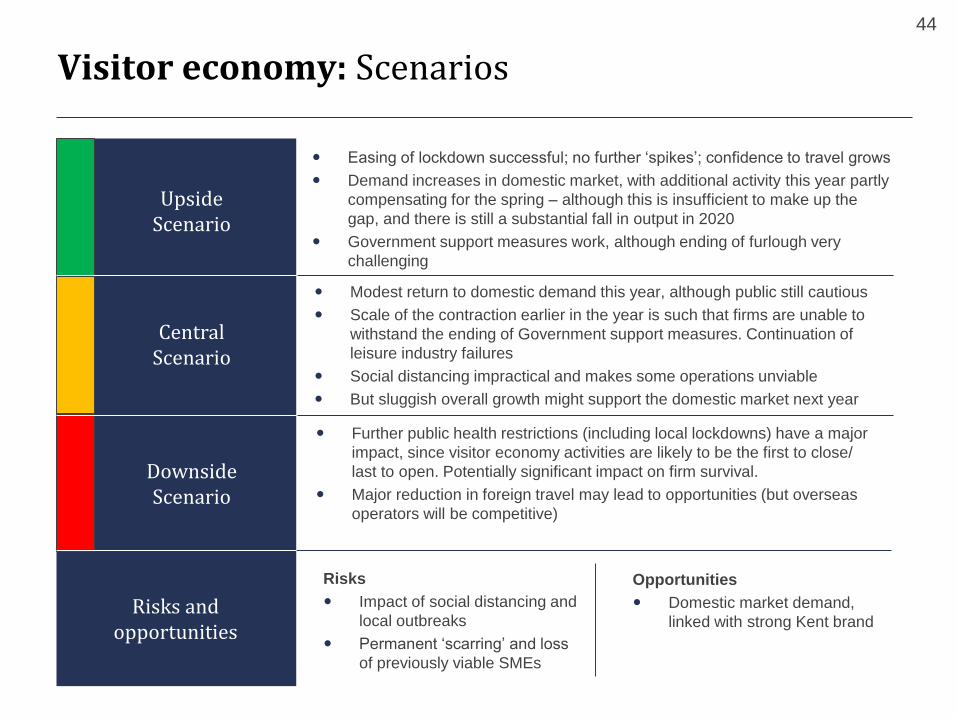
Easing of lockdown successful; no further ‘spikes’; confidence to travel grows
Demand increases in domestic market, with additional activity this year partly
compensating for the spring – although this is insufficient to make up the
gap, and there is still a substantial fall in output in 2020
Government support measures work, although ending of furlough very
challenging
Modest return to domestic demand this year, although public still cautious
Scale of the contraction earlier in the year is such that firms are unable to
withstand the ending of Government support measures. Continuation of
leisure industry failures
Social distancing impractical and makes some operations unviable
But sluggish overall growth might support the domestic market next year
Further public health restrictions (including local lockdowns) have a major
impact, since visitor economy activities are likely to be the first to close/
last to open. Potentially significant impact on firm survival.
Major reduction in foreign travel may lead to opportunities (but overseas
operators will be competitive)
Risks
Impact of social distancing and
local outbreaks
Permanent ‘scarring’ and loss
of previously viable SMEs
Opportunities
Domestic market demand,
linked with strong Kent brand
Digital tech: Overview
45
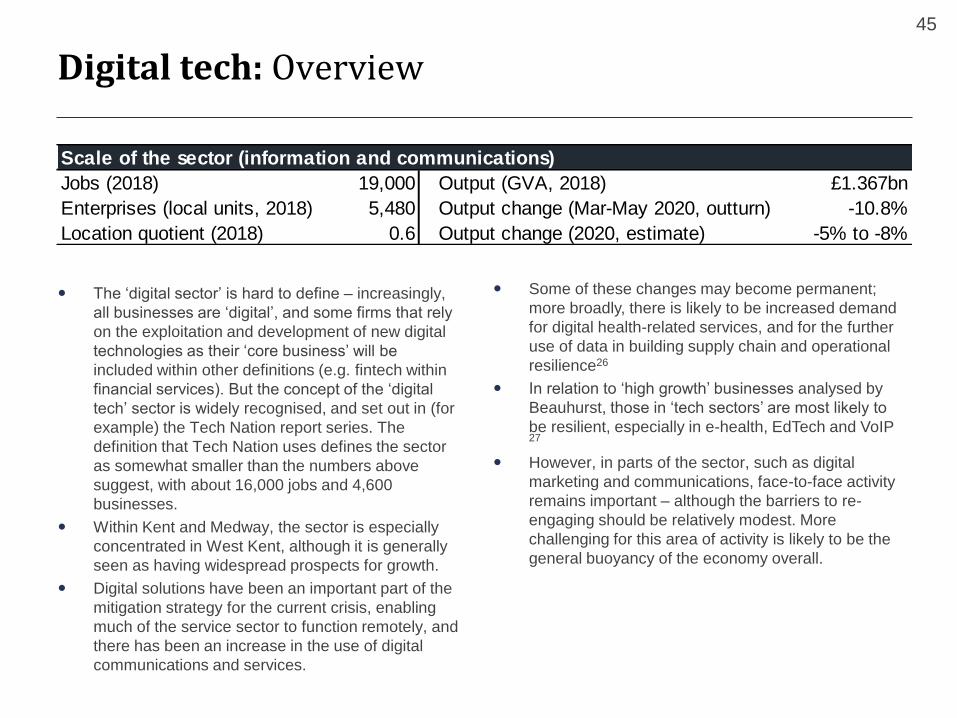
The ‘digital sector’ is hard to define – increasingly,
all businesses are ‘digital’, and some firms that rely
on the exploitation and development of new digital
technologies as their ‘core business’ will be
included within other definitions (e.g. fintech within
financial services). But the concept of the ‘digital
tech’ sector is widely recognised, and set out in (for
example) the Tech Nation report series. The
definition that Tech Nation uses defines the sector
as somewhat smaller than the numbers above
suggest, with about 16,000 jobs and 4,600
businesses.
Within Kent and Medway, the sector is especially
concentrated in West Kent, although it is generally
seen as having widespread prospects for growth.
Digital solutions have been an important part of the
mitigation strategy for the current crisis, enabling
much of the service sector to function remotely, and
there has been an increase in the use of digital
communications and services.
Scale of the sector (information and communications)
Jobs (2018) 19,000 Output (GVA, 2018) £1.367bn
Enterprises (local units, 2018) 5,480 Output change (Mar-May 2020, outturn) -10.8%
Location quotient (2018) 0.6 Output change (2020, estimate) -5% to -8%
Some of these changes may become permanent;
more broadly, there is likely to be increased demand
for digital health-related services, and for the further
use of data in building supply chain and operational
resilience26
In relation to ‘high growth’ businesses analysed by
Beauhurst, those in ‘tech sectors’ are most likely to
be resilient, especially in e-health, EdTech and VoIP 27
However, in parts of the sector, such as digital
marketing and communications, face-to-face activity
remains important – although the barriers to re-
engaging should be relatively modest. More
challenging for this area of activity is likely to be the
general buoyancy of the economy overall.

Digital tech: Scenarios
46
Upside Scenario
CentralScenario
Downside Scenario
Risks and opportunities
Strong demand for new digital products and services – crisis reinforces
existing trends and supports broader digitalisation
Some corporate ICT projects potentially, but as activity resumes, these
move forward as firms invest in resilience
Some demand for more supply chain diversity (c.f. reliance on China)
Weaker demand overall feeds into the digital tech sector – demand for
products and solutions rises, but at a slower pace
Demand from firms for greater digital resilience is sustained – and
perhaps greater demand in the event of further restrictions/ disruption
Consumer demand falters
Business demand compromised by multiple challenges and unwillingness
by firms to invest
Uncertainty limits the digital tech investment market
Risks
Lack of investor confidence
Opportunities
Continued demand for new
solutions – potentially
reinforced by the crisis
Financial, prof. and business services: Overview
47
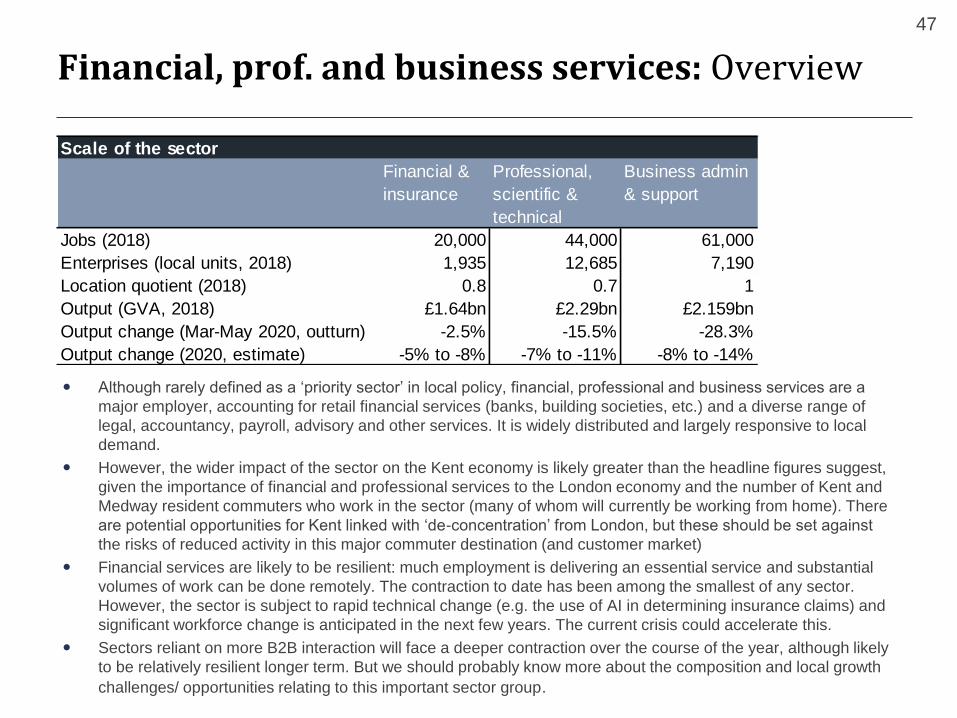
Although rarely defined as a ‘priority sector’ in local policy, financial, professional and business services are a
major employer, accounting for retail financial services (banks, building societies, etc.) and a diverse range of
legal, accountancy, payroll, advisory and other services. It is widely distributed and largely responsive to local
demand.
However, the wider impact of the sector on the Kent economy is likely greater than the headline figures suggest,
given the importance of financial and professional services to the London economy and the number of Kent and
Medway resident commuters who work in the sector (many of whom will currently be working from home). There
are potential opportunities for Kent linked with ‘de-concentration’ from London, but these should be set against
the risks of reduced activity in this major commuter destination (and customer market)
Financial services are likely to be resilient: much employment is delivering an essential service and substantial
volumes of work can be done remotely. The contraction to date has been among the smallest of any sector.
However, the sector is subject to rapid technical change (e.g. the use of AI in determining insurance claims) and
significant workforce change is anticipated in the next few years. The current crisis could accelerate this.
Sectors reliant on more B2B interaction will face a deeper contraction over the course of the year, although likely
to be relatively resilient longer term. But we should probably know more about the composition and local growth
challenges/ opportunities relating to this important sector group.
Scale of the sector
Financial &
insurance
Professional,
scientific &
technical
Business admin
& support
Jobs (2018) 20,000 44,000 61,000
Enterprises (local units, 2018) 1,935 12,685 7,190
Location quotient (2018) 0.8 0.7 1
Output (GVA, 2018) £1.64bn £2.29bn £2.159bn
Output change (Mar-May 2020, outturn) -2.5% -15.5% -28.3%
Output change (2020, estimate) -5% to -8% -7% to -11% -8% to -14%

Financial, prof. and business services: Scenarios
48
Upside Scenario
CentralScenario
Downside Scenario
Risks and opportunities
Financial and professional services generally resilient – limited impact
from lockdown and adaption to new ways of working relatively
straightforward
Some challenges for business services firms reliant on face-to-face
activity, but these are mitigated as confidence returns
Potentially some opportunities for ‘localisation’ as more work remotely
Sector is resilient, but impacted by generally weaker demand, leading to
pressure to reduce costs
Prolonged social distancing forces fundamental review of business
practices, with implications for commercial property stock
Weak general demand reduces business services market
Structural change in firm location patterns and staffing structures weakens
London’s role as Europe’s primary financial and business services centre
– negative impacts on Kent are likely to outweigh the gains from
‘localisation’, home working, etc.
Risks
Risks to London market,
including through Brexit
Automation potentially leading
to widespread restructuring
Opportunities
Online services and innovation
in FinTech and new services
and systems
Cultural and creative industries: Overview
49
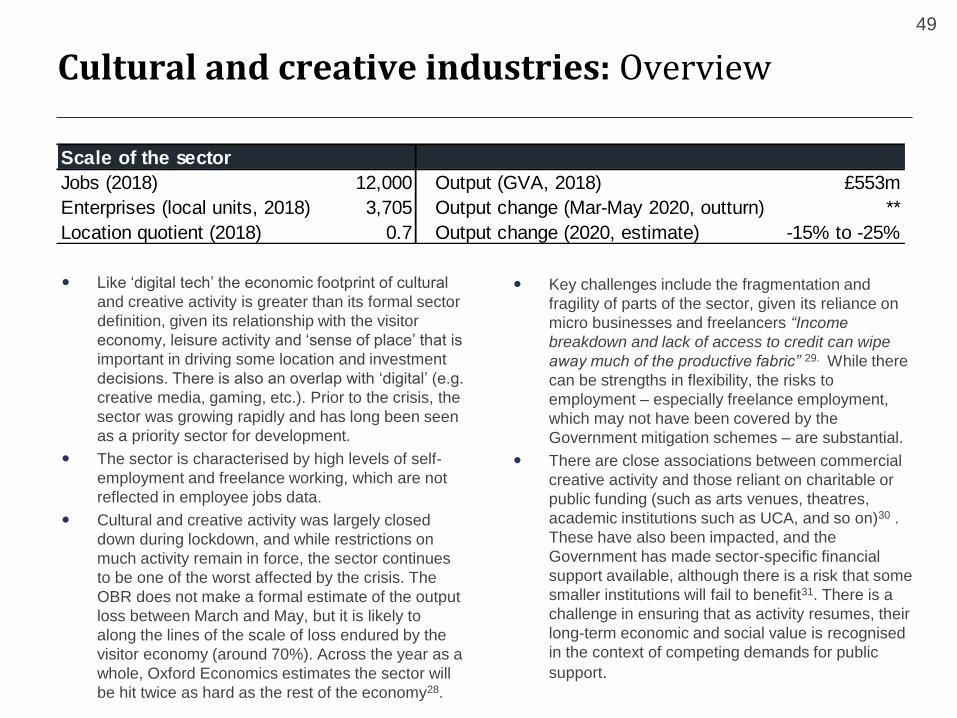
Like ‘digital tech’ the economic footprint of cultural
and creative activity is greater than its formal sector
definition, given its relationship with the visitor
economy, leisure activity and ‘sense of place’ that is
important in driving some location and investment
decisions. There is also an overlap with ‘digital’ (e.g.
creative media, gaming, etc.). Prior to the crisis, the
sector was growing rapidly and has long been seen
as a priority sector for development.
The sector is characterised by high levels of self-
employment and freelance working, which are not
reflected in employee jobs data.
Cultural and creative activity was largely closed
down during lockdown, and while restrictions on
much activity remain in force, the sector continues
to be one of the worst affected by the crisis. The
OBR does not make a formal estimate of the output
loss between March and May, but it is likely to
along the lines of the scale of loss endured by the
visitor economy (around 70%). Across the year as a
whole, Oxford Economics estimates the sector will
be hit twice as hard as the rest of the economy28.
.
Scale of the sector
Jobs (2018) 12,000 Output (GVA, 2018) £553m
Enterprises (local units, 2018) 3,705 Output change (Mar-May 2020, outturn) **
Location quotient (2018) 0.7 Output change (2020, estimate) -15% to -25%
Key challenges include the fragmentation and
fragility of parts of the sector, given its reliance on
micro businesses and freelancers “Income
breakdown and lack of access to credit can wipe
away much of the productive fabric” 29. While there
can be strengths in flexibility, the risks to
employment – especially freelance employment,
which may not have been covered by the
Government mitigation schemes – are substantial.
There are close associations between commercial
creative activity and those reliant on charitable or
public funding (such as arts venues, theatres,
academic institutions such as UCA, and so on)30 .
These have also been impacted, and the
Government has made sector-specific financial
support available, although there is a risk that some
smaller institutions will fail to benefit31. There is a
challenge in ensuring that as activity resumes, their
long-term economic and social value is recognised
in the context of competing demands for public
support.
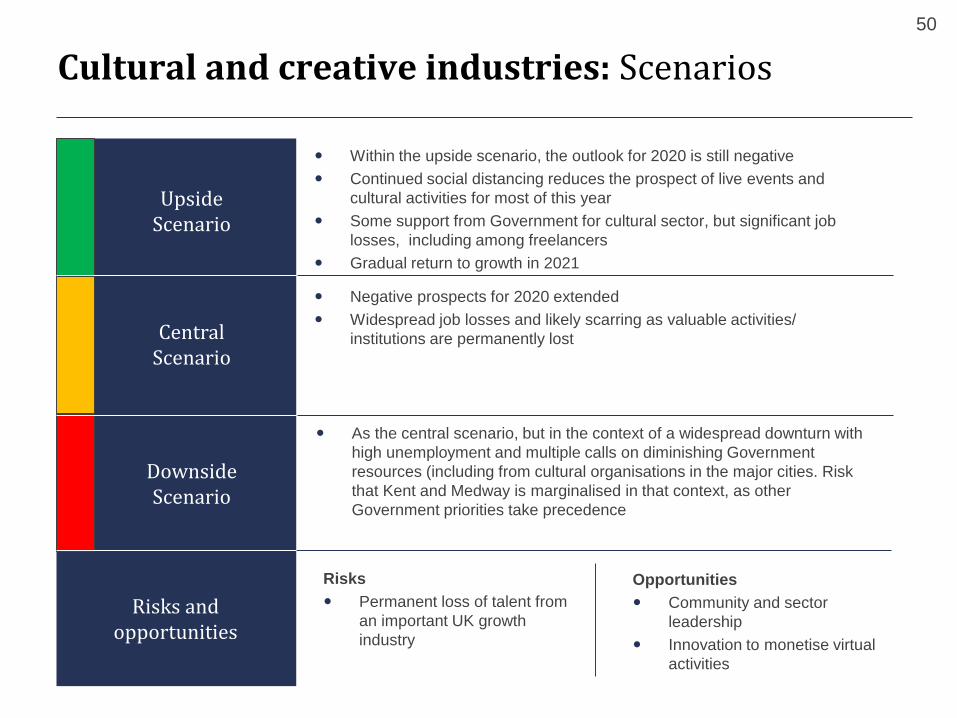
Cultural and creative industries: Scenarios
50
Upside Scenario
CentralScenario
Downside Scenario
Risks and opportunities
Within the upside scenario, the outlook for 2020 is still negative
Continued social distancing reduces the prospect of live events and
cultural activities for most of this year
Some support from Government for cultural sector, but significant job
losses, including among freelancers
Gradual return to growth in 2021
Negative prospects for 2020 extended
Widespread job losses and likely scarring as valuable activities/
institutions are permanently lost
As the central scenario, but in the context of a widespread downturn with
high unemployment and multiple calls on diminishing Government
resources (including from cultural organisations in the major cities. Risk
that Kent and Medway is marginalised in that context, as other
Government priorities take precedence
Risks
Permanent loss of talent from
an important UK growth
industry
Opportunities
Community and sector
leadership
Innovation to monetise virtual
activities
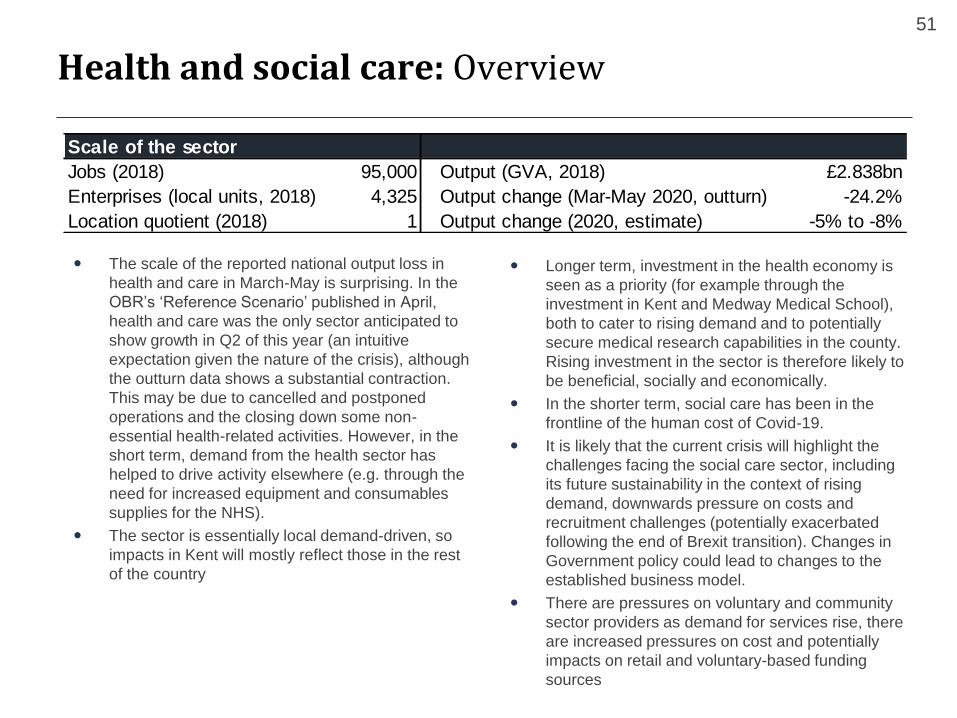
Health and social care: Overview
51
The scale of the reported national output loss in
health and care in March-May is surprising. In the
OBR’s ‘Reference Scenario’ published in April,
health and care was the only sector anticipated to
show growth in Q2 of this year (an intuitive
expectation given the nature of the crisis), although
the outturn data shows a substantial contraction.
This may be due to cancelled and postponed
operations and the closing down some non-
essential health-related activities. However, in the
short term, demand from the health sector has
helped to drive activity elsewhere (e.g. through the
need for increased equipment and consumables
supplies for the NHS).
The sector is essentially local demand-driven, so
impacts in Kent will mostly reflect those in the rest
of the country
Scale of the sector
Jobs (2018) 95,000 Output (GVA, 2018) £2.838bn
Enterprises (local units, 2018) 4,325 Output change (Mar-May 2020, outturn) -24.2%
Location quotient (2018) 1 Output change (2020, estimate) -5% to -8%
Longer term, investment in the health economy is
seen as a priority (for example through the
investment in Kent and Medway Medical School),
both to cater to rising demand and to potentially
secure medical research capabilities in the county.
Rising investment in the sector is therefore likely to
be beneficial, socially and economically.
In the shorter term, social care has been in the
frontline of the human cost of Covid-19.
It is likely that the current crisis will highlight the
challenges facing the social care sector, including
its future sustainability in the context of rising
demand, downwards pressure on costs and
recruitment challenges (potentially exacerbated
following the end of Brexit transition). Changes in
Government policy could lead to changes to the
established business model.
There are pressures on voluntary and community
sector providers as demand for services rise, there
are increased pressures on cost and potentially
impacts on retail and voluntary-based funding
sources

Health and social care: Scenarios
52
Upside Scenario
CentralScenario
Downside Scenario
Risks and opportunities
Largely responsive to local demand; returns to normal activity as
disruption settles down
Public support and concern following pandemic has positive
consequences in terms of investment in care system, and interest in
health and care careers
Demand for investment in digital health, with wider economic benefits
Further outbreaks prompt continued responses from public health
authorities and re-focusing of effort on the immediate crisis. But the
system is broadly able to cope and learns from experience of the first
wave
Widespread disruption to the system from further Covid-19 outbreaks (or
coincidence with seasonal flu or other public health matter)
In context of general economic downturn and continued pandemic, limited
capacity to address long-term structural issues related to the health and
care economy.
Risks
Loss of staff (major risk, given
Kent’s current vulnerabilities)
Resources diverted to
immediate crisis
Opportunities
Digital health, likely to have
new impetus
Links with research base
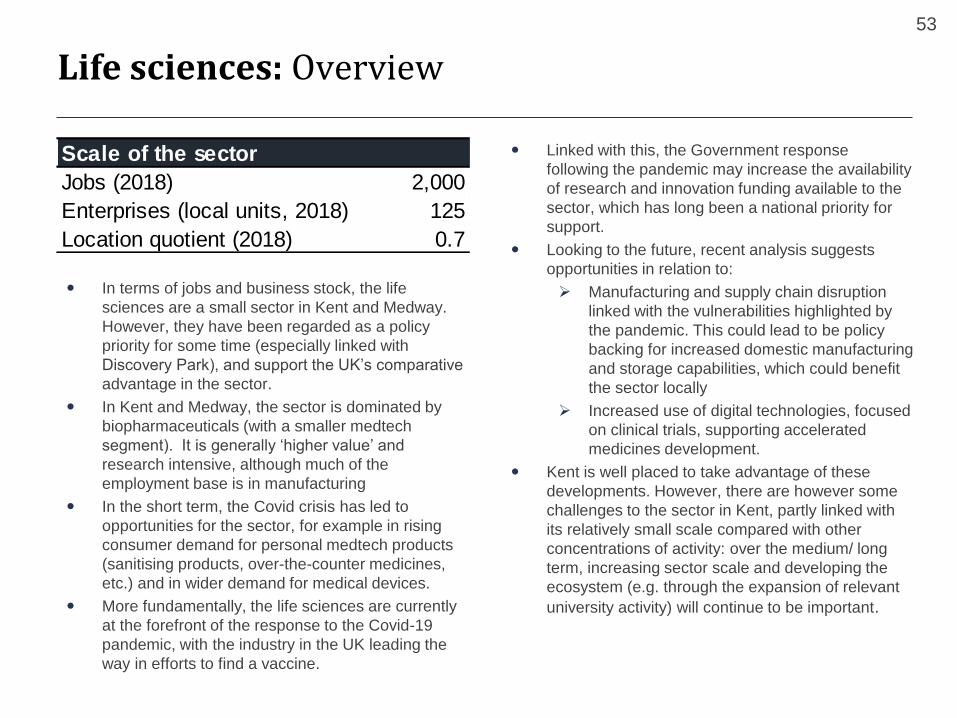
Life sciences: Overview
53
In terms of jobs and business stock, the life
sciences are a small sector in Kent and Medway.
However, they have been regarded as a policy
priority for some time (especially linked with
Discovery Park), and support the UK’s comparative
advantage in the sector.
In Kent and Medway, the sector is dominated by
biopharmaceuticals (with a smaller medtech
segment). It is generally ‘higher value’ and
research intensive, although much of the
employment base is in manufacturing
In the short term, the Covid crisis has led to
opportunities for the sector, for example in rising
consumer demand for personal medtech products
(sanitising products, over-the-counter medicines,
etc.) and in wider demand for medical devices.
More fundamentally, the life sciences are currently
at the forefront of the response to the Covid-19
pandemic, with the industry in the UK leading the
way in efforts to find a vaccine.
Scale of the sector
Jobs (2018) 2,000
Enterprises (local units, 2018) 125
Location quotient (2018) 0.7
Linked with this, the Government response
following the pandemic may increase the availability
of research and innovation funding available to the
sector, which has long been a national priority for
support.
Looking to the future, recent analysis suggests
opportunities in relation to:
➢ Manufacturing and supply chain disruption
linked with the vulnerabilities highlighted by
the pandemic. This could lead to be policy
backing for increased domestic manufacturing
and storage capabilities, which could benefit
the sector locally
➢ Increased use of digital technologies, focused
on clinical trials, supporting accelerated
medicines development.
Kent is well placed to take advantage of these
developments. However, there are however some
challenges to the sector in Kent, partly linked with
its relatively small scale compared with other
concentrations of activity: over the medium/ long
term, increasing sector scale and developing the
ecosystem (e.g. through the expansion of relevant
university activity) will continue to be important.
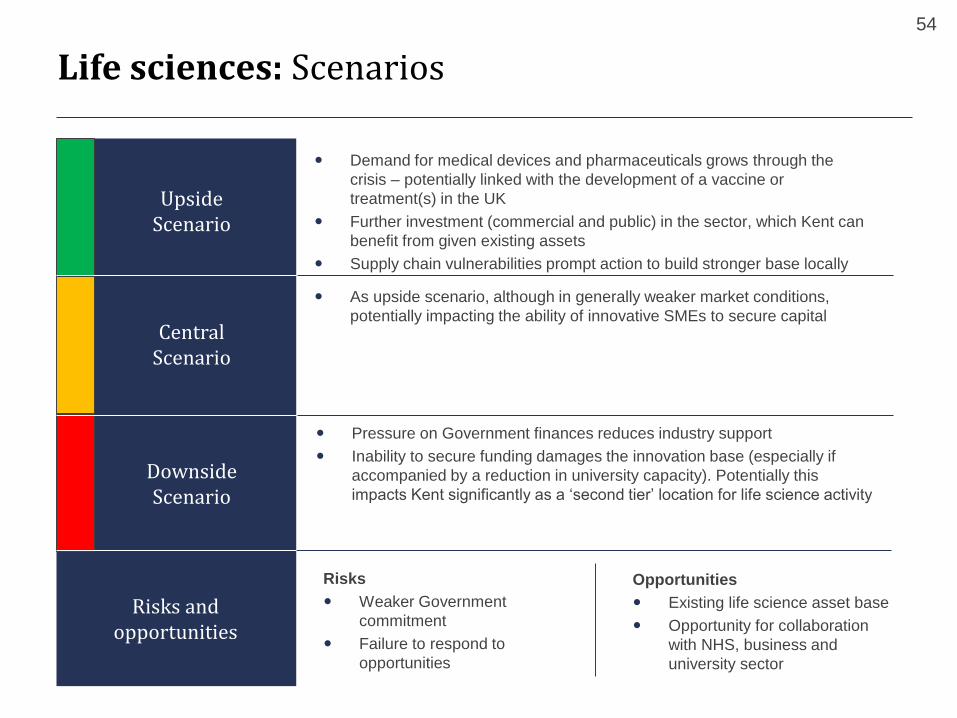
Life sciences: Scenarios
54
Upside Scenario
CentralScenario
Downside Scenario
Risks and opportunities
Demand for medical devices and pharmaceuticals grows through the
crisis – potentially linked with the development of a vaccine or
treatment(s) in the UK
Further investment (commercial and public) in the sector, which Kent can
benefit from given existing assets
Supply chain vulnerabilities prompt action to build stronger base locally
As upside scenario, although in generally weaker market conditions,
potentially impacting the ability of innovative SMEs to secure capital
Pressure on Government finances reduces industry support
Inability to secure funding damages the innovation base (especially if
accompanied by a reduction in university capacity). Potentially this
impacts Kent significantly as a ‘second tier’ location for life science activity
Risks
Weaker Government
commitment
Failure to respond to
opportunities
Opportunities
Existing life science asset base
Opportunity for collaboration
with NHS, business and
university sector
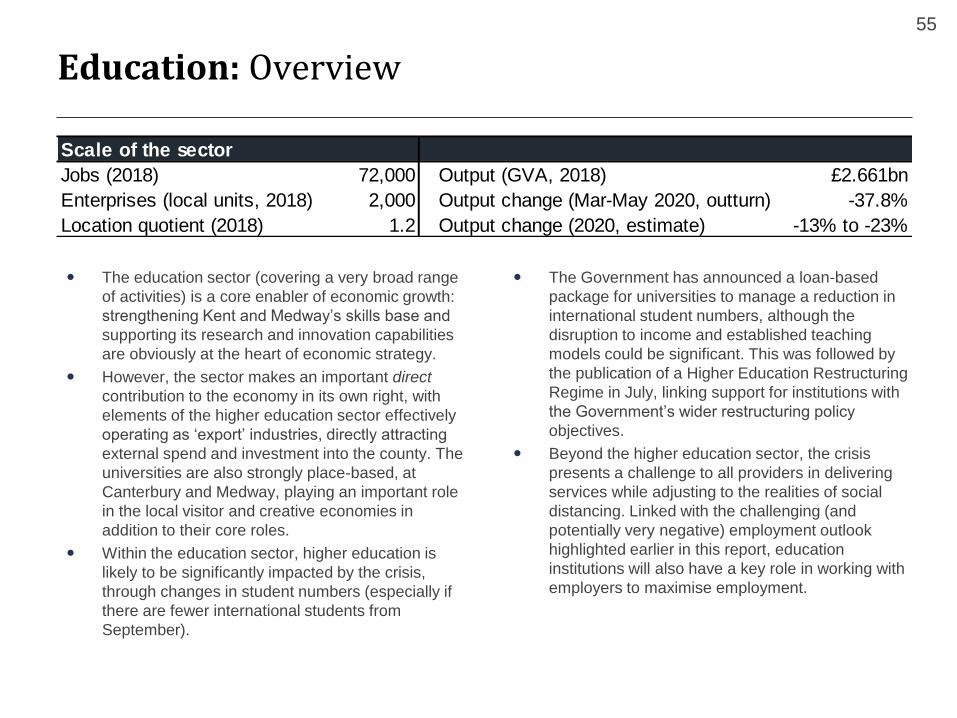
Education: Overview
55
The education sector (covering a very broad range
of activities) is a core enabler of economic growth:
strengthening Kent and Medway’s skills base and
supporting its research and innovation capabilities
are obviously at the heart of economic strategy.
However, the sector makes an important direct
contribution to the economy in its own right, with
elements of the higher education sector effectively
operating as ‘export’ industries, directly attracting
external spend and investment into the county. The
universities are also strongly place-based, at
Canterbury and Medway, playing an important role
in the local visitor and creative economies in
addition to their core roles.
Within the education sector, higher education is
likely to be significantly impacted by the crisis,
through changes in student numbers (especially if
there are fewer international students from
September).
Scale of the sector
Jobs (2018) 72,000 Output (GVA, 2018) £2.661bn
Enterprises (local units, 2018) 2,000 Output change (Mar-May 2020, outturn) -37.8%
Location quotient (2018) 1.2 Output change (2020, estimate) -13% to -23%
The Government has announced a loan-based
package for universities to manage a reduction in
international student numbers, although the
disruption to income and established teaching
models could be significant. This was followed by
the publication of a Higher Education Restructuring
Regime in July, linking support for institutions with
the Government’s wider restructuring policy
objectives.
Beyond the higher education sector, the crisis
presents a challenge to all providers in delivering
services while adjusting to the realities of social
distancing. Linked with the challenging (and
potentially very negative) employment outlook
highlighted earlier in this report, education
institutions will also have a key role in working with
employers to maximise employment.
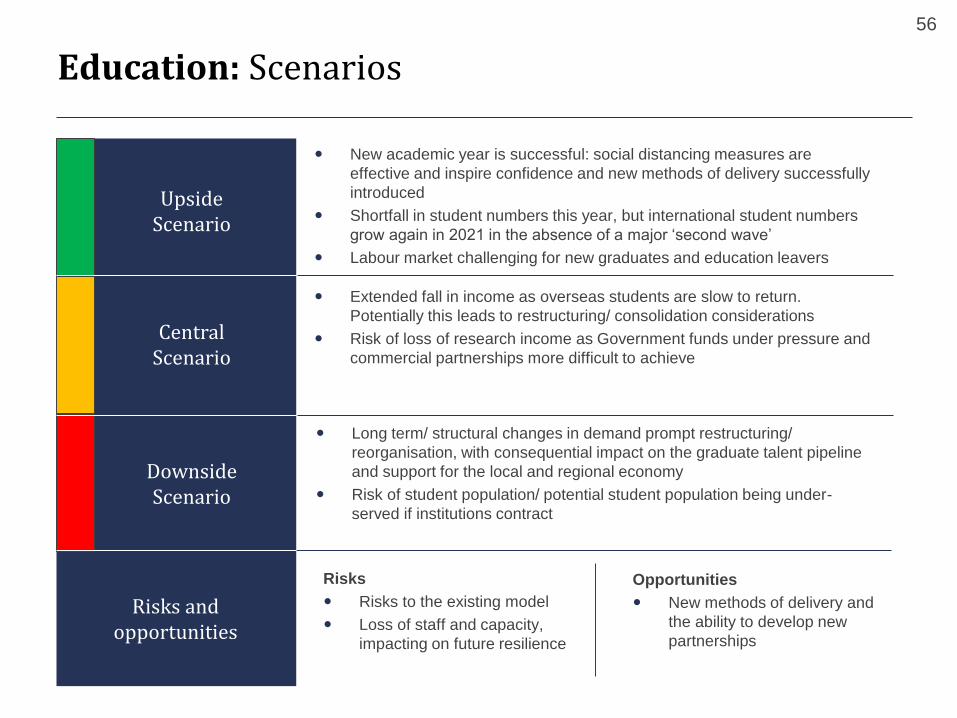
Education: Scenarios
56
Upside Scenario
CentralScenario
Downside Scenario
Risks and opportunities
New academic year is successful: social distancing measures are
effective and inspire confidence and new methods of delivery successfully
introduced
Shortfall in student numbers this year, but international student numbers
grow again in 2021 in the absence of a major ‘second wave’
Labour market challenging for new graduates and education leavers
Extended fall in income as overseas students are slow to return.
Potentially this leads to restructuring/ consolidation considerations
Risk of loss of research income as Government funds under pressure and
commercial partnerships more difficult to achieve
Long term/ structural changes in demand prompt restructuring/
reorganisation, with consequential impact on the graduate talent pipeline
and support for the local and regional economy
Risk of student population/ potential student population being under-
served if institutions contract
Risks
Risks to the existing model
Loss of staff and capacity,
impacting on future resilience
Opportunities
New methods of delivery and
the ability to develop new
partnerships
Kent and Medway Economic Renewal and Resilience Plan
Economic impacts evidence base
Annexes
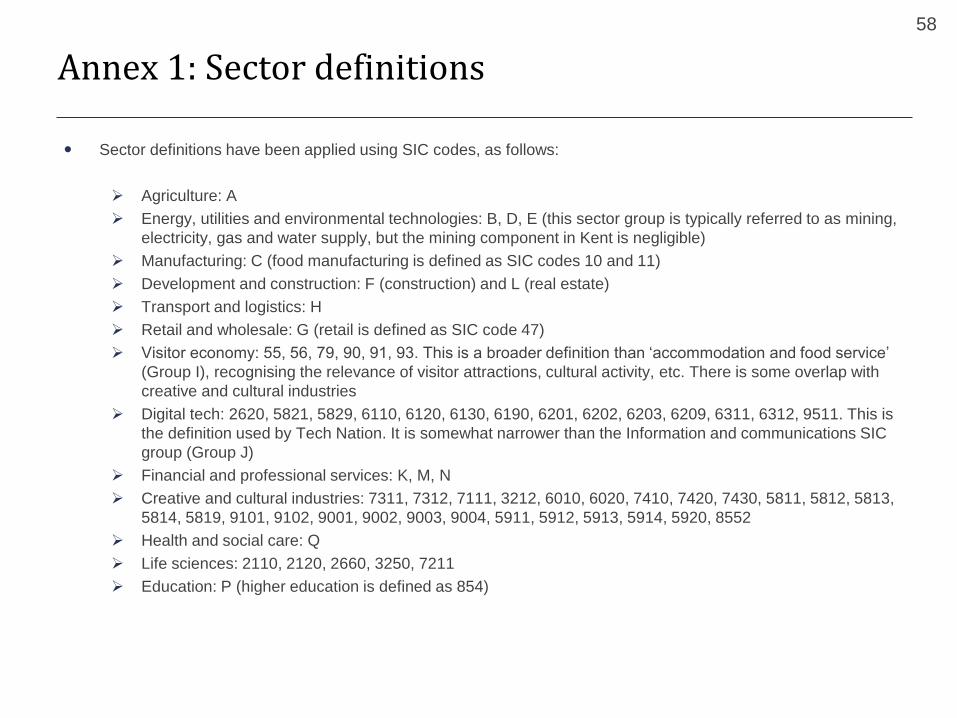
Annex 1: Sector definitions
58
Sector definitions have been applied using SIC codes, as follows:
➢ Agriculture: A
➢ Energy, utilities and environmental technologies: B, D, E (this sector group is typically referred to as mining,
electricity, gas and water supply, but the mining component in Kent is negligible)
➢ Manufacturing: C (food manufacturing is defined as SIC codes 10 and 11)
➢ Development and construction: F (construction) and L (real estate)
➢ Transport and logistics: H
➢ Retail and wholesale: G (retail is defined as SIC code 47)
➢ Visitor economy: 55, 56, 79, 90, 91, 93. This is a broader definition than ‘accommodation and food service’
(Group I), recognising the relevance of visitor attractions, cultural activity, etc. There is some overlap with
creative and cultural industries
➢ Digital tech: 2620, 5821, 5829, 6110, 6120, 6130, 6190, 6201, 6202, 6203, 6209, 6311, 6312, 9511. This is
the definition used by Tech Nation. It is somewhat narrower than the Information and communications SIC
group (Group J)
➢ Financial and professional services: K, M, N
➢ Creative and cultural industries: 7311, 7312, 7111, 3212, 6010, 6020, 7410, 7420, 7430, 5811, 5812, 5813,
5814, 5819, 9101, 9102, 9001, 9002, 9003, 9004, 5911, 5912, 5913, 5914, 5920, 8552
➢ Health and social care: Q
➢ Life sciences: 2110, 2120, 2660, 3250, 7211
➢ Education: P (higher education is defined as 854)
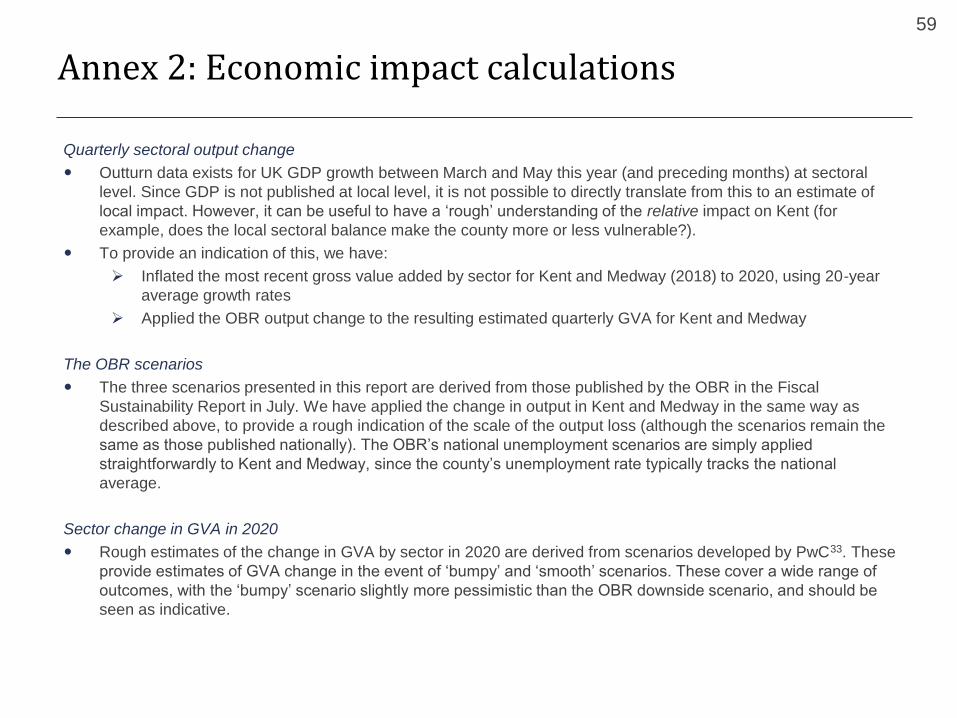
Annex 2: Economic impact calculations
59
Quarterly sectoral output change
Outturn data exists for UK GDP growth between March and May this year (and preceding months) at sectoral
level. Since GDP is not published at local level, it is not possible to directly translate from this to an estimate of
local impact. However, it can be useful to have a ‘rough’ understanding of the relative impact on Kent (for
example, does the local sectoral balance make the county more or less vulnerable?).
To provide an indication of this, we have:
➢ Inflated the most recent gross value added by sector for Kent and Medway (2018) to 2020, using 20-year
average growth rates
➢ Applied the OBR output change to the resulting estimated quarterly GVA for Kent and Medway
The OBR scenarios
The three scenarios presented in this report are derived from those published by the OBR in the Fiscal
Sustainability Report in July. We have applied the change in output in Kent and Medway in the same way as
described above, to provide a rough indication of the scale of the output loss (although the scenarios remain the
same as those published nationally). The OBR’s national unemployment scenarios are simply applied
straightforwardly to Kent and Medway, since the county’s unemployment rate typically tracks the national
average.
Sector change in GVA in 2020
Rough estimates of the change in GVA by sector in 2020 are derived from scenarios developed by PwC33. These
provide estimates of GVA change in the event of ‘bumpy’ and ‘smooth’ scenarios. These cover a wide range of
outcomes, with the ‘bumpy’ scenario slightly more pessimistic than the OBR downside scenario, and should be
seen as indicative.
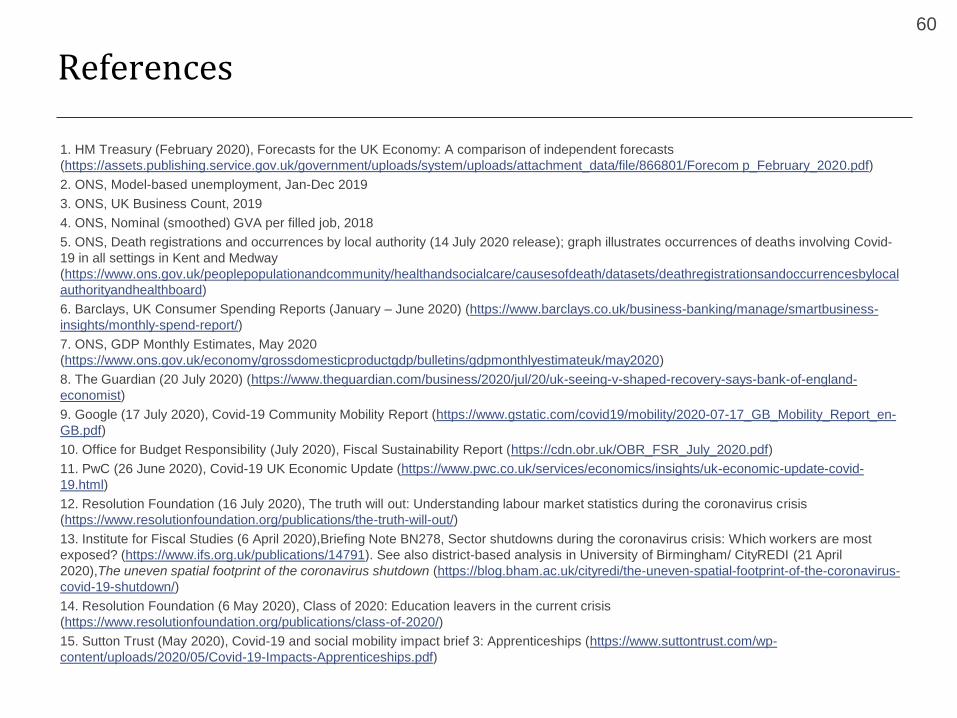
References
1. HM Treasury (February 2020), Forecasts for the UK Economy: A comparison of independent forecasts
(https://assets.publishing.service.gov.uk/government/uploads/system/uploads/attachment_data/file/866801/Forecom p_February_2020.pdf)
2. ONS, Model-based unemployment, Jan-Dec 2019
3. ONS, UK Business Count, 2019
4. ONS, Nominal (smoothed) GVA per filled job, 2018
5. ONS, Death registrations and occurrences by local authority (14 July 2020 release); graph illustrates occurrences of deaths involving Covid-
19 in all settings in Kent and Medway
(https://www.ons.gov.uk/peoplepopulationandcommunity/healthandsocialcare/causesofdeath/datasets/deathregistrationsandoccurrencesbylocal
authorityandhealthboard)
6. Barclays, UK Consumer Spending Reports (January – June 2020) (https://www.barclays.co.uk/business-banking/manage/smartbusiness-
insights/monthly-spend-report/)
7. ONS, GDP Monthly Estimates, May 2020
(https://www.ons.gov.uk/economy/grossdomesticproductgdp/bulletins/gdpmonthlyestimateuk/may2020)
8. The Guardian (20 July 2020) (https://www.theguardian.com/business/2020/jul/20/uk-seeing-v-shaped-recovery-says-bank-of-england-
economist)
9. Google (17 July 2020), Covid-19 Community Mobility Report (https://www.gstatic.com/covid19/mobility/2020-07-17_GB_Mobility_Report_en-
GB.pdf)
10. Office for Budget Responsibility (July 2020), Fiscal Sustainability Report (https://cdn.obr.uk/OBR_FSR_July_2020.pdf)
11. PwC (26 June 2020), Covid-19 UK Economic Update (https://www.pwc.co.uk/services/economics/insights/uk-economic-update-covid-
19.html)
12. Resolution Foundation (16 July 2020), The truth will out: Understanding labour market statistics during the coronavirus crisis
(https://www.resolutionfoundation.org/publications/the-truth-will-out/)
13. Institute for Fiscal Studies (6 April 2020),Briefing Note BN278, Sector shutdowns during the coronavirus crisis: Which workers are most
exposed? (https://www.ifs.org.uk/publications/14791). See also district-based analysis in University of Birmingham/ CityREDI (21 April
2020),The uneven spatial footprint of the coronavirus shutdown (https://blog.bham.ac.uk/cityredi/the-uneven-spatial-footprint-of-the-coronavirus-
covid-19-shutdown/)
14. Resolution Foundation (6 May 2020), Class of 2020: Education leavers in the current crisis
(https://www.resolutionfoundation.org/publications/class-of-2020/)
15. Sutton Trust (May 2020), Covid-19 and social mobility impact brief 3: Apprenticeships (https://www.suttontrust.com/wp-
content/uploads/2020/05/Covid-19-Impacts-Apprenticeships.pdf)
60
References
16. Kent Invicta Chamber of Commerce/ Kent and Medway Growth Hub, Covid-19 Business Support Helpline Report 13-17 July
17. Beauhurst (April 2020), Covid-19 Business Impact (https://about.beauhurst.com/research/covid19/)
18. National Farmers’ Union (28 April 2020), https://www.nfuonline.com/cross-sector/farm-business/economic-intelligence/economic-
intelligence-news/nfu-has-second-meeting-with-banks-on-support-for-t/
19. MAKE UK (20 July 2020), Manufacturing Monitor (https://www.makeuk.org/insights/publications/manufacturing-monitor)
20. Construction News (6 July 2020), Rising activity boosts sharp return to growth (https://www.constructionnews.co.uk/financial/rising-activity-
boosts-sharp-return-to-growth-06-07-2020/)
21. MAKE UK (20 July 2020), Manufacturing Monitor (https://www.makeuk.org/insights/publications/manufacturing-monitor)
22. Road Haulage Association (17 April 2020), Letter to the Prime Minister (https://www.rha.uk.net/getmedia/3058feb7-8936-4ef7-a6ab-
c5e26ea9d075/Joint-Industry-Letter-17-April.pdf.aspx)
23. Barclays, UK Consumer Spending Report (June 2020) (https://www.barclays.co.uk/business-banking/manage/smartbusiness-
insights/monthly-spend-report/)
24. Barclays, UK Consumer Spending Report (June 2020) (https://www.barclays.co.uk/business-banking/manage/smartbusiness-
insights/monthly-spend-report/)
25. CACI (6 March 2020), The consumer impact of coronavirus (https://www.caci.co.uk/blog/consumer-impact-coronavirus)
26. Information Age (30 March 2020), Covid-19 and digitalisation (https://www.information-age.com/covid-19-digitalisation-tech-boom-post-
pandemic-123488670/)
27. Beauhurst (April 2020), Covid-19 Business Impact (https://about.beauhurst.com/research/covid19/)
28. Creative Industries Federation (17 June 2020), The projected economic impact of Covid-19 on the UK creative industries
(https://www.creativeindustriesfederation.com/publications/report-projected-economic-impact-covid-19-uk-creative-industries)
29. OECD (17 April 2020), Coronavirus and the creative and cultural sectors (https://www.slideshare.net/OECDLEED/coronavirus-covid19-and-
cultural-and-creative-sectors-impact-policy-responses-and-opportunities-to-rebound-after-the-crisis)
30. NESTA (31 March 2020), The impact of Covid-19 on arts and cultural charities (https://www.nesta.org.uk/blog/impact-covid-19-arts-and-
cultural-charities/)
31. Design Week (23 July 2020), DCMS report: Covid is biggest threat to creative industries in a generation
(https://www.designweek.co.uk/issues/20-26-july-2020/dcms-report-covid-is-biggest-threat-to-creative-industries-in-a-generation/)
32. Deloitte (2020), Covid-19: Impact and recovery for the life sciences industry
(https://www2.deloitte.com/content/dam/Deloitte/ie/Documents/LifeSciences_Healthcare/IE_CF_COVID-
19%20%20Health%20and%20Life%20Sciences_0420_FV.pdf)
33. PwC (5 June 2020), Covid-19 UK Economic Update (https://www.pwc.co.uk/services/economics/insights/uk-economic-update-covid-
19.html)
61
DRAFT
This document is available in alternative formats and can be explained in a range of languages.
Please contact [email protected]
Kent and Medway Economic Partnership
www.kmep.org.uk | 03000 417106
For the latest economic data, including the Covid-19 Economic Dashboard, please visit the Kent
County Council Strategic Commissioning Analytics page at www.kent.gov.uk/research