Embed Size (px)
Citation preview
- 1 -
Economic Report
The Minimum Wage in
American Samoa
2005
U.S. Department of Labor Employment Standards Administration Wage and Hour Division March 2005
- 2 -
2
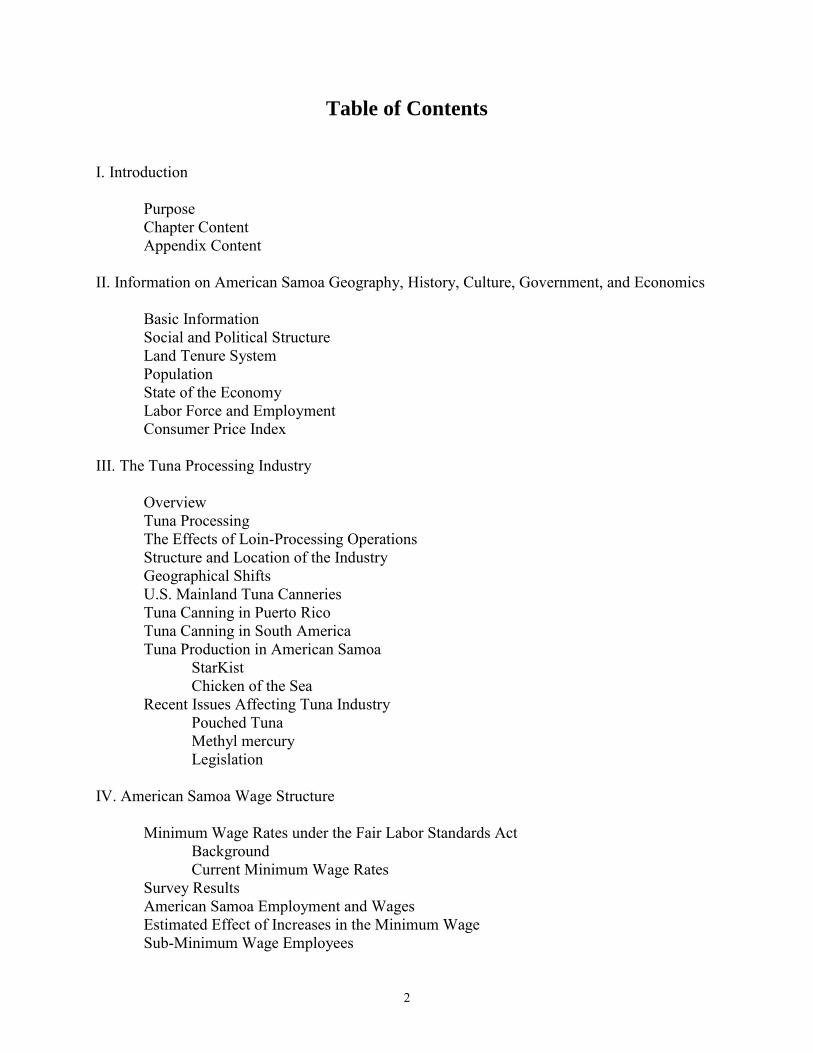
Table of Contents I. Introduction Purpose Chapter Content Appendix Content
II. Information on American Samoa Geography, History, Culture, Government, and Economics Basic Information Social and Political Structure Land Tenure System Population State of the Economy Labor Force and Employment Consumer Price Index III. The Tuna Processing Industry Overview Tuna Processing The Effects of Loin-Processing Operations Structure and Location of the Industry Geographical Shifts U.S. Mainland Tuna Canneries Tuna Canning in Puerto Rico Tuna Canning in South America Tuna Production in American Samoa StarKist Chicken of the Sea Recent Issues Affecting Tuna Industry Pouched Tuna Methyl mercury Legislation IV. American Samoa Wage Structure Minimum Wage Rates under the Fair Labor Standards Act Background Current Minimum Wage Rates Survey Results American Samoa Employment and Wages Estimated Effect of Increases in the Minimum Wage Sub-Minimum Wage Employees
3
Government Employees Industry Fish Canning and Processing Industry Petroleum Marketing Industry Shipping and Transportation Industry: Classification A Shipping and Transportation Industry: Classification B Shipping and Transportation Industry: Classification C Construction Industry Retailing, Wholesaling, and Warehousing Industry Printing Industry Publishing Industry Finance and Insurance Industry Ship Maintenance Industry Hotel Industry Tour and Travel Services Industry Private Hospitals and Educational Institutions Industry Miscellaneous Activities Industry Garment Manufacturing Industry Bottling, Brewing, and Dairy Products Industry V. The American Samoa Minimum Wage - FLSA Requirements A: Achieve Minimum Standard of Living, by Reaching the
Mainland Federal Minimum Wage, as Rapidly as is Economically Feasible
B: Do Not Raise Minimum Wages to a Level that Substantially Curtails Employment in the Industry
Measuring Ability to Pay Impact of Higher Productivity C: Set Minimums that Do Not Give a Competitive Advantage
Over Counterpart U.S. Industries Minimum Wages and Tuna Competition Total U.S. Supply Bank of Hawaii Economic Report VI. Economic Factors for Consideration that May Favor Minimum Wage Increases American Samoa Government Possible Balanced Budgets Government Policies Reducing Business Costs Tariff Savings Tax Treatment Low Ratio of Labor Cost to Product Cost Employment and Output Increasing Faster than Minimum Wage Limited Use of Frozen Loins in American Samoa Increases in Productivity
4
Thailand's Tuna Industry Measuring Productivity Improvements VII. Economic Factors for Consideration that May Weigh Against Minimum Wage Increases Slow U.S. Market Growth Foreign Competition Imports of Canned Tuna Dolphin-Safe Standard Andean Trade Preferences Act Tariff Rates Quota on Canned Tuna Relatively Ineffective European Tariffs Use of Frozen Loin Technology Economic Uncertainty Wage Increases Not Limited to Minimum Wage Workers High Failure Rate of Small Businesses Higher Wages than Competitors
Currency Devaluation Other Economic Disadvantages of the American Samoa Location
5
List of Figures and Tables Figure 1: Percent Employment by Wage Range, American Samoa Surveyed Establishments Figure 2: Percent Employment by Wage Range, Government Employees Industry Figure 3: Percent Employment by Wage Range, Fish Canning and Processing Industry Figure 4: Percent Employment by Wage Range, Petroleum Marketing Industry Figure 5: Percent Employment by Wage Range, Shipping and Transportation Industry:
Classification A Figure 6: Percent Employment by Wage Range, Shipping and Transportation Industry:
Classification B Figure 7: Percent Employment by Wage Range, Shipping and Transportation Industry:
Classification C Figure 8: Percent Employment by Wage Range, Construction Industry Figure 9: Percent Employment by Wage Range, Retailing, Wholesaling, and Warehousing
Industry Figure 10: Percent Employment by Wage Range, Printing Industry Figure 11: Percent Employment by Wage Range, Publishing Industry Figure 12: Percent Employment by Wage Range, Finance and Insurance Industry Figure 13: Percent Employment by Wage Range, Ship Maintenance Industry Figure 14: Percent Employment by Wage Range, Hotel Industry Figure 15: Percent Employment by Wage Range, Tour and Travel Services Industry Figure 16: Percent Employment by Wage Range, Private Hospitals and Educational Institutions
Industry Figure 17: Percent Employment by Wage Range, Miscellaneous Activities Industry Figure 18: United States Mainland and American Samoa Minimum Wage Rates, 1977 - 2004 American Samoa Minimum Wage Rates as Ratios of U.S. Mainland Minimum Wage Rates, 1977 – 2004
6
Figure 19: Selected American Samoa Industry Minimum Wage Rates as a Percentage of U.S. Mainland Minimum Wage, 1986 - 2004 Figure 20: Tuna Cannery Productivity for Selected Years, 1995 - 2003 Figure 21: Tuna Price Per Pound Tuna Price Indices Ratio of Exvessel Index to Retail Index Figure 22: Total U.S. Canned Tuna Supply Components, 1994 - 2003 Canned Tuna Imports as a Percent of Total U.S. Supply, 1994 - 2003 Figure 23: Labor Productivity, U.S. Retail Tuna Price and Cannery Wage Indexes 1995-2003 Table II A: American Samoa Population, 1990-2000 Table II B: American Samoa Labor Force, Employment, and Unemployment, 1995-2000 Table II C: American Samoa Consumer Price Index Table IV A: Minimum Wage Rates by Year and Percent Change, 2000 - 2004 Table IV B: Number of Establishments, Covered Workers, and Wages by Industry
Classification, November 2004 Survey Results Table V: Employment and Minimum Wage in Tuna Processing for Selected Locations and Years Table VI A: Production Worker Wages as a Percent of Labor and Materials Costs, Seafood
Canning (NAICS Code 311711) Table VI B: Index of Output per Worker Table VII A: Market Value of Imported Canned Tuna Versus U.S. Produced Tuna, Value per
Pound of Canned Tuna Table VII B: Amount of Imports to U.S., Quota and Over Quota, Canned Tuna
7
Appendices A. Covered Employees in Private Sector B. Minimum Wage Impact Tables C. Tables for Chapter V Figures D. Detailed Minimum Wage Impact Tables E. Recommendations of Industry Committees Numbers 18 - 25, for Wage Minimums, 1987 -
2003
8
I. Introduction Purpose This Economic Report was prepared for the use of American Samoa Industry Committee No. 26, to provide objective economic data useful to the Committee in its task of determining minimum wages in American Samoa. A new Committee is appointed by the Secretary to recommend these minimums every two years, and the recommendations are binding. Industry Committees were used in the U.S. mainland after enactment of the 1938 Fair Labor Standards Act (FLSA) to phase low-wage industries into the minimum statutory wage. But after World War II, only Puerto Rico, the U.S. Virgin Islands, and American Samoa still used the committee system to set separate industry wage minimums. Today, such a system of wage setting is restricted to American Samoa. Congress believed that application to these territorial island industries of "the inflexible [i.e., high] minimum wage rates prescribed by the Act will cause serious dislocation in some insular industries and curtail employment opportunities." On the other hand, Congress wanted industries in these areas to move toward the mainland minimum wage to avoid putting U.S. employers at a competitive disadvantage and to discourage migration of business from the United States. To assist the Industry Committee in balancing these goals and in determining different wage minimums for different industries based on their unique characteristics, the Wage and Hour Division (WHD) of the U.S. Department of Labor prepares this Economic Report and sends it to Committee members prior to the biennial public hearing held by each successive industrial committee. The report includes pertinent data for use by the Committee in deciding the extent to which each industry's minimum wage could be raised. Federal regulations state that a wide spectrum of data and analyses in the report may be pertinent to determining wage minimums, including wages, hours, productivity, market conditions, comparative production costs of foreign competitors, profits and losses, and other data, including those bearing on proper industry classification (See 29 CFR 511.11). Chapter Content Chapter II of this report contains background material on American Samoa’s geography, history, culture, government, and economics. Chapter III describes the development, production methods and recent economic developments of the tuna processing industry, by far the largest private sector employer in American Samoa. Chapter IV of this report analyzes the current wage and employment structure for American Samoa employers covered by the FLSA, and for each industry, by wage intervals. This analysis is based on the results of a biennial employment and wage survey conducted for WHD in
9
November 2004. It also provides estimates of the impact of increases in wage minimums on workers’ earnings. Chapter V describes the three policy goals and requirements of the Fair Labor Standards Act, with respect to American Samoa. These include: 1) meeting minimum living standards by gradually reaching the Federal minimum wage, now at $5.15 per hour, 2) avoiding use of low wages to gain competitive advantage over other U.S. producers, and 3) not substantially curtailing employment in American Samoa industries.1 This chapter provides data to facilitate evaluations of the extent to which those goals and requirements have been met in recent years. A number of bar charts and graphs are included in the chapter text. Chapter VI discusses factors to be considered that may favor minimum wage increases, such as low labor costs for the tuna industry as a percent of total costs. Other factors include generous tax and tariff exemptions, which would be lost by relocation to another country, and steady increases in productivity, output, and employment in the American Samoa tuna industry. Chapter VII provides factors to be considered that may weigh against minimum wage increases, with an emphasis on the tuna processing industry. Such factors include competition with Thailand and other exporters, which have the advantage of low labor costs, and weaker safety and environmental laws. Other factors include weak U.S. market growth, low retail canned tuna prices, relatively ineffective tariffs, and general economic uncertainty. Freer trade via the General Agreement on Tariff and Trade (GATT) and the North American Free Trade Agreement (NAFTA) may also lessen such competitors’ tariff barriers to the U.S. Appendix Content Appendix A contains data on the number of covered employees in the American Samoa private sector based on survey data. Appendix B contains minimum wage impact tables for American Samoa by industry classification. These impact tables illustrate alternative minimum wage levels in increments of five percent. It also presents current average hourly wages and average hourly wages for different alternate minimums. Appendix C contains data on which the figures and graphs in Chapter V are based. Appendix D provides a more detailed impact of alternate increased minimums by industry than that provided in Appendix B. It provides wage data from lowest to highest paid employees, by incremental hourly wage intervals, and the increase in their hourly income under the current minimum and three alternate minimums. Appendix E provides the minimum wage rates by industry recommended by recent Industry Committees. 1 See Fair Labor Standards Act, Sections 2, 6, and 8 (29 U.S.C. Sections 202, 206 and 208). Section 8c specifies the criteria for establishment of industry classifications, including competitive conditions, wages for comparable work established by collective bargaining agreements, or voluntary employer wage standards.
10
II. Information on American Samoa Geography, History,
Culture, Government, and Economics Basic Information
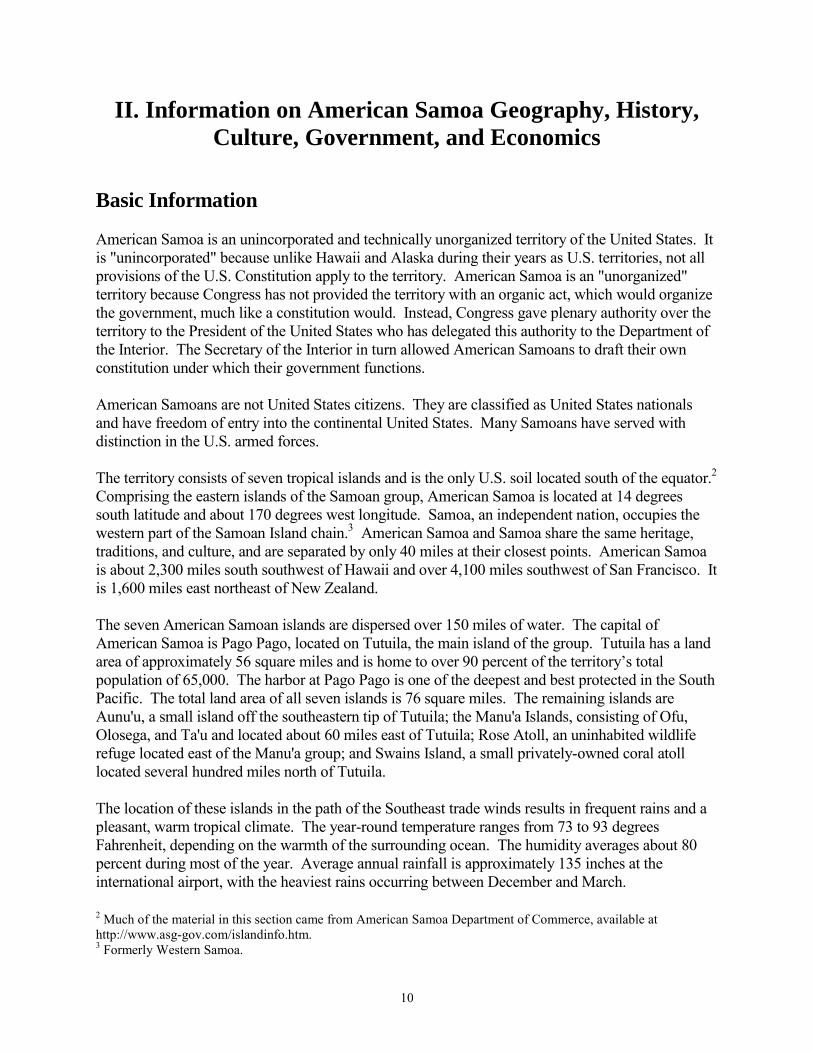
American Samoa is an unincorporated and technically unorganized territory of the United States. It is "unincorporated" because unlike Hawaii and Alaska during their years as U.S. territories, not all provisions of the U.S. Constitution apply to the territory. American Samoa is an "unorganized" territory because Congress has not provided the territory with an organic act, which would organize the government, much like a constitution would. Instead, Congress gave plenary authority over the territory to the President of the United States who has delegated this authority to the Department of the Interior. The Secretary of the Interior in turn allowed American Samoans to draft their own constitution under which their government functions. American Samoans are not United States citizens. They are classified as United States nationals and have freedom of entry into the continental United States. Many Samoans have served with distinction in the U.S. armed forces. The territory consists of seven tropical islands and is the only U.S. soil located south of the equator.2 Comprising the eastern islands of the Samoan group, American Samoa is located at 14 degrees south latitude and about 170 degrees west longitude. Samoa, an independent nation, occupies the western part of the Samoan Island chain.3 American Samoa and Samoa share the same heritage, traditions, and culture, and are separated by only 40 miles at their closest points. American Samoa is about 2,300 miles south southwest of Hawaii and over 4,100 miles southwest of San Francisco. It is 1,600 miles east northeast of New Zealand.
The seven American Samoan islands are dispersed over 150 miles of water. The capital of American Samoa is Pago Pago, located on Tutuila, the main island of the group. Tutuila has a land area of approximately 56 square miles and is home to over 90 percent of the territory’s total population of 65,000. The harbor at Pago Pago is one of the deepest and best protected in the South Pacific. The total land area of all seven islands is 76 square miles. The remaining islands are Aunu'u, a small island off the southeastern tip of Tutuila; the Manu'a Islands, consisting of Ofu, Olosega, and Ta'u and located about 60 miles east of Tutuila; Rose Atoll, an uninhabited wildlife refuge located east of the Manu'a group; and Swains Island, a small privately-owned coral atoll located several hundred miles north of Tutuila.
The location of these islands in the path of the Southeast trade winds results in frequent rains and a pleasant, warm tropical climate. The year-round temperature ranges from 73 to 93 degrees Fahrenheit, depending on the warmth of the surrounding ocean. The humidity averages about 80 percent during most of the year. Average annual rainfall is approximately 135 inches at the international airport, with the heaviest rains occurring between December and March. 2 Much of the material in this section came from American Samoa Department of Commerce, available at http://www.asg-gov.com/islandinfo.htm. 3 Formerly Western Samoa.
11
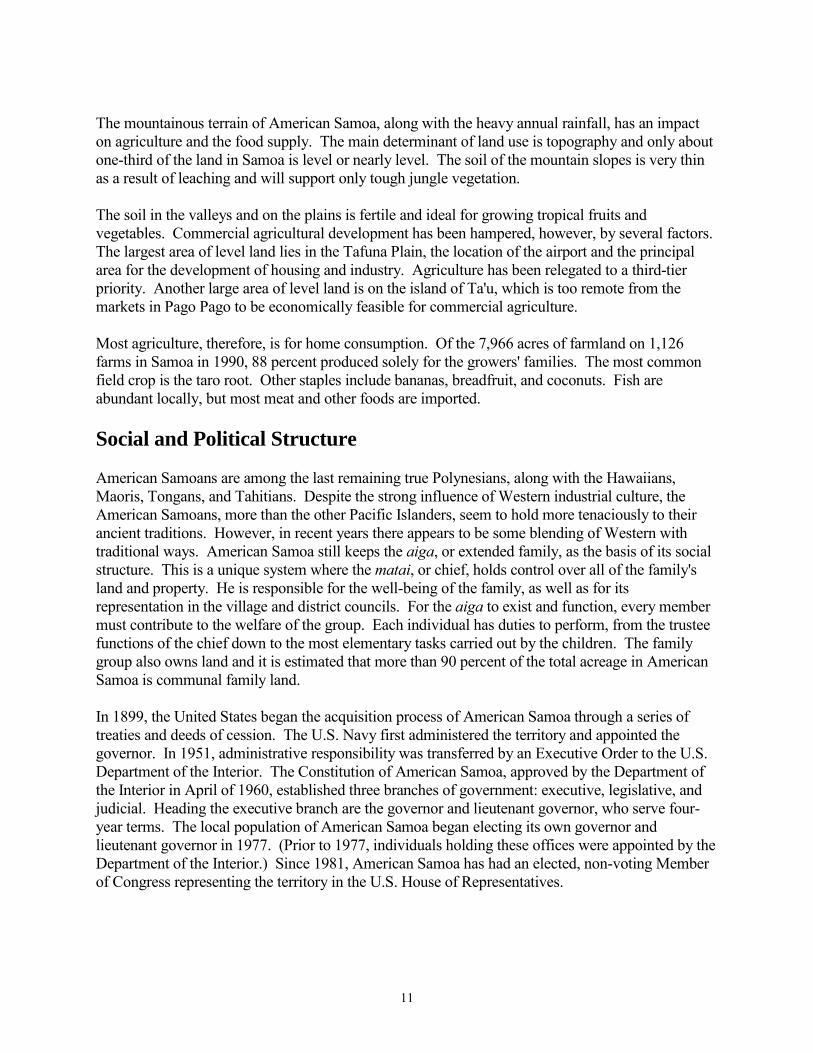
The mountainous terrain of American Samoa, along with the heavy annual rainfall, has an impact on agriculture and the food supply. The main determinant of land use is topography and only about one-third of the land in Samoa is level or nearly level. The soil of the mountain slopes is very thin as a result of leaching and will support only tough jungle vegetation. The soil in the valleys and on the plains is fertile and ideal for growing tropical fruits and vegetables. Commercial agricultural development has been hampered, however, by several factors. The largest area of level land lies in the Tafuna Plain, the location of the airport and the principal area for the development of housing and industry. Agriculture has been relegated to a third-tier priority. Another large area of level land is on the island of Ta'u, which is too remote from the markets in Pago Pago to be economically feasible for commercial agriculture. Most agriculture, therefore, is for home consumption. Of the 7,966 acres of farmland on 1,126 farms in Samoa in 1990, 88 percent produced solely for the growers' families. The most common field crop is the taro root. Other staples include bananas, breadfruit, and coconuts. Fish are abundant locally, but most meat and other foods are imported. Social and Political Structure American Samoans are among the last remaining true Polynesians, along with the Hawaiians, Maoris, Tongans, and Tahitians. Despite the strong influence of Western industrial culture, the American Samoans, more than the other Pacific Islanders, seem to hold more tenaciously to their ancient traditions. However, in recent years there appears to be some blending of Western with traditional ways. American Samoa still keeps the aiga, or extended family, as the basis of its social structure. This is a unique system where the matai, or chief, holds control over all of the family's land and property. He is responsible for the well-being of the family, as well as for its representation in the village and district councils. For the aiga to exist and function, every member must contribute to the welfare of the group. Each individual has duties to perform, from the trustee functions of the chief down to the most elementary tasks carried out by the children. The family group also owns land and it is estimated that more than 90 percent of the total acreage in American Samoa is communal family land. In 1899, the United States began the acquisition process of American Samoa through a series of treaties and deeds of cession. The U.S. Navy first administered the territory and appointed the governor. In 1951, administrative responsibility was transferred by an Executive Order to the U.S. Department of the Interior. The Constitution of American Samoa, approved by the Department of the Interior in April of 1960, established three branches of government: executive, legislative, and judicial. Heading the executive branch are the governor and lieutenant governor, who serve four-year terms. The local population of American Samoa began electing its own governor and lieutenant governor in 1977. (Prior to 1977, individuals holding these offices were appointed by the Department of the Interior.) Since 1981, American Samoa has had an elected, non-voting Member of Congress representing the territory in the U.S. House of Representatives.
12
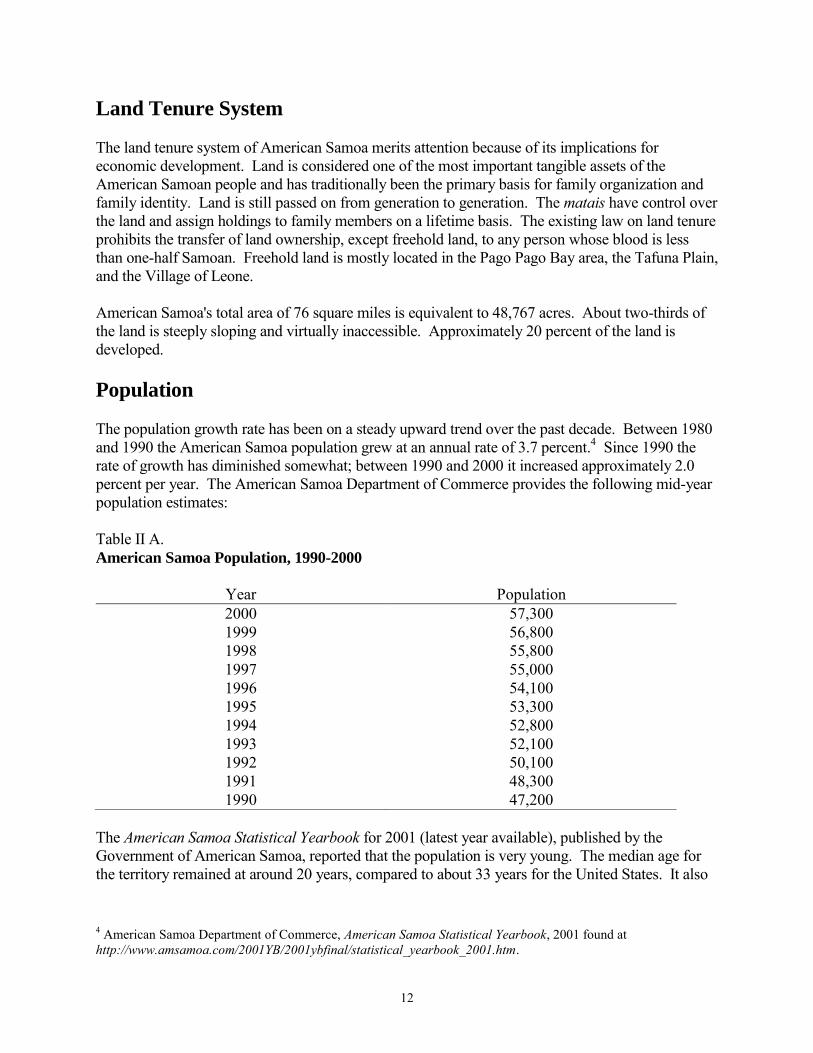
Land Tenure System The land tenure system of American Samoa merits attention because of its implications for economic development. Land is considered one of the most important tangible assets of the American Samoan people and has traditionally been the primary basis for family organization and family identity. Land is still passed on from generation to generation. The matais have control over the land and assign holdings to family members on a lifetime basis. The existing law on land tenure prohibits the transfer of land ownership, except freehold land, to any person whose blood is less than one-half Samoan. Freehold land is mostly located in the Pago Pago Bay area, the Tafuna Plain, and the Village of Leone. American Samoa's total area of 76 square miles is equivalent to 48,767 acres. About two-thirds of the land is steeply sloping and virtually inaccessible. Approximately 20 percent of the land is developed. Population The population growth rate has been on a steady upward trend over the past decade. Between 1980 and 1990 the American Samoa population grew at an annual rate of 3.7 percent.4 Since 1990 the rate of growth has diminished somewhat; between 1990 and 2000 it increased approximately 2.0 percent per year. The American Samoa Department of Commerce provides the following mid-year population estimates: Table II A. American Samoa Population, 1990-2000
Year Population 2000 57,300 1999 56,800 1998 55,800 1997 55,000 1996 54,100 1995 53,300 1994 52,800 1993 52,100 1992 50,100 1991 48,300 1990 47,200
The American Samoa Statistical Yearbook for 2001 (latest year available), published by the Government of American Samoa, reported that the population is very young. The median age for the territory remained at around 20 years, compared to about 33 years for the United States. It also
4 American Samoa Department of Commerce, American Samoa Statistical Yearbook, 2001 found at http://www.amsamoa.com/2001YB/2001ybfinal/statistical_yearbook_2001.htm.
13
reported that unlike most large developed countries where females outnumber males, American Samoa had a gender ratio of about 104 males for every 100 females. State of the Economy The primary economy of American Samoa consists of government activities (about one-third of total employment) and the two tuna canneries (one-third of total employment). The remaining one-third of employed workers is in the secondary economy, which consists mainly of retail and service enterprises. Many firms in the secondary economy provide goods and services to the canneries. The tuna canning industry in American Samoa provided direct employment for over 4,700 workers in 2004. 5 During calendar year 2003, the tuna canneries combined exported approximately $470 million of tuna to the United States.6 As the principle manufacturing activity in the territory, tuna processing directly or indirectly supports much of the remaining economy. Labor Force and Employment
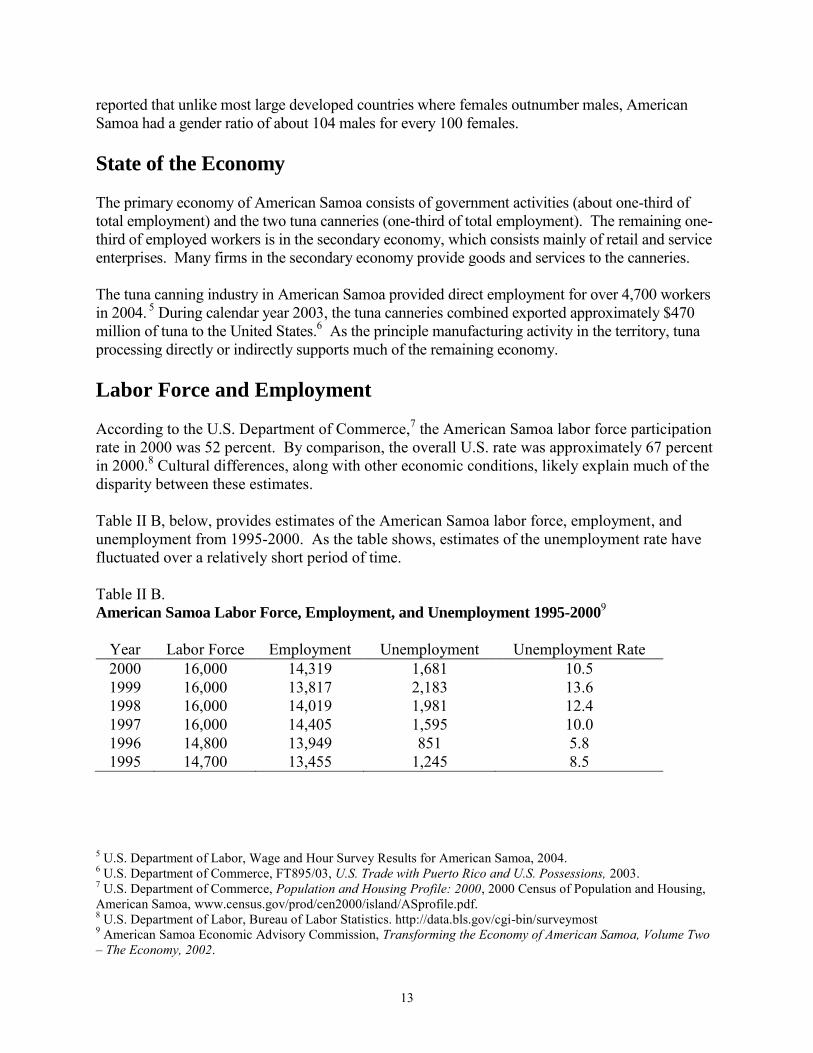
According to the U.S. Department of Commerce,7 the American Samoa labor force participation rate in 2000 was 52 percent. By comparison, the overall U.S. rate was approximately 67 percent in 2000.8 Cultural differences, along with other economic conditions, likely explain much of the disparity between these estimates. Table II B, below, provides estimates of the American Samoa labor force, employment, and unemployment from 1995-2000. As the table shows, estimates of the unemployment rate have fluctuated over a relatively short period of time.
Table II B. American Samoa Labor Force, Employment, and Unemployment 1995-2000
9
Year Labor Force Employment Unemployment Unemployment Rate 2000 16,000 14,319 1,681 10.5 1999 16,000 13,817 2,183 13.6 1998 16,000 14,019 1,981 12.4 1997 16,000 14,405 1,595 10.0 1996 14,800 13,949 851 5.8 1995 14,700 13,455 1,245 8.5
5 U.S. Department of Labor, Wage and Hour Survey Results for American Samoa, 2004. 6 U.S. Department of Commerce, FT895/03, U.S. Trade with Puerto Rico and U.S. Possessions, 2003. 7 U.S. Department of Commerce, Population and Housing Profile: 2000, 2000 Census of Population and Housing, American Samoa, www.census.gov/prod/cen2000/island/ASprofile.pdf. 8 U.S. Department of Labor, Bureau of Labor Statistics. http://data.bls.gov/cgi-bin/surveymost 9 American Samoa Economic Advisory Commission, Transforming the Economy of American Samoa, Volume Two – The Economy, 2002.
14
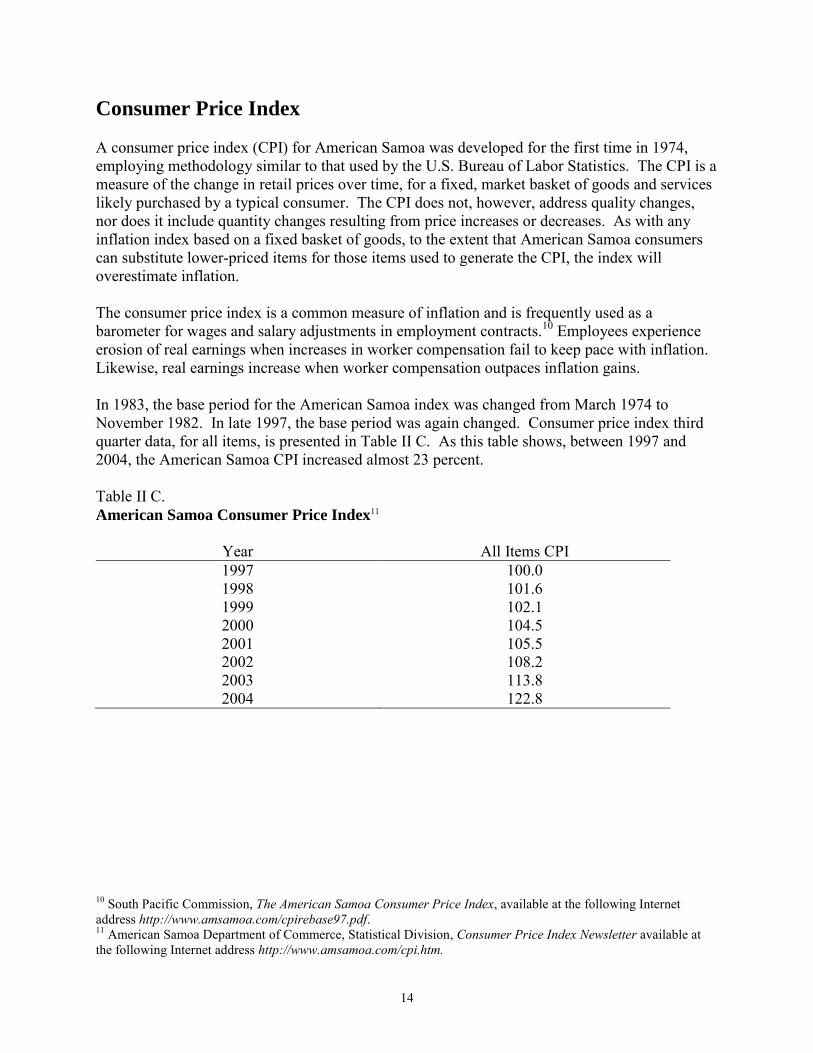
Consumer Price Index A consumer price index (CPI) for American Samoa was developed for the first time in 1974, employing methodology similar to that used by the U.S. Bureau of Labor Statistics. The CPI is a measure of the change in retail prices over time, for a fixed, market basket of goods and services likely purchased by a typical consumer. The CPI does not, however, address quality changes, nor does it include quantity changes resulting from price increases or decreases. As with any inflation index based on a fixed basket of goods, to the extent that American Samoa consumers can substitute lower-priced items for those items used to generate the CPI, the index will overestimate inflation. The consumer price index is a common measure of inflation and is frequently used as a barometer for wages and salary adjustments in employment contracts.10 Employees experience erosion of real earnings when increases in worker compensation fail to keep pace with inflation. Likewise, real earnings increase when worker compensation outpaces inflation gains. In 1983, the base period for the American Samoa index was changed from March 1974 to November 1982. In late 1997, the base period was again changed. Consumer price index third quarter data, for all items, is presented in Table II C. As this table shows, between 1997 and 2004, the American Samoa CPI increased almost 23 percent. Table II C. American Samoa Consumer Price Index11
Year All Items CPI 1997 100.0 1998 101.6 1999 102.1 2000 104.5 2001 105.5 2002 108.2 2003 113.8 2004 122.8
10 South Pacific Commission, The American Samoa Consumer Price Index, available at the following Internet address http://www.amsamoa.com/cpirebase97.pdf. 11 American Samoa Department of Commerce, Statistical Division, Consumer Price Index Newsletter available at the following Internet address http://www.amsamoa.com/cpi.htm.
15
III. The Tuna Processing Industry Overview Canned tuna processing is by far the largest private-sector employer in American Samoa. Many of the other private-sector jobs provide goods or services to the tuna processors. Moreover, the economic growth of many other private-sector employers in the consumer retail and service sectors is tied to tuna industry expenditures. Specifically, they are dependent upon the level of disposable income of tuna industry workers, which in turn mainly depends on wages and salaries. This is true, even though the majority of these workers are not American Samoa citizens, and a portion of their income is spent off island.12 For this reason, much of the analysis and data in this report will focus on this industry. Three major brands dominate the U.S. tuna market, StarKist, Chicken of the Sea, and Bumble Bee. StarKist and Chicken of the Sea have major processing plants on American Samoa. Bumble Bee operates a small plant in Puerto Rico and another in southern California. In 2001, the United States was the leader in the canned tuna market, with consumption estimated at about 46 million cases, or 28 percent of the global consumption of approximately 165 million cases.13 StarKist Seafood is the U.S. retail category leader with a 44 percent market share, larger than Bumble Bee (24 percent) and Chicken of the Sea (17 percent) combined.14 Other brands and private labels comprise the remaining 17 percent market share. These are mainly imported; as of 2003 approximately 46 percent of U.S. canned imports were from Thailand, 21 percent from Ecuador, 19 percent from the Philippines, and 9 percent from Indonesia, respectively. Total imports of canned, fresh and frozen tuna increased in 2003 by a combined 184.9 million pounds to a total of 920.7 million pounds.15 Within the canned tuna category there are two primary subsets: lightmeat tuna, consisting primarily of the species skipjack and yellowfin; and whitemeat tuna, consisting of albacore. According to Christopher D. Lischewski, President and CEO of Bumble Bee, StarKist has a commanding position in the total tuna market. He further notes that Starkist has the lead in lightmeat tuna, which represents 71 percent of canned tuna consumption.16 It leads the market with a 47 percent market share, followed by Bumble Bee and Chicken of the Sea, both with 17 percent shares. Bumble Bee is the market leader in albacore tuna, with a 40 percent market share, followed by Star-Kist (34 percent) and Chicken of the Sea (16 percent). About one-quarter of canned tuna consumption is for foodservice establishments, rather than direct retail sales to consumers. Private labels, dominated by importers, have a much higher share of this market, estimated at about 50 percent by Mr. Lischewski. In retail markets, 12 Many of these workers are from Samoa and Tonga. 13 http://foodmarketexchange.com. 14 U.S. International Trade Commission, Fact Sheet: Update on the Likely Impact of U.S. Tariff Modification for Tuna Imported From ATPA Beneficiaries, 2002. 15 U.S. Department of Commerce, Fisheries of the United States, 2003, NOAA. 16 Mr. Lischewski spoke in May, 2000 at the Tuna 2000 Bangkok: Papers of the 6th World Tuna Trade Conference.
16
consumers are conscious of reputation and quality; thus brand recognition is very important.17 For institutional trade, price becomes relatively more important as a selection factor. As a result, U.S. suppliers have a competitive advantage over foreign producers in retail tuna markets.18
Tuna Processing Most tuna canneries are located adjacent to a dock so the fish can be easily unloaded from the fishing vessels. The thawing, butchering, and cold storage facilities are located nearest to the unloading area. When the fish are unloaded they are thawed in running water in thawing tanks or in the air with sprays of water. When the tuna are thawed they are ready for the butchering process. The tuna are eviscerated by hand and loaded onto trays according to size. The trays are stacked on wheeled shelf racks and taken to the pre-cooker, or first cooker. Careful sorting of the fish by size helps to ensure minimum losses during the pre-cooking. During pre-cooking and cooling up to 30 percent weight loss occurs, much of it by overcooking. Placing fish of only one size in a given cooker and varying the cooking time in proportion to the size of the fish minimizes the loss. The first cooking lasts from 45 minutes to three hours, depending upon the size and type of tuna.19 After pre-cooking and cooling, the tuna are put on conveyor belts that carry the fish to the cleaning, or fillet tables. In most canneries the cleaning, packing, and seaming equipment are located in working space directly behind the thawing and butchering areas. The cleaners remove the skin from the fish and separate the loins from the skeleton. The white or light meat for human consumption is separated from the red meat that is used for pet food. Other by-products are fishmeal, which is made from the skin, bones, and viscera, and fertilizer, which is made from the juices and used water. The next step in the production process is the packing operation. A highly automated canning process is utilized to hermetically seal the tuna meat in tin cans. The tuna meat is packed in water or in oil, with or without salt. After the tuna is sealed, the cans are put through a second cooking called retort cooking for two to four hours. This process sterilizes the tuna meat. After the retort cooking, the cans are cooled, labeled, and packed into cardboard cases. The cases of canned tuna are either stored or moved into the distribution system. The Effects of Loin-Processing Operations The use of pre-cooked tuna loins as a raw material in canning operations is a relatively new development that could have a significant impact on the structure and location of the industry. Because the conversion of raw fish to loins is labor intensive, it may also have an influence on the cost and the amount of labor needed in the production process for U.S. canneries. Tuna loins are the light, meaty, edible part of the fish. Thawing, cooking, butchering, and cleaning frozen or fresh whole tuna produce them. The operations required for producing loins and canned 17 Del Monte Annual Report 2004. 18 U.S. International Trade Commission, Industry and Trade Summary: Canned Fish except Shellfish, Publication 3083, January 1998. 19 U.S. Department of Labor, Various Industries in American Samoa, Wage and Hour Division, various years.
17
tuna are essentially the same up to the point where the tuna loin is rendered. In a plant solely producing loins, the loin is packaged in plastic and frozen. It is then either shipped to a cannery as a raw material input or sold for other commercial purposes. In a tuna cannery, the loin is packed directly into the can. The production of the loins, which includes the butchering and cleaning steps, accounts for up to 80 percent of the cost of labor in a full-scale tuna cannery. In its raw material procurement, if a tuna cannery contracted for frozen tuna loins instead of frozen whole fish, substantial labor cost savings would be realized. Some use of tuna loins by U.S. processors began as early as the 1960s, but their utilization on a large commercial scale has only occurred in recent years. The canneries in Puerto Rico increasingly used loins in their processing operations as part of a raw material mix with raw whole tuna. This was necessitated in part because of a reduction in raw tuna supplies from the eastern Pacific Ocean because of the dolphin-safe policy. In 1990, Bumble Bee opened a cannery in California that exclusively processes loins. Today, all U.S. tuna canneries utilize precooked loins in their processing operation. Both Chicken of the Sea and StarKist rely on tuna loins (generally less than 30 percent of the product mix) when whole fish supplies are in short supply.20 However, virtually all the tuna utilized by Bumble Bee canneries in California and Puerto are in the form of precooked loins. These loins are imported and the tuna converted into cans or pouches in the U.S. In addition to the labor saving realized through their importation, tuna loins enter the U.S. at tariff rates substantially below those imposed on tuna in airtight containers. Structure and Location of the Industry In 1903 the canning of tuna fish began in the United States when the canning of albacore was undertaken in Southern California. Canning operations were begun in Hawaii in 1917 and in 1937 tuna canning had spread to the Atlantic Coast and to the Pacific Northwest. Southern California continued to be the traditional home base of the processor because the tuna fleet located there to maintain access to a major tuna fishery--the eastern Tropical Pacific Ocean. Because of its proximity to the fishing areas of the South Atlantic and the availability of a large pool of low-cost labor, Puerto Rico became a desirable location for canning facilities in the 1960s. With the increasing importance of the western Pacific fishery and the presence of low statutory wage rates, the same advantageous conditions applied to American Samoa. South America has become an opportunistic location for canneries and process facilities. With low wage rates and legislation which may lead to the relax of tariffs on the South American imports of tuna, countries such as Ecuador have the potential to claim a greater stake of the U.S. import market.
20 http://www.house.gov/apps/list/press/as00_faleomavaega/2senatorssupporteniscool.html.
18
Geographical Shifts The increased canning capacity in the offshore territories coincided with the steadily increasing share of the market by imports from low-wage Asian countries in Southeast Asia. The fact that tuna do not run with dolphins in the western Pacific Ocean also contributed to the shrinkage of the industry located in the continental United States, Hawaii, and Puerto Rico. This was due to Federal restrictions on catching dolphin and tuna together. In 1977, the closing of a cannery in Maryland marked the end of tuna canning on the Atlantic Coast, and in 1979 the last commercial tuna cannery in the Pacific Northwest was closed in Astoria, Oregon. The one cannery located in Hawaii ceased operations in 1985. In 1984, in response to high costs and competition from low-priced tuna imports, StarKist closed its last mainland canning facility on Terminal Island.21 The last remaining mainland plant is operating in Santa Fe Springs, California. Between 1990 and 2001, four plants located in Puerto Rico closed, leaving only one plant (in Mayaguez) operating on the island. U.S. Mainland Tuna Canneries At the present time, there is only one cannery operating on the U.S. mainland. (Bumble Bee operates a loin-processing plant located near Los Angeles.) This plant processes frozen tuna loins, produced elsewhere from raw whole tuna. In May 2003, Omaha-based ConAgra, a U.S. firm, sold Bumble Bee Seafood, Inc. to Centre Partners and the Bumble Bee senior management team. The Chicken of the Sea cannery in San Pedro, California, (CalPac) the last full-scale cannery on the mainland, closed in 2001.22
Tuna Canning in Puerto Rico Between 1990 and 2001 all of the tuna canneries operating in Puerto Rico closed, except for one plant operated by Bumble Bee. Among the factors affecting these plant closings are the following:
1. Shift from eastern to western Pacific Ocean. Public concern and legislative activity over the killing of dolphins that swim over schools of yellowfin tuna caused fishermen to move from the eastern to the western Pacific, where tuna generally do not run with dolphin. Since Puerto Rican canneries received much of their raw fish from the eastern Tropical Pacific, this fishery shift put them at an increasing disadvantage in access to inputs for production.
2. Environmental laws. Compliance with laws and regulations governing waste
disposal at the tuna canneries has become increasingly difficult and expensive. In addition to the Federal Environmental Protection Agency (EPA), Puerto Rico's Environmental Quality Board (EQB) enforces environmental standards in the tuna canning industry.
21 Achim Korber, Why Everybody Loves Flipper: The Political-Economy of the U.S. Dolphin-Safe Laws, European Journal of Political Economy, 1998. 22 Crow’s Nest, August, 2001.
19
3. Lower wage costs in American Samoa and other countries. On April 1, 1991,
the Federal minimum wage increased from $3.80 to $4.25 an hour. While some lower-wage industries in Puerto Rico were granted a gradual phase-in to this higher minimum, the tuna canning industry was not. Meanwhile, Thailand and other countries with low-wage labor were exporting lower-priced canned tuna to the U.S. (By 1997 cannery workers in Puerto Rico had to be paid at least the Federal minimum wage of $5.15 per hour.)
Tuna Canning in South America In 2003, the South American countries of Columbia and Ecuador had the capacity to process 2,250 tons of tuna per day. This corresponds to approximately 48.6 million cases of tuna, which is more than the 48 million cases of tuna consumed on average by the U.S. per year.23 Since the tuna workers in these countries are employed at a wage rate much lower than U.S. counterparts, they produce units of tuna much cheaper than U.S. processors. However, under current U.S. legislation, Andean countries are subjected to the tariffs on canned tuna imports to the U.S. which make them not as cost effective as U.S. tuna processors. Ecuador only accounts for 21 percent of all tuna imports into the U.S., third to Thailand and Philippines. Ecuador adheres to the Andean Trade Preference Act, which is constructed to give certain South American countries gradual exemption from import tariffs on a number of commodities, including canned tuna. Presently, Ecuador pays tariffs on canned tuna but pays no tariffs on pouched tuna.
Tuna Production in American Samoa
Two establishments in American Samoa, StarKist Samoa (a subsidiary of StarKist Seafood, owned by Del Monte) and Chicken of the Sea (owned completely by Thai Union Frozen Products of Bangkok) are engaged in the processing and canning of tuna fish. These two canneries employed approximately 4,700 workers covered by the Fair Labor Standards Act during the years 1991-93, rising to 4,400 by 1996, 5,150 by November 2000 and 5,016 in November of 2002. In the fall of 2004, the average straight-time hourly wage for the 4,738 covered employees in this industry was $3.60.24 StarKist The StarKist Samoa cannery is the largest tuna cannery in the world. It produces more than 60 percent of American Samoa's canned tuna. StarKist is the leading brand of canned tuna sold in the U.S., followed by Bumble Bee and Chicken of the Sea. StarKist's market share in the U.S. increased from below 30 percent in the late 1980's to 45 percent in 2000. It expects to expand that market share with new tuna varieties and by improving the taste, texture and packaging of its premium, solid white albacore.
23 Pacific Magazine, May, 2003. 24 U.S. Department of Labor survey data.
20
StarKist and its affiliates, have tuna processing plants in Ecuador, American Samoa, Seychelles, France, Portugal, and Ghana.25 Industry reports have noted that StarKist also entered the European market with acquisitions of distributors in the United Kingdom, France and Italy.26 Sales from StarKist canneries in Ghana, Seychelles, and Ecuador to the European Union, which enter duty free, are reported to have expanded sharply in recent years. In 2002 H.J. Heinz Company exchanged several of its retail brands (including StarKist) for majority interest in the new Del Monte Company.27 Like StarKist, Del Monte first began operations in California in the early 1900s. Based in San Francisco, Del Monte has operating facilities in American Samoa, Ecuador, and Venezuela, and recently achieved more than $3 billion in sales.28 In their 2004 annual report, Del Monte highlighted the success that the StarKist brand has contributed to the company success as well as to potential problems. Since 2000, the StarKist brand has begun to shift some of its products toward value-added products such as the Lunch-To-Go packs and Tuna Creations. These products provide the consumer with more than tuna in a can, for example, the Lunch-To-Go offers ingredients to make tuna salad accompanied with crackers. In 2004 StarKist had the highest market share of pouched tuna. Other major events that have impacted Del Monte include filing of lawsuits against the company regarding the levels of methyl mercury present in StarKist tuna products and liability of Del Monte. One of the lawsuits filed in California was against the major 3 tuna processors in violation of Proposition 65, a law requiring businesses to provide warnings of carcinogens present in consumer products.29 Chicken of the Sea The other cannery in American Samoa, producing almost 40 percent of the tuna pack there, is Chicken of the Sea. After the previous owner, Van Kamp, declared bankruptcy, it came under new ownership, Tri-Union Seafood LLC, based in San Diego. In 2000, two of the owners of Tri-union sold their shares to Thai Union International30. This company is owned by Thai Union Frozen Foods of Bangkok. Thai Union is the largest tuna canner and exporter in Thailand,31 and the second largest in the world. Thai Union was created in Thailand in 1977 to produce canned tuna for export. It is now the largest canner in Asia, exporting to Japan, U.S., Europe, Hong Kong, Malaysia, Singapore and the Middle East. According to the Crow's Nest on-line news service,
"Thailand's aggressive marketing efforts, low labor costs and weak currency against the U.S. dollar makes it the largest canned tuna exporting country in the world."
25 Testimony of K. Ward Rodgers, Heinz representative, before U.S. Senate Committee on Finance, August, 2001. 26 The source of statements about recent trends is Globefish, a news report on the fish and seafood industry. It is a unit of the Food and Agriculture Organization of the United Nations. It is an integral part of INFOFISH. 27 Crow’s Nest, June, 2002. 28 http://www.delmonte.com/Company/News/press56.asp. 29 http://www.montereyherald.com/mld/montereyherald/news/8979083.htm. 30 http://www.chickenofthesea.com/company.aspx. 31 U.S. International Trade Commission, Fact Sheet: Update on the Likely Impact of U.S. Tariff Modification for Tuna Imported From ATPA Beneficiaries, 2002.
21
Its Chicken of the Sea has close to a 20 percent share in the U.S. market. (Of the approximately one-third of the U.S. market share not held by StarKist or Chicken of the Sea, most is held by Bumble Bee, which does not have a cannery on American Samoa. In 2004 Bumble Bee and Connors Bros. Income Fund combined to make Bumble Bee LLC, Inc. the largest branded seafood company in North America.) Recent Issues Affecting Tuna
A number of key issues have risen in the past few years that have a direct impact on the tuna industry. One of these issues was the presentation of tuna to the consumer inside a flexible, foil pouch. Second, a report issued warning of levels of methyl mercury present in certain fish consumed by Americans, including tuna. Also, current U.S. legislation to promote trade between the U.S. and South America has provisions which affect American Samoa and its competitiveness in the U.S. tuna market. Pouched Tuna In recent years, new technology in packaging tuna has led to tuna being packaged in a flexible, foil pouch. This alternative to traditional packaging has become a success and is gaining momentum among consumers. This new packaging consists of large chunks or flakes of premium albacore tuna with essentially no liquid (oil or water). In addition to not having to drain the tuna meat, the pouches are also available in a variety of preseasoned flavors and require no can opener. The pouches are considered to be a higher quality product and deemed convenient but the retail price is almost double of canned tuna. Approximately 3 percent of retail tuna consumption is pouched tuna.32 Ecuador is the main importer of the tuna in foil pouches and the country enjoys duty-free status on the pouches while Thailand is levied a 6 to 12.5 percent duty on pouches.33 Methyl mercury In 2003 a report was released with the concerns of levels of methyl mercury found in certain consumable fish in the U.S. Among the fish listed was albacore tuna. In March of 2004, the Food and Drug Administration (FDA) reported that albacore tuna had a higher level of methyl mercury than light meat tuna. The recommendation of the FDA was to limit the amount of these fish consumed per week, especially for children and pregnant women. In November of 2004, the Center for Disease Control (CDC) released a report in their Morbidity and Mortality Weekly Report indicating that levels of methyl mercury from fish were well below any level of concern.
32 Forum Fisheries Agency, Tuna Market News, August 6, 2002, Issue No. 30, found at Internet address http://www.ffa.int/docs/TMN.update.2002.07.pdf. 33 www.globefish.org/index.php?id=2089.
22
Legislation A bill in the U.S. Congress, S. 1739, was passed exempting the Andean countries duty free status on imports of pouched tuna.34 Currently, Andean countries pay tariffs on canned tuna imported into the U.S. ranging from 6% up to quota, after which a heftier 12.5% tariff is assessed.35 The Andean Preference Act was established in 1991 to reward countries that agreed to actively curtail illegal narcotics into the U.S. As a result, selected imported items would be eligible for reduced duty or duty-free entry in the U.S. canned tuna included.
34 USITC, Memorandum on Proposed Tariff Legislation of the 108th Congress, 2004. 35 Josupeit, Helga, International Fish Trade Regulatory Framework, INFOFISH Tuna Conference presentation, 2004.
23
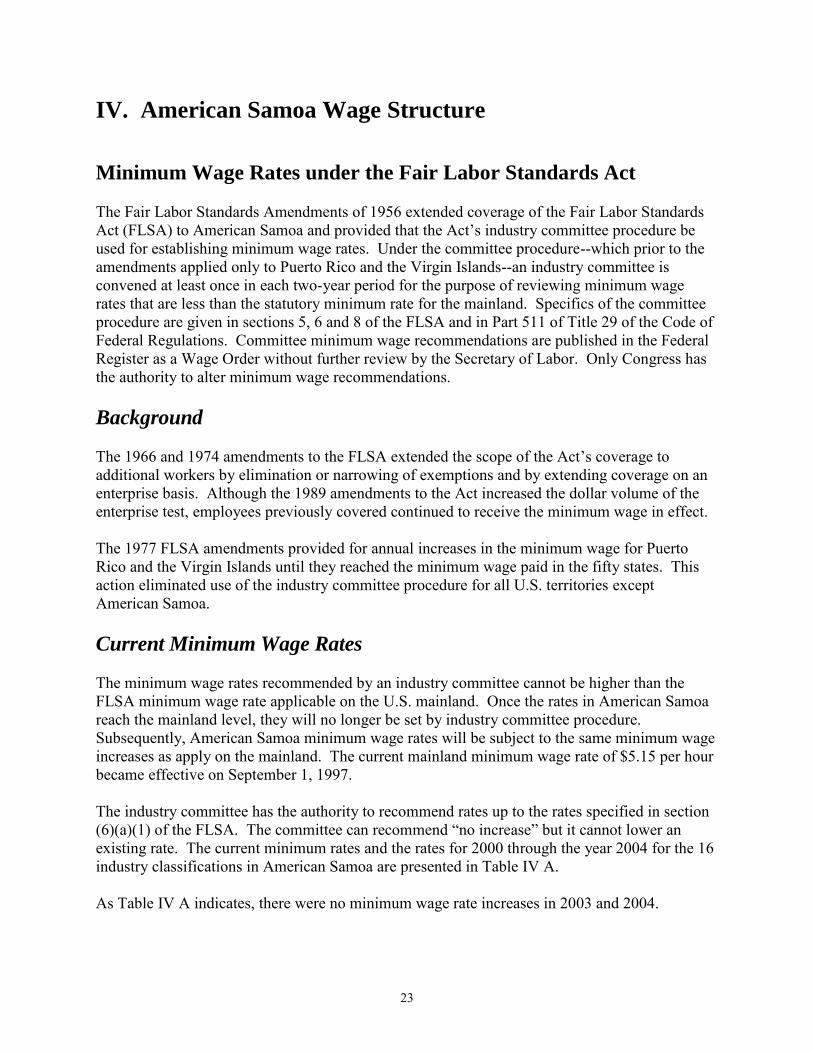
IV. American Samoa Wage Structure Minimum Wage Rates under the Fair Labor Standards Act The Fair Labor Standards Amendments of 1956 extended coverage of the Fair Labor Standards Act (FLSA) to American Samoa and provided that the Act’s industry committee procedure be used for establishing minimum wage rates. Under the committee procedure--which prior to the amendments applied only to Puerto Rico and the Virgin Islands--an industry committee is convened at least once in each two-year period for the purpose of reviewing minimum wage rates that are less than the statutory minimum rate for the mainland. Specifics of the committee procedure are given in sections 5, 6 and 8 of the FLSA and in Part 511 of Title 29 of the Code of Federal Regulations. Committee minimum wage recommendations are published in the Federal Register as a Wage Order without further review by the Secretary of Labor. Only Congress has the authority to alter minimum wage recommendations. Background The 1966 and 1974 amendments to the FLSA extended the scope of the Act’s coverage to additional workers by elimination or narrowing of exemptions and by extending coverage on an enterprise basis. Although the 1989 amendments to the Act increased the dollar volume of the enterprise test, employees previously covered continued to receive the minimum wage in effect. The 1977 FLSA amendments provided for annual increases in the minimum wage for Puerto Rico and the Virgin Islands until they reached the minimum wage paid in the fifty states. This action eliminated use of the industry committee procedure for all U.S. territories except American Samoa. Current Minimum Wage Rates The minimum wage rates recommended by an industry committee cannot be higher than the FLSA minimum wage rate applicable on the U.S. mainland. Once the rates in American Samoa reach the mainland level, they will no longer be set by industry committee procedure. Subsequently, American Samoa minimum wage rates will be subject to the same minimum wage increases as apply on the mainland. The current mainland minimum wage rate of $5.15 per hour became effective on September 1, 1997. The industry committee has the authority to recommend rates up to the rates specified in section (6)(a)(1) of the FLSA. The committee can recommend “no increase” but it cannot lower an existing rate. The current minimum rates and the rates for 2000 through the year 2004 for the 16 industry classifications in American Samoa are presented in Table IV A. As Table IV A indicates, there were no minimum wage rate increases in 2003 and 2004.
24
The workers in Fish Canning and Processing last received an increase in their minimum wage in 2001. All other industries received rate increases effective in 2002. The average annual increase in the minimum wage, for covered workers in all industries, has been less then one percent for the past four years.
Table IV A. Minimum Wage Rates by Year and Percent Change, 2000-2004 Minimum Wage Rates ($/hr) Industry Classification
2000
2001
2002
2003
2004
Government Employees 2.69 2.73 2.77 2.77 2.77
Fish Canning and Processing 3.20 3.26 3.26 3.26 3.26
Petroleum Marketing 3.78 3.82 3.85 3.85 3.85
Shipping and Transportation: Classification A 3.97 4.03 4.09 4.09 4.09
Shipping and Transportation: Classification B 3.81 3.87 3.92 3.92 3.92
Shipping and Transportation: Classification C 3.77 3.83 3.88 3.88 3.88
Construction 3.50 3.55 3.60 3.60 3.60
Retailing, Wholesaling, and Warehousing 3.01 3.06 3.10 3.10 3.10
Bottling, Brewing, and Dairy Products 3.10 3.15 3.19 3.19 3.19
Printing 3.40 3.45 3.50 3.50 3.50
Publishing 3.53 3.58 3.63 3.63 3.63
Finance and Insurance 3.88 3.94 3.99 3.99 3.99
Ship Maintenance 3.25 3.30 3.34 3.34 3.34
Hotel 2.78 2.82 2.86 2.86 2.86
Tour and Travel Services 3.22 3.27 3.31 3.31 3.31
Private Hospitals and Educational Institutions 3.24 3.29 3.33 3.33 3.33
Garment Manufacturing 2.60 2.64 2.68 2.68 2.68
Miscellaneous Activities 2.50 2.54 2.57 2.57 2.57 Sources: Federal Register, Vol. 68, No. 152, August 7, 2003. U.S. Department of Labor, Economic Report: The Minimum Wage in American Samoa,
2003, Wage and Hour Division.
25
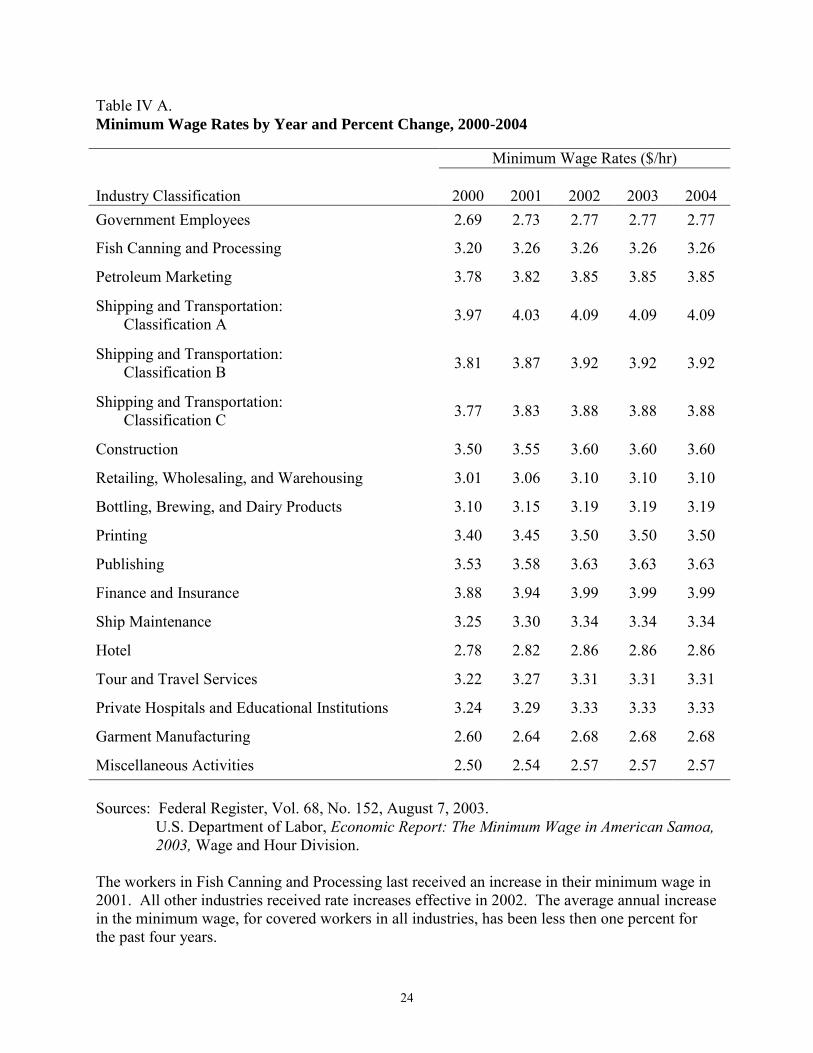
Survey Results In November 2004 the Wage and Hour Division, part of the U.S. Department of Labor’s Employment Standards Administration, conducted a voluntary employment survey of establishments in American Samoa covered by the Fair Labor Standards Act. While not a universe survey, an attempt was made to obtain a large representative sample of firms in the territory. For the two industry classifications that employed the largest number of workers, Fish Canning and Processing, and Government Employees, the surveys were equivalent to a universe survey. A representative from each establishment contacted at the time of the survey was asked to furnish employment and wage information for covered employees. Employment data were collected for February, May, August, and October of 2003 and 2004. Wage data were collected for the payroll period that included the day of October 12, 2004. A listing of the private sector establishments surveyed, together with the number of covered employees for selected months in 2003 and 2004, are presented in Appendix A. The survey revealed that in October 2004 there were 12,264 covered employees working in 176 establishments or government agencies contacted by Wage and Hour personnel. A total of 7,140 workers were employed at 171 establishments in private sector industry classifications and 5,124 were working in the Government Employees industry. A distribution of employment and number of establishments by industry classification are presented in Table IV B. In addition, Table IV B provides the average wages earned by covered employees in each industry as of October 2004. The U.S. Census Bureau estimated the American Samoa civilian labor force at 17,627 for 2000 and civilian employment at 16,718.36 Thus, covered employees who worked at the establishments and agencies surveyed for this report represent 70 percent of year 2000 civilian labor force and 73 percent of year 2000 employment.
36 U.S. Department of Commerce, Population and Housing Profile: 2000, 2000 Census of Population and Housing, American Samoa. www.census.gov/prod/cen2000/island/ASprofile.pdf.
26
Table IV B. Number of Establishments, Covered Workers, and Wages by Industry Classification, November 2004 Survey Results
Industry Classification
Number of Surveyed
Establishments or Agencies
Covered Employees Average Hourly Wages
($)
Number % of Total 2004 2002**37
Government Employees 5 5124 41.78 7.99 7.24
Fish Canning and Processing 3 4738 38.63 3.60 3.56
Petroleum Marketing 3 15 0.12 5.92 6.77 Shipping and Transportation: Class A 4 289 2.36 4.41 4.62 Shipping and Transportation: Class B 1 5 0.04 4.57 3.84 Shipping and Transportation: Class C 6 87 0.71 5.30 5.70
Construction 10 243 1.98 4.81 4.64 Retailing, Wholesaling, and Warehousing 107 1267 10.33 4.55 4.61 Bottling, Brewing and Dairy Products 0 * * * 3.90
Printing 2 13 0.11 4.13 4.90
Publishing 2 21 0.17 8.14 6.81
Finance and Insurance 13 131 1.07 7.90 7.32
Ship Maintenance 1 25 0.20 6.54 7.28
Hotel 4 139 1.13 4.07 4.51
Tour and Travel Services 2 5 0.04 6.71 7.51
Private Hospitals and Ed. Institutions 1 59 0.48 3.23 7.86
Miscellaneous Activities 12 103 0.84 5.01 5.20
Total 176 12264
*No data was collected for Garment Industry and Bottling, Brewing and Dairy Products. No Garment Industry exists on the island and businesses for Bottling, Brewing and Dairy Products were contacted but did not participate in the survey. **Please note that the 2002 Average Hourly Rate has been provided only as a reference and due to the limited and variant nature of the data, no concrete statistical trend between years should be inferred.
37 U.S. Department of Labor, 2002 wage and Hour Survey Results for American Samoa
27
American Samoa Employment and Wages Three sectors employed approximately 91 percent of all covered workers in survey data:
Fish Canning and Processing continued to be the dominant industry in the private sector with 4,738 covered employees in October 2004. This represented 39 percent of the total number of covered workers in the survey.
The American Samoa Government employed 5,124 covered workers, accounting for
more than 41 percent of total survey employment.
Employment in Retailing, Wholesaling, and Warehousing accounted for 1,267 workers or ten percent of the covered employees in firms surveyed.
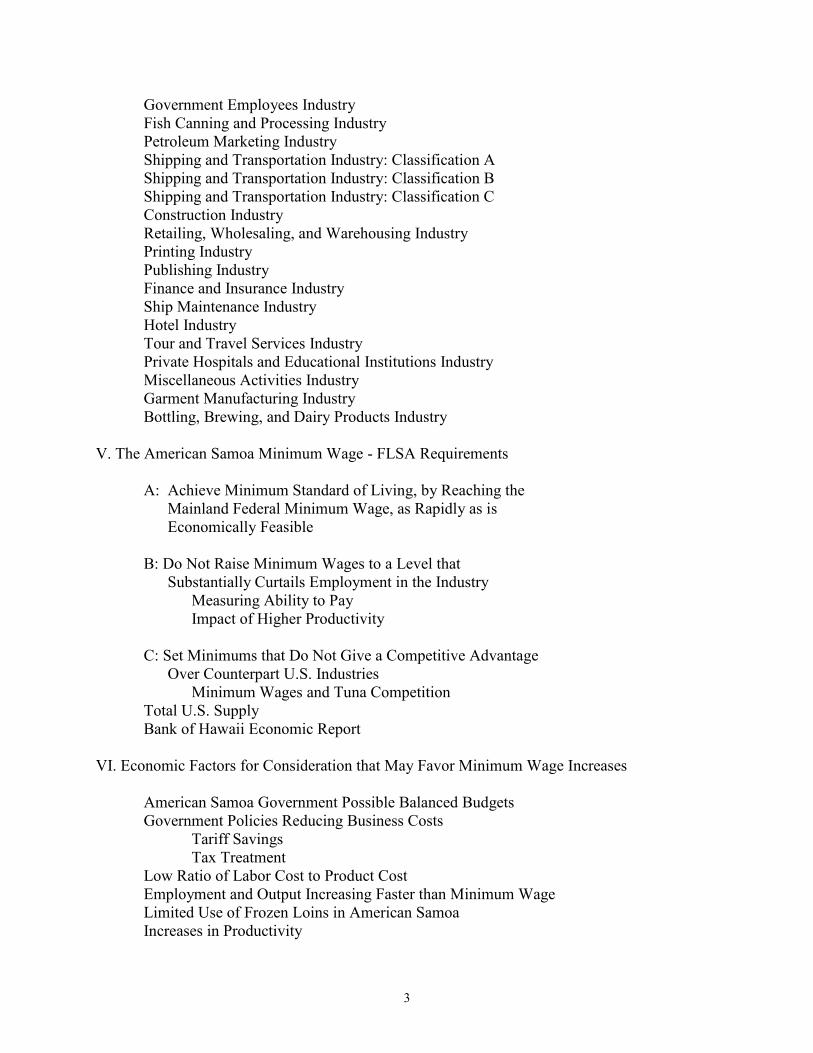
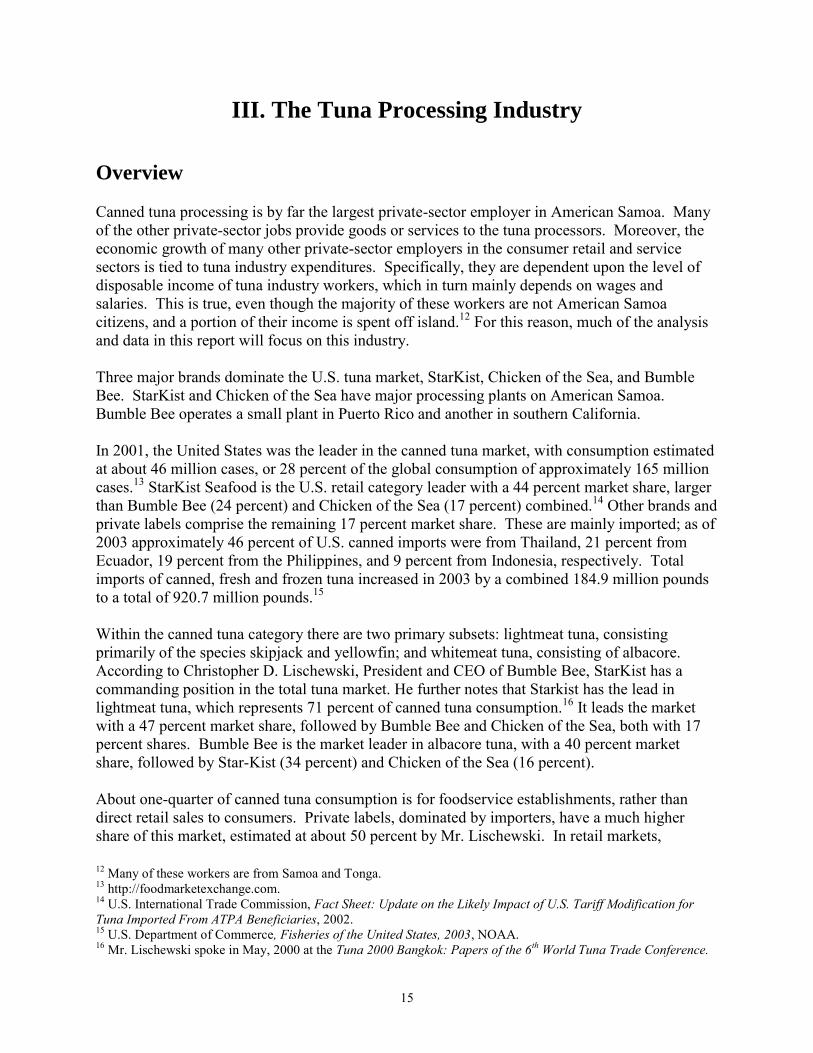
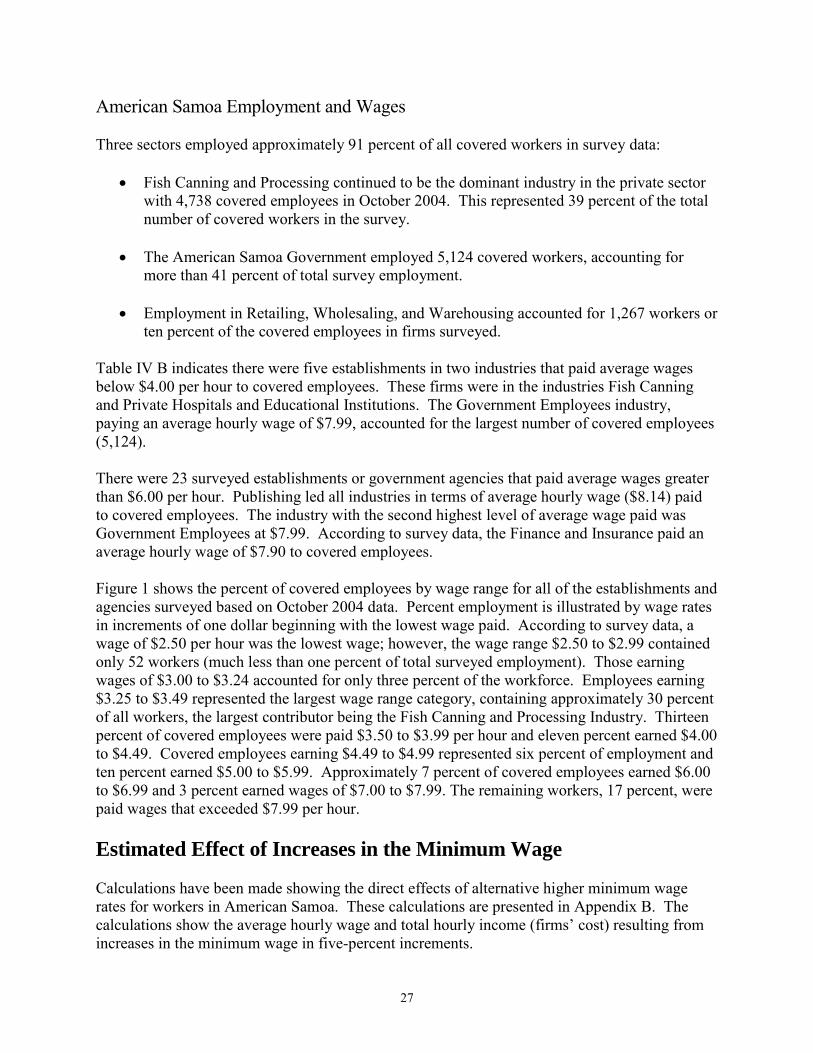
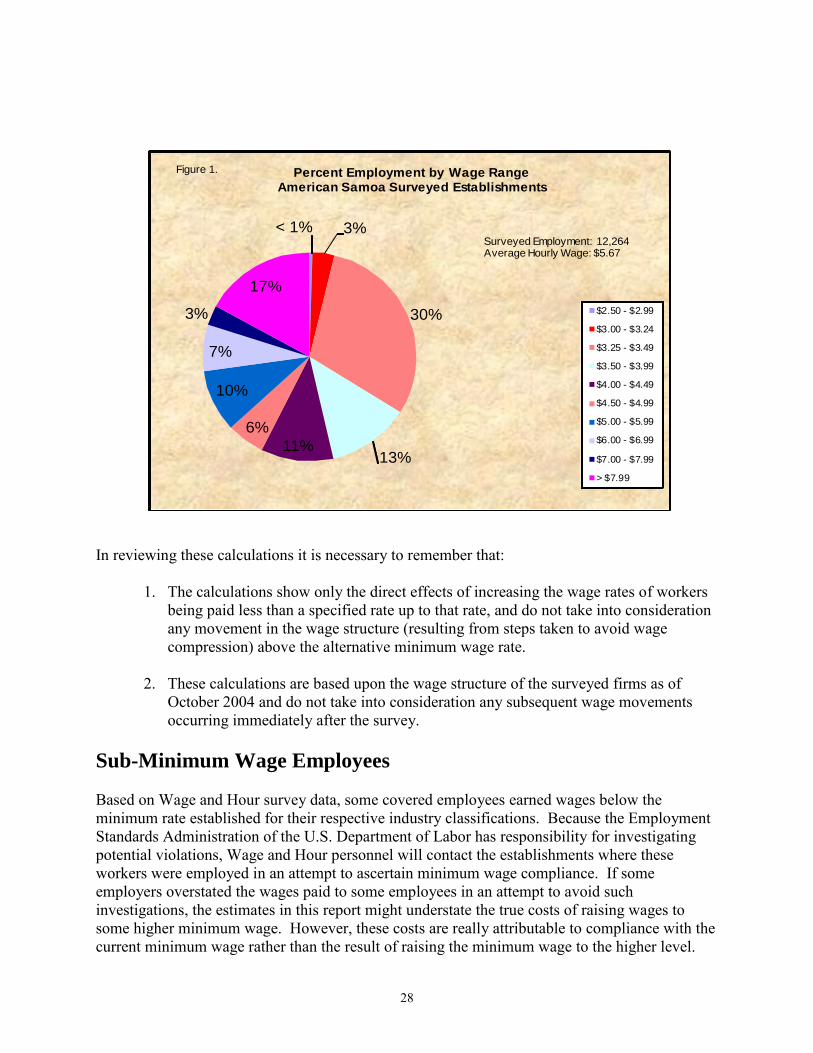
Table IV B indicates there were five establishments in two industries that paid average wages below $4.00 per hour to covered employees. These firms were in the industries Fish Canning and Private Hospitals and Educational Institutions. The Government Employees industry, paying an average hourly wage of $7.99, accounted for the largest number of covered employees (5,124). There were 23 surveyed establishments or government agencies that paid average wages greater than $6.00 per hour. Publishing led all industries in terms of average hourly wage ($8.14) paid to covered employees. The industry with the second highest level of average wage paid was Government Employees at $7.99. According to survey data, the Finance and Insurance paid an average hourly wage of $7.90 to covered employees. Figure 1 shows the percent of covered employees by wage range for all of the establishments and agencies surveyed based on October 2004 data. Percent employment is illustrated by wage rates in increments of one dollar beginning with the lowest wage paid. According to survey data, a wage of $2.50 per hour was the lowest wage; however, the wage range $2.50 to $2.99 contained only 52 workers (much less than one percent of total surveyed employment). Those earning wages of $3.00 to $3.24 accounted for only three percent of the workforce. Employees earning $3.25 to $3.49 represented the largest wage range category, containing approximately 30 percent of all workers, the largest contributor being the Fish Canning and Processing Industry. Thirteen percent of covered employees were paid $3.50 to $3.99 per hour and eleven percent earned $4.00 to $4.49. Covered employees earning $4.49 to $4.99 represented six percent of employment and ten percent earned $5.00 to $5.99. Approximately 7 percent of covered employees earned $6.00 to $6.99 and 3 percent earned wages of $7.00 to $7.99. The remaining workers, 17 percent, were paid wages that exceeded $7.99 per hour. Estimated Effect of Increases in the Minimum Wage Calculations have been made showing the direct effects of alternative higher minimum wage rates for workers in American Samoa. These calculations are presented in Appendix B. The calculations show the average hourly wage and total hourly income (firms’ cost) resulting from increases in the minimum wage in five-percent increments.
28
In reviewing these calculations it is necessary to remember that:
1. The calculations show only the direct effects of increasing the wage rates of workers being paid less than a specified rate up to that rate, and do not take into consideration any movement in the wage structure (resulting from steps taken to avoid wage compression) above the alternative minimum wage rate.
2. These calculations are based upon the wage structure of the surveyed firms as of
October 2004 and do not take into consideration any subsequent wage movements occurring immediately after the survey.
Sub-Minimum Wage Employees
Based on Wage and Hour survey data, some covered employees earned wages below the minimum rate established for their respective industry classifications. Because the Employment Standards Administration of the U.S. Department of Labor has responsibility for investigating potential violations, Wage and Hour personnel will contact the establishments where these workers were employed in an attempt to ascertain minimum wage compliance. If some employers overstated the wages paid to some employees in an attempt to avoid such investigations, the estimates in this report might understate the true costs of raising wages to some higher minimum wage. However, these costs are really attributable to compliance with the current minimum wage rather than the result of raising the minimum wage to the higher level.
< 1% 3%
30%
13%11%
6%
10%
7%
3%
17%
Percent Employment by Wage RangeAmerican Samoa Surveyed Establishments
$2.50 - $2.99
$3.00 - $3.24
$3.25 - $3.49
$3.50 - $3.99
$4.00 - $4.49
$4.50 - $4.99
$5.00 - $5.99
$6.00 - $6.99
$7.00 - $7.99
> $7.99
Figure 1.
Surveyed Employment: 12,264Average Hourly Wage: $5.67
29
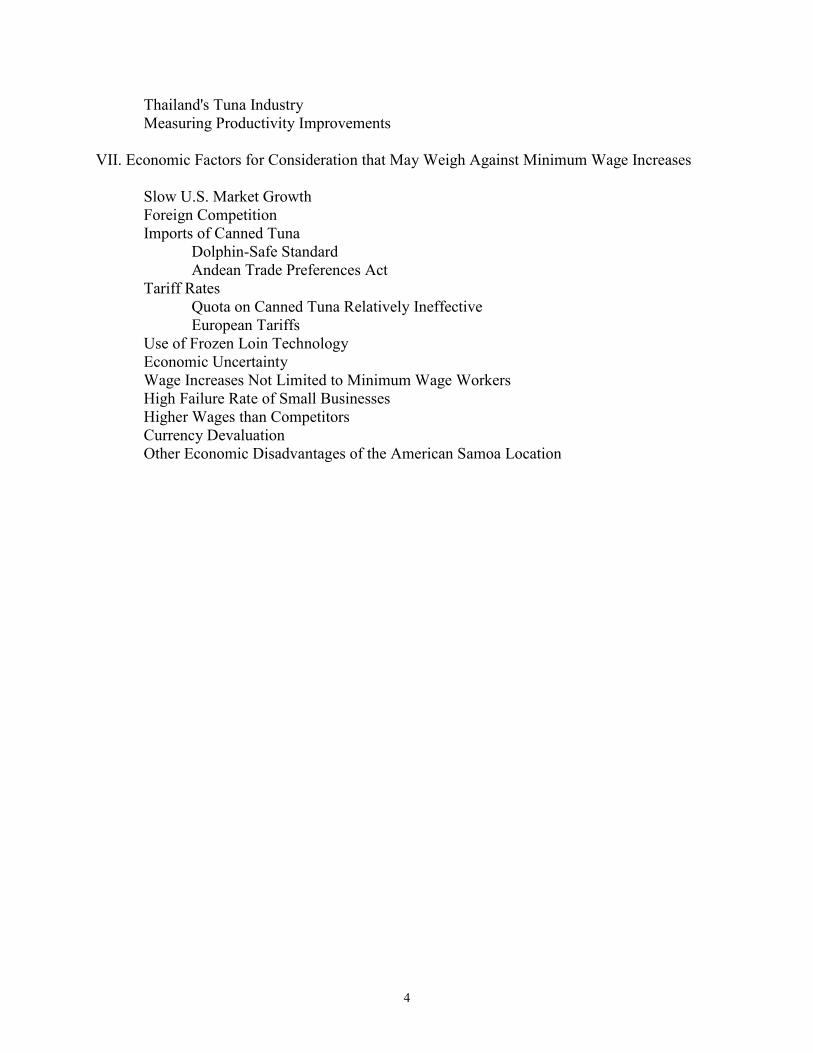
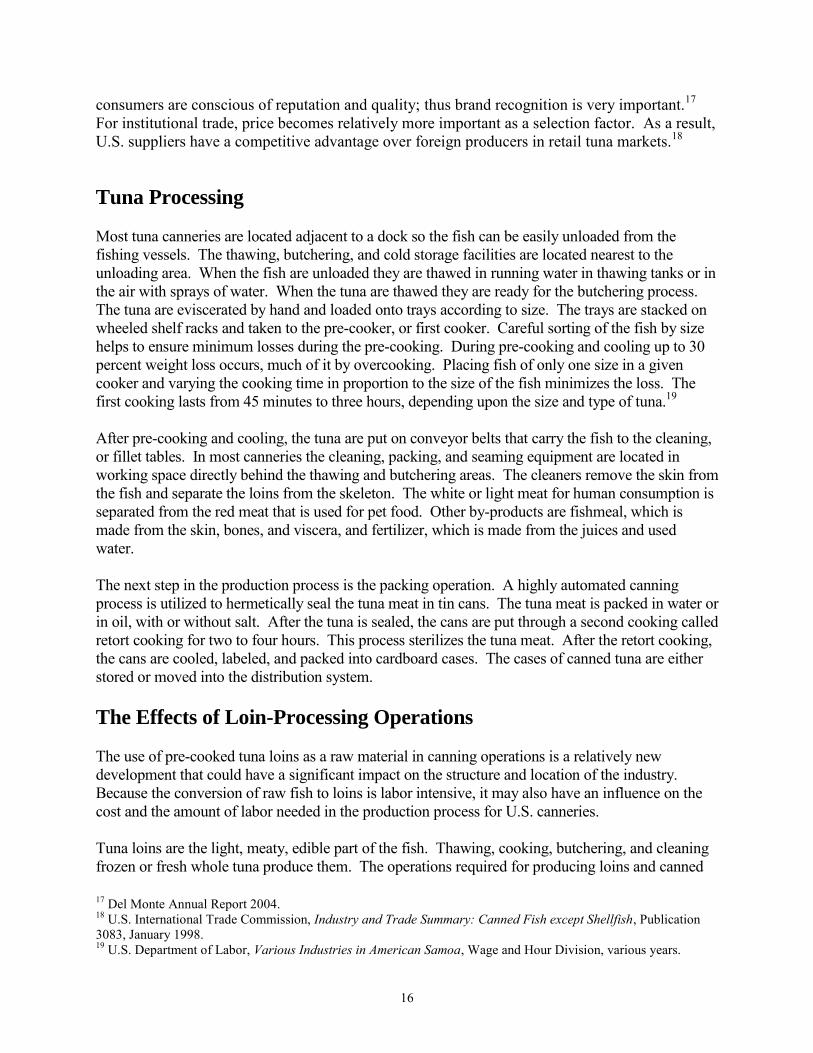
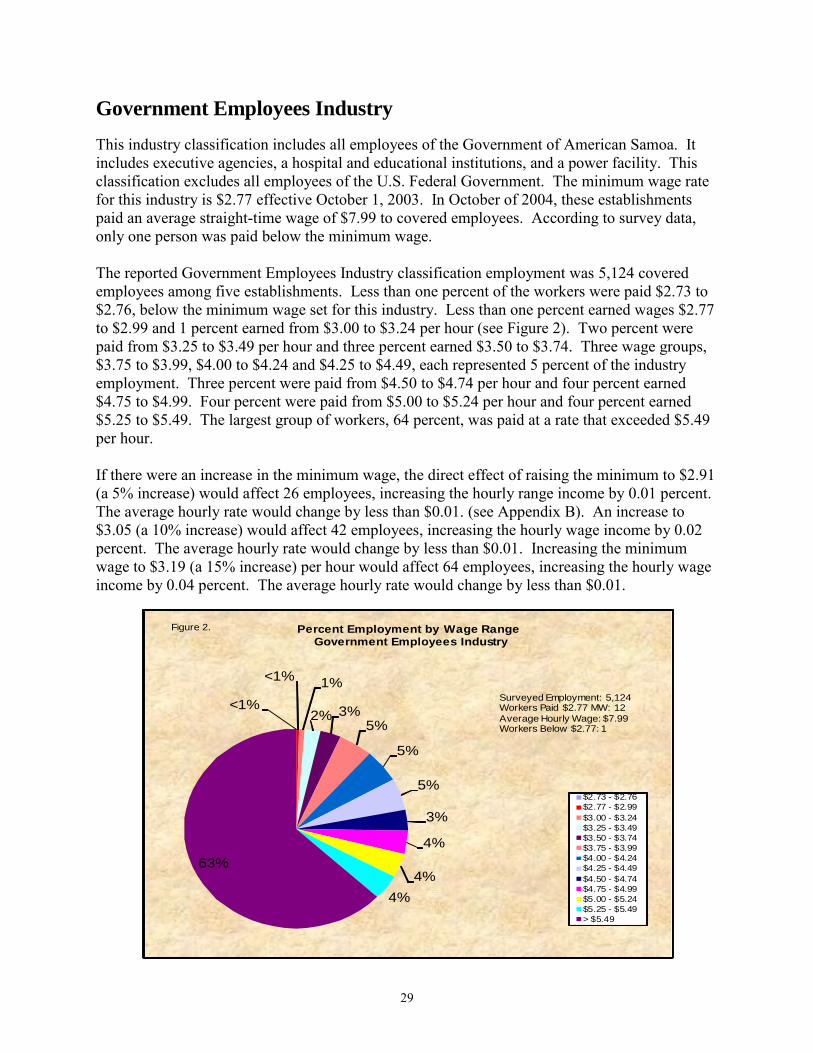
Government Employees Industry This industry classification includes all employees of the Government of American Samoa. It includes executive agencies, a hospital and educational institutions, and a power facility. This classification excludes all employees of the U.S. Federal Government. The minimum wage rate for this industry is $2.77 effective October 1, 2003. In October of 2004, these establishments paid an average straight-time wage of $7.99 to covered employees. According to survey data, only one person was paid below the minimum wage. The reported Government Employees Industry classification employment was 5,124 covered employees among five establishments. Less than one percent of the workers were paid $2.73 to $2.76, below the minimum wage set for this industry. Less than one percent earned wages $2.77 to $2.99 and 1 percent earned from $3.00 to $3.24 per hour (see Figure 2). Two percent were paid from $3.25 to $3.49 per hour and three percent earned $3.50 to $3.74. Three wage groups, $3.75 to $3.99, $4.00 to $4.24 and $4.25 to $4.49, each represented 5 percent of the industry employment. Three percent were paid from $4.50 to $4.74 per hour and four percent earned $4.75 to $4.99. Four percent were paid from $5.00 to $5.24 per hour and four percent earned $5.25 to $5.49. The largest group of workers, 64 percent, was paid at a rate that exceeded $5.49 per hour. If there were an increase in the minimum wage, the direct effect of raising the minimum to $2.91 (a 5% increase) would affect 26 employees, increasing the hourly range income by 0.01 percent. The average hourly rate would change by less than $0.01. (see Appendix B). An increase to $3.05 (a 10% increase) would affect 42 employees, increasing the hourly wage income by 0.02 percent. The average hourly rate would change by less than $0.01. Increasing the minimum wage to $3.19 (a 15% increase) per hour would affect 64 employees, increasing the hourly wage income by 0.04 percent. The average hourly rate would change by less than $0.01.
<1%
<1%1%
2% 3%5%
5%
5%
3%
4%
4%
4%
63%
Percent Employment by Wage RangeGovernment Employees Industry
$2.73 - $2.76
$2.77 - $2.99
$3.00 - $3.24
$3.25 - $3.49
$3.50 - $3.74
$3.75 - $3.99
$4.00 - $4.24
$4.25 - $4.49
$4.50 - $4.74
$4.75 - $4.99
$5.00 - $5.24
$5.25 - $5.49
> $5.49
Figure 2.
Surveyed Employment: 5,124 Workers Paid $2.77 MW: 12
Average Hourly Wage: $7.99Workers Below $2.77: 1
30
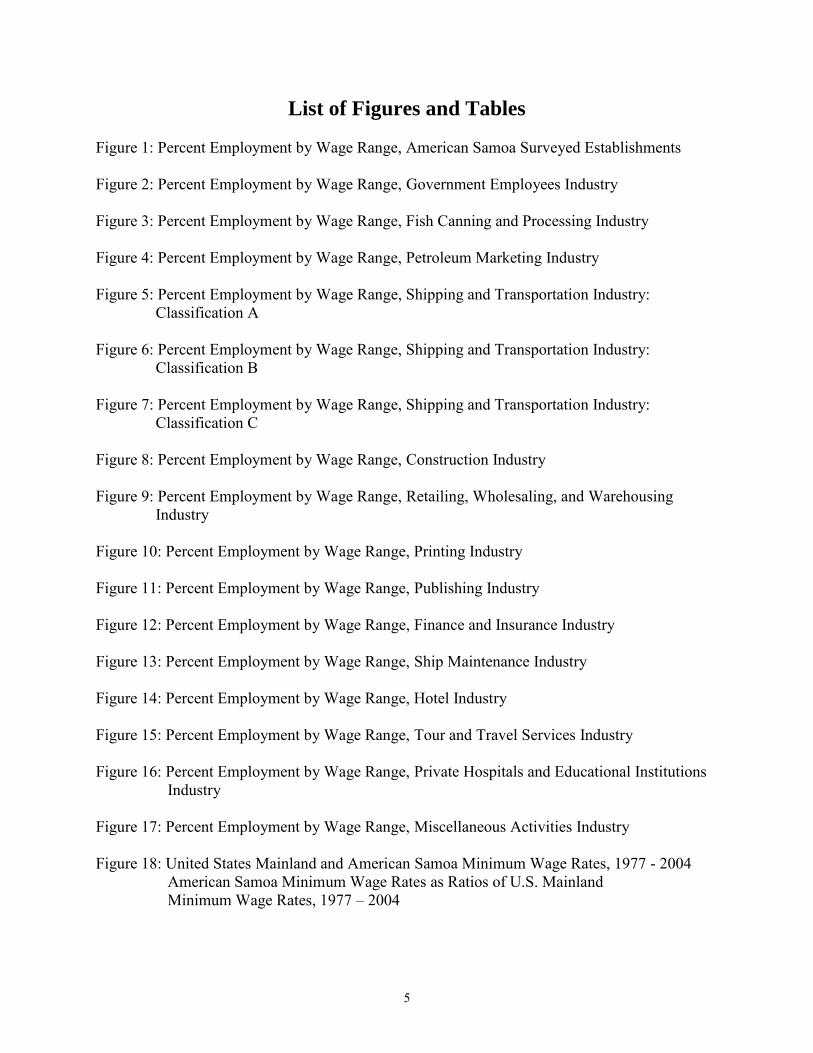
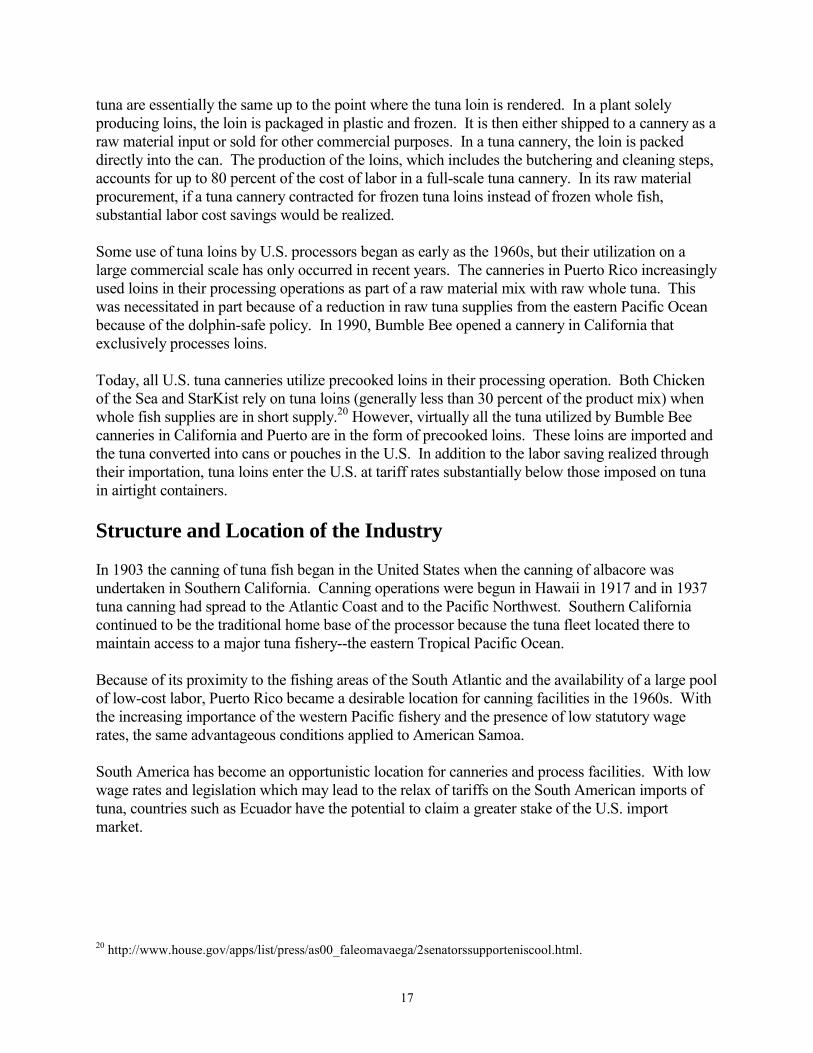
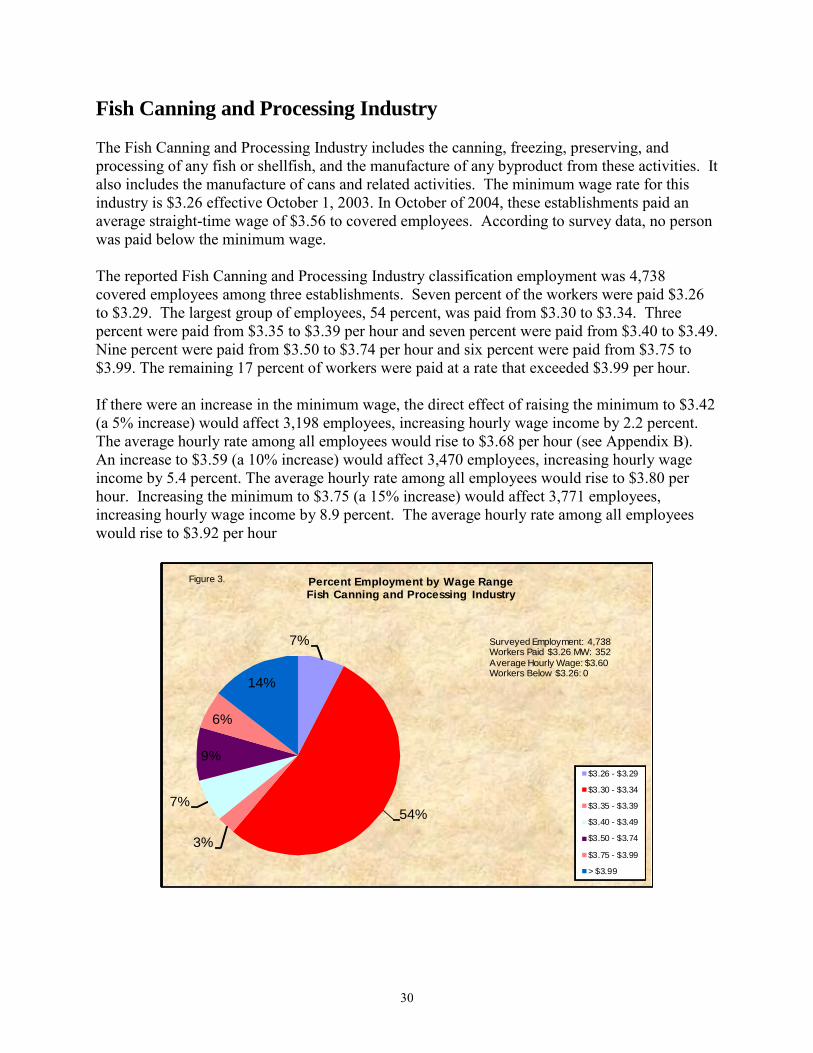
Fish Canning and Processing Industry The Fish Canning and Processing Industry includes the canning, freezing, preserving, and processing of any fish or shellfish, and the manufacture of any byproduct from these activities. It also includes the manufacture of cans and related activities. The minimum wage rate for this industry is $3.26 effective October 1, 2003. In October of 2004, these establishments paid an average straight-time wage of $3.56 to covered employees. According to survey data, no person was paid below the minimum wage. The reported Fish Canning and Processing Industry classification employment was 4,738 covered employees among three establishments. Seven percent of the workers were paid $3.26 to $3.29. The largest group of employees, 54 percent, was paid from $3.30 to $3.34. Three percent were paid from $3.35 to $3.39 per hour and seven percent were paid from $3.40 to $3.49. Nine percent were paid from $3.50 to $3.74 per hour and six percent were paid from $3.75 to $3.99. The remaining 17 percent of workers were paid at a rate that exceeded $3.99 per hour. If there were an increase in the minimum wage, the direct effect of raising the minimum to $3.42 (a 5% increase) would affect 3,198 employees, increasing hourly wage income by 2.2 percent. The average hourly rate among all employees would rise to $3.68 per hour (see Appendix B). An increase to $3.59 (a 10% increase) would affect 3,470 employees, increasing hourly wage income by 5.4 percent. The average hourly rate among all employees would rise to $3.80 per hour. Increasing the minimum to $3.75 (a 15% increase) would affect 3,771 employees, increasing hourly wage income by 8.9 percent. The average hourly rate among all employees would rise to $3.92 per hour
7%
54%
3%
7%
9%
6%
14%
Percent Employment by Wage RangeFish Canning and Processing Industry
$3.26 - $3.29
$3.30 - $3.34
$3.35 - $3.39
$3.40 - $3.49
$3.50 - $3.74
$3.75 - $3.99
> $3.99
Figure 3.
Surveyed Employment: 4,738Workers Paid $3.26 MW: 352
Average Hourly Wage: $3.60Workers Below $3.26: 0
31
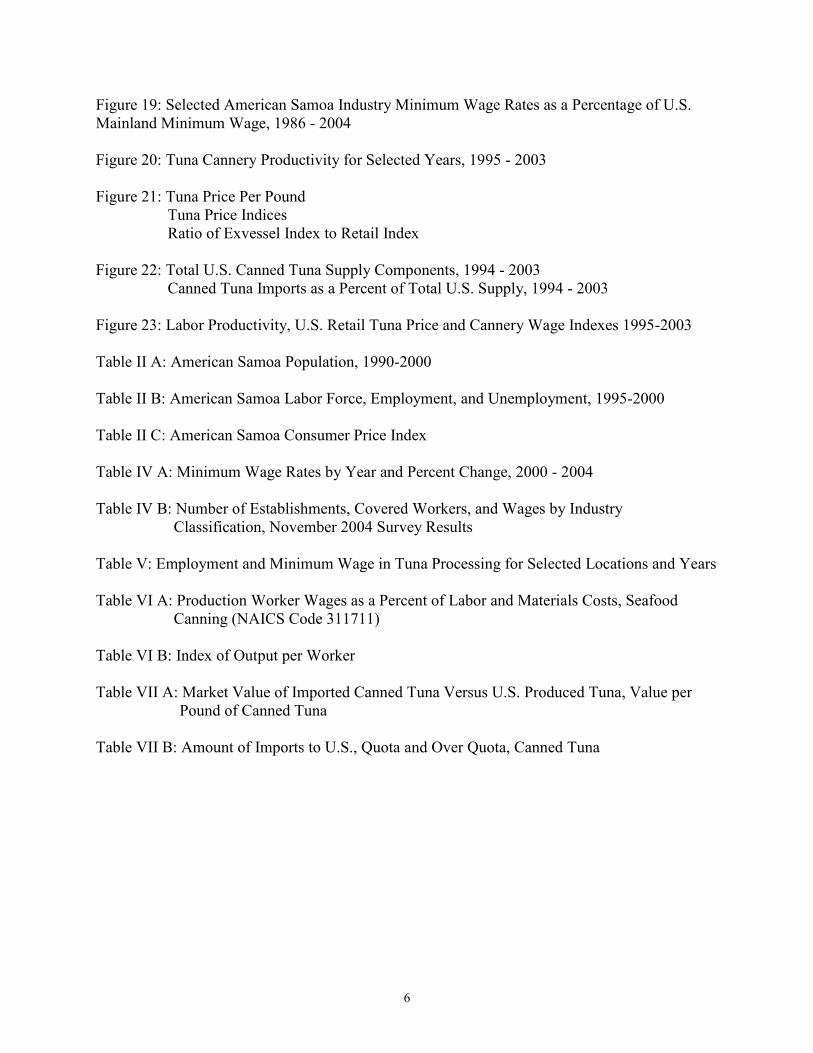
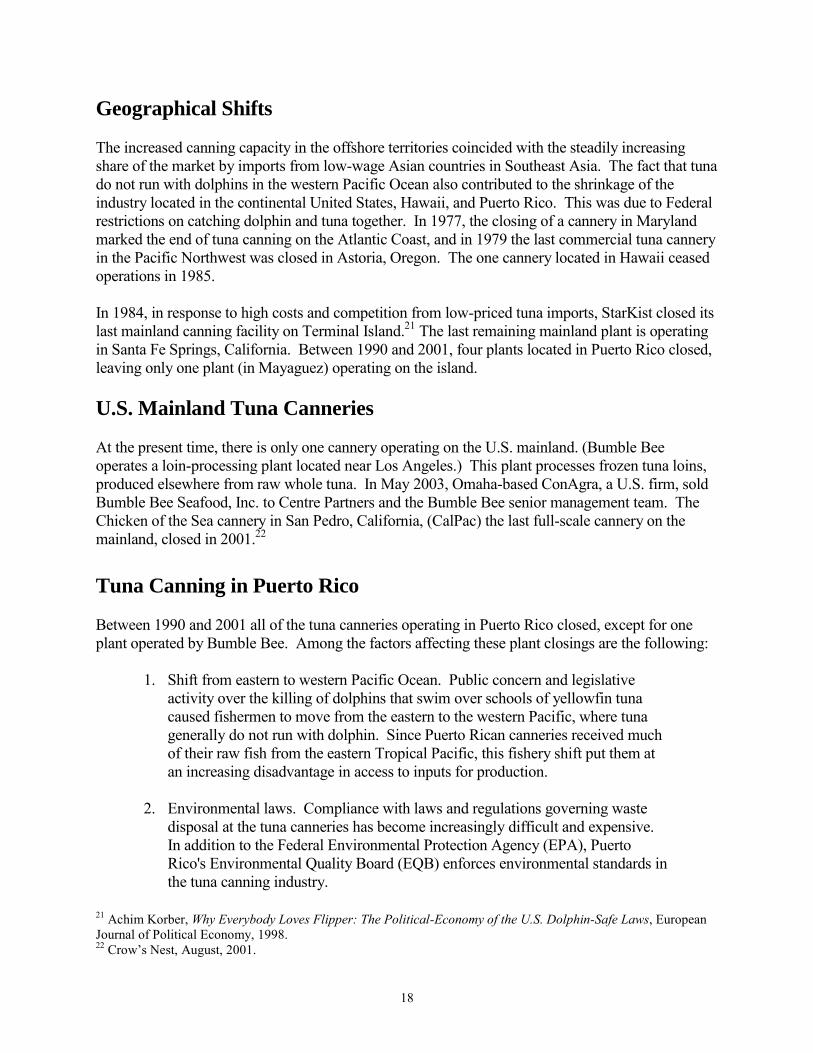
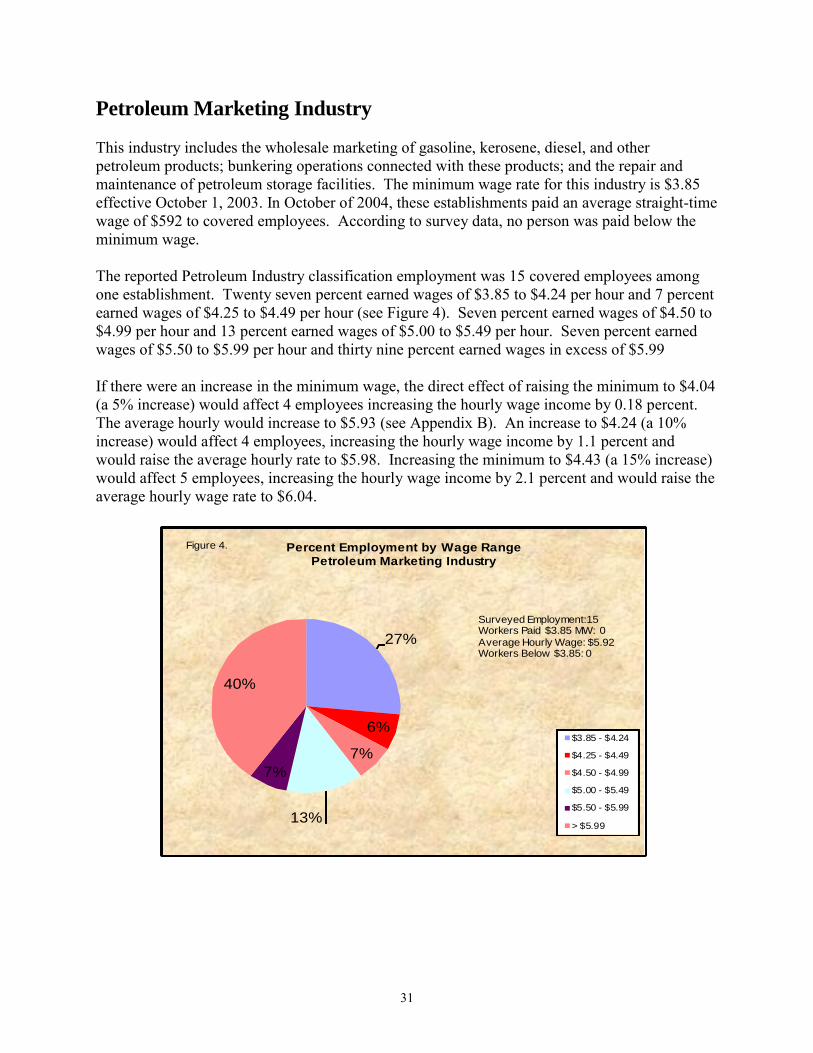
Petroleum Marketing Industry This industry includes the wholesale marketing of gasoline, kerosene, diesel, and other petroleum products; bunkering operations connected with these products; and the repair and maintenance of petroleum storage facilities. The minimum wage rate for this industry is $3.85 effective October 1, 2003. In October of 2004, these establishments paid an average straight-time wage of $592 to covered employees. According to survey data, no person was paid below the minimum wage. The reported Petroleum Industry classification employment was 15 covered employees among one establishment. Twenty seven percent earned wages of $3.85 to $4.24 per hour and 7 percent earned wages of $4.25 to $4.49 per hour (see Figure 4). Seven percent earned wages of $4.50 to $4.99 per hour and 13 percent earned wages of $5.00 to $5.49 per hour. Seven percent earned wages of $5.50 to $5.99 per hour and thirty nine percent earned wages in excess of $5.99 If there were an increase in the minimum wage, the direct effect of raising the minimum to $4.04 (a 5% increase) would affect 4 employees increasing the hourly wage income by 0.18 percent. The average hourly would increase to $5.93 (see Appendix B). An increase to $4.24 (a 10% increase) would affect 4 employees, increasing the hourly wage income by 1.1 percent and would raise the average hourly rate to $5.98. Increasing the minimum to $4.43 (a 15% increase) would affect 5 employees, increasing the hourly wage income by 2.1 percent and would raise the average hourly wage rate to $6.04.
27%
6%
7%
13%
7%
40%
Percent Employment by Wage RangePetroleum Marketing Industry
$3.85 - $4.24
$4.25 - $4.49
$4.50 - $4.99
$5.00 - $5.49
$5.50 - $5.99
> $5.99
Figure 4.
Surveyed Employment:15 Workers Paid $3.85 MW: 0
Average Hourly Wage: $5.92Workers Below $3.85: 0
32
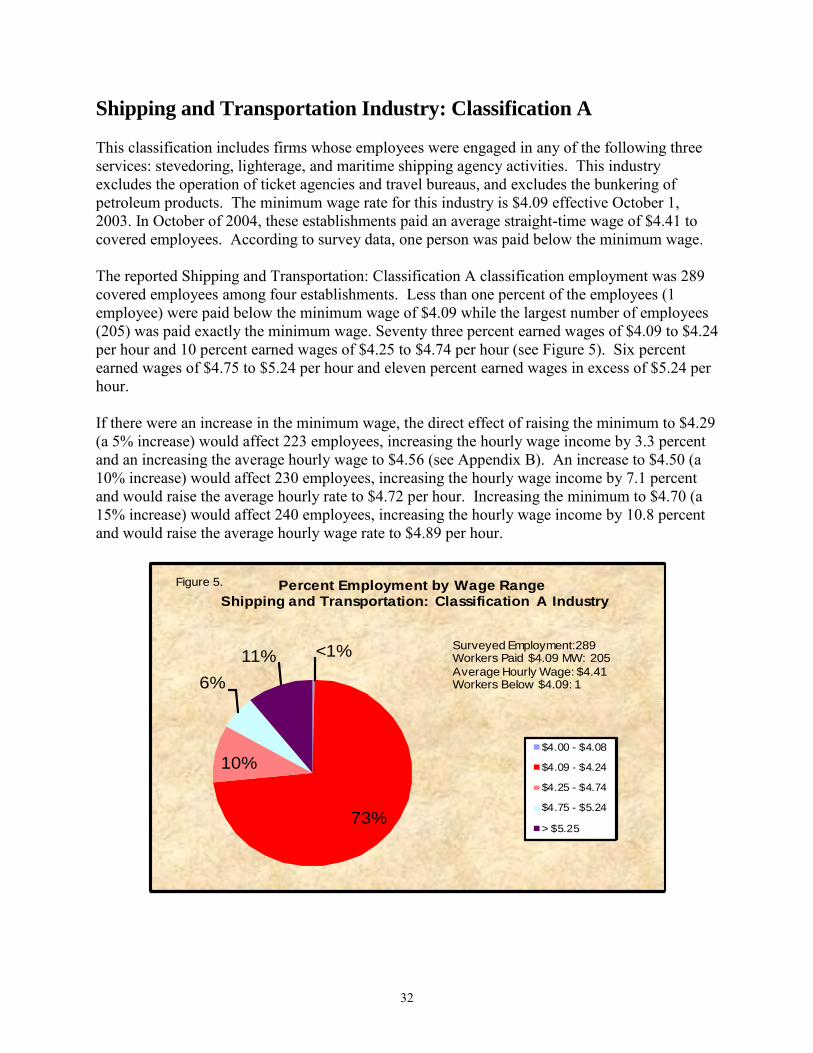
Shipping and Transportation Industry: Classification A This classification includes firms whose employees were engaged in any of the following three services: stevedoring, lighterage, and maritime shipping agency activities. This industry excludes the operation of ticket agencies and travel bureaus, and excludes the bunkering of petroleum products. The minimum wage rate for this industry is $4.09 effective October 1, 2003. In October of 2004, these establishments paid an average straight-time wage of $4.41 to covered employees. According to survey data, one person was paid below the minimum wage. The reported Shipping and Transportation: Classification A classification employment was 289 covered employees among four establishments. Less than one percent of the employees (1 employee) were paid below the minimum wage of $4.09 while the largest number of employees (205) was paid exactly the minimum wage. Seventy three percent earned wages of $4.09 to $4.24 per hour and 10 percent earned wages of $4.25 to $4.74 per hour (see Figure 5). Six percent earned wages of $4.75 to $5.24 per hour and eleven percent earned wages in excess of $5.24 per hour. If there were an increase in the minimum wage, the direct effect of raising the minimum to $4.29 (a 5% increase) would affect 223 employees, increasing the hourly wage income by 3.3 percent and an increasing the average hourly wage to $4.56 (see Appendix B). An increase to $4.50 (a 10% increase) would affect 230 employees, increasing the hourly wage income by 7.1 percent and would raise the average hourly rate to $4.72 per hour. Increasing the minimum to $4.70 (a 15% increase) would affect 240 employees, increasing the hourly wage income by 10.8 percent and would raise the average hourly wage rate to $4.89 per hour.
<1%
73%
10%
6%
11%
Percent Employment by Wage RangeShipping and Transportation: Classification A Industry
$4.00 - $4.08
$4.09 - $4.24
$4.25 - $4.74
$4.75 - $5.24
> $5.25
Figure 5.
Surveyed Employment:289 Workers Paid $4.09 MW: 205
Average Hourly Wage: $4.41Workers Below $4.09: 1
33
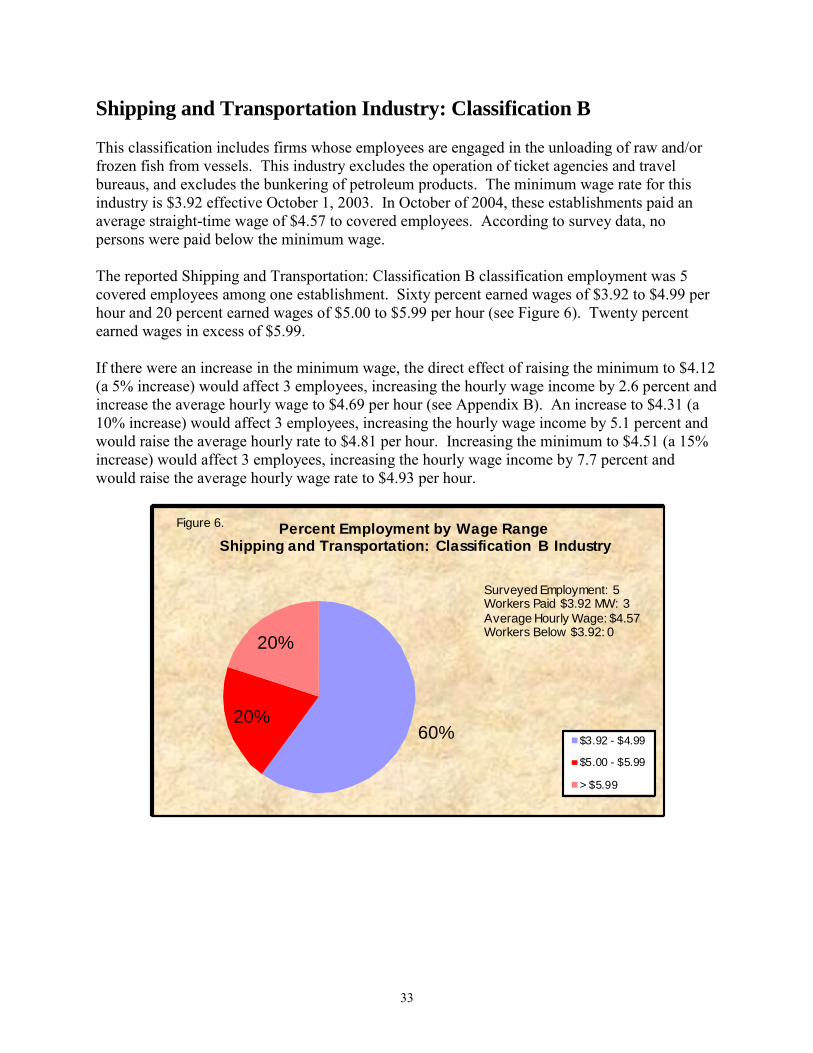
Shipping and Transportation Industry: Classification B This classification includes firms whose employees are engaged in the unloading of raw and/or frozen fish from vessels. This industry excludes the operation of ticket agencies and travel bureaus, and excludes the bunkering of petroleum products. The minimum wage rate for this industry is $3.92 effective October 1, 2003. In October of 2004, these establishments paid an average straight-time wage of $4.57 to covered employees. According to survey data, no persons were paid below the minimum wage. The reported Shipping and Transportation: Classification B classification employment was 5 covered employees among one establishment. Sixty percent earned wages of $3.92 to $4.99 per hour and 20 percent earned wages of $5.00 to $5.99 per hour (see Figure 6). Twenty percent earned wages in excess of $5.99. If there were an increase in the minimum wage, the direct effect of raising the minimum to $4.12 (a 5% increase) would affect 3 employees, increasing the hourly wage income by 2.6 percent and increase the average hourly wage to $4.69 per hour (see Appendix B). An increase to $4.31 (a 10% increase) would affect 3 employees, increasing the hourly wage income by 5.1 percent and would raise the average hourly rate to $4.81 per hour. Increasing the minimum to $4.51 (a 15% increase) would affect 3 employees, increasing the hourly wage income by 7.7 percent and would raise the average hourly wage rate to $4.93 per hour.
60%20%
20%
Percent Employment by Wage RangeShipping and Transportation: Classification B Industry
$3.92 - $4.99
$5.00 - $5.99
> $5.99
Figure 6.
Surveyed Employment: 5Workers Paid $3.92 MW: 3
Average Hourly Wage: $4.57Workers Below $3.92: 0
34
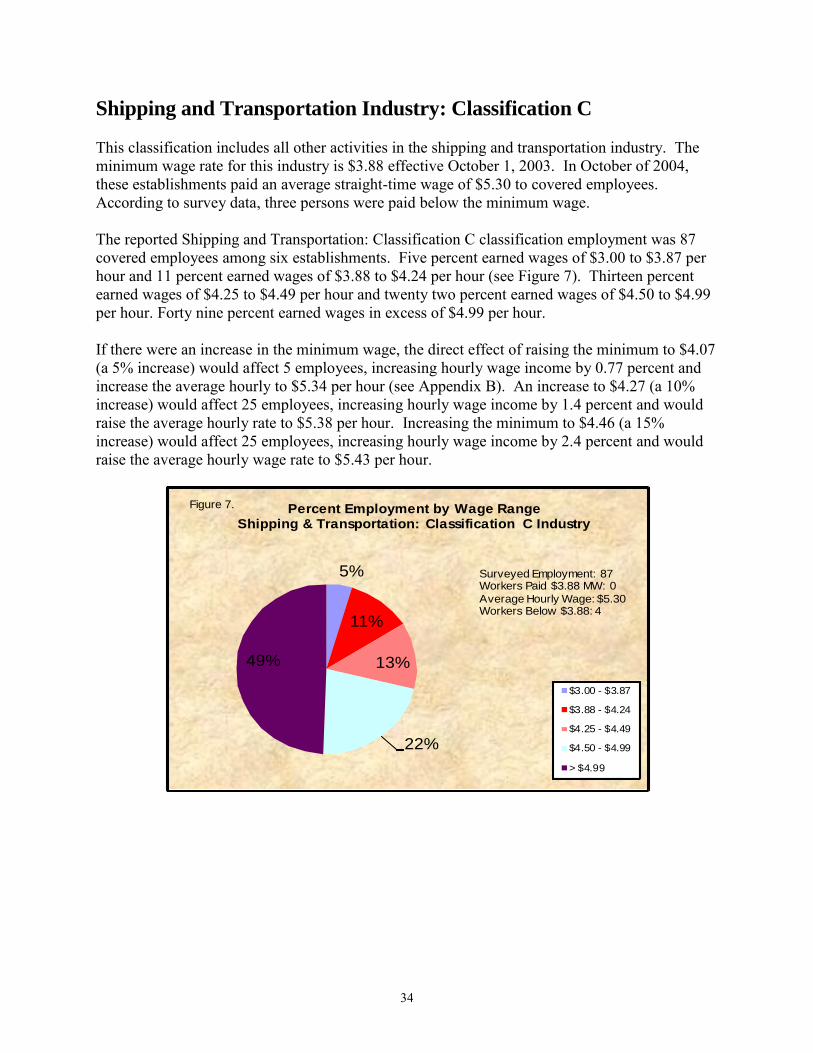
Shipping and Transportation Industry: Classification C This classification includes all other activities in the shipping and transportation industry. The minimum wage rate for this industry is $3.88 effective October 1, 2003. In October of 2004, these establishments paid an average straight-time wage of $5.30 to covered employees. According to survey data, three persons were paid below the minimum wage. The reported Shipping and Transportation: Classification C classification employment was 87 covered employees among six establishments. Five percent earned wages of $3.00 to $3.87 per hour and 11 percent earned wages of $3.88 to $4.24 per hour (see Figure 7). Thirteen percent earned wages of $4.25 to $4.49 per hour and twenty two percent earned wages of $4.50 to $4.99 per hour. Forty nine percent earned wages in excess of $4.99 per hour. If there were an increase in the minimum wage, the direct effect of raising the minimum to $4.07 (a 5% increase) would affect 5 employees, increasing hourly wage income by 0.77 percent and increase the average hourly to $5.34 per hour (see Appendix B). An increase to $4.27 (a 10% increase) would affect 25 employees, increasing hourly wage income by 1.4 percent and would raise the average hourly rate to $5.38 per hour. Increasing the minimum to $4.46 (a 15% increase) would affect 25 employees, increasing hourly wage income by 2.4 percent and would raise the average hourly wage rate to $5.43 per hour.
5%
11%
13%
22%
49%
Percent Employment by Wage RangeShipping & Transportation: Classification C Industry
$3.00 - $3.87
$3.88 - $4.24
$4.25 - $4.49
$4.50 - $4.99
> $4.99
Figure 7.
Surveyed Employment: 87Workers Paid $3.88 MW: 0
Average Hourly Wage: $5.30Workers Below $3.88: 4
35
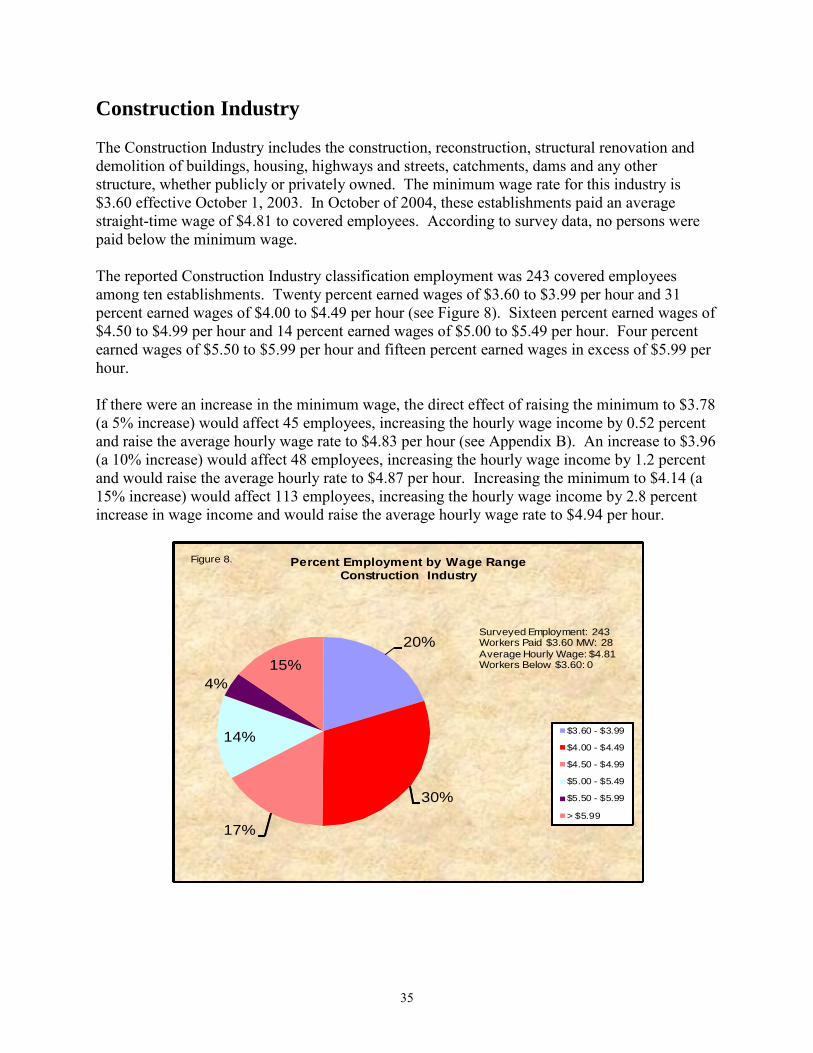
Construction Industry The Construction Industry includes the construction, reconstruction, structural renovation and demolition of buildings, housing, highways and streets, catchments, dams and any other structure, whether publicly or privately owned. The minimum wage rate for this industry is $3.60 effective October 1, 2003. In October of 2004, these establishments paid an average straight-time wage of $4.81 to covered employees. According to survey data, no persons were paid below the minimum wage. The reported Construction Industry classification employment was 243 covered employees among ten establishments. Twenty percent earned wages of $3.60 to $3.99 per hour and 31 percent earned wages of $4.00 to $4.49 per hour (see Figure 8). Sixteen percent earned wages of $4.50 to $4.99 per hour and 14 percent earned wages of $5.00 to $5.49 per hour. Four percent earned wages of $5.50 to $5.99 per hour and fifteen percent earned wages in excess of $5.99 per hour. If there were an increase in the minimum wage, the direct effect of raising the minimum to $3.78 (a 5% increase) would affect 45 employees, increasing the hourly wage income by 0.52 percent and raise the average hourly wage rate to $4.83 per hour (see Appendix B). An increase to $3.96 (a 10% increase) would affect 48 employees, increasing the hourly wage income by 1.2 percent and would raise the average hourly rate to $4.87 per hour. Increasing the minimum to $4.14 (a 15% increase) would affect 113 employees, increasing the hourly wage income by 2.8 percent increase in wage income and would raise the average hourly wage rate to $4.94 per hour.
20%
30%
17%
14%
4%
15%
Percent Employment by Wage RangeConstruction Industry
$3.60 - $3.99
$4.00 - $4.49
$4.50 - $4.99
$5.00 - $5.49
$5.50 - $5.99
> $5.99
Figure 8.
Surveyed Employment: 243Workers Paid $3.60 MW: 28
Average Hourly Wage: $4.81Workers Below $3.60: 0
36
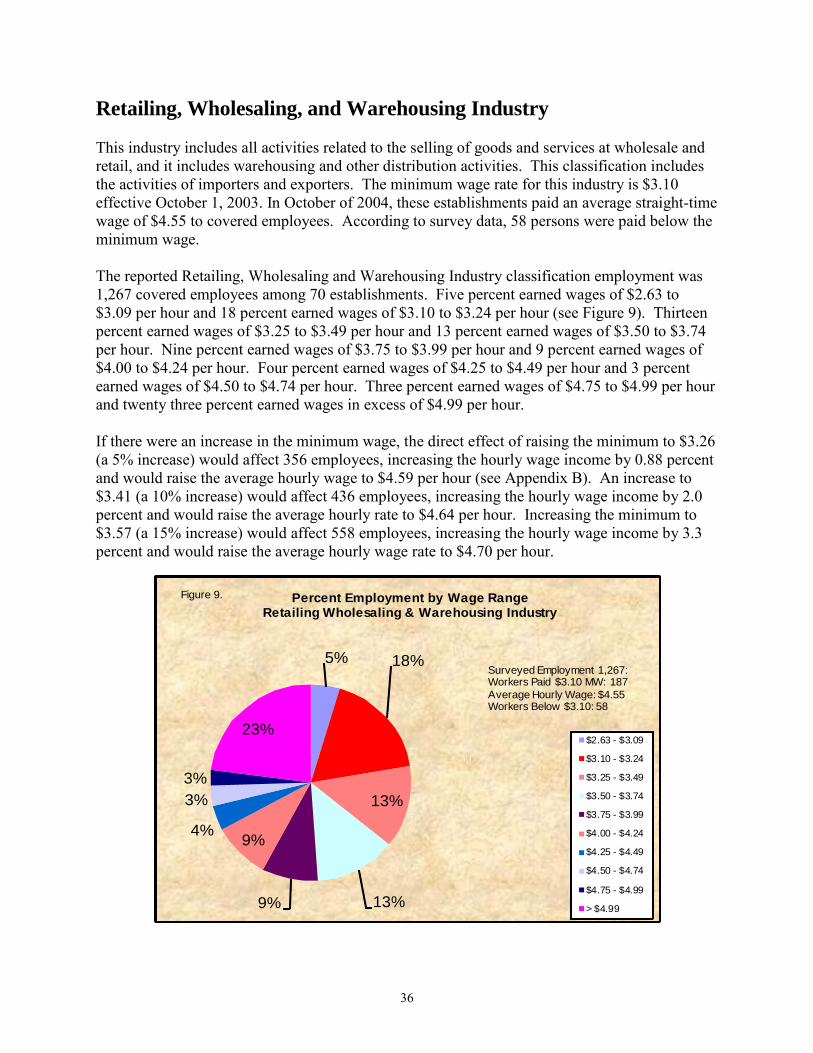
Retailing, Wholesaling, and Warehousing Industry This industry includes all activities related to the selling of goods and services at wholesale and retail, and it includes warehousing and other distribution activities. This classification includes the activities of importers and exporters. The minimum wage rate for this industry is $3.10 effective October 1, 2003. In October of 2004, these establishments paid an average straight-time wage of $4.55 to covered employees. According to survey data, 58 persons were paid below the minimum wage. The reported Retailing, Wholesaling and Warehousing Industry classification employment was 1,267 covered employees among 70 establishments. Five percent earned wages of $2.63 to $3.09 per hour and 18 percent earned wages of $3.10 to $3.24 per hour (see Figure 9). Thirteen percent earned wages of $3.25 to $3.49 per hour and 13 percent earned wages of $3.50 to $3.74 per hour. Nine percent earned wages of $3.75 to $3.99 per hour and 9 percent earned wages of $4.00 to $4.24 per hour. Four percent earned wages of $4.25 to $4.49 per hour and 3 percent earned wages of $4.50 to $4.74 per hour. Three percent earned wages of $4.75 to $4.99 per hour and twenty three percent earned wages in excess of $4.99 per hour. If there were an increase in the minimum wage, the direct effect of raising the minimum to $3.26 (a 5% increase) would affect 356 employees, increasing the hourly wage income by 0.88 percent and would raise the average hourly wage to $4.59 per hour (see Appendix B). An increase to $3.41 (a 10% increase) would affect 436 employees, increasing the hourly wage income by 2.0 percent and would raise the average hourly rate to $4.64 per hour. Increasing the minimum to $3.57 (a 15% increase) would affect 558 employees, increasing the hourly wage income by 3.3 percent and would raise the average hourly wage rate to $4.70 per hour.
5% 18%
13%
13%9%
9%4%
3%
3%
23%
Percent Employment by Wage RangeRetailing Wholesaling & Warehousing Industry
$2.63 - $3.09
$3.10 - $3.24
$3.25 - $3.49
$3.50 - $3.74
$3.75 - $3.99
$4.00 - $4.24
$4.25 - $4.49
$4.50 - $4.74
$4.75 - $4.99
> $4.99
Figure 9.
Surveyed Employment 1,267: Workers Paid $3.10 MW: 187
Average Hourly Wage: $4.55Workers Below $3.10: 58
37
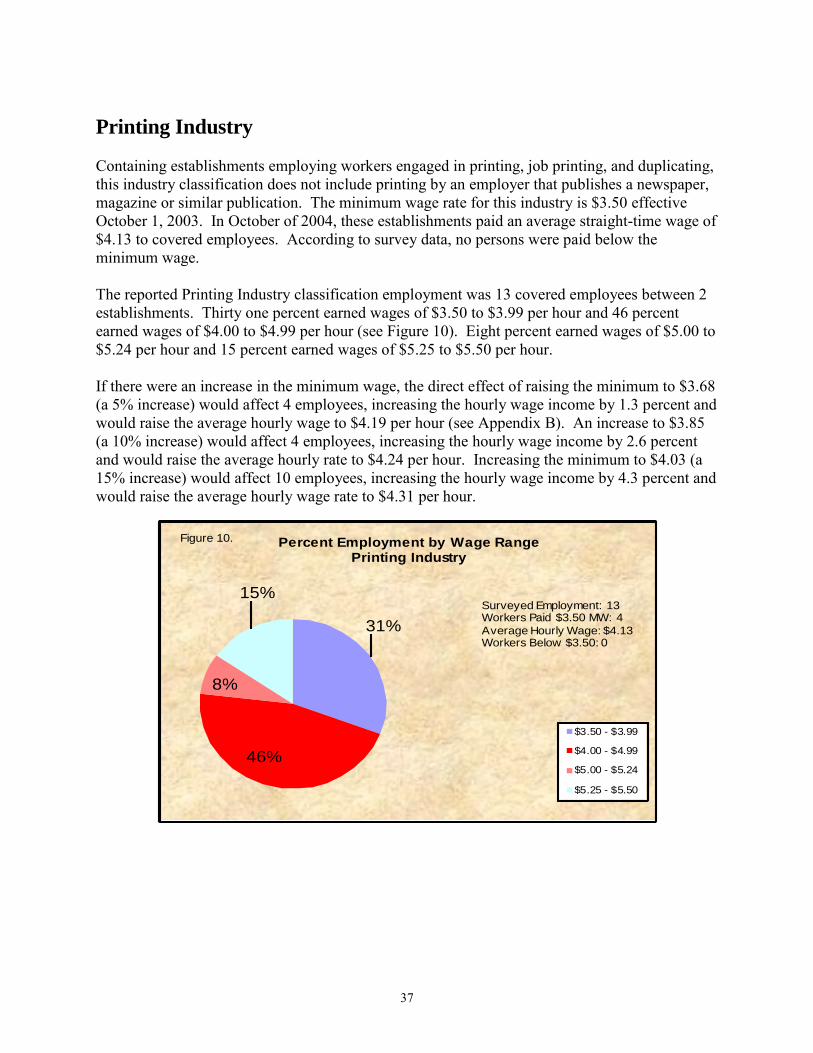
Printing Industry Containing establishments employing workers engaged in printing, job printing, and duplicating, this industry classification does not include printing by an employer that publishes a newspaper, magazine or similar publication. The minimum wage rate for this industry is $3.50 effective October 1, 2003. In October of 2004, these establishments paid an average straight-time wage of $4.13 to covered employees. According to survey data, no persons were paid below the minimum wage. The reported Printing Industry classification employment was 13 covered employees between 2 establishments. Thirty one percent earned wages of $3.50 to $3.99 per hour and 46 percent earned wages of $4.00 to $4.99 per hour (see Figure 10). Eight percent earned wages of $5.00 to $5.24 per hour and 15 percent earned wages of $5.25 to $5.50 per hour. If there were an increase in the minimum wage, the direct effect of raising the minimum to $3.68 (a 5% increase) would affect 4 employees, increasing the hourly wage income by 1.3 percent and would raise the average hourly wage to $4.19 per hour (see Appendix B). An increase to $3.85 (a 10% increase) would affect 4 employees, increasing the hourly wage income by 2.6 percent and would raise the average hourly rate to $4.24 per hour. Increasing the minimum to $4.03 (a 15% increase) would affect 10 employees, increasing the hourly wage income by 4.3 percent and would raise the average hourly wage rate to $4.31 per hour.
31%
46%
8%
15%
Percent Employment by Wage RangePrinting Industry
$3.50 - $3.99
$4.00 - $4.99
$5.00 - $5.24
$5.25 - $5.50
Figure 10.
Surveyed Employment: 13Workers Paid $3.50 MW: 4
Average Hourly Wage: $4.13Workers Below $3.50: 0
38
Publishing Industry The Publishing Industry is engaged in the publishing of newspapers, magazines or other similar publications, other than the publication of newspapers with circulation less than 4,000. The minimum wage rate for this industry is $3.63 effective October 1, 2003. In October of 2004, these establishments paid an average straight-time wage of $8.14 to covered employees. According to survey data, seven persons were paid below the minimum wage. The reported Publishing Industry classification employment was 21 covered employees between 2 establishments. Thirty three percent earned wages from $2.50 to $3.63 per hour. Five percent earned $3.63 to $4.99 per hour and 24 percent earned wages of $5.00 to $5.99 per hour (see Figure 11). Five percent earned wages of $6.00 to $6.99 per hour and thirty three percent earned wages in excess of $6.99 per hour. If there were an increase in the minimum wage, the direct effect of raising the minimum to $3.81 (a 5% increase) would affect 5 employees increasing the hourly wage income by 2.1 percent and increase the average hourly wage to $8.31 per hour (see Appendix B). An increase to $3.99 (a 10% increase) would affect 7 employees increasing the hourly wage income by 2.7 percent and would raise the average hourly rate to $8.36 per hour. Increasing the minimum to $4.17 (a 15% increase) would affect 7 employees increasing the hourly wage income by 3.4 percent increase in wage income and would raise the average hourly wage rate to $8.42 per hour.
33%
5%
24%
5%
33%
Percent Employment by Wage RangePublishing Industry
$2.50 - $3.62
$3.63 - $4.99
$5.00 - $5.99
$6.00 - $6.99
> $6.99
Figure 11.
Surveyed Employment: 21Workers Paid $3.63 MW: 0
Average Hourly Wage: $8.14Workers Below $3.63: 7
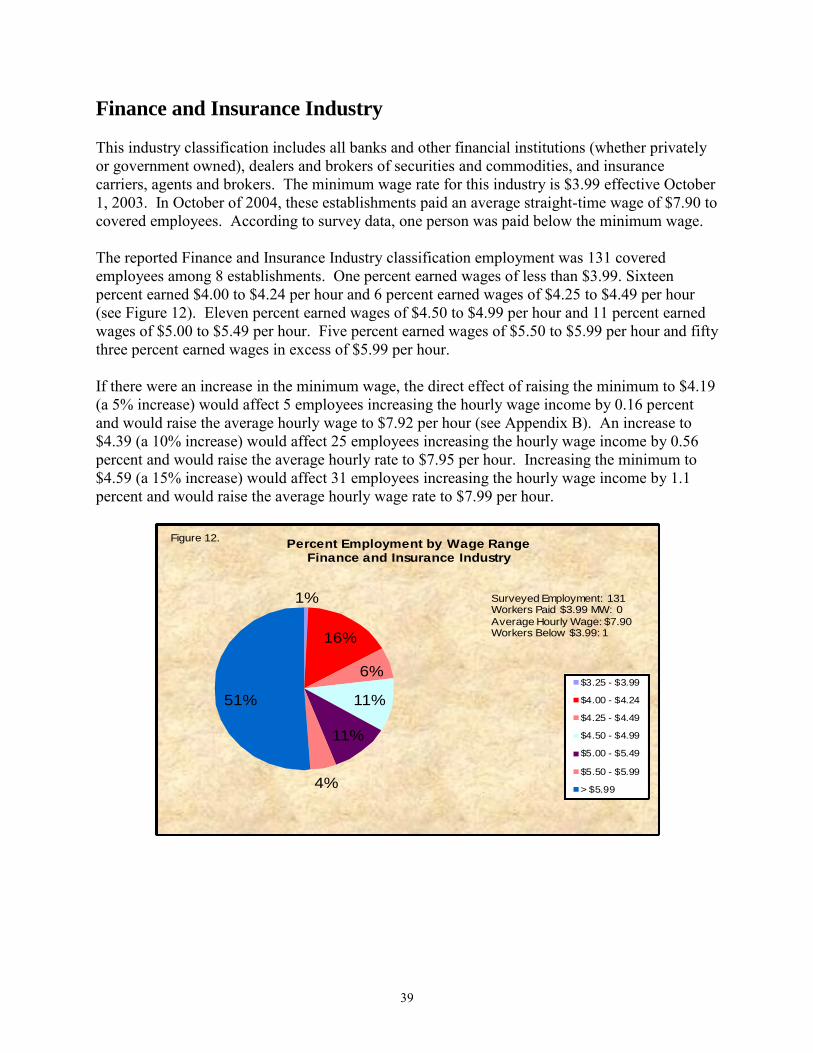
39
Finance and Insurance Industry This industry classification includes all banks and other financial institutions (whether privately or government owned), dealers and brokers of securities and commodities, and insurance carriers, agents and brokers. The minimum wage rate for this industry is $3.99 effective October 1, 2003. In October of 2004, these establishments paid an average straight-time wage of $7.90 to covered employees. According to survey data, one person was paid below the minimum wage. The reported Finance and Insurance Industry classification employment was 131 covered employees among 8 establishments. One percent earned wages of less than $3.99. Sixteen percent earned $4.00 to $4.24 per hour and 6 percent earned wages of $4.25 to $4.49 per hour (see Figure 12). Eleven percent earned wages of $4.50 to $4.99 per hour and 11 percent earned wages of $5.00 to $5.49 per hour. Five percent earned wages of $5.50 to $5.99 per hour and fifty three percent earned wages in excess of $5.99 per hour. If there were an increase in the minimum wage, the direct effect of raising the minimum to $4.19 (a 5% increase) would affect 5 employees increasing the hourly wage income by 0.16 percent and would raise the average hourly wage to $7.92 per hour (see Appendix B). An increase to $4.39 (a 10% increase) would affect 25 employees increasing the hourly wage income by 0.56 percent and would raise the average hourly rate to $7.95 per hour. Increasing the minimum to $4.59 (a 15% increase) would affect 31 employees increasing the hourly wage income by 1.1 percent and would raise the average hourly wage rate to $7.99 per hour.
1%
16%
6%
11%
11%
4%
51%
Percent Employment by Wage RangeFinance and Insurance Industry
$3.25 - $3.99
$4.00 - $4.24
$4.25 - $4.49
$4.50 - $4.99
$5.00 - $5.49
$5.50 - $5.99
> $5.99
Figure 12.
Surveyed Employment: 131Workers Paid $3.99 MW: 0
Average Hourly Wage: $7.90Workers Below $3.99: 1
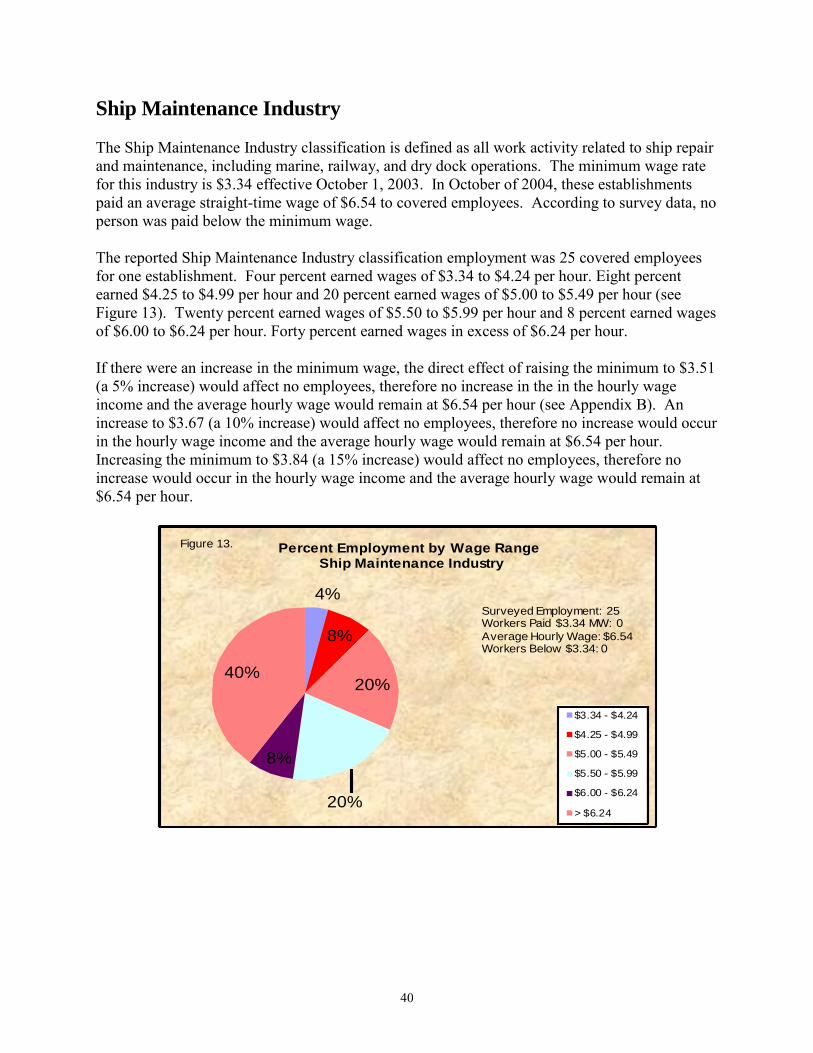
40
Ship Maintenance Industry The Ship Maintenance Industry classification is defined as all work activity related to ship repair and maintenance, including marine, railway, and dry dock operations. The minimum wage rate for this industry is $3.34 effective October 1, 2003. In October of 2004, these establishments paid an average straight-time wage of $6.54 to covered employees. According to survey data, no person was paid below the minimum wage. The reported Ship Maintenance Industry classification employment was 25 covered employees for one establishment. Four percent earned wages of $3.34 to $4.24 per hour. Eight percent earned $4.25 to $4.99 per hour and 20 percent earned wages of $5.00 to $5.49 per hour (see Figure 13). Twenty percent earned wages of $5.50 to $5.99 per hour and 8 percent earned wages of $6.00 to $6.24 per hour. Forty percent earned wages in excess of $6.24 per hour. If there were an increase in the minimum wage, the direct effect of raising the minimum to $3.51 (a 5% increase) would affect no employees, therefore no increase in the in the hourly wage income and the average hourly wage would remain at $6.54 per hour (see Appendix B). An increase to $3.67 (a 10% increase) would affect no employees, therefore no increase would occur in the hourly wage income and the average hourly wage would remain at $6.54 per hour. Increasing the minimum to $3.84 (a 15% increase) would affect no employees, therefore no increase would occur in the hourly wage income and the average hourly wage would remain at $6.54 per hour.
4%
8%
20%
20%
8%
40%
Percent Employment by Wage RangeShip Maintenance Industry
$3.34 - $4.24
$4.25 - $4.99
$5.00 - $5.49
$5.50 - $5.99
$6.00 - $6.24
> $6.24
Figure 13.
Surveyed Employment: 25Workers Paid $3.34 MW: 0
Average Hourly Wage: $6.54Workers Below $3.34: 0
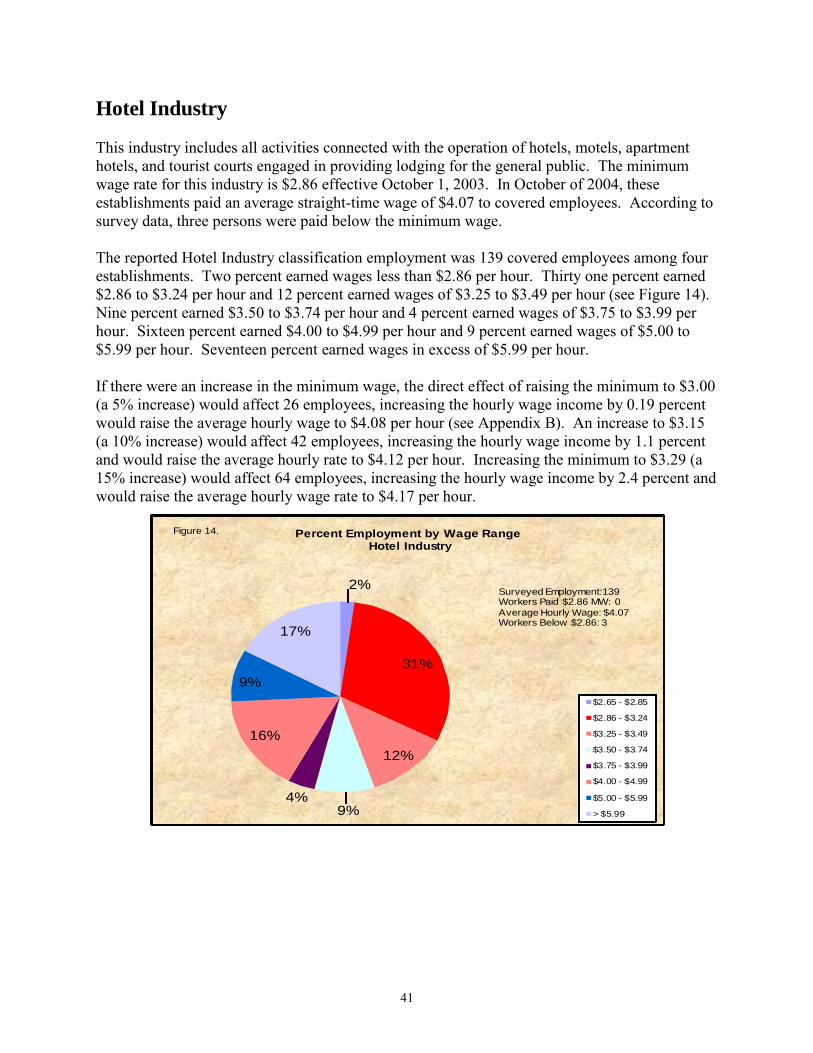
41
Hotel Industry This industry includes all activities connected with the operation of hotels, motels, apartment hotels, and tourist courts engaged in providing lodging for the general public. The minimum wage rate for this industry is $2.86 effective October 1, 2003. In October of 2004, these establishments paid an average straight-time wage of $4.07 to covered employees. According to survey data, three persons were paid below the minimum wage. The reported Hotel Industry classification employment was 139 covered employees among four establishments. Two percent earned wages less than $2.86 per hour. Thirty one percent earned $2.86 to $3.24 per hour and 12 percent earned wages of $3.25 to $3.49 per hour (see Figure 14). Nine percent earned $3.50 to $3.74 per hour and 4 percent earned wages of $3.75 to $3.99 per hour. Sixteen percent earned $4.00 to $4.99 per hour and 9 percent earned wages of $5.00 to $5.99 per hour. Seventeen percent earned wages in excess of $5.99 per hour. If there were an increase in the minimum wage, the direct effect of raising the minimum to $3.00 (a 5% increase) would affect 26 employees, increasing the hourly wage income by 0.19 percent would raise the average hourly wage to $4.08 per hour (see Appendix B). An increase to $3.15 (a 10% increase) would affect 42 employees, increasing the hourly wage income by 1.1 percent and would raise the average hourly rate to $4.12 per hour. Increasing the minimum to $3.29 (a 15% increase) would affect 64 employees, increasing the hourly wage income by 2.4 percent and would raise the average hourly wage rate to $4.17 per hour.
2%
31%
12%
9%4%
16%
9%
17%
Percent Employment by Wage RangeHotel Industry
$2.65 - $2.85
$2.86 - $3.24
$3.25 - $3.49
$3.50 - $3.74
$3.75 - $3.99
$4.00 - $4.99
$5.00 - $5.99
> $5.99
Figure 14.
Surveyed Employment:139Workers Paid $2.86 MW: 0
Average Hourly Wage: $4.07Workers Below $2.86: 3
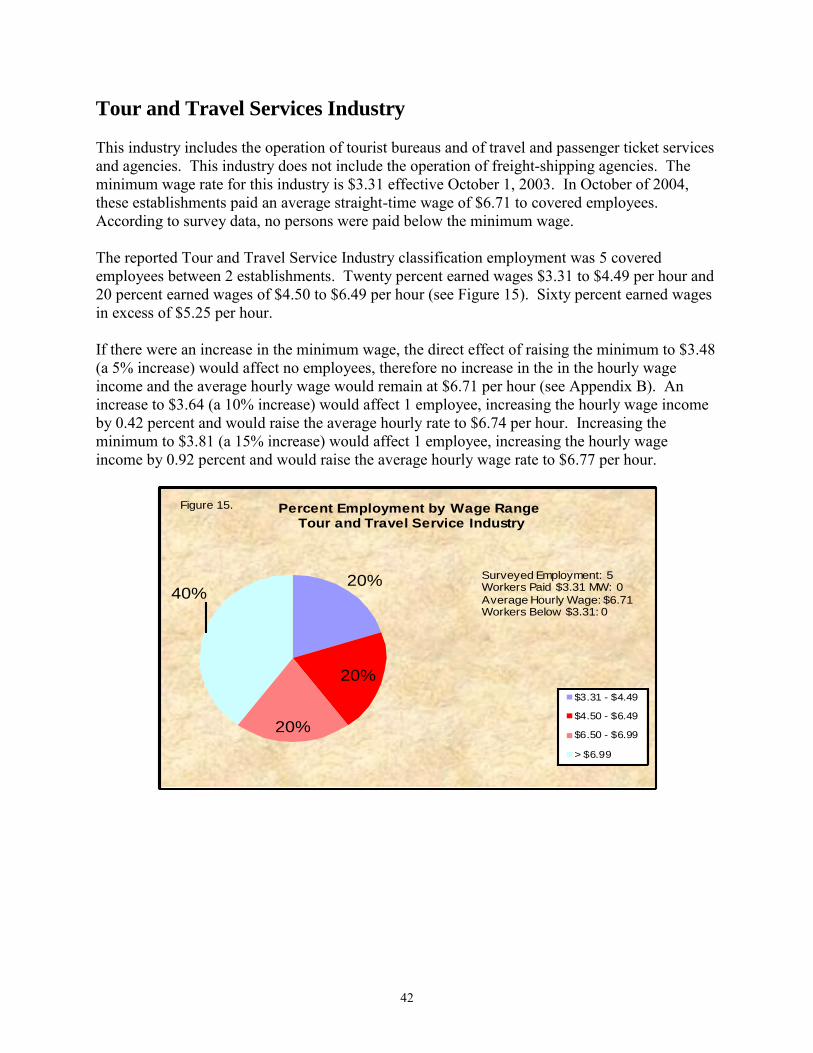
42
Tour and Travel Services Industry This industry includes the operation of tourist bureaus and of travel and passenger ticket services and agencies. This industry does not include the operation of freight-shipping agencies. The minimum wage rate for this industry is $3.31 effective October 1, 2003. In October of 2004, these establishments paid an average straight-time wage of $6.71 to covered employees. According to survey data, no persons were paid below the minimum wage. The reported Tour and Travel Service Industry classification employment was 5 covered employees between 2 establishments. Twenty percent earned wages $3.31 to $4.49 per hour and 20 percent earned wages of $4.50 to $6.49 per hour (see Figure 15). Sixty percent earned wages in excess of $5.25 per hour. If there were an increase in the minimum wage, the direct effect of raising the minimum to $3.48 (a 5% increase) would affect no employees, therefore no increase in the in the hourly wage income and the average hourly wage would remain at $6.71 per hour (see Appendix B). An increase to $3.64 (a 10% increase) would affect 1 employee, increasing the hourly wage income by 0.42 percent and would raise the average hourly rate to $6.74 per hour. Increasing the minimum to $3.81 (a 15% increase) would affect 1 employee, increasing the hourly wage income by 0.92 percent and would raise the average hourly wage rate to $6.77 per hour.
20%
20%
20%
40%
Percent Employment by Wage RangeTour and Travel Service Industry
$3.31 - $4.49
$4.50 - $6.49
$6.50 - $6.99
> $6.99
Figure 15.
Surveyed Employment: 5Workers Paid $3.31 MW: 0
Average Hourly Wage: $6.71Workers Below $3.31: 0
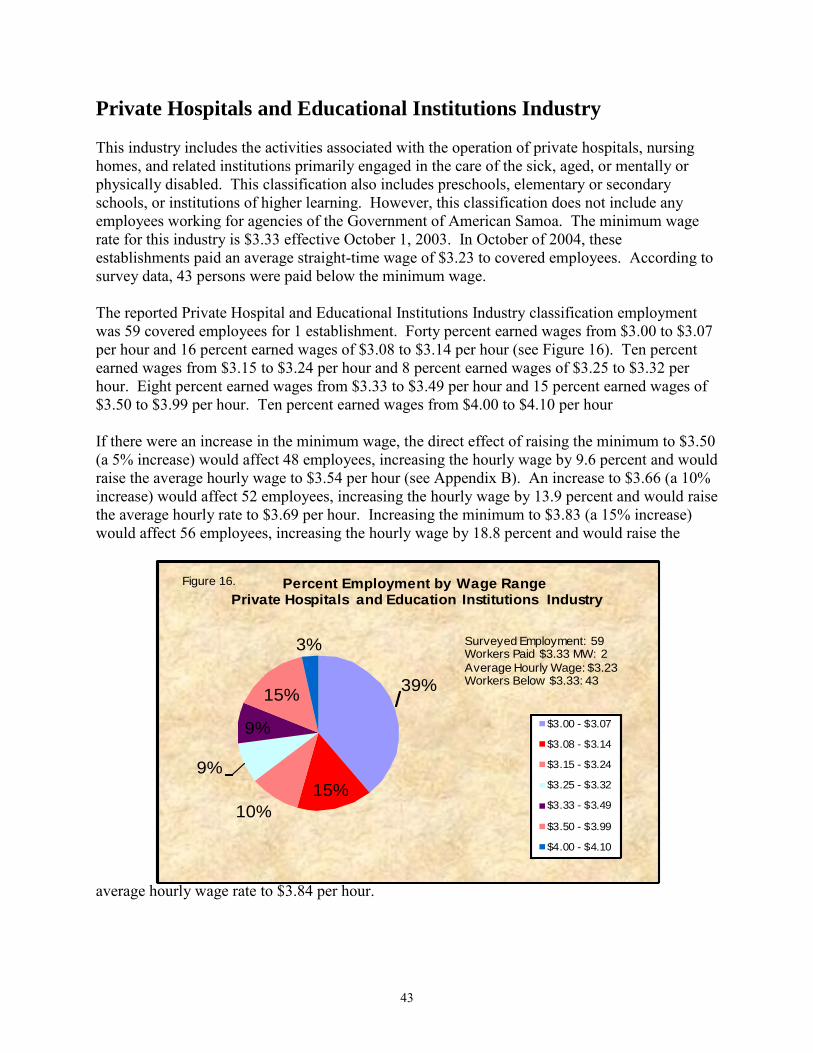
43
Private Hospitals and Educational Institutions Industry This industry includes the activities associated with the operation of private hospitals, nursing homes, and related institutions primarily engaged in the care of the sick, aged, or mentally or physically disabled. This classification also includes preschools, elementary or secondary schools, or institutions of higher learning. However, this classification does not include any employees working for agencies of the Government of American Samoa. The minimum wage rate for this industry is $3.33 effective October 1, 2003. In October of 2004, these establishments paid an average straight-time wage of $3.23 to covered employees. According to survey data, 43 persons were paid below the minimum wage. The reported Private Hospital and Educational Institutions Industry classification employment was 59 covered employees for 1 establishment. Forty percent earned wages from $3.00 to $3.07 per hour and 16 percent earned wages of $3.08 to $3.14 per hour (see Figure 16). Ten percent earned wages from $3.15 to $3.24 per hour and 8 percent earned wages of $3.25 to $3.32 per hour. Eight percent earned wages from $3.33 to $3.49 per hour and 15 percent earned wages of $3.50 to $3.99 per hour. Ten percent earned wages from $4.00 to $4.10 per hour If there were an increase in the minimum wage, the direct effect of raising the minimum to $3.50 (a 5% increase) would affect 48 employees, increasing the hourly wage by 9.6 percent and would raise the average hourly wage to $3.54 per hour (see Appendix B). An increase to $3.66 (a 10% increase) would affect 52 employees, increasing the hourly wage by 13.9 percent and would raise the average hourly rate to $3.69 per hour. Increasing the minimum to $3.83 (a 15% increase) would affect 56 employees, increasing the hourly wage by 18.8 percent and would raise the
average hourly wage rate to $3.84 per hour.
39%
15%
10%
9%
9%
15%
3%
Percent Employment by Wage RangePrivate Hospitals and Education Institutions Industry
$3.00 - $3.07
$3.08 - $3.14
$3.15 - $3.24
$3.25 - $3.32
$3.33 - $3.49
$3.50 - $3.99
$4.00 - $4.10
Figure 16.
Surveyed Employment: 59Workers Paid $3.33 MW: 2
Average Hourly Wage: $3.23Workers Below $3.33: 43
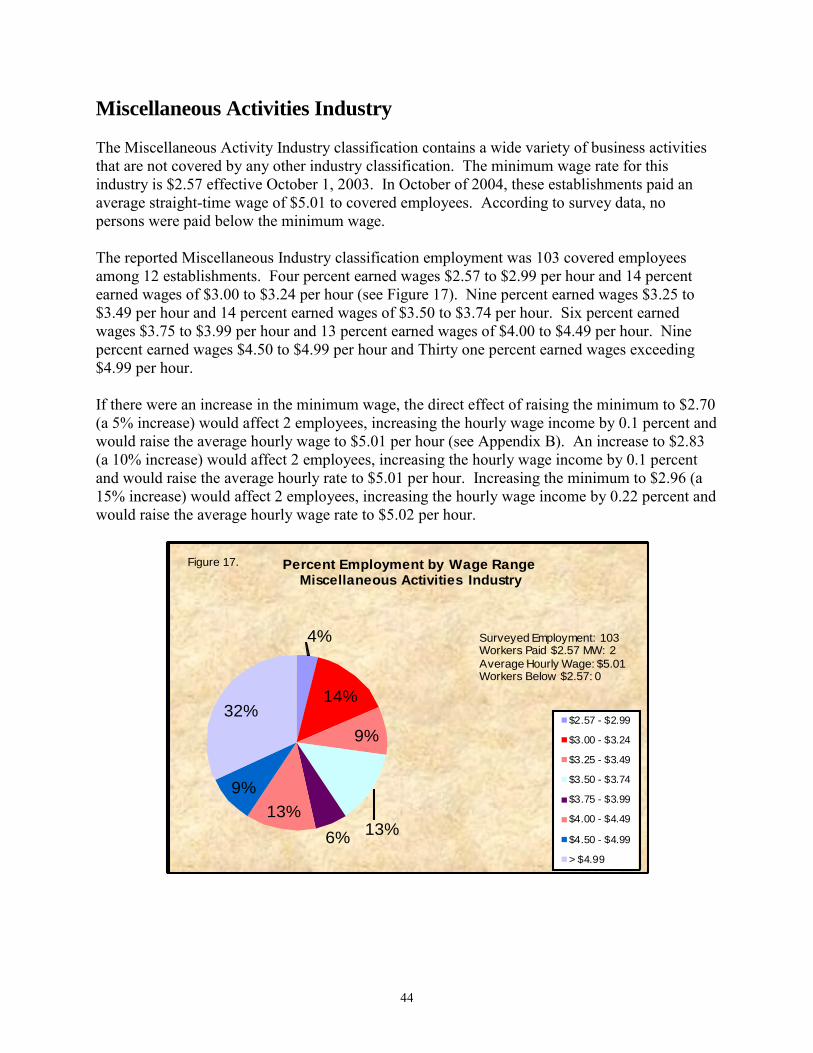
44
Miscellaneous Activities Industry The Miscellaneous Activity Industry classification contains a wide variety of business activities that are not covered by any other industry classification. The minimum wage rate for this industry is $2.57 effective October 1, 2003. In October of 2004, these establishments paid an average straight-time wage of $5.01 to covered employees. According to survey data, no persons were paid below the minimum wage. The reported Miscellaneous Industry classification employment was 103 covered employees among 12 establishments. Four percent earned wages $2.57 to $2.99 per hour and 14 percent earned wages of $3.00 to $3.24 per hour (see Figure 17). Nine percent earned wages $3.25 to $3.49 per hour and 14 percent earned wages of $3.50 to $3.74 per hour. Six percent earned wages $3.75 to $3.99 per hour and 13 percent earned wages of $4.00 to $4.49 per hour. Nine percent earned wages $4.50 to $4.99 per hour and Thirty one percent earned wages exceeding $4.99 per hour. If there were an increase in the minimum wage, the direct effect of raising the minimum to $2.70 (a 5% increase) would affect 2 employees, increasing the hourly wage income by 0.1 percent and would raise the average hourly wage to $5.01 per hour (see Appendix B). An increase to $2.83 (a 10% increase) would affect 2 employees, increasing the hourly wage income by 0.1 percent and would raise the average hourly rate to $5.01 per hour. Increasing the minimum to $2.96 (a 15% increase) would affect 2 employees, increasing the hourly wage income by 0.22 percent and would raise the average hourly wage rate to $5.02 per hour.
4%
14%
9%
13%6%
13%
9%
32%
Percent Employment by Wage RangeMiscellaneous Activities Industry
$2.57 - $2.99
$3.00 - $3.24
$3.25 - $3.49
$3.50 - $3.74
$3.75 - $3.99
$4.00 - $4.49
$4.50 - $4.99
> $4.99
Figure 17.
Surveyed Employment: 103Workers Paid $2.57 MW: 2
Average Hourly Wage: $5.01Workers Below $2.57: 0
45
Garment Manufacturing Industry This industry classification includes the manufacture of articles of apparel and clothing by knitting, sewing, spinning, and other similar processes. However, it does not include manufacturing, processing, or mending of apparel in retail or service establishments. There were no Garment Manufacturing establishments surveyed in November 2004 and this lack of survey data precluded an analysis of wage ranges or of alternative minimum wage impacts. However, it should be noted that the minimum wage rate for Garment Manufacturing was increased to $2.68 on October 1, 2002. No business classified in the garments manufacturing industry exist on the island. The minimum wage rate for this industry was set at $2.68 effective October 1, 2003. An increase in the minimum wage of 5% would raise the wage to $2.81, a 10% increase corresponds to a wage of $2.95 and a 15% increase would increase the minimum wage to $3.08.
46
Bottling, Brewing, and Dairy Products Industry This industry classification includes the bottling, sale and distribution of soft drinks and malt beverages and the processing, distribution and manufacture of milk and other dairy products There were no Bottling, Brewing and Dairy Products establishments surveyed in November 2004 and this lack of survey data precluded an analysis of wage ranges or of alternative minimum wage impacts. The two businesses that were contacted for this industry did not participate in the November 2004 survey. The minimum wage rate for this industry was set at $3.19 effective October 1, 2003. An increase in the minimum wage of 5% would raise the wage to $3.35 per hour, a 10% increase corresponds to a wage of $3.51 per hour and a 15% increase would increase the minimum wage to $3.68 per hour. .
47
V. The American Samoa Minimum Wage -
FLSA Requirements
A. Achieve Minimum Standard of Living, by Reaching the
Mainland Federal Minimum Wage, as Rapidly as is Economically
Feasible. Section 2(a) of the Fair Labor Standards Act states that the primary objective of the Act is:
“Eliminating labor conditions detrimental to the maintenance of the minimum standards of living necessary for health, efficiency, and general well being of workers…without substantially curtailing employment and earning power.”
FLSA wage policy for American Samoa, in Sec. 8(a) of the FLSA, states that the minimum wage is to reach the single mainland minimum wage as rapidly as is economically feasible, without substantially curtailing employment. Although the mainland minimum wage has not kept pace with the rate of inflation, the American Samoa minimums have increased even more slowly than the mainland minimum wage. As Figure 18 shows, for tuna canneries, the minimum dropped from about 84 percent of the mainland's minimum wage in the mid and late 1980's to 63 percent in 2001-2004. American Samoa government minimums dropped from just under 59 percent of the mainland rate in the mid to late 1980s to 54 percent in 2002-2004. Between 1977 and 1985 the gap between the cannery and mainland minimum wage first widened then narrowed substantially. In 1978 the cannery minimum was 68 percent of the mainland minimum (Figure 18) but by 1985 the percent had increased to 84. Although the cannery minimum wage has increased slowly since 1990, the gap between it and the mainland minimum wage has widened. This is largely the result of robust increases in the mainland minimum wage rate during the years 1989-1991 and 1995-1997. Figure 19 and the corresponding Appendix C table present the ratio of the minimum wage for selected American Samoa industries to the U.S. minimum wage. Note that the year 2004 tuna cannery wage ratio of 63 percent of the U.S. rate was lower than the comparable ratio for finance and insurance (77 percent), or construction (70 percent), but somewhat higher than retailing (60 percent), and significantly higher than government (54 percent) and miscellaneous industries (50 percent).
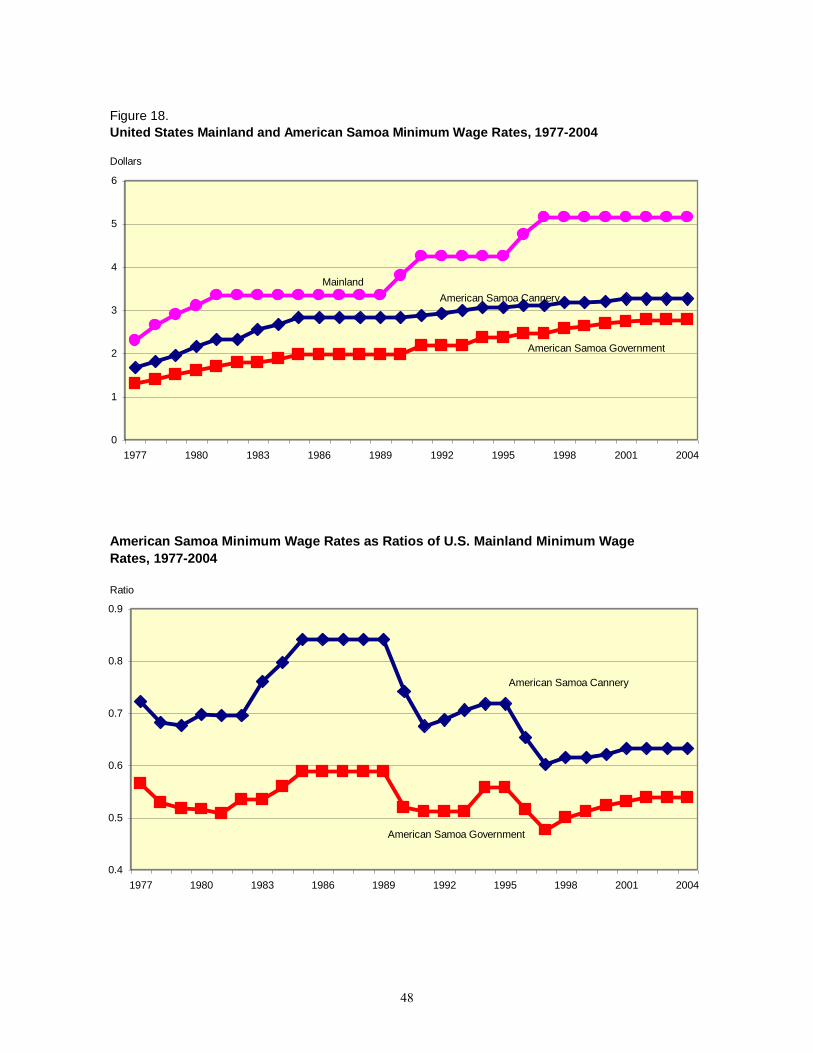
48
0
1
2
3
4
5
6
1977 1980 1983 1986 1989 1992 1995 1998 2001 2004
Figure 18.
United States Mainland and American Samoa Minimum Wage Rates, 1977-2004
Dollars
Mainland
American Samoa Cannery
American Samoa Government
0.4
0.5
0.6
0.7
0.8
0.9
1977 1980 1983 1986 1989 1992 1995 1998 2001 2004
American Samoa Minimum Wage Rates as Ratios of U.S. Mainland Minimum Wage
Rates, 1977-2004
Ratio
American Samoa Cannery
American Samoa Government
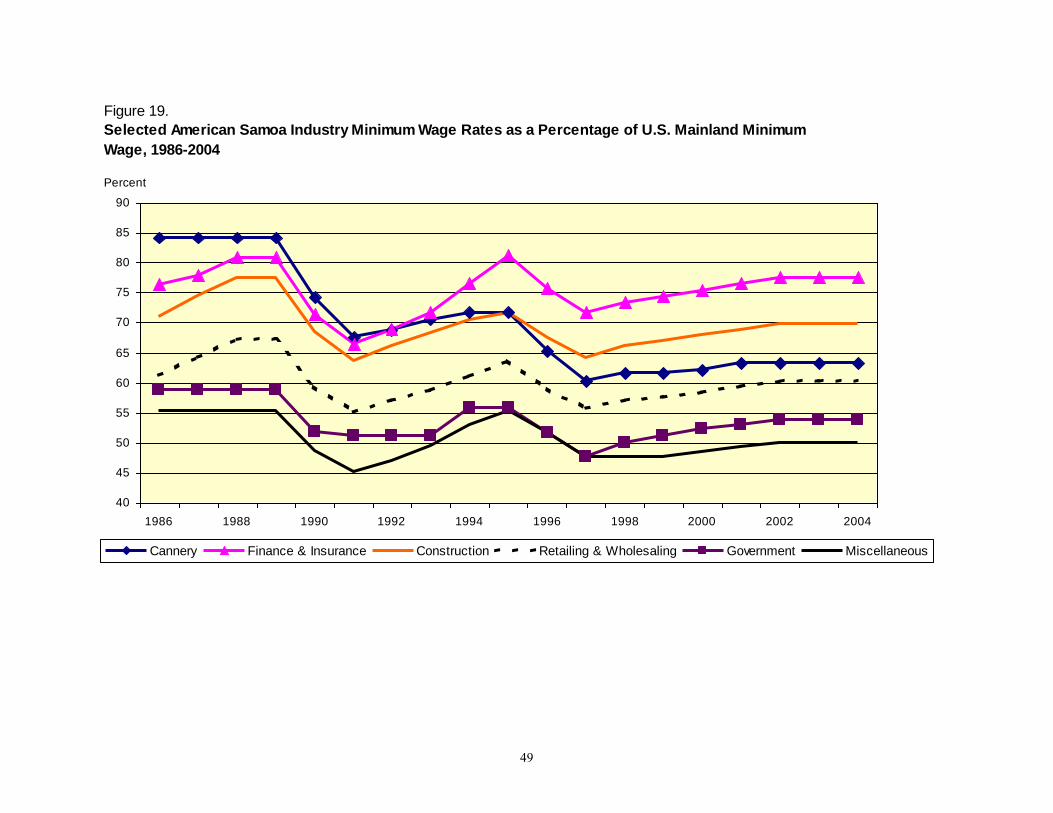
- 49 -
49
40
45
50
55
60
65
70
75
80
85
90
1986 1988 1990 1992 1994 1996 1998 2000 2002 2004
Cannery Finance & Insurance Construction Retailing & Wholesaling Government Miscellaneous
Figure 19.
Selected American Samoa Industry Minimum Wage Rates as a Percentage of U.S. Mainland Minimum
Wage, 1986-2004
Percent

- 50 -
B. Do Not Raise Minimum Wages to a Level that Substantially
Curtails Employment in the Industry The American Samoa Industry Committee is required to recommend to the Secretary industry minimums that will not be so high as to "substantially curtail employment in the industry." The Committee is required to recommend the mainland federal minimum wage unless evidence "establishes that the industry, or a predominant portion thereof is unable to pay that wage due to such economic and competitive conditions."38
American Samoa industry committees in recent years have focused primarily on that part of the FLSA wage policy that advises against establishing wage minimums that might substantially reduce employment. The committee suggests that increases in the minimum wage, specifically in the tuna industry, would result in the tuna companies relocating elsewhere.39 Measuring Ability to Pay Measuring employers' ability to pay higher minimum rates is critical to meeting the second requirement in a way that still satisfies the first requirement of reaching the Mainland minimum wage as rapidly as possible. Two key factors in such measurements are a) the percent of the total production costs that wages represent and b) the percent increase of the total wage bill resulting from a given percent increase in the minimum wage. According to the U.S. International Trade Commission40 the production of canned fish products is capital intensive.41 For fish canning, labor costs are about 13 percent of the value of shipped product.42 Investments are required for buildings and space, machinery, and other equipment. Raw fish and other materials account for the remaining cost. For tuna canneries, the largest private sector employer, it is informative to estimate by how much total production costs would rise, given a five percent increase in the minimum wage. A rough answer is found by multiplying the percent that labor costs are of total (mostly raw fish) costs--8.0 percent43--times the percent increase in the hourly wage bill, 2.5 percent (assuming that a minimum wage increase will not impact other workers).44 The result (0.025 X 0.08) is 0.2 percent, i.e., one-fifth of one percent. (A more thorough discussion of these 38 American Samoan employers have generally not made available profit information that would assist the Committee in making this determination. See 29C.F.R. Part 511.10 (a). 39 Report of American Samoa Industry Committee Number 25, June 2003. 40 U.S. International Trade Commission, Industry and Trade Summary: Canned Fish except Shellfish, Publication 3083, January 1998. 41 Although the Commission report summarized canned fish production in general, it stated that canned tuna comprised almost 75 percent of the canned fish industry in 1996. 42 U.S. International Trade Commission, Industry and Trade Summary: Canned Fish except Shellfish, Publication 3083, January 1998. 43 U.S. International Trade Commission, Industry and Trade Summary: Canned Fish except Shellfish, Publication 3083, January 1998. 44 A five percent increase in the minimum wage will increase direct labor costs 2.5 percent. This assumes only those workers at or below the previous minimum wage are impacted. See Appendix B.
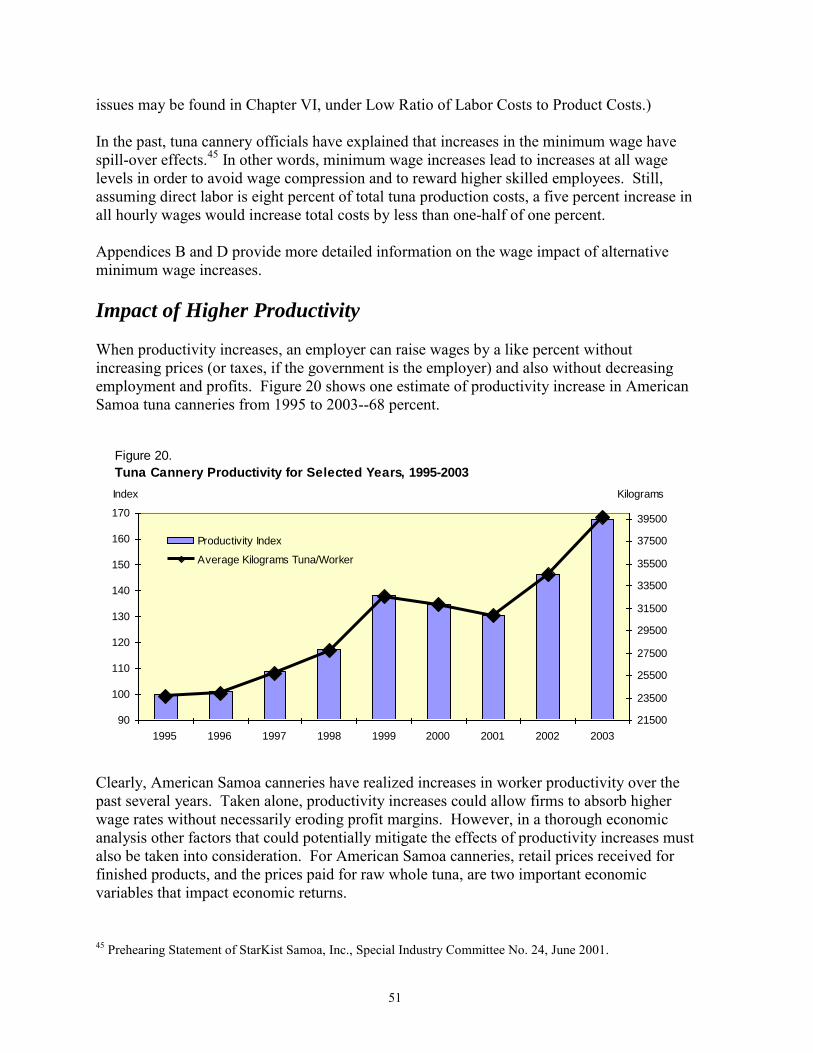
51
issues may be found in Chapter VI, under Low Ratio of Labor Costs to Product Costs.) In the past, tuna cannery officials have explained that increases in the minimum wage have spill-over effects.45 In other words, minimum wage increases lead to increases at all wage levels in order to avoid wage compression and to reward higher skilled employees. Still, assuming direct labor is eight percent of total tuna production costs, a five percent increase in all hourly wages would increase total costs by less than one-half of one percent. Appendices B and D provide more detailed information on the wage impact of alternative minimum wage increases. Impact of Higher Productivity When productivity increases, an employer can raise wages by a like percent without increasing prices (or taxes, if the government is the employer) and also without decreasing employment and profits. Figure 20 shows one estimate of productivity increase in American Samoa tuna canneries from 1995 to 2003--68 percent.
Figure 20.
Tuna Cannery Productivity for Selected Years, 1995-2003
90
100
110
120
130
140
150
160
170
1995 1996 1997 1998 1999 2000 2001 2002 2003
21500
23500
25500
27500
29500
31500
33500
35500
37500
39500
Productivity Index
Average Kilograms Tuna/Worker
Index Kilograms
Clearly, American Samoa canneries have realized increases in worker productivity over the past several years. Taken alone, productivity increases could allow firms to absorb higher wage rates without necessarily eroding profit margins. However, in a thorough economic analysis other factors that could potentially mitigate the effects of productivity increases must also be taken into consideration. For American Samoa canneries, retail prices received for finished products, and the prices paid for raw whole tuna, are two important economic variables that impact economic returns. 45 Prehearing Statement of StarKist Samoa, Inc., Special Industry Committee No. 24, June 2001.
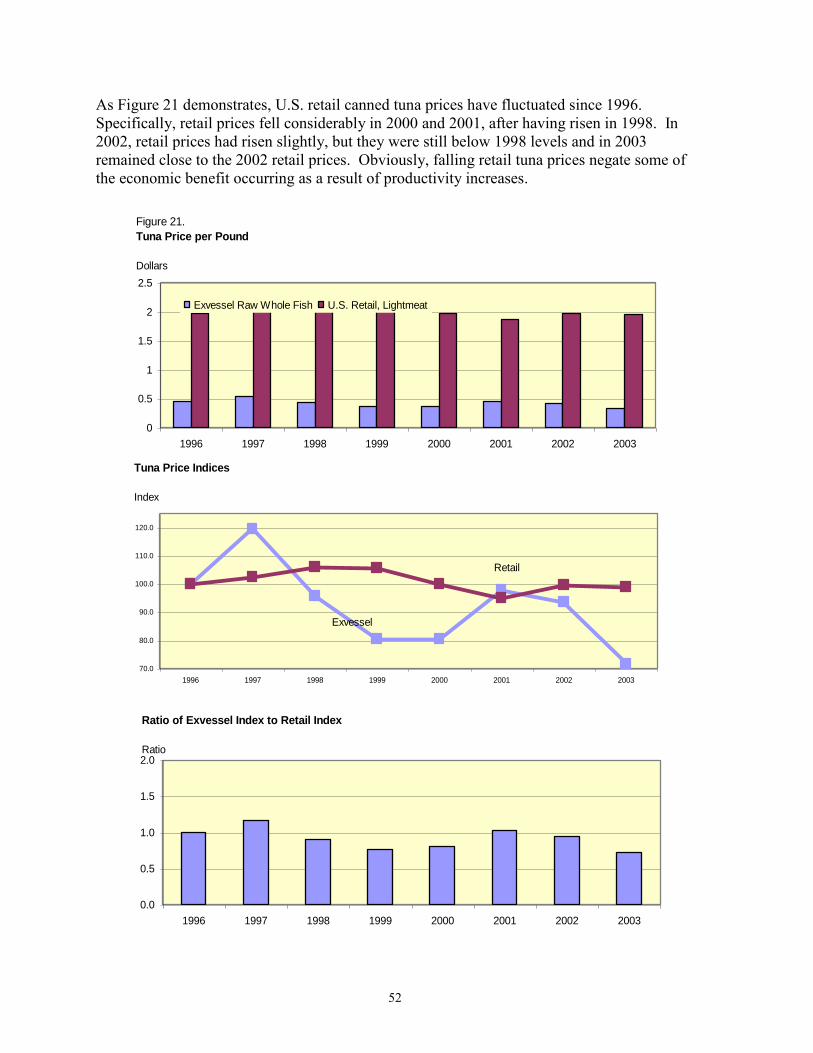
52
As Figure 21 demonstrates, U.S. retail canned tuna prices have fluctuated since 1996. Specifically, retail prices fell considerably in 2000 and 2001, after having risen in 1998. In 2002, retail prices had risen slightly, but they were still below 1998 levels and in 2003 remained close to the 2002 retail prices. Obviously, falling retail tuna prices negate some of the economic benefit occurring as a result of productivity increases.
0
0.5
1
1.5
2
2.5
1996 1997 1998 1999 2000 2001 2002 2003
Exvessel Raw Whole Fish U.S. Retail, Lightmeat
70.0
80.0
90.0
100.0
110.0
120.0
1996 1997 1998 1999 2000 2001 2002 2003
Tuna Price Indices
Index
Retail
Exvessel
Figure 21.
Tuna Price per Pound
Dollars
0.0
0.5
1.0
1.5
2.0
1996 1997 1998 1999 2000 2001 2002 2003
Ratio of Exvessel Index to Retail Index
Ratio
53
Figure 21 also illustrates an decreasing ratio of the price of the raw whole fish paid by the cannery to the fishing vessel ("exvessel price") to the retail price, for the latest year for which the latter data are available. Since 2001 the price paid to the fishing vessels have dropped to a 8-year low. Lower exvessel prices may also be an indirect indicator of an increasing ability of canneries to absorb a higher minimum wage rate. In terms of percentage change, exvessel prices rose considerably between 2000 and 2001; however, there has been downward pressure on exvessel prices and in 2003 they were at their lowest point in recent years. Before 1999, the tuna industry encouraged an increased supply of raw tuna to lower prices and increase sales. The result, however, was a worldwide glut of raw fresh frozen tuna offloaded from fishing vessels, causing steep declines in exvessel prices from 1997 to 1999. In response, widespread actions were taken by such vessels to stay in port for long periods of time to lower supply and boost exvessel prices. Canneries competed by cutting prices to retailers. Price reductions were further encouraged by only modest growth in U.S. consumer demand for canned tuna, and competitive pressure caused by currency devaluation in Thailand and other canned tuna exporter nations. C. Set Minimums that Do Not Give a Competitive Advantage
Over Counterpart U.S. Industries As reflected in Table V A, from 1974 to 1987, the mainland U.S. percentage of total U.S. tuna cannery employment dropped from 45 percent to approximately 7.6 percent, while American Samoa's portion increased from nine percent to more than 30 percent. This shift in production came about as seven out of eight California canneries shut down, eliminating more than 5,000 of its 6,000 tuna processing jobs. At the same time, Puerto Rico increased its tuna cannery jobs from about 6,000 to 8,000, and American Samoa increased from about 1,200 to almost 4,000. The total increase in the two territories was 4,800 jobs, just 200 fewer than jobs lost on the U.S. mainland. From 1987 to 1998, American Samoa’s tuna processing employment continued to grow, while Puerto Rico’s industry employment fell significantly. Specifically, the American Samoa portion of the U.S. total increased from 31 percent to about 72 percent, while Puerto Rico’s total fell from 62 percent to about 14 percent. The transfer of processing employment coincides with the increase of Puerto Rico’s minimum wage to the Mainland’s rate in the late 1980s. This made American Samoa as a more attractive location to process tuna due to the cost benefits associated with lower labor costs and duty free status on canned tuna. Thus, between 1974 and 1998, American Samoa’s tuna processing employment as a percent of the U.S. total has gained by a multiple of eight times, while the mainland and Puerto Rico employment have been drastically reduced. By 2002, only a small number of tuna cannery workers were employed in Puerto Rico or on the U.S. Mainland. By comparison, the number of tuna processing workers employed in American Samoa had remained almost constant since 1998. Canneries in American Samoa now account for more than 85 percent of total U.S. tuna cannery employment.
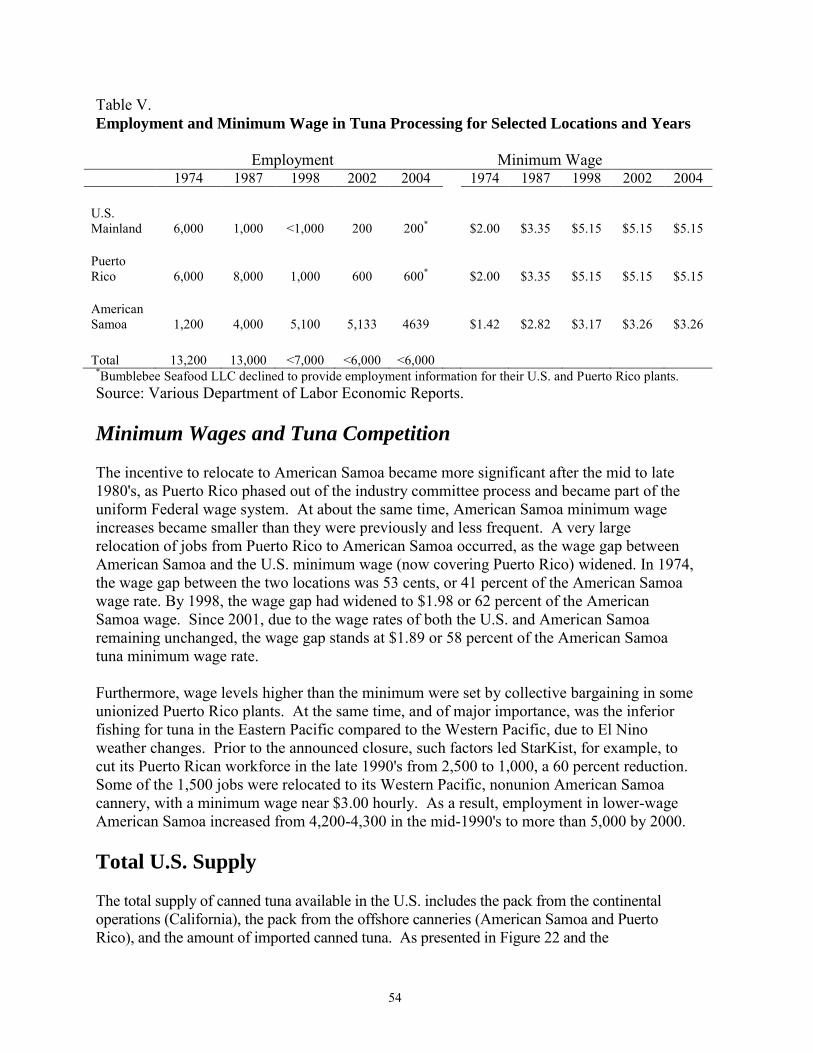
54
Table V. Employment and Minimum Wage in Tuna Processing for Selected Locations and Years
Employment Minimum Wage
1974 1987 1998 2002 2004 1974 1987 1998 2002 2004
U.S. Mainland
6,000
1,000
<1,000
200
200*
$2.00
$3.35
$5.15
$5.15
$5.15
Puerto Rico
6,000
8,000
1,000
600
600*
$2.00
$3.35
$5.15
$5.15
$5.15
American Samoa
1,200
4,000
5,100
5,133
4639
$1.42
$2.82
$3.17
$3.26
$3.26
Total 13,200 13,000 <7,000 <6,000 <6,000
*Bumblebee Seafood LLC declined to provide employment information for their U.S. and Puerto Rico plants. Source: Various Department of Labor Economic Reports. Minimum Wages and Tuna Competition The incentive to relocate to American Samoa became more significant after the mid to late 1980's, as Puerto Rico phased out of the industry committee process and became part of the uniform Federal wage system. At about the same time, American Samoa minimum wage increases became smaller than they were previously and less frequent. A very large relocation of jobs from Puerto Rico to American Samoa occurred, as the wage gap between American Samoa and the U.S. minimum wage (now covering Puerto Rico) widened. In 1974, the wage gap between the two locations was 53 cents, or 41 percent of the American Samoa wage rate. By 1998, the wage gap had widened to $1.98 or 62 percent of the American Samoa wage. Since 2001, due to the wage rates of both the U.S. and American Samoa remaining unchanged, the wage gap stands at $1.89 or 58 percent of the American Samoa tuna minimum wage rate. Furthermore, wage levels higher than the minimum were set by collective bargaining in some unionized Puerto Rico plants. At the same time, and of major importance, was the inferior fishing for tuna in the Eastern Pacific compared to the Western Pacific, due to El Nino weather changes. Prior to the announced closure, such factors led StarKist, for example, to cut its Puerto Rican workforce in the late 1990's from 2,500 to 1,000, a 60 percent reduction. Some of the 1,500 jobs were relocated to its Western Pacific, nonunion American Samoa cannery, with a minimum wage near $3.00 hourly. As a result, employment in lower-wage American Samoa increased from 4,200-4,300 in the mid-1990's to more than 5,000 by 2000. Total U.S. Supply The total supply of canned tuna available in the U.S. includes the pack from the continental operations (California), the pack from the offshore canneries (American Samoa and Puerto Rico), and the amount of imported canned tuna. As presented in Figure 22 and the
55
corresponding Appendix C table, U.S. supply dropped to 419 thousand tons in 1997 before climbing to 514 thousand tons in 1999.46 However, in 2001, U.S. supply was below 400 thousand tons. Since 2001 there has been an increase in the U.S. supply with the U.S. supply for 2003, nearly 500 thousand tons. U.S. production remained relatively stable from 1998 to 2000, between 335 and 346 thousand tons. This was greater than U.S. production in 1994 and 1997, which ranged from 304 to 313 thousand tons respectively. The percentage of U.S. supply from imports (the import penetration ratio), accordingly, was relatively high in 1994—29 percent, dropping to 22 percent in 1996, and climbing since. By 2001 the import penetration ratio was at 36 percent, although quantity of tuna imports had declined since 1999. Also in 2001 the U.S. production fell to 253 thousand tons, a drop of more than 25 percent from 346 thousand tons just two years earlier. Reduced production in 2001 resulted in the lowest U.S. pack since at least 1987. In 2002 the percentage of U.S. supply coming from imports was at 40 percent. Imports in 2003 rose six percent to 46 percent of total U.S. supply. Although imports have been a significant part of total U.S. supply of tuna, domestic production remained relatively constant throughout the 1990s. Except for 2001, domestic production either increased slightly or held steady. This occurred as U.S. production from California and Puerto Rico moved to American Samoa, and while significant minimum wage increases first affected the mainland, then Puerto Rico. U.S. production has remained fairly constant from 2001 to 2003 while the amount of imports rose from 146 thousand tons in 2001 to 229.5 million tons in 2003.
46 U.S. Department of Commerce, Fisheries of the United States, various years, NOAA.
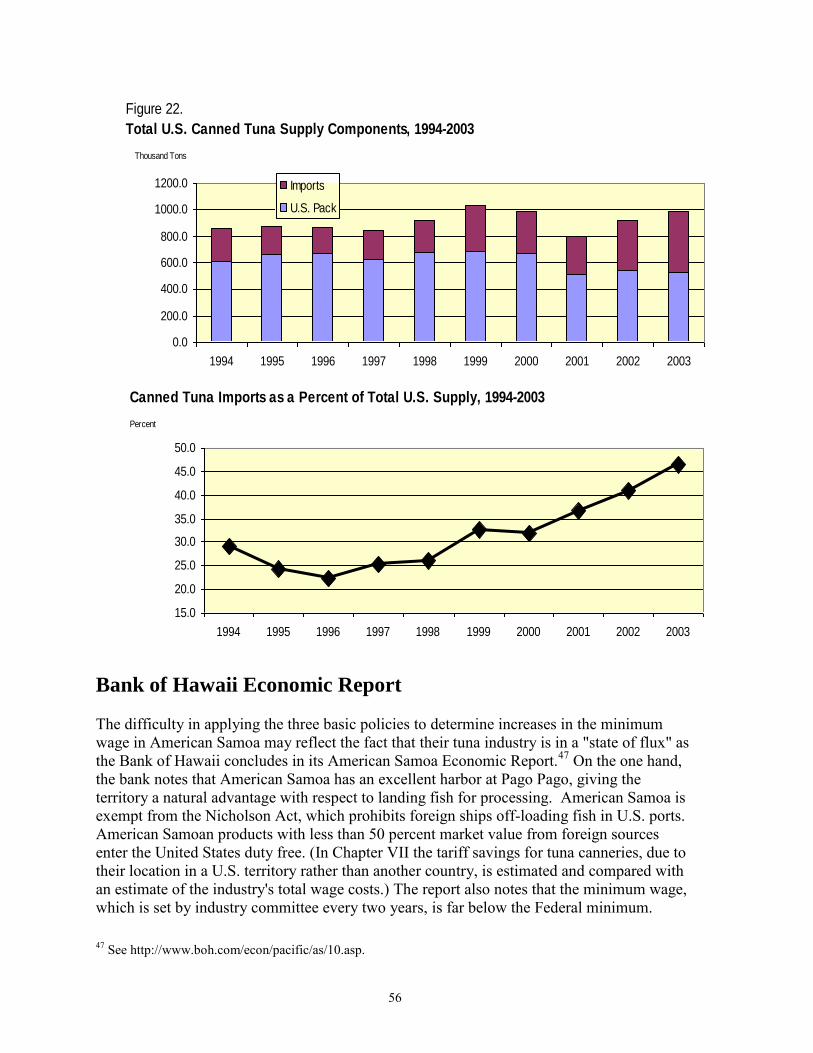
56
Figure 22.
Total U.S. Canned Tuna Supply Components, 1994-2003
0.0
200.0
400.0
600.0
800.0
1000.0
1200.0
1994 1995 1996 1997 1998 1999 2000 2001 2002 2003
Imports
U.S. Pack
Thousand Tons
Canned Tuna Imports as a Percent of Total U.S. Supply, 1994-2003
15.0
20.0
25.0
30.0
35.0
40.0
45.0
50.0
1994 1995 1996 1997 1998 1999 2000 2001 2002 2003
Percent
Bank of Hawaii Economic Report The difficulty in applying the three basic policies to determine increases in the minimum wage in American Samoa may reflect the fact that their tuna industry is in a "state of flux" as the Bank of Hawaii concludes in its American Samoa Economic Report.47 On the one hand, the bank notes that American Samoa has an excellent harbor at Pago Pago, giving the territory a natural advantage with respect to landing fish for processing. American Samoa is exempt from the Nicholson Act, which prohibits foreign ships off-loading fish in U.S. ports. American Samoan products with less than 50 percent market value from foreign sources enter the United States duty free. (In Chapter VII the tariff savings for tuna canneries, due to their location in a U.S. territory rather than another country, is estimated and compared with an estimate of the industry's total wage costs.) The report also notes that the minimum wage, which is set by industry committee every two years, is far below the Federal minimum. 47 See http://www.boh.com/econ/pacific/as/10.asp.
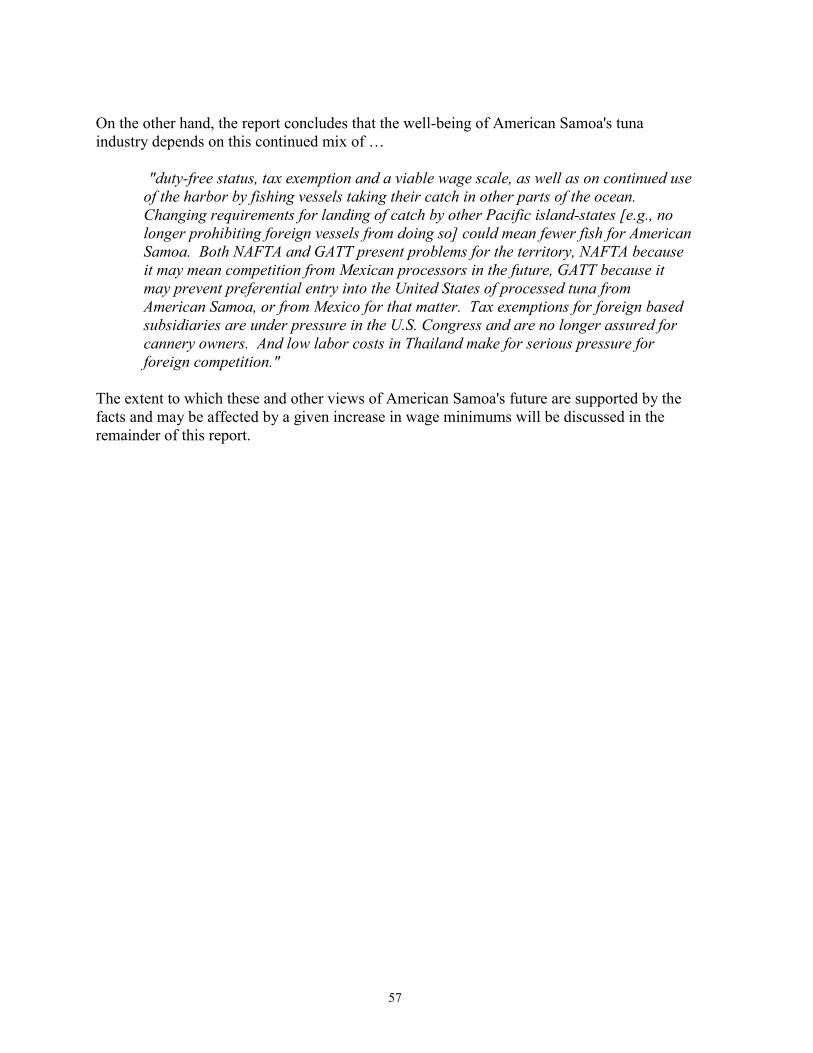
57
On the other hand, the report concludes that the well-being of American Samoa's tuna industry depends on this continued mix of …
"duty-free status, tax exemption and a viable wage scale, as well as on continued use of the harbor by fishing vessels taking their catch in other parts of the ocean. Changing requirements for landing of catch by other Pacific island-states [e.g., no longer prohibiting foreign vessels from doing so] could mean fewer fish for American Samoa. Both NAFTA and GATT present problems for the territory, NAFTA because it may mean competition from Mexican processors in the future, GATT because it may prevent preferential entry into the United States of processed tuna from American Samoa, or from Mexico for that matter. Tax exemptions for foreign based subsidiaries are under pressure in the U.S. Congress and are no longer assured for cannery owners. And low labor costs in Thailand make for serious pressure for foreign competition."
The extent to which these and other views of American Samoa's future are supported by the facts and may be affected by a given increase in wage minimums will be discussed in the remainder of this report.
58
VI. Economic Factors for Consideration that May Favor
Minimum Wage Increases
America Samoa Government Possible Balanced Budgets The government plays an important role in the American Samoan economy. Government employment accounts for over one-third of total covered employment, and government payroll and other expenditures cause a "multiplier effect" to impact on the workings of the overall economy. The American Samoa Government in Fiscal Year 1997 received revenues totaling $182.2 million and expended about $182.4 million,48 resulting in a deficit of $0.2 million. The cumulative deficit totaled $17.9 million by the end of fiscal year 2001. Local contributions (taxes and fees) accounted for 25 percent of total revenue in 2001. Grant revenues of $89 million accounted for about 50 percent of all government revenues in 2001. This proportion was lower from previous years due to $46 million dollars in revenue for insurance claims from hurricane relief. Adding to the deficit problem is the decrease (in real dollars) in Department of the Interior (DOI) operating grants. For more than a decade these grant amounts remained virtually unchanged ($23.2 million in 1993 to $22.8 million in 2004).49 However, capital improvement project grants issued by the DOI have increased during the same time period (from $508 thousand in 1993 to $5.1 million in 2001). In 2003 capital improvement grants totaled $10 million.50 Capital improvement grants are used to supplement revenue when a lack of local funding poses a threat to health or safety or when improvements are necessary for economic development.51 In addition to DOI operating and capital improvement grants, U.S. federal expenditures to American Samoa exceeded $1 billion for FY 1995-2001.52 Government Policies Reducing Business Costs Tariff Savings Territories such as American Samoa are outside the customs territory of the United States. Their products, however, are accorded duty-free entry into U.S. commerce if they meet the criterion of not more than 50 percent foreign component value. Canned tuna, regardless of the
48 American Samoa Department of Treasury, Territory of American Samoa Comprehensive Annual Financial Report, 2001. 49 Grant amounts for 2004 from DOI Fiscal Year 2005 Budget. 50 From Samoa News (on samoanews.com) on 6/3/2003. 51 U.S. Department of the Interior, A Report on the State of the Islands 1999, available at http://www.doi.gov/oia/pdf/oldislands.pdf. 52 Summary of Federal Expenditures to American Samoa for Fiscal Year 1995 to 2001.
59
origin of the raw fish, easily meets this exemption. General Note 3(a) of the Harmonized Tariff Schedule of the United States provides this benefit.
A rough estimate can be made of the two American Samoa fish processors' tariff savings due to their location in a tariff-free U.S. Territory. If the threat of processors to relocate some or all production to another country were carried out, some locations might be relatively satisfactory for tuna fish processing, but the processors would no longer be exempt from U.S. tariffs. Ghana, for example, is an underdeveloped nation with very low labor costs, and for whom certain designated products are given preference via an absence of tariff, pursuant to the GSP (Generalized System of Preferences). But canned tuna is not one of those designated products. (In fact, StarKist already has a processing plant in Ghana that exports to European markets.) Thailand and the Philippines--the two leading exporters of canned tuna to the U.S.--are also in prime tuna fishing locations where labor costs are low, but where tariff savings would be lost. As was already mentioned, Ecuador, under ATPA, can export certain products to the United States without paying tariffs; however, canned tuna does not enter duty-free. In 2003, more than $5.7 million in tariff savings would be lost for every 10 percent of processed canned tuna production reallocated to such low labor cost countries. For those countries mentioned above, the 6 percent tariff for exports below the quota, and 12.5 percent tariff for exports above it, is not, or not about to be, removed. Tuna not in oil: American Samoa shipped $408 million (144 million kilograms) of
canned tuna not packed in oil to the United States mainland in 2003. The tariff savings lost on this amount would range from $40.5 million to $45.8 million. The lower end of the range assumes all of the $80.7 million of imports below quota were from the two tuna processors relocating from American Samoa and were dutiable at only 6 percent. The higher end of the range assumes that none of these imports were below quota.53
Tuna in oil: For the $59.6 million of tuna in oil shipped to the U.S., there would be a single rate of 35 percent. Tariff savings lost would be (0.35 x $59.6 million) = $20.8 million.
Total tariff savings lost: $52.3 million to $57.6 million. As in most types of economic projections, other factors might come into play to make these estimates too low or too high. But all else being equal, the above scenario would total $5.2
53 Calculations for the lower range: Assume all below-quota imports are from the relocated processors. Then multiply 6 percent times the $80.7 million quota, to get $4.8 million in below quota duties. Subtract $80.7 million from $367 million total imports to get $286.3 million in imports above quota at 12.5 percent, or $35.7 million in above-quota duties. Under this assumption, total duties for canned tuna not in oil are approximately $40 million. On the other hand, if it were assumed that none of the imports were shipped in time to benefit from the below-quota tariff, there would be a flat 12.5 percent above-quota duty for total imports of $367 million, or $45.8 million. Given the large market share that StarKist and Chicken of the Sea have of the U.S. market, it is likely that much of their shipments would come in under quota. Sources: U.S. Department of Commerce, U.S. Trade with Puerto Rico and U.S. Possessions, 2003, and U.S. Department of Commerce, Fisheries of the United States, 2003, NOAA.
60
to $5.7 million loss of tariff savings, for every 10 percent of production relocated. In any case, the total annual wages of the American Samoan tuna processor’s workers is estimated to be about $34 million (4639 workers x $3.60 average hourly wage x 40 hour week x 50 weeks), which is more than covered by the current annual tariff savings of over $50 million. One factor that is changing is the gradual phasing out of the tariff barrier for Mexico and other South American countries. As of 2004, it had a tariff rate for canned tuna not in oil of only 1.6 percent below the quota and 3.3 percent above the quota. These rates are being phased out altogether pursuant to NAFTA and will be zero by January 1, 2008. Meanwhile, the NOAA Fisheries’ “affirmative finding” for Mexico and other countries allow them to meet U.S. dolphin-safe requirements on tuna imports. In addition, changes in weather patterns appear to indicate that tuna may again be more plentiful in the eastern Pacific, although the western Pacific will continue to be an abundant area for tuna. The same NAFTA phase-out schedule for canned tuna will apply to Caribbean Basin countries, which were eligible to apply for NAFTA rates in October 2000. As of March 2001, 12 of the 24 eligible countries had applied54. Also, to offset adverse effects of the Caribbean phase-out on the Andean countries of Bolivia, Colombia, Ecuador and Peru, Congress may also bring such countries under a similar tariff phase-out schedule in the future (ATPA, which, unlike NAFTA, has no tariff phase-out).55 Ecuador thus could join Mexico as a major canned tuna exporter with increasingly lower tariffs in its U.S. exports in the coming decade. Under the Generalized System of Preferences canned tuna may also be shipped duty-free by countries designated as least-developed nations. The Harmonized Tariff Schedule also allows duty free status for those countries in the following agreements: United States – Australia Free Trade Agreement, North American Free Trade Agreement, African Growth and Opportunity Act, United States – Israel Free Trade Area and United States – Jordan Free Trade Implementation Act. Most of the included countries that are allowed to export canned tuna duty-free to the U.S. and are not significant exporters, e.g. Canada and Israel. Tax Treatment The U.S. tuna industry in American Samoa enjoys Federal and local tax benefits that apply to U.S. territories. Pursuant to Section 936 of the Internal Revenue Act (26 U.S.C. 936) a domestic corporation is allowed a tax credit equal to the taxable income from the active conduct of a trade or business in the U.S. territories. Thus, income derived from operations in American Samoa is effectively exempted from U.S. corporate income taxes. Section 936 is scheduled to expire effective January 1, 2006. The loss of this advantage has the potential to be a damaging blow to the profits of the American Samoa cannery causing possible relocation. Congressman Faleomavaega announced on February 8 2005 that he
54 Caribbean Basin Trade Partnership Act, http://www.mac.gov/CBI/WebMain/intro.htm. 55 ATPA was renewed in August of 2002 and canned tuna is still exempt from duty-free status.
61
introduced legislation H.R. 629 to extend or make permanent the benefits of Section 936 to American Samoa56. At the time of this report, no timeline of congressional review is known. American Samoa provides substantial exemptions from its own tax laws to the tuna processing industry and some other employers. The Tax Exemption Board of the Government of American Samoa may provide temporary income tax exemption to activities that will further the economic development of the Territory. The two U.S. canneries located in American Samoa are among the firms with such exempt status. Tax rates imposed by American Samoa against corporate income are the same as those of the U.S. Government, when they are applied. With the exception of American Samoa and Guam, foreign-flag fishing vessels are not permitted to land their catch in United States ports under the Nicholson Act. Tuna canneries outside of American Samoa may purchase tuna from foreign fishing vessels through regular commercial channels in the form of transshipment to a cargo ship at some transshipment point. Canneries in American Samoa can buy directly from foreign fishing fleets and the foreign vessels are permitted to land their catch on the cannery docks. Much of the tuna processed at Samoan canneries is from U.S.-flag purse seiners. Fish are also obtained from foreign longline vessels, mainly Korean and Taiwanese. America Samoa canneries usually pay lower prices for raw fish than Southeast Asia competitors. The latter buy raw fish from carrier boats that have purchased the tuna from fishing vessels. America Samoa canneries buy directly from the fishing boats due to its location and excellent harbor side facilities. Low Ratio of Labor Cost to Product Cost Raw tuna is the single largest cost for U.S. canned tuna production, accounting for 70 to 75 percent of total costs. Other raw materials (consisting of cans, labels and packaging material) represent 10 to 15 percent. The direct labor costs, as a percent of labor plus materials, is about 8 percent. It is less than the average for other seafood products, as the table VIA shows.57 As calculations in Chapter V showed, if the tuna cannery minimum wage in American Samoa were increased 5 percent, assuming no spill-over effects, it would result in a 2.5 percent increase in total hourly earnings for all workers. Multiplying that in turn by 8 percent gives a total increase of labor and materials cost in hourly earnings of 0.2 percent, or less than one-third of one percent. Even if all wages increased by a full 5 percent, the increase in total costs for labor and materials would be approximately 0.4 percent.
56 Press Release from Congressman Faleomavaega, February 17, 2005. 57 Data from U.S. Bureau of the Census, Annual Survey of Manufacturers, 2001.
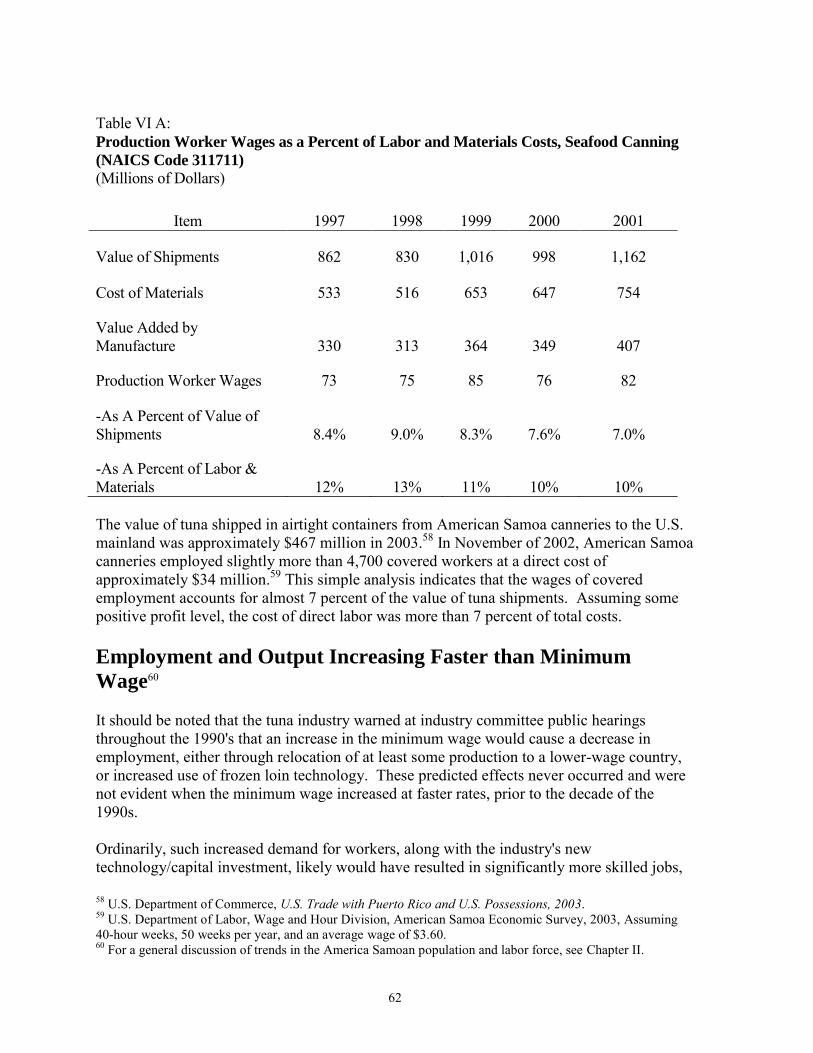
62
Table VI A: Production Worker Wages as a Percent of Labor and Materials Costs, Seafood Canning
(NAICS Code 311711)
(Millions of Dollars)
Item 1997 1998 1999 2000 2001
Value of Shipments 862 830 1,016 998 1,162
Cost of Materials 533 516 653 647 754
Value Added by Manufacture 330 313 364 349 407
Production Worker Wages 73 75 85 76 82
-As A Percent of Value of Shipments 8.4% 9.0% 8.3% 7.6% 7.0%
-As A Percent of Labor & Materials 12% 13% 11% 10% 10% The value of tuna shipped in airtight containers from American Samoa canneries to the U.S. mainland was approximately $467 million in 2003.58 In November of 2002, American Samoa canneries employed slightly more than 4,700 covered workers at a direct cost of approximately $34 million.59 This simple analysis indicates that the wages of covered employment accounts for almost 7 percent of the value of tuna shipments. Assuming some positive profit level, the cost of direct labor was more than 7 percent of total costs. Employment and Output Increasing Faster than Minimum
Wage60 It should be noted that the tuna industry warned at industry committee public hearings throughout the 1990's that an increase in the minimum wage would cause a decrease in employment, either through relocation of at least some production to a lower-wage country, or increased use of frozen loin technology. These predicted effects never occurred and were not evident when the minimum wage increased at faster rates, prior to the decade of the 1990s. Ordinarily, such increased demand for workers, along with the industry's new technology/capital investment, likely would have resulted in significantly more skilled jobs, 58 U.S. Department of Commerce, U.S. Trade with Puerto Rico and U.S. Possessions, 2003. 59 U.S. Department of Labor, Wage and Hour Division, American Samoa Economic Survey, 2003, Assuming 40-hour weeks, 50 weeks per year, and an average wage of $3.60. 60 For a general discussion of trends in the America Samoan population and labor force, see Chapter II.
63
higher increases in wages, and much less wage compression. The increased demand for tuna workers by the two canneries in American Samoa did in fact push the wage ceiling somewhat higher, i.e. "decompressed" it. For example, in 1998, 13.2 percent of workers earned more than 20 percent higher than the minimum wage, compared to 9.2 percent in 1992, while employment increased by 20 percent. But the major technology advances described below would seem to have allowed even more wage decompression in that six-year period. In economic terms, the tuna processing industry is by far the largest buyer of private sector semi-skilled labor in American Samoa. Competition for the large numbers of such workers is insignificant. The absence of a very competitive labor market gives the industry greater influence in setting wages for those kinds of jobs. In addition, a large tuna cannery labor supply from Western Samoa, with much lower average wages, reinforces downward pressure on American Samoa wages.61 Limited Use of Frozen Loins in American Samoa Although StarKist has expanded its production capacity with new technology that allows the processing of frozen loins, there has been little reduction in use of whole fish. The primary reason is the relative abundance of fresh or frozen raw whole tuna in the region. Also, StarKist and Chicken of the Sea have developed methods of maximizing yield (the amount of edible tuna meat) based on experience at relatively long-established production facilities, reflecting sizable capital investment. These processors have also had long-term relationships with vessels providing whole fish with known fishing methods and quality records. StarKist's production for the U.S. market is centered on the American Samoa cannery. Conversion to using loins involves an initial lowering of output, as well as retraining of the labor force, that has led to reluctance by StarKist to shift a major share of production to loin processing.62 In American Samoa, StarKist has used microwave technology for cooking frozen loins as an add-on, rather than as a replacement for all of its whole-fish processing. (The result has been about 10 percent greater output.) American Samoa is in an ideal location for whole fish. The dolphin-safe policy of U.S. canners drastically reduced their use of tuna from the eastern Tropical Pacific and shifted it to the western Pacific. (However, potential modifications in the dolphin-safe standard could increase tuna fishing in the ETP.) This also coincided with a more plentiful supply of tuna in the region due to weather and environmental factors. Direct delivery from foreign fish vessels (with no prohibition on buying from foreign vessels, unlike for the U.S. mainland) minimizes delivery costs.
The principal disadvantage to processing frozen tuna loins is related to quality--the consistency of the tuna meat after it has been frozen and thawed. The use of loins requires two stages of freezing and thawing. First, the raw fish are frozen on board the fishing vessel. The fish are later thawed and the loins removed at the first processing site, e.g., Thailand. 61 A venture to input low-wage Vietnamese workers for an American Samoa garment plant ended recently after labor standards and human rights violations were claimed. The plant has since closed. 62 See 1992 Report of ITC.
64
Then, the loins are frozen and shipped to the cannery, e.g. Puerto Rico, California, and American Samoa. Processors have sometimes noted less firm consistency, as ice crystals form in the meat cells during freezing and damage the cell structure. In addition, since the loins are frozen and generally transported relatively long distances, additional measures must be taken to ensure adequate handling to prevent spoilage and breakage of the solid fish meat.
StarKist's size and tradition of international operations have given it an advantage over its competition with respect to procurement of raw whole tuna supplies, whereas other U.S. processors generally have relied more heavily on U.S. vessels for their raw tuna requirements and have imported mainly from the spot market as a supplement. StarKist generally has contracted a larger share of its requirements with both U.S. and foreign vessels because of its larger size and larger raw tuna needs. Its dominant position, with American Samoa the largest tuna cannery in the world, has allowed it to have some bargaining power over prices. This has come about as the number of U.S. fishing vessels has decreased and the group representing them in negotiations with canneries became inoperative. Use of loins by U.S. plants in American Samoa is discouraged to some extent by the U.S. tariff treatment of products of insular possessions. Such products are subject to U.S. duties if their inputs are imported, dutiable and exceed 70 percent of the total value of the finished product. Imported frozen tuna loins, if used exclusively as an input (compared to frozen whole tuna) likely would exceed the 70-percent threshold and thus shipments of canned tuna from American Samoa would be subject to duties. However, the use of a mix of domestic and imported frozen whole tuna by the two American Samoa canneries mitigates this disincentive. There are major differences between Puerto Rico and American Samoa with regard to labor costs and supply. StarKist processed loins in its Puerto Rican plant due to the substantial reduction of raw tuna supplies from the eastern Tropical Pacific Ocean (due to the dolphin-safe policy and natural forces) and relatively high labor costs in Puerto Rico. In contrast, the StarKist plant in American Samoa enjoys access to ample raw fish supplies and relatively low labor costs. Increases in Productivity Ever increasing competition has compelled tuna processors to innovate to improve edible yield and quality from the fish at every stage, from thawing the frozen fish offloaded from boats to transporting the product. Technological advances in thawing have been made using automatic fish sizers that group incoming raw tuna by size, improving control of the thawing process. Also, circulation of the water bath in the thaw tanks has improved quality via more uniform thawing. More efficient cooking and conditioning have resulted from use of pressure cookers and uniform fish sizing. The use of vacuum cooking and conditioning has minimized waste and superficial oxidation of the flesh and facilitated easier peeling of the skin during the cleaning process. A dramatic increase in product flow has resulted, lowering cooking/conditioning time from 18-22 hours to 3 hours. "Curing" time (mainly affecting flavor) of sterilized canned tuna has been cut from 40 to 20 days, allowing inventory to be shipped twice as quickly, sharply increasing productivity.
65
The canning/retort stage is the most mechanized link in the tuna canning process. Automatic can filling and sealing machines have been used for decades. Innovations have improved the accuracy of the fillers, handling the cans more gently so as not to break the fibers of the tuna meat and improving the flow of the cans from the can sealers to the retorts. Computerized controls and automated equipment have reduced manual labor needed to place the sealed cans into a retort for heating. In addition, processors are increasing the yield from raw tuna by using more of the fish. For example, processors increased the proportion of tuna flakes in their packs. These efficiencies have also increased productivity.
It takes less time to clean one large fish than a number of small fish with the same weight. Therefore, shifting to larger fish in 1996 resulted in higher productivity compared to 1993-95, a trend expected to continue. On the other hand, cleaning the fish after thawing has been the most difficult challenge to using new technology. Despite longstanding efforts to mechanize this process, tuna cleaning is typically still done manually. While this stage could be skipped entirely by use of frozen loins rather than whole fish, doing so may not be desirable for other reasons described above.
Thailand's Tuna Industry
Thailand is the world's leading exporter of canned tuna and currently the single largest source of imported canned tuna in the U.S. market (46% of U.S. imports in 2003). This includes imports by U.S. tuna processors who put their own label on the imported cans. Thailand is also a major exporter of tuna loins, aggressively developing markets in the U.S., Japan, and Europe.
Production of canned tuna in Thailand is carried out using methods and technology similar to the U.S. In general, Thai producers utilize substantially higher labor content in their tuna production. This is mainly a result of widely different wage rates between the two countries. Specifically, more labor is used in handling frozen tuna, in moving the cleaned loins to the can filling machines, in filling the retort baskets and in the labeling and packing operations. In some canneries, each can is individually cleaned after removal from the retort. Unlike U.S. processors, Thai processors prefer smaller species of tuna, such as skipjack and tongol, traditionally supplied by vessels in local Thai waters, the western Pacific, and Indian Ocean. Productivity in cleaning many smaller fish is lower than for fewer large ones. The volatility of prices is also greater in Thailand than in the U.S. because there is less long-term contracting with vessels, and more dependence on the spot market. Thai producers also have an added cost and risk caused by the inland location of many processing plants, unlike American Samoa. This requires extra handling and transportation, risk factors, which are lessened by purchase of higher quality, higher priced fish.
66
Measuring Productivity Improvements The term productivity refers to the amount of goods and services that are produced per unit of input. Increase in productivity results from achieving more output while inputs are held steady. For countries, productivity is an important determinant of living standards experienced by the populace. In general, higher levels of productivity lead to increases in living standards for both workers and consumers. For companies, increased productivity will often generate increased profits margins. As mentioned in Chapter V, companies benefiting from productivity increases can raise wages (assuming no change in output prices or other costs), without a negative impact on profit. One approach for measuring productivity divides the quantity of output63 by the number of cannery workers, as shown in past biennial Economic Reports on American Samoa.64 Using data first presented in Chapter V (Figure 20), average annual output per worker for 2003 was 56 percent higher than in 1995, or more than 6 percent higher annually. It should be noted that, unlike the other approaches, only the number of workers, not total hours are measured here, making these estimates less precise.
63 U.S. Department of Commerce, U.S. Trade with Puerto Rico and U.S. Possessions, various years. 64 Data are based on Wage Hour Surveys of employment in years 1995 through 2002, published in biennial reports.
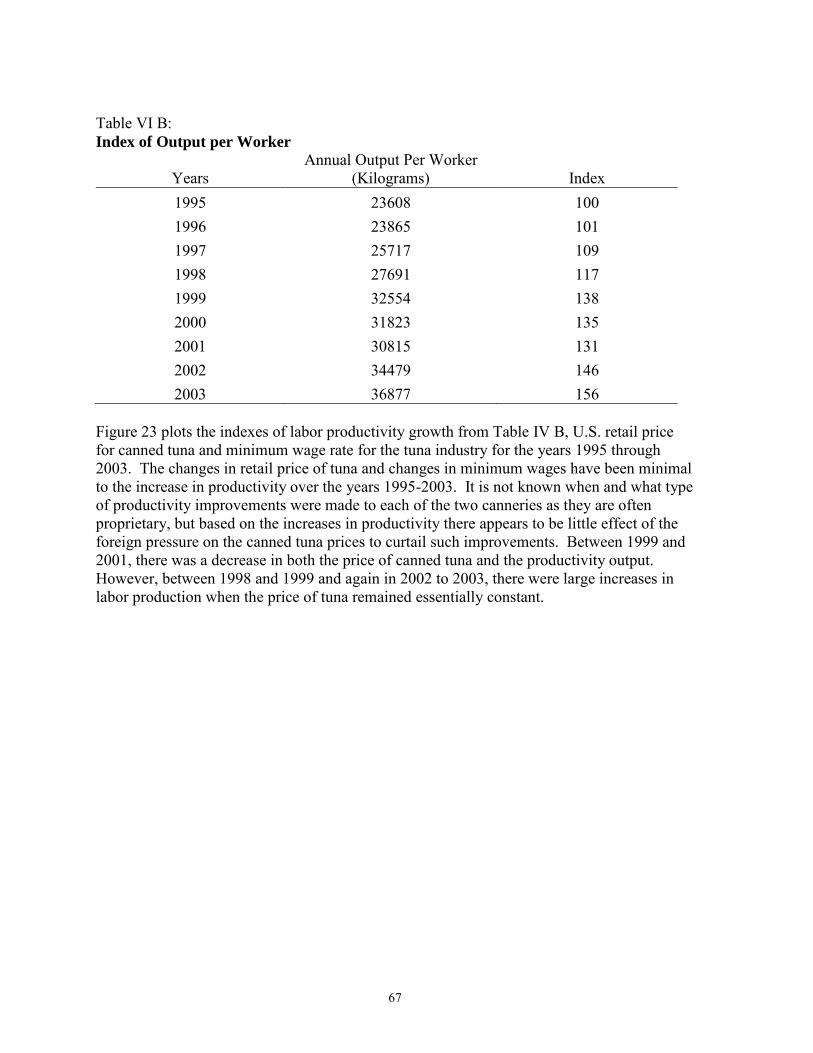
67
Table VI B: Index of Output per Worker
Years Annual Output Per Worker
(Kilograms) Index 1995 23608 100 1996 23865 101 1997 25717 109 1998 27691 117 1999 32554 138 2000 31823 135 2001 30815 131 2002 34479 146 2003 36877 156
Figure 23 plots the indexes of labor productivity growth from Table IV B, U.S. retail price for canned tuna and minimum wage rate for the tuna industry for the years 1995 through 2003. The changes in retail price of tuna and changes in minimum wages have been minimal to the increase in productivity over the years 1995-2003. It is not known when and what type of productivity improvements were made to each of the two canneries as they are often proprietary, but based on the increases in productivity there appears to be little effect of the foreign pressure on the canned tuna prices to curtail such improvements. Between 1999 and 2001, there was a decrease in both the price of canned tuna and the productivity output. However, between 1998 and 1999 and again in 2002 to 2003, there were large increases in labor production when the price of tuna remained essentially constant.
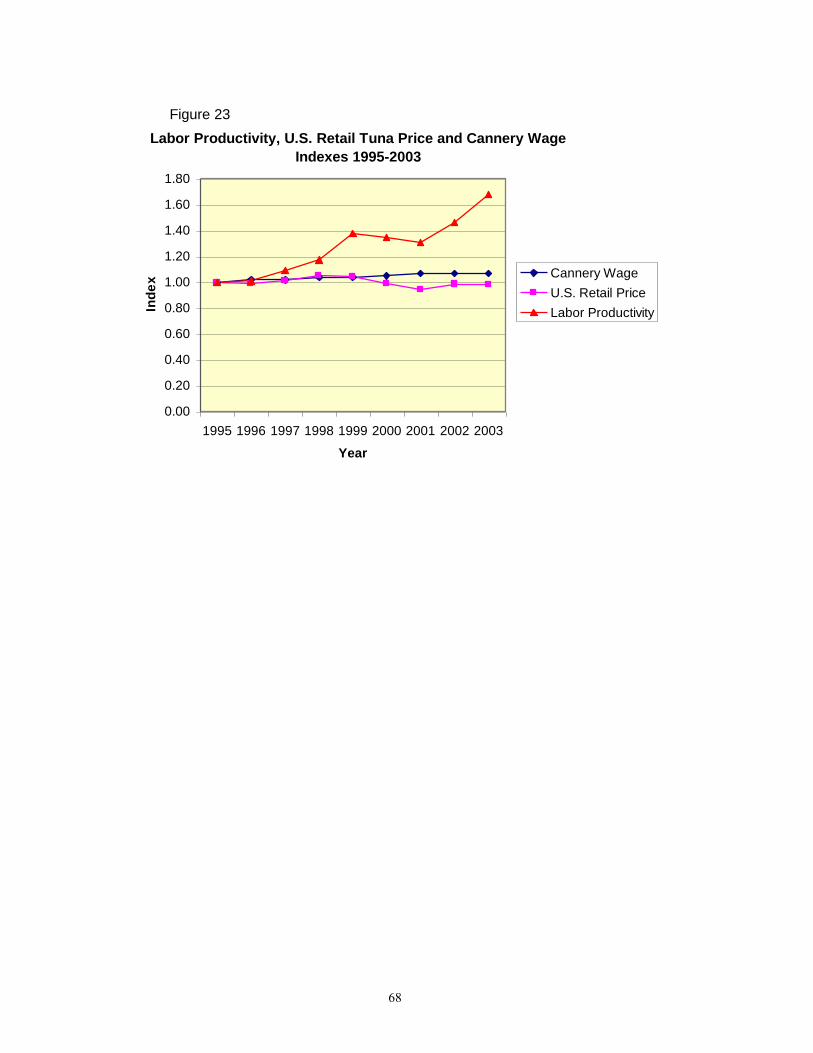
68
Labor Productivity, U.S. Retail Tuna Price and Cannery Wage
Indexes 1995-2003
0.00
0.20
0.40
0.60
0.80
1.00
1.20
1.40
1.60
1.80
1995 1996 1997 1998 1999 2000 2001 2002 2003
Year
Ind
ex
Cannery Wage
U.S. Retail Price
Labor Productivity
Figure 23
69
VII. Economic Factors for Consideration that May Weigh Against Minimum Wage Increases
Slow U.S. Market Growth Production of tuna rose 47 percent worldwide between 1991 and 1997, with the greatest increases coming from producers in the Africa/Indian Oceans, Latin America, and Southeast Asia. These increases reflected shipments into heavy growth areas of consumption in Latin America and Europe.65 The robust growth of canned tuna consumption in certain parts of the world contrasts with a much slower growth in the U.S. Meanwhile, foreign competition has increased for the U.S. market. Slow market growth and increased competition puts great pressure on producers in American Samoa to minimize costs.
The largest production sector, Southeast Asia, including Thailand, the Philippines, Indonesia and other members of the Association of Southeast Asian Nations (ASEAN) comprised 29.1 percent of worldwide canned tuna production in 1997, with Thailand alone accounting for 19.6 percent. Low labor costs were a factor in Southeast Asia's growth. However, other major causes of the shift in production from the eastern Pacific to the Western Pacific fishing waters included the much greater supply of tuna there, and the fact that dolphins do not run with tuna in those waters, allowing fisheries to catch tuna without harming dolphins. While Thailand markets canned tuna to other countries besides the U.S. (e.g., Japan), American Samoa's production is only for the U.S. market, given that market's advantages for a U.S. territory (e.g., no tariff, compared to a 24 percent tariff that would have to be paid on exports to Europe). But the canned tuna market in the U.S. has matured, averaging only a little over 1 percent increase in sales in the last 15 years, compared to an average 2.5 percent gain worldwide. Competition by fast food restaurants, the decrease in can size from 6.5 to 6.0 ounces, and some perception of lower-quality due to a shift in tuna species being canned, may also have helped slow the U.S. market's growth. While U.S. tuna supply experienced declines and advances from 1992-2001, the annual per capita consumption of canned tuna remained fairly flat during this period. From a low of 2.8 pounds per person in 1982, canned tuna consumption increased to 3.5 pounds in 1992.66 After minor fluctuations, per capita consumption again totaled 3.4 pounds in 2003. However, per capita consumption in 2001 was only 2.9 pounds--by far the lowest level in almost 20 years. This reduction appears to be partially the result of the substitution of other fish products (fresh or processed) for canned tuna products. For example, in 2001 annual U.S. shrimp consumption per person (3.4 pounds) exceeded canned tuna consumption for the first time. Despite tuna consumption rising to 3.4 pounds in 2003, the consumption of shrimp had a record year of 4.0 pounds per person. 65 Sources: Various papers delivered at Tuna 1997 Conference in Bangkok. 66 U.S. Department of Commerce, Fisheries of the United States, 2003, NOAA.
70
As a relatively undifferentiated commodity, canned tuna is often met with widespread consumer indifference to its country of origin or brand name. Price is often the key factor. Private label market product from Southeast Asian producers set the market price. Advertising is seen as essential for higher sales growth, so securing advertising with grocery chains is critical. But grocers will only advertise if the product is a loss leader, a low-cost item that brings in customers. Some experts believe there is great potential in the premium end of the market such as albacore tuna (produced mainly by Bumble Bee) and for value-added products such as snack packs, pouched tuna and tuna salads.
At the Sixth INFOFISH World Tuna Trade Conference, May 25-27, 2000 in Bangkok Thailand, the President and CEO of Bumble Bee Seafood, Christopher D. Lischewski, noted that in 1999 the U.S. market for canned tuna grew by 2.3 percent, almost twice the 1985-99 growth rate of 1.2 percent. Also on the positive side, he noted that, in terms of dollar volume per foot of shelf space, canned tuna remained third highest, after granulated sugar and regular coffee.67 On the negative side for tuna processors, he found that of all canned tuna sold in the U.S., 54.5 percent is sold with some sort of promotion, with average price discounting of "a staggering 31 percent," which may mean a loss for the retailer, but "given the traffic that the sale of tuna generates [e.g., bread, lettuce, tomatoes, mayonnaise], is still a profitable decision." Discussing the low long-term growth in U.S. canned tuna sales, the Bumble Bee CEO said…
"The fault for this poor performance falls squarely on the shoulders of the tuna industry. Rather than focus on innovation and growth, the three major brands have fought an 'unwinnable' war to steal shares from one another in a flat to declining category. Nowhere is this more evident than in profit margins…Our results estimate that compared to 1980-84, profit margins have eroded by approximately US $6.75 per case. Multiplying this loss by the 35 million case retail market represents an annual profit loss of more than $200 million to the tuna industry."
Over the same period, he noted that retail prices had dropped in real terms, from US $43.19 per case of Chunk Light half-pound cans (1999 dollars) in 1980 to US $20.35 in 1999, a 53 percent decline in constant dollars.68 Chicken of the Sea presented to the Industry committee 25 arguments that current conditions of the workplace, productivity and U.S. demand for tuna does not increase the profit enough to absorb increases in the minimum wage. Chicken of the Sea showed that from 2001 to 2003, average hourly wage increased by 2.5% but that employment decreased by 2.6%.69 In addition, Chicken of the Sea argues that decreases in consumer demand and retail price along
67 Quotations and other data in this section are from pp. 87-90 (paper by Mr. Lischewski) and pp. 113-118 (paper by Mr. Krampe), Tuna 2000 Bangkok: Papers of the 6th World Tuna Trade Conference, May 25-27, 2000, Bangkok, Thailand, edited by S. Subasinghe and Sudari Pawiro, published by INFOFISH (2000). 68 BLS data indicate the same trend. Between 1994 and 2004, the real price of light meat canned tuna fell from $1.40 per pound (in 1982-84 dollars) in 1994 to $0.98 per pound in 2004, a decrease of 30 percent. 69 Report of American Samoa Industry Committee Number 25, 2003.
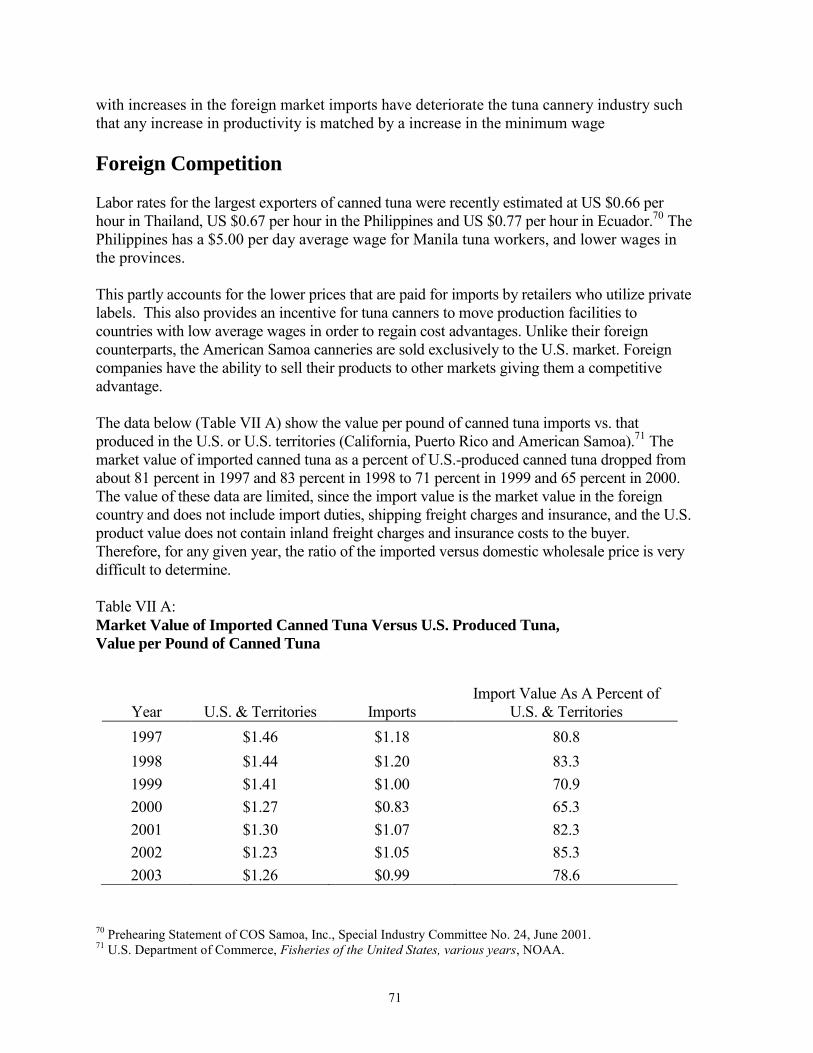
71
with increases in the foreign market imports have deteriorate the tuna cannery industry such that any increase in productivity is matched by a increase in the minimum wage Foreign Competition Labor rates for the largest exporters of canned tuna were recently estimated at US $0.66 per hour in Thailand, US $0.67 per hour in the Philippines and US $0.77 per hour in Ecuador.70 The Philippines has a $5.00 per day average wage for Manila tuna workers, and lower wages in the provinces. This partly accounts for the lower prices that are paid for imports by retailers who utilize private labels. This also provides an incentive for tuna canners to move production facilities to countries with low average wages in order to regain cost advantages. Unlike their foreign counterparts, the American Samoa canneries are sold exclusively to the U.S. market. Foreign companies have the ability to sell their products to other markets giving them a competitive advantage. The data below (Table VII A) show the value per pound of canned tuna imports vs. that produced in the U.S. or U.S. territories (California, Puerto Rico and American Samoa).71 The market value of imported canned tuna as a percent of U.S.-produced canned tuna dropped from about 81 percent in 1997 and 83 percent in 1998 to 71 percent in 1999 and 65 percent in 2000. The value of these data are limited, since the import value is the market value in the foreign country and does not include import duties, shipping freight charges and insurance, and the U.S. product value does not contain inland freight charges and insurance costs to the buyer. Therefore, for any given year, the ratio of the imported versus domestic wholesale price is very difficult to determine. Table VII A: Market Value of Imported Canned Tuna Versus U.S. Produced Tuna,
Value per Pound of Canned Tuna
Year
U.S. & Territories
Imports
Import Value As A Percent of U.S. & Territories
1997 $1.46 $1.18 80.8 1998 $1.44 $1.20 83.3 1999 $1.41 $1.00 70.9 2000 $1.27 $0.83 65.3 2001 $1.30 $1.07 82.3 2002 $1.23 $1.05 85.3 2003 $1.26 $0.99 78.6
70 Prehearing Statement of COS Samoa, Inc., Special Industry Committee No. 24, June 2001. 71 U.S. Department of Commerce, Fisheries of the United States, various years, NOAA.
72
However, the data do clearly show that the price paid by the importer dropped sharply in 1999 and 2000 compared to the wholesale price paid for domestically produced canned tuna. It helps to explain the sharp increase in market share of imported canned tuna seen in 1999. After the U.S. quota is filled, Thai exporters claim they have to lower their price 6.5 percent because their buyers will not absorb any of the duty increase (from 6 percent below the quota to 12.5 percent above it). As a result, the Thai industry buys up frozen tuna during the last quarter of the year, in order to prepare for orders to be entered in the U.S. early the next year, and thus takes advantage of the below-quota tariff rate. This causes short-term fish prices to increase, which some claim significantly raises production costs. The greater than normal supplies of tuna caught in 1999-2000, along with such early stockpiling, drove down the price of tuna to record lows, as noted earlier. In August 2000, Thai Union reported that second quarter profits fell 47 percent, as price fell 40 percent from the first quarter.72 Its relatively robust profit margin narrowed to 14.7 percent from 17 percent. No separate data were obtained for StarKist or Chicken of the Sea. Imports of Canned Tuna The U.S. and the European Community (EC) together import about 80 percent of traded tuna, in roughly equal shares. The EC tariff is 24 percent on canned tuna (Some countries pay no tariffs on tuna to the EC or pay a reduced rate.)73 The U.S. tariffs are 6 percent to 12.5 percent. (Thirty-five percent on tuna packed in oil.) The main suppliers to the U.S. in 2002 were Thailand, Ecuador, the Philippines, and Indonesia (in order of decreasing dollar value). After a record high of 351 million pounds in 1991, imports of canned tuna into the United States decreased to 193.0 million pounds by 1996 (see Figure 22 Table in Appendix C). From 1996 to 1999, imports--mainly from Thailand--increased sharply, to 334.6 million pounds. Then, imports overall declined in the year 2000 by about six percent. Imports again declined in 2001 but by a smaller percent than the decline in U.S. pack but have risen sharply in both 2002 and 2003. Dolphin-Safe Standard In December 2002, the Assistant Administrator for Fisheries in the National Oceanic and Atmospheric Administration (NOAA) of the U.S. Department of Commerce found that the intentional encirclement of dolphins by purse-seine vessels does not have a significant adverse impact on dolphin numbers in the Eastern Tropical Pacific (ETP). This finding changes the dolphin-safe labeling standard as it applies to purse-seine vessels operating in the ETP with carrying capacity in excess of 400 short tons. Previously dolphin-safe meant that no intentional encircling of, or setting nets on, dolphins occurred while tuna were harvested. The new standard allows tuna caught by large purse-seiners to be labeled dolphin-safe if no dolphins were
72 Crow's Nest, September 2000. 73 Former European colonies in Africa, the Pacific, and the Caribbean, plus the Andean community nations, import canned tuna duty free.
73
seriously injured or killed during the set where dolphins were intentionally encircled or chased. The international implications for canned tuna production are potentially significant. In response to a complaint challenging the final finding, the United States District Court for the Northern District of California issued an order that stayed the final finding’s implementation on January 21, 2003.74 That stay, effective for 90 days, means subsection (h)(2) of the Dolphin Protection Consumer Information Act again governs the dolphin-safe labeling standard. Consequently, tuna harvested in the ETP by purse-seine vessels with capacity of 400 short tons or greater cannot be labeled dolphin-safe if dolphins were intentionally encircled or netted. On August 9, 2004 the U.S. District Court for the Northern District of California rejected the Department of Commerce’s efforts to change the “dolphin-safe” tuna labeling program. The judge ruled that the evidence that dolphins were not affected by being caught with the tuna and release had little scientific merit.75 Historically, dolphins in the ETP have been observed to swim above schools of tuna. As a result, crews on large purse-seiners would target and encircle the dolphins in effort to capture the tuna below them. This practice often resulted in high dolphin mortality rates despite having specialty nets designed to retain the tuna while releasing the dolphins back to sea76. Dolphin-safe labeling practices that had begun in the early 1990’s were partially responsible for canneries moving from the ETP to Western Tropical Pacific waters. Because Mexico has received an “affirmative finding” from the National Marine Fisheries Service, it can encircle dolphins while harvesting tuna in the ETP with large purse-seiners and export this tuna as “dolphin-safe” into the United States if the NOAA Assistant Administrator’s final finding is upheld. As a member of NAFTA, Mexico has dutiable rates on canned tuna not in oil of 2.4 percent below the quota and 5 percent above the quota. These rates are being phased out altogether pursuant to NAFTA and will be zero in 2008. Given its location, the United States represents an attractive market for Mexican produced tuna.
Andean Trade Preferences Act The Andean Trade Preference Act (ATPA) allowed for duty-free entry into the United States of various goods produced in Bolivia, Colombia, Ecuador, and Peru. A goal of ATPA was wider access to U.S. markets for Andean producers to facilitate development of economic alternatives to drug crop production.77 However, tuna was not one of the products granted duty-free status. Recently the U.S. Congress considered legislation that would exempt Andean tuna from at least a portion of the tariffs imposed by the United States. According to Congressman Faleomavaega of American Samoa, StarKist lobbied Congress in favor of the proposed legislation while Chicken of the Sea opposed it.78 StarKist maintains tuna production in Ecuador (as does Bumble
74 Federal Register, Volume 68, Number 19. 75 San Francisco Chronicle, U.S. Judge Affirms Tuna Rules, August 11, 2004. 76 http://www.defenders.org/defendersmag/issues/summer02/tunadolphin.html. 77 http://www.usitc.gov/er/nl2002/ER1008z1.htm. 78 http://www.house.gov/apps/list/press/as00_faleomavaega/andean1001.html.
74
Bee) and would gain economically from increased access to U.S. markets. Chicken of the Sea does not process tuna in Ecuador and tariff exemptions for ATPA tuna could adversely impact its operations in American Samoa and/or Asia. In July of 2002 Congressman Faleomavaega announced that the U.S. House passed Andean trade legislation that prevented canned tuna processed in Ecuador from entering the U.S. duty-free.79 However, the legislation did grant the President authority to allow tuna packed in foil pouches duty-free status. The U.S. Senate later that year passed legislation with the same revisions on tuna recommended by the House.80 Foreign nations will continue to press for U.S. trade concessions (i.e. an opening of U.S. markets) as a means to accelerate their domestic economic development. One incentive for the United States to consider these concessions is efforts by foreign governments to help curb or eliminate illicit drug production and importations to the United States. Tariff Rates Shipments of canned tuna or other products from American Samoa into the United States are not subject to tariff rates as prescribed by the Harmonized Tariff Schedule of the United States. This is because American Samoa as a territory of the U.S. and is not considered to be an exporter. While foreign exporters pay no duty on all fresh, chilled, or frozen whole-fish tuna imports to the U.S., and pay a relatively low tariff rate on tuna loins (0.5 cents per pound), canned tuna imports are subject to more significant tariff duties. The tariff rate for canned tuna, not in oil, in airtight containers, weighing not over 7 kilograms, is 6 percent of value (ad valorem). The rate for tuna, not in oil, in airtight containers, weighing over 7 kilograms, or weighing not over 7 kilograms, but above the quota, is 12.5 percent. The effectiveness of quotas on canned tuna is explained in the next section. Quota on Canned Tuna Relatively Ineffective A tariff-rate quota provides for an increased tariff when a certain quantity of imports is reached. A global tariff-rate quota applies to imports of canned tuna, not in oil, in airtight containers, which weigh, with their contents, not over 7 kilograms. It applies to both light meat and albacore. The quota is set each year and is 20 percent of the canned tuna packed in the United States (excluding the pack in American Samoa) during the preceding calendar year. Any canned tuna in these designated categories (not in oil, not over 7 kilograms) that is imported in excess of the quota is placed in the tariff category of tuna, not in oil, but weighing over 7 kilograms, and is dutiable at that category's rate of 12.5 percent.
79 http://www.house.gov/apps/list/press/as00_faleomavaega/atpapasseshouse.html. 80 http://www.house.gov/apps/list/press/as00_faleomavaega/atpapassedbysenate.html.
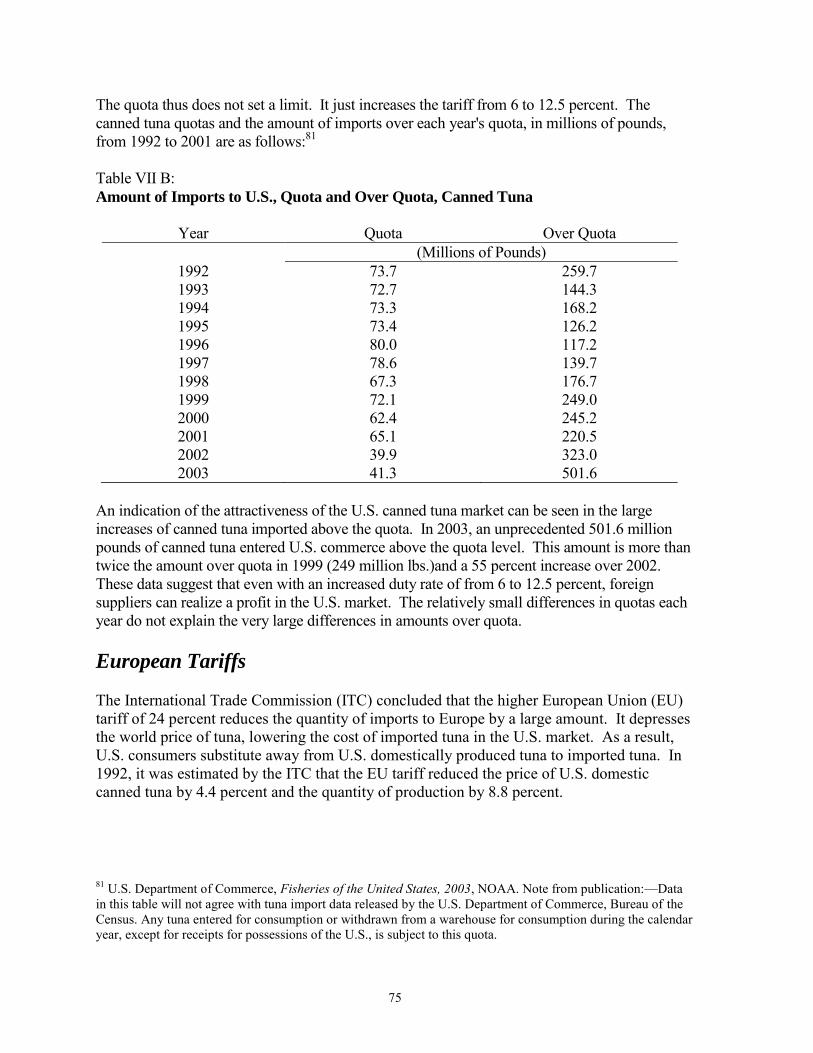
75
The quota thus does not set a limit. It just increases the tariff from 6 to 12.5 percent. The canned tuna quotas and the amount of imports over each year's quota, in millions of pounds, from 1992 to 2001 are as follows:81 Table VII B: Amount of Imports to U.S., Quota and Over Quota, Canned Tuna
Year Quota Over Quota (Millions of Pounds)
1992 73.7 259.7 1993 72.7 144.3 1994 73.3 168.2 1995 73.4 126.2 1996 80.0 117.2 1997 78.6 139.7 1998 67.3 176.7 1999 72.1 249.0 2000 62.4 245.2 2001 65.1 220.5 2002 39.9 323.0 2003 41.3 501.6
An indication of the attractiveness of the U.S. canned tuna market can be seen in the large increases of canned tuna imported above the quota. In 2003, an unprecedented 501.6 million pounds of canned tuna entered U.S. commerce above the quota level. This amount is more than twice the amount over quota in 1999 (249 million lbs.)and a 55 percent increase over 2002. These data suggest that even with an increased duty rate of from 6 to 12.5 percent, foreign suppliers can realize a profit in the U.S. market. The relatively small differences in quotas each year do not explain the very large differences in amounts over quota. European Tariffs The International Trade Commission (ITC) concluded that the higher European Union (EU) tariff of 24 percent reduces the quantity of imports to Europe by a large amount. It depresses the world price of tuna, lowering the cost of imported tuna in the U.S. market. As a result, U.S. consumers substitute away from U.S. domestically produced tuna to imported tuna. In 1992, it was estimated by the ITC that the EU tariff reduced the price of U.S. domestic canned tuna by 4.4 percent and the quantity of production by 8.8 percent.
81 U.S. Department of Commerce, Fisheries of the United States, 2003, NOAA. Note from publication:—Data in this table will not agree with tuna import data released by the U.S. Department of Commerce, Bureau of the Census. Any tuna entered for consumption or withdrawn from a warehouse for consumption during the calendar year, except for receipts for possessions of the U.S., is subject to this quota.
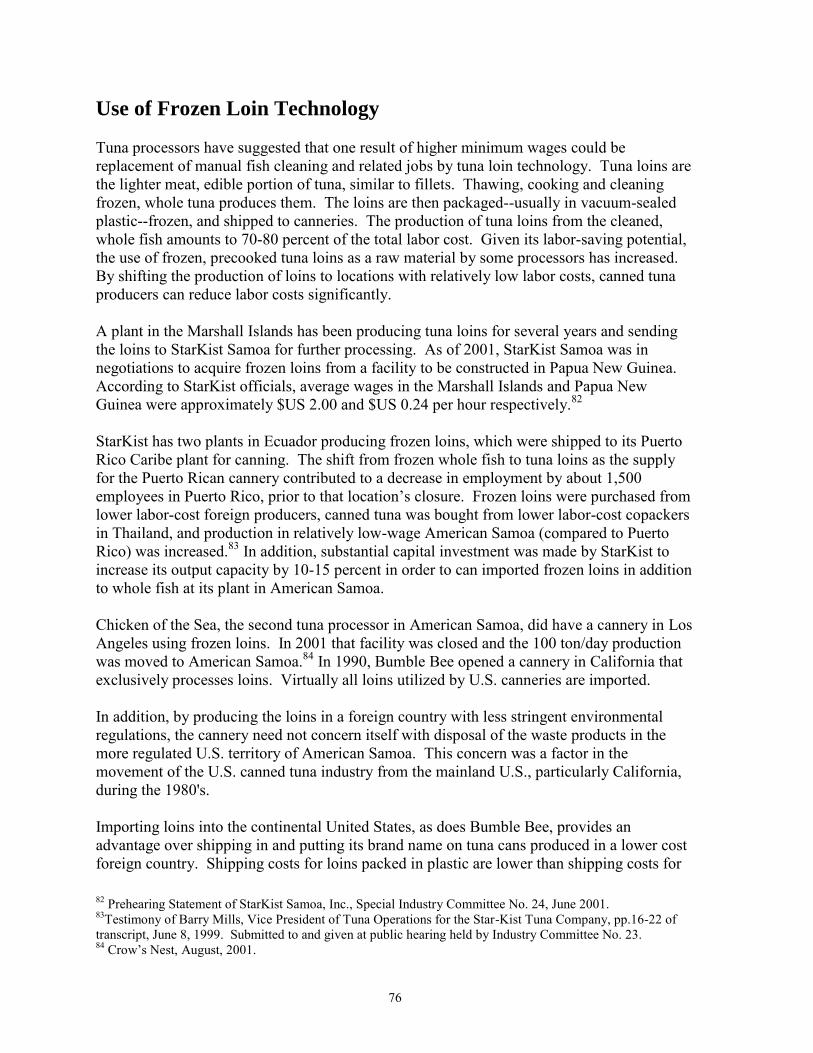
76
Use of Frozen Loin Technology Tuna processors have suggested that one result of higher minimum wages could be replacement of manual fish cleaning and related jobs by tuna loin technology. Tuna loins are the lighter meat, edible portion of tuna, similar to fillets. Thawing, cooking and cleaning frozen, whole tuna produces them. The loins are then packaged--usually in vacuum-sealed plastic--frozen, and shipped to canneries. The production of tuna loins from the cleaned, whole fish amounts to 70-80 percent of the total labor cost. Given its labor-saving potential, the use of frozen, precooked tuna loins as a raw material by some processors has increased. By shifting the production of loins to locations with relatively low labor costs, canned tuna producers can reduce labor costs significantly. A plant in the Marshall Islands has been producing tuna loins for several years and sending the loins to StarKist Samoa for further processing. As of 2001, StarKist Samoa was in negotiations to acquire frozen loins from a facility to be constructed in Papua New Guinea. According to StarKist officials, average wages in the Marshall Islands and Papua New Guinea were approximately $US 2.00 and $US 0.24 per hour respectively.82
StarKist has two plants in Ecuador producing frozen loins, which were shipped to its Puerto Rico Caribe plant for canning. The shift from frozen whole fish to tuna loins as the supply for the Puerto Rican cannery contributed to a decrease in employment by about 1,500 employees in Puerto Rico, prior to that location’s closure. Frozen loins were purchased from lower labor-cost foreign producers, canned tuna was bought from lower labor-cost copackers in Thailand, and production in relatively low-wage American Samoa (compared to Puerto Rico) was increased.83 In addition, substantial capital investment was made by StarKist to increase its output capacity by 10-15 percent in order to can imported frozen loins in addition to whole fish at its plant in American Samoa. Chicken of the Sea, the second tuna processor in American Samoa, did have a cannery in Los Angeles using frozen loins. In 2001 that facility was closed and the 100 ton/day production was moved to American Samoa.84 In 1990, Bumble Bee opened a cannery in California that exclusively processes loins. Virtually all loins utilized by U.S. canneries are imported. In addition, by producing the loins in a foreign country with less stringent environmental regulations, the cannery need not concern itself with disposal of the waste products in the more regulated U.S. territory of American Samoa. This concern was a factor in the movement of the U.S. canned tuna industry from the mainland U.S., particularly California, during the 1980's. Importing loins into the continental United States, as does Bumble Bee, provides an advantage over shipping in and putting its brand name on tuna cans produced in a lower cost foreign country. Shipping costs for loins packed in plastic are lower than shipping costs for 82 Prehearing Statement of StarKist Samoa, Inc., Special Industry Committee No. 24, June 2001. 83Testimony of Barry Mills, Vice President of Tuna Operations for the Star-Kist Tuna Company, pp.16-22 of transcript, June 8, 1999. Submitted to and given at public hearing held by Industry Committee No. 23. 84 Crow’s Nest, August, 2001.
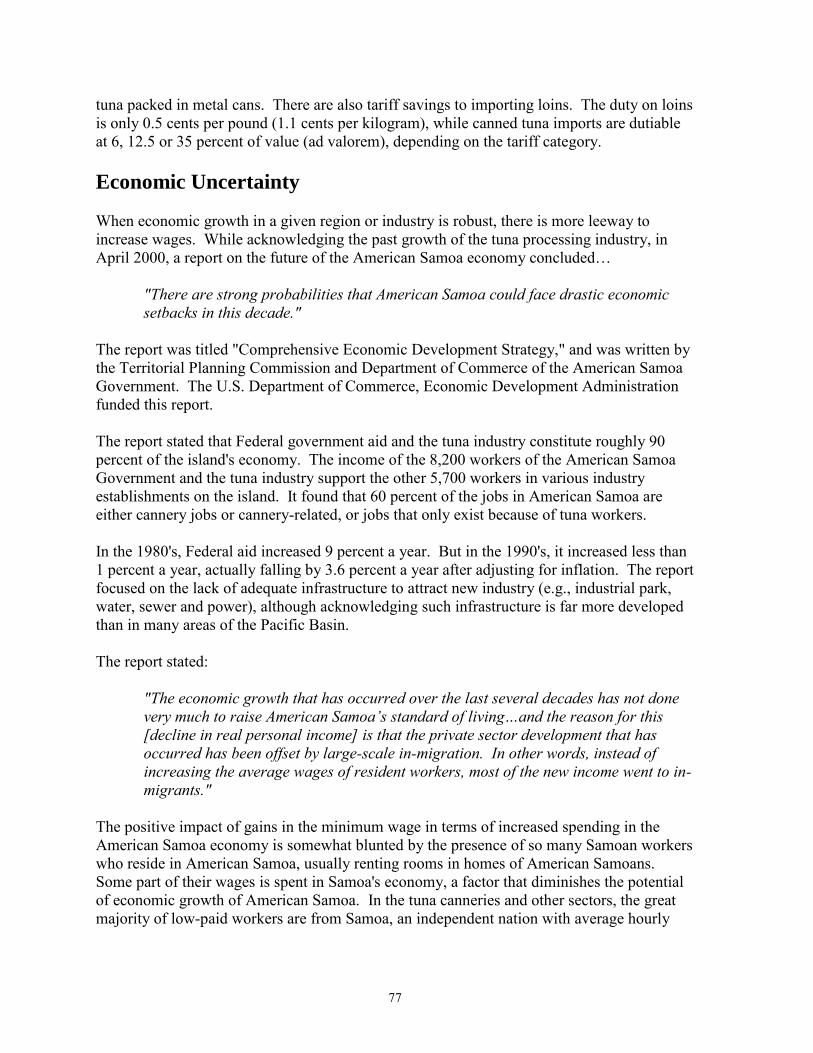
77
tuna packed in metal cans. There are also tariff savings to importing loins. The duty on loins is only 0.5 cents per pound (1.1 cents per kilogram), while canned tuna imports are dutiable at 6, 12.5 or 35 percent of value (ad valorem), depending on the tariff category. Economic Uncertainty When economic growth in a given region or industry is robust, there is more leeway to increase wages. While acknowledging the past growth of the tuna processing industry, in April 2000, a report on the future of the American Samoa economy concluded…
"There are strong probabilities that American Samoa could face drastic economic setbacks in this decade."
The report was titled "Comprehensive Economic Development Strategy," and was written by the Territorial Planning Commission and Department of Commerce of the American Samoa Government. The U.S. Department of Commerce, Economic Development Administration funded this report. The report stated that Federal government aid and the tuna industry constitute roughly 90 percent of the island's economy. The income of the 8,200 workers of the American Samoa Government and the tuna industry support the other 5,700 workers in various industry establishments on the island. It found that 60 percent of the jobs in American Samoa are either cannery jobs or cannery-related, or jobs that only exist because of tuna workers. In the 1980's, Federal aid increased 9 percent a year. But in the 1990's, it increased less than 1 percent a year, actually falling by 3.6 percent a year after adjusting for inflation. The report focused on the lack of adequate infrastructure to attract new industry (e.g., industrial park, water, sewer and power), although acknowledging such infrastructure is far more developed than in many areas of the Pacific Basin. The report stated:
"The economic growth that has occurred over the last several decades has not done very much to raise American Samoa’s standard of living…and the reason for this [decline in real personal income] is that the private sector development that has occurred has been offset by large-scale in-migration. In other words, instead of increasing the average wages of resident workers, most of the new income went to in-migrants."
The positive impact of gains in the minimum wage in terms of increased spending in the American Samoa economy is somewhat blunted by the presence of so many Samoan workers who reside in American Samoa, usually renting rooms in homes of American Samoans. Some part of their wages is spent in Samoa's economy, a factor that diminishes the potential of economic growth of American Samoa. In the tuna canneries and other sectors, the great majority of low-paid workers are from Samoa, an independent nation with average hourly
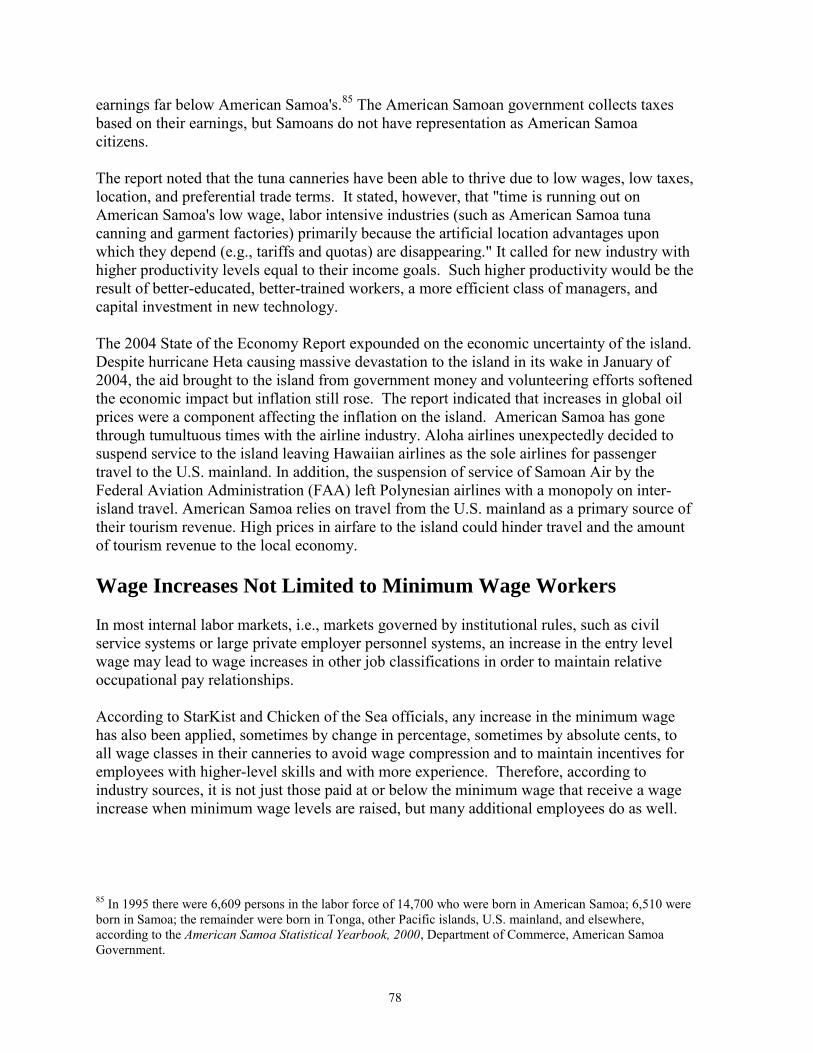
78
earnings far below American Samoa's.85 The American Samoan government collects taxes based on their earnings, but Samoans do not have representation as American Samoa citizens. The report noted that the tuna canneries have been able to thrive due to low wages, low taxes, location, and preferential trade terms. It stated, however, that "time is running out on American Samoa's low wage, labor intensive industries (such as American Samoa tuna canning and garment factories) primarily because the artificial location advantages upon which they depend (e.g., tariffs and quotas) are disappearing." It called for new industry with higher productivity levels equal to their income goals. Such higher productivity would be the result of better-educated, better-trained workers, a more efficient class of managers, and capital investment in new technology. The 2004 State of the Economy Report expounded on the economic uncertainty of the island. Despite hurricane Heta causing massive devastation to the island in its wake in January of 2004, the aid brought to the island from government money and volunteering efforts softened the economic impact but inflation still rose. The report indicated that increases in global oil prices were a component affecting the inflation on the island. American Samoa has gone through tumultuous times with the airline industry. Aloha airlines unexpectedly decided to suspend service to the island leaving Hawaiian airlines as the sole airlines for passenger travel to the U.S. mainland. In addition, the suspension of service of Samoan Air by the Federal Aviation Administration (FAA) left Polynesian airlines with a monopoly on inter-island travel. American Samoa relies on travel from the U.S. mainland as a primary source of their tourism revenue. High prices in airfare to the island could hinder travel and the amount of tourism revenue to the local economy. Wage Increases Not Limited to Minimum Wage Workers In most internal labor markets, i.e., markets governed by institutional rules, such as civil service systems or large private employer personnel systems, an increase in the entry level wage may lead to wage increases in other job classifications in order to maintain relative occupational pay relationships. According to StarKist and Chicken of the Sea officials, any increase in the minimum wage has also been applied, sometimes by change in percentage, sometimes by absolute cents, to all wage classes in their canneries to avoid wage compression and to maintain incentives for employees with higher-level skills and with more experience. Therefore, according to industry sources, it is not just those paid at or below the minimum wage that receive a wage increase when minimum wage levels are raised, but many additional employees do as well.
85 In 1995 there were 6,609 persons in the labor force of 14,700 who were born in American Samoa; 6,510 were born in Samoa; the remainder were born in Tonga, other Pacific islands, U.S. mainland, and elsewhere, according to the American Samoa Statistical Yearbook, 2000, Department of Commerce, American Samoa Government.
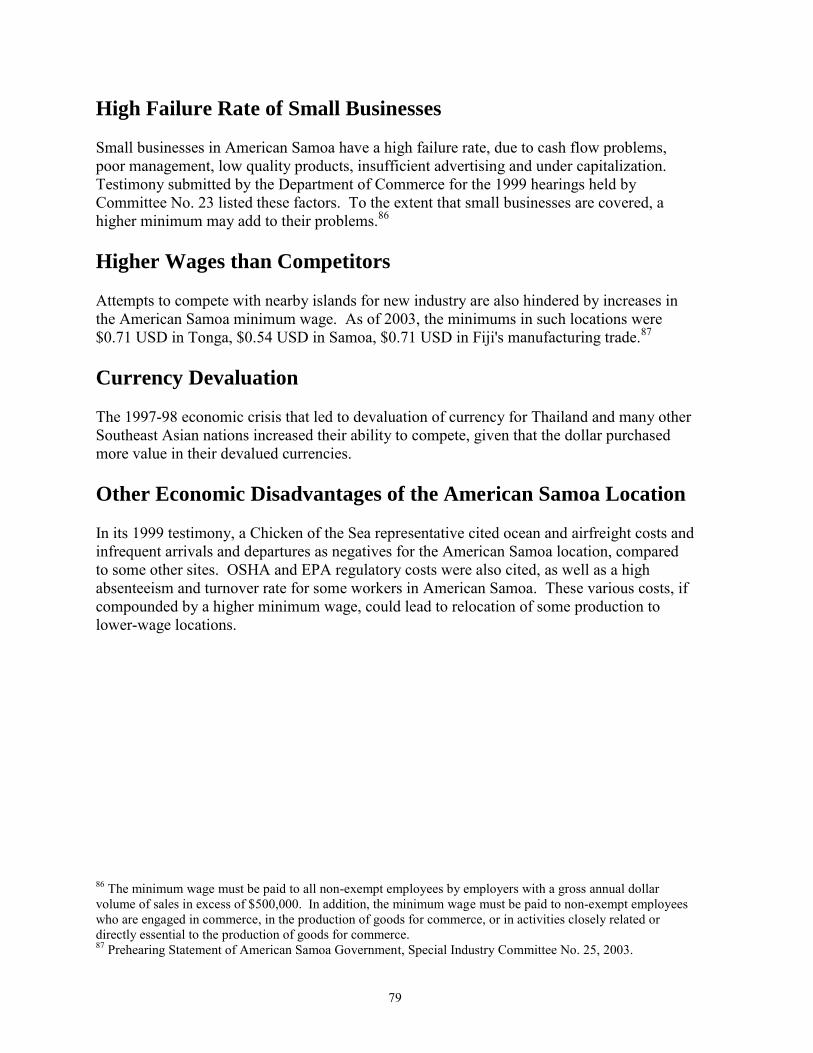
79
High Failure Rate of Small Businesses
Small businesses in American Samoa have a high failure rate, due to cash flow problems, poor management, low quality products, insufficient advertising and under capitalization. Testimony submitted by the Department of Commerce for the 1999 hearings held by Committee No. 23 listed these factors. To the extent that small businesses are covered, a higher minimum may add to their problems.86 Higher Wages than Competitors Attempts to compete with nearby islands for new industry are also hindered by increases in the American Samoa minimum wage. As of 2003, the minimums in such locations were $0.71 USD in Tonga, $0.54 USD in Samoa, $0.71 USD in Fiji's manufacturing trade.87 Currency Devaluation The 1997-98 economic crisis that led to devaluation of currency for Thailand and many other Southeast Asian nations increased their ability to compete, given that the dollar purchased more value in their devalued currencies. Other Economic Disadvantages of the American Samoa Location In its 1999 testimony, a Chicken of the Sea representative cited ocean and airfreight costs and infrequent arrivals and departures as negatives for the American Samoa location, compared to some other sites. OSHA and EPA regulatory costs were also cited, as well as a high absenteeism and turnover rate for some workers in American Samoa. These various costs, if compounded by a higher minimum wage, could lead to relocation of some production to lower-wage locations.
86 The minimum wage must be paid to all non-exempt employees by employers with a gross annual dollar volume of sales in excess of $500,000. In addition, the minimum wage must be paid to non-exempt employees who are engaged in commerce, in the production of goods for commerce, or in activities closely related or directly essential to the production of goods for commerce. 87 Prehearing Statement of American Samoa Government, Special Industry Committee No. 25, 2003.

80
Appendix A.
Covered Employees in
Private Sector
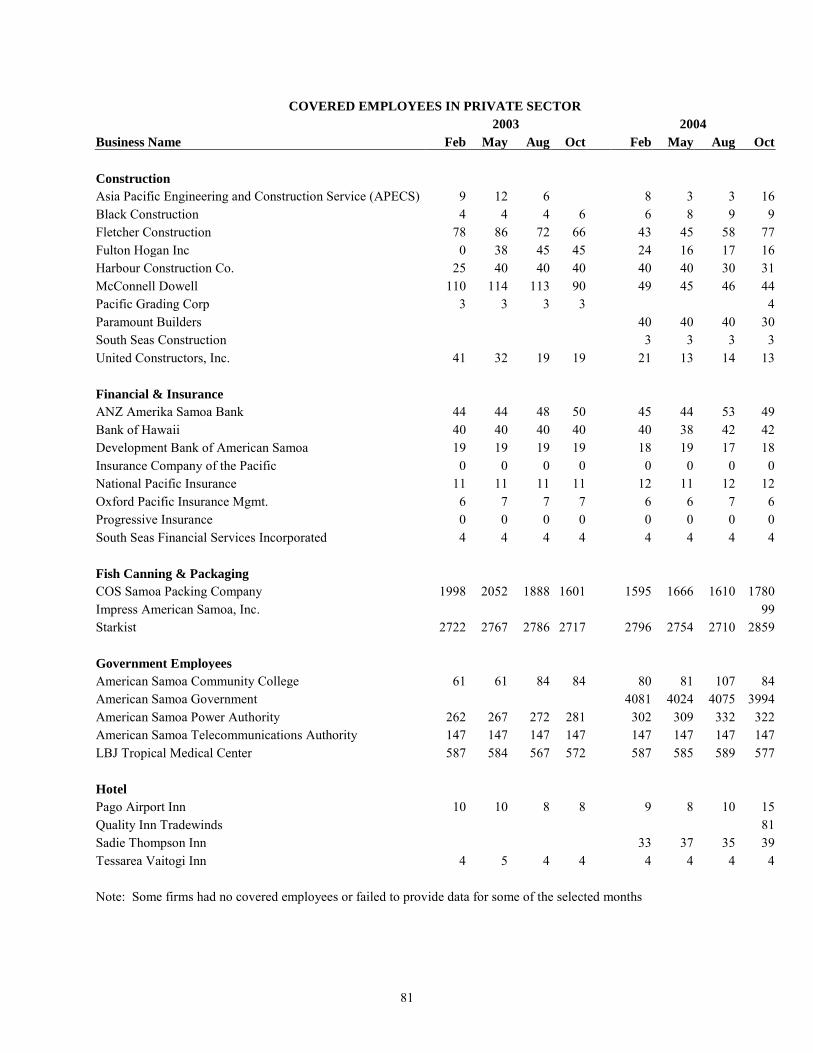
81
COVERED EMPLOYEES IN PRIVATE SECTOR
2003 2004
Business Name Feb May Aug Oct Feb May Aug Oct
Construction Asia Pacific Engineering and Construction Service (APECS) 9 12 6 8 3 3 16 Black Construction 4 4 4 6 6 8 9 9 Fletcher Construction 78 86 72 66 43 45 58 77 Fulton Hogan Inc 0 38 45 45 24 16 17 16 Harbour Construction Co. 25 40 40 40 40 40 30 31 McConnell Dowell 110 114 113 90 49 45 46 44 Pacific Grading Corp 3 3 3 3 4 Paramount Builders 40 40 40 30 South Seas Construction 3 3 3 3 United Constructors, Inc. 41 32 19 19 21 13 14 13 Financial & Insurance ANZ Amerika Samoa Bank 44 44 48 50 45 44 53 49 Bank of Hawaii 40 40 40 40 40 38 42 42 Development Bank of American Samoa 19 19 19 19 18 19 17 18 Insurance Company of the Pacific 0 0 0 0 0 0 0 0 National Pacific Insurance 11 11 11 11 12 11 12 12 Oxford Pacific Insurance Mgmt. 6 7 7 7 6 6 7 6 Progressive Insurance 0 0 0 0 0 0 0 0 South Seas Financial Services Incorporated 4 4 4 4 4 4 4 4 Fish Canning & Packaging COS Samoa Packing Company 1998 2052 1888 1601 1595 1666 1610 1780 Impress American Samoa, Inc. 99 Starkist 2722 2767 2786 2717 2796 2754 2710 2859 Government Employees
American Samoa Community College 61 61 84 84 80 81 107 84 American Samoa Government 4081 4024 4075 3994 American Samoa Power Authority 262 267 272 281 302 309 332 322 American Samoa Telecommunications Authority 147 147 147 147 147 147 147 147 LBJ Tropical Medical Center 587 584 567 572 587 585 589 577 Hotel Pago Airport Inn 10 10 8 8 9 8 10 15 Quality Inn Tradewinds 81 Sadie Thompson Inn 33 37 35 39 Tessarea Vaitogi Inn 4 5 4 4 4 4 4 4 Note: Some firms had no covered employees or failed to provide data for some of the selected months
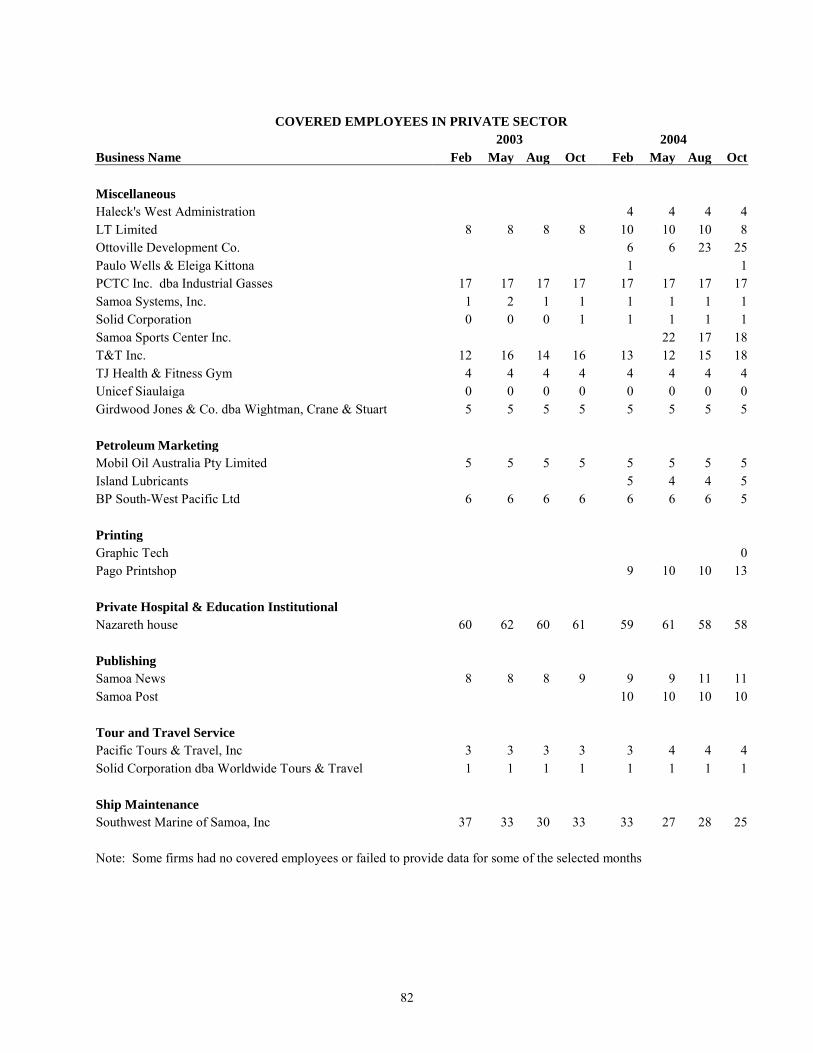
82
COVERED EMPLOYEES IN PRIVATE SECTOR
2003 2004
Business Name Feb May Aug Oct Feb May Aug Oct
Miscellaneous Haleck's West Administration 4 4 4 4 LT Limited 8 8 8 8 10 10 10 8 Ottoville Development Co. 6 6 23 25 Paulo Wells & Eleiga Kittona 1 1 PCTC Inc. dba Industrial Gasses 17 17 17 17 17 17 17 17 Samoa Systems, Inc. 1 2 1 1 1 1 1 1 Solid Corporation 0 0 0 1 1 1 1 1 Samoa Sports Center Inc. 22 17 18 T&T Inc. 12 16 14 16 13 12 15 18 TJ Health & Fitness Gym 4 4 4 4 4 4 4 4 Unicef Siaulaiga 0 0 0 0 0 0 0 0 Girdwood Jones & Co. dba Wightman, Crane & Stuart 5 5 5 5 5 5 5 5 Petroleum Marketing Mobil Oil Australia Pty Limited 5 5 5 5 5 5 5 5 Island Lubricants 5 4 4 5 BP South-West Pacific Ltd 6 6 6 6 6 6 6 5 Printing Graphic Tech 0 Pago Printshop 9 10 10 13 Private Hospital & Education Institutional Nazareth house 60 62 60 61 59 61 58 58 Publishing Samoa News 8 8 8 9 9 9 11 11 Samoa Post 10 10 10 10 Tour and Travel Service Pacific Tours & Travel, Inc 3 3 3 3 3 4 4 4 Solid Corporation dba Worldwide Tours & Travel 1 1 1 1 1 1 1 1 Ship Maintenance Southwest Marine of Samoa, Inc 37 33 30 33 33 27 28 25 Note: Some firms had no covered employees or failed to provide data for some of the selected months
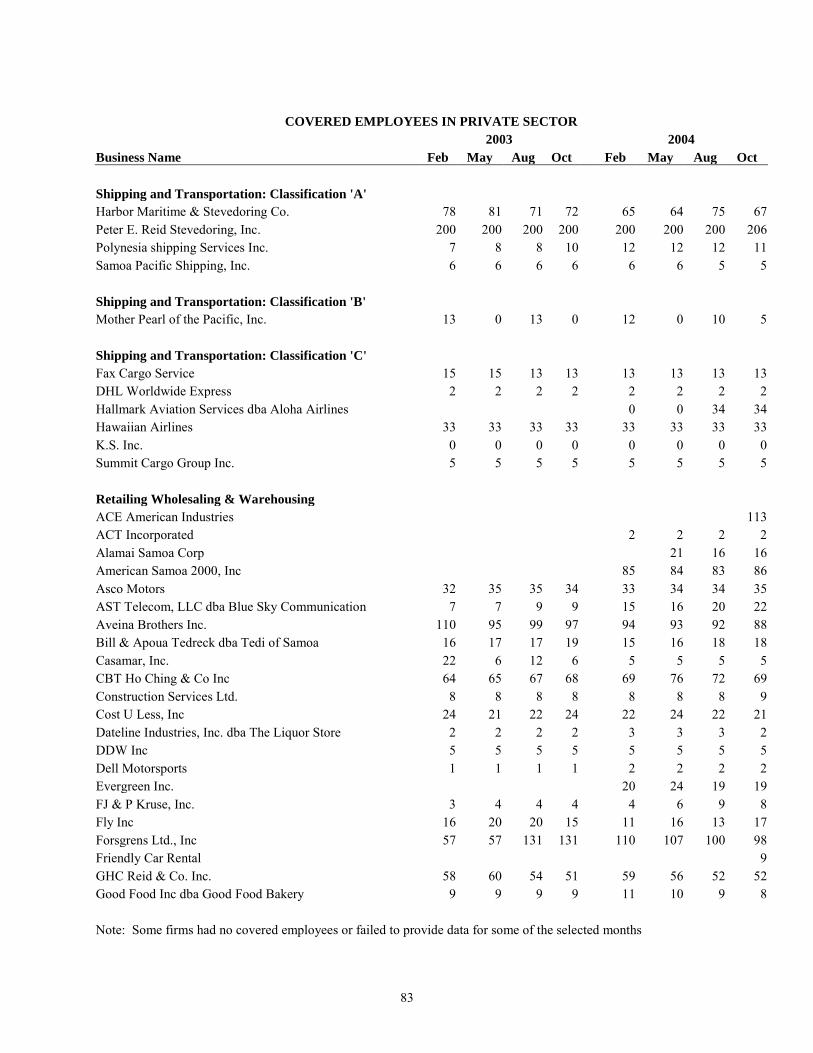
83
COVERED EMPLOYEES IN PRIVATE SECTOR
2003 2004
Business Name Feb May Aug Oct Feb May Aug Oct
Shipping and Transportation: Classification 'A' Harbor Maritime & Stevedoring Co. 78 81 71 72 65 64 75 67 Peter E. Reid Stevedoring, Inc. 200 200 200 200 200 200 200 206 Polynesia shipping Services Inc. 7 8 8 10 12 12 12 11 Samoa Pacific Shipping, Inc. 6 6 6 6 6 6 5 5 Shipping and Transportation: Classification 'B' Mother Pearl of the Pacific, Inc. 13 0 13 0 12 0 10 5 Shipping and Transportation: Classification 'C' Fax Cargo Service 15 15 13 13 13 13 13 13 DHL Worldwide Express 2 2 2 2 2 2 2 2 Hallmark Aviation Services dba Aloha Airlines 0 0 34 34 Hawaiian Airlines 33 33 33 33 33 33 33 33 K.S. Inc. 0 0 0 0 0 0 0 0 Summit Cargo Group Inc. 5 5 5 5 5 5 5 5 Retailing Wholesaling & Warehousing ACE American Industries 113 ACT Incorporated 2 2 2 2 Alamai Samoa Corp 21 16 16 American Samoa 2000, Inc 85 84 83 86 Asco Motors 32 35 35 34 33 34 34 35 AST Telecom, LLC dba Blue Sky Communication 7 7 9 9 15 16 20 22 Aveina Brothers Inc. 110 95 99 97 94 93 92 88 Bill & Apoua Tedreck dba Tedi of Samoa 16 17 17 19 15 16 18 18 Casamar, Inc. 22 6 12 6 5 5 5 5 CBT Ho Ching & Co Inc 64 65 67 68 69 76 72 69 Construction Services Ltd. 8 8 8 8 8 8 8 9 Cost U Less, Inc 24 21 22 24 22 24 22 21 Dateline Industries, Inc. dba The Liquor Store 2 2 2 2 3 3 3 2 DDW Inc 5 5 5 5 5 5 5 5 Dell Motorsports 1 1 1 1 2 2 2 2 Evergreen Inc. 20 24 19 19 FJ & P Kruse, Inc. 3 4 4 4 4 6 9 8 Fly Inc 16 20 20 15 11 16 13 17 Forsgrens Ltd., Inc 57 57 131 131 110 107 100 98 Friendly Car Rental 9 GHC Reid & Co. Inc. 58 60 54 51 59 56 52 52 Good Food Inc dba Good Food Bakery 9 9 9 9 11 10 9 8 Note: Some firms had no covered employees or failed to provide data for some of the selected months
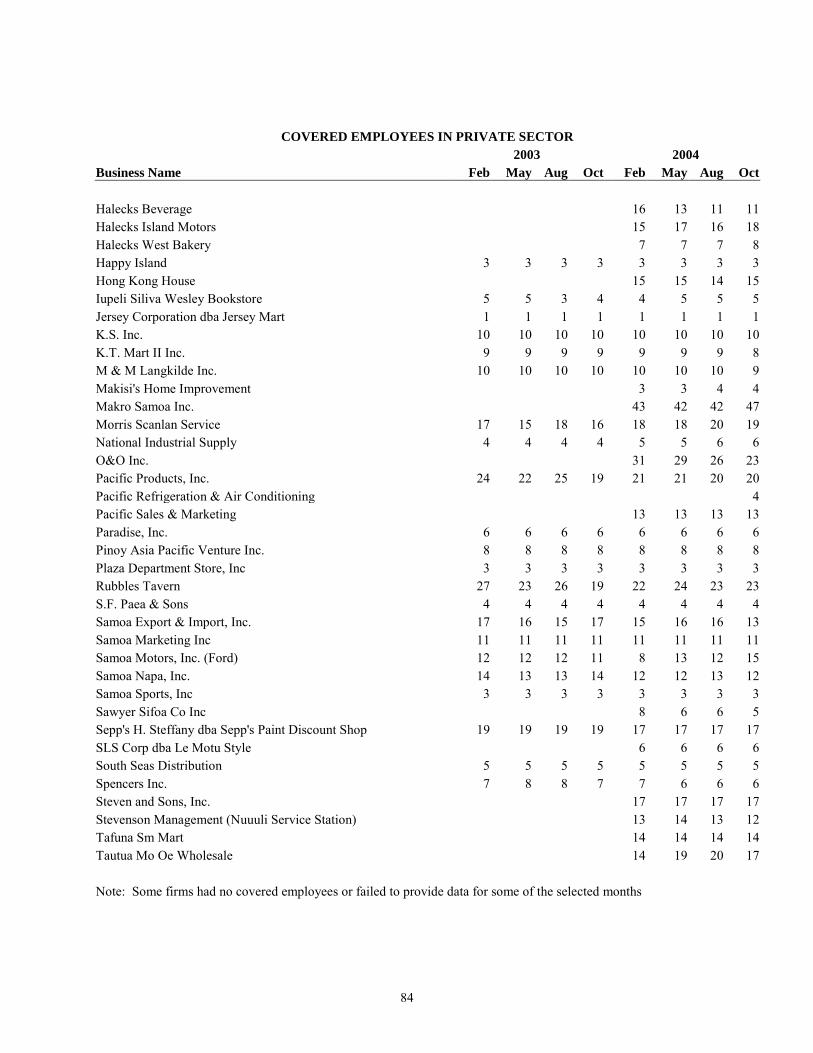
84
COVERED EMPLOYEES IN PRIVATE SECTOR 2003 2004
Business Name Feb May Aug Oct Feb May Aug Oct
Halecks Beverage 16 13 11 11 Halecks Island Motors 15 17 16 18 Halecks West Bakery 7 7 7 8 Happy Island 3 3 3 3 3 3 3 3 Hong Kong House 15 15 14 15 Iupeli Siliva Wesley Bookstore 5 5 3 4 4 5 5 5 Jersey Corporation dba Jersey Mart 1 1 1 1 1 1 1 1 K.S. Inc. 10 10 10 10 10 10 10 10 K.T. Mart II Inc. 9 9 9 9 9 9 9 8 M & M Langkilde Inc. 10 10 10 10 10 10 10 9 Makisi's Home Improvement 3 3 4 4 Makro Samoa Inc. 43 42 42 47 Morris Scanlan Service 17 15 18 16 18 18 20 19 National Industrial Supply 4 4 4 4 5 5 6 6 O&O Inc. 31 29 26 23 Pacific Products, Inc. 24 22 25 19 21 21 20 20 Pacific Refrigeration & Air Conditioning 4 Pacific Sales & Marketing 13 13 13 13 Paradise, Inc. 6 6 6 6 6 6 6 6 Pinoy Asia Pacific Venture Inc. 8 8 8 8 8 8 8 8 Plaza Department Store, Inc 3 3 3 3 3 3 3 3 Rubbles Tavern 27 23 26 19 22 24 23 23 S.F. Paea & Sons 4 4 4 4 4 4 4 4 Samoa Export & Import, Inc. 17 16 15 17 15 16 16 13 Samoa Marketing Inc 11 11 11 11 11 11 11 11 Samoa Motors, Inc. (Ford) 12 12 12 11 8 13 12 15 Samoa Napa, Inc. 14 13 13 14 12 12 13 12 Samoa Sports, Inc 3 3 3 3 3 3 3 3 Sawyer Sifoa Co Inc 8 6 6 5 Sepp's H. Steffany dba Sepp's Paint Discount Shop 19 19 19 19 17 17 17 17 SLS Corp dba Le Motu Style 6 6 6 6 South Seas Distribution 5 5 5 5 5 5 5 5 Spencers Inc. 7 8 8 7 7 6 6 6 Steven and Sons, Inc. 17 17 17 17 Stevenson Management (Nuuuli Service Station) 13 14 13 12 Tafuna Sm Mart 14 14 14 14 Tautua Mo Oe Wholesale 14 19 20 17 Note: Some firms had no covered employees or failed to provide data for some of the selected months
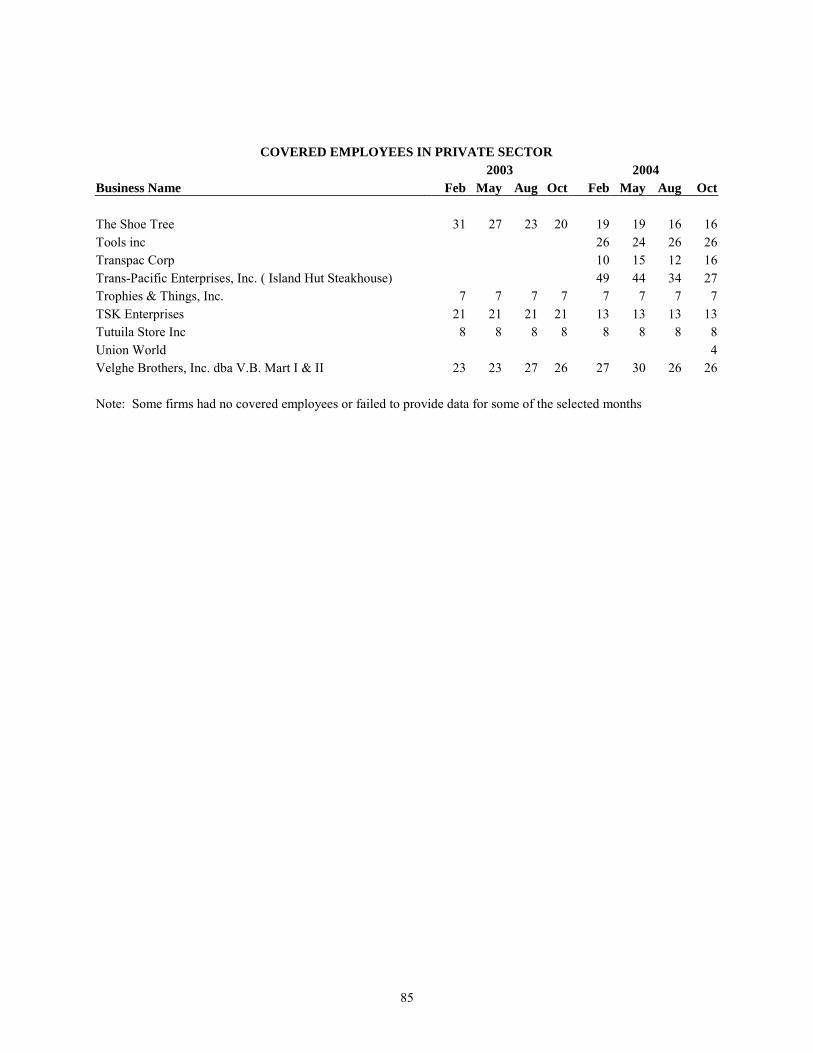
85
COVERED EMPLOYEES IN PRIVATE SECTOR 2003 2004
Business Name Feb May Aug Oct Feb May Aug Oct
The Shoe Tree 31 27 23 20 19 19 16 16 Tools inc 26 24 26 26 Transpac Corp 10 15 12 16 Trans-Pacific Enterprises, Inc. ( Island Hut Steakhouse) 49 44 34 27 Trophies & Things, Inc. 7 7 7 7 7 7 7 7 TSK Enterprises 21 21 21 21 13 13 13 13 Tutuila Store Inc 8 8 8 8 8 8 8 8 Union World 4 Velghe Brothers, Inc. dba V.B. Mart I & II 23 23 27 26 27 30 26 26 Note: Some firms had no covered employees or failed to provide data for some of the selected months
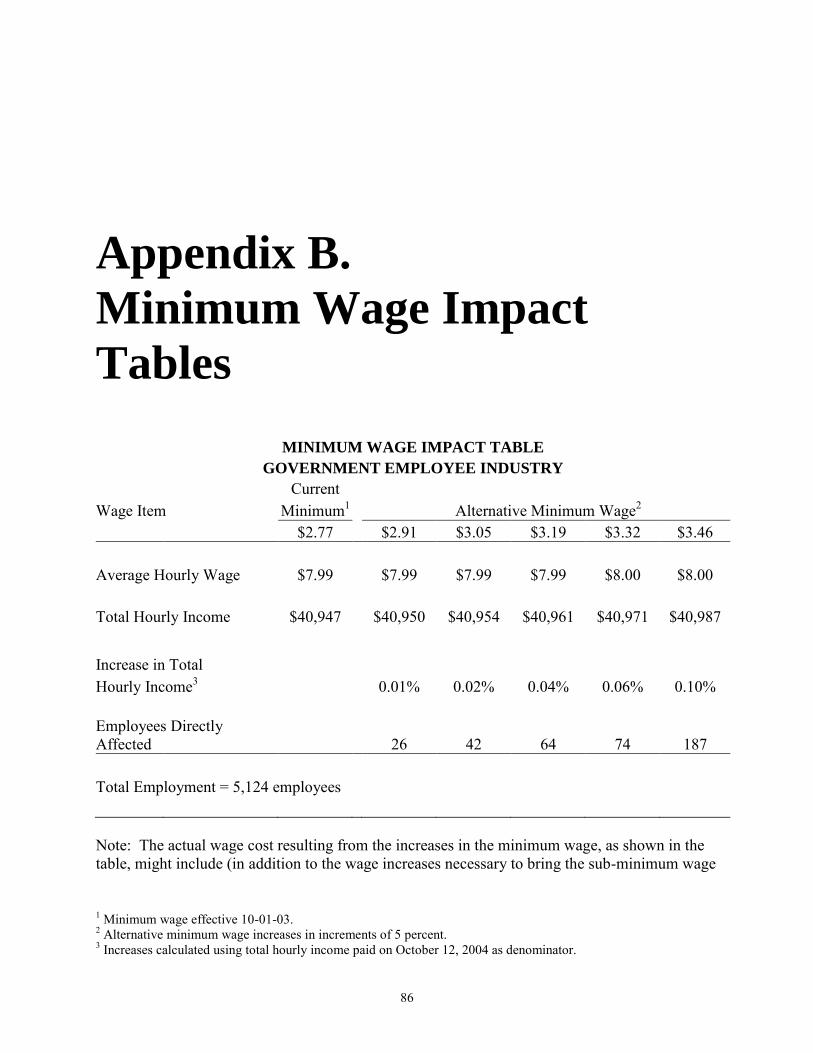
86
Appendix B.
Minimum Wage Impact
Tables
MINIMUM WAGE IMPACT TABLE GOVERNMENT EMPLOYEE INDUSTRY
Current Wage Item Minimum1 Alternative Minimum Wage2 $2.77 $2.91 $3.05 $3.19 $3.32 $3.46 Average Hourly Wage $7.99 $7.99 $7.99 $7.99 $8.00 $8.00 Total Hourly Income $40,947 $40,950 $40,954 $40,961 $40,971 $40,987
Increase in Total Hourly Income3 0.01% 0.02% 0.04% 0.06% 0.10% Employees Directly Affected 26 42 64 74 187 Total Employment = 5,124 employees Note: The actual wage cost resulting from the increases in the minimum wage, as shown in the table, might include (in addition to the wage increases necessary to bring the sub-minimum wage
1 Minimum wage effective 10-01-03. 2 Alternative minimum wage increases in increments of 5 percent. 3 Increases calculated using total hourly income paid on October 12, 2004 as denominator.

87
employees up to the minimum) eventual wage increases for hourly employees paid at or above the minimum wage in order to maintain the prior relative wage pattern.
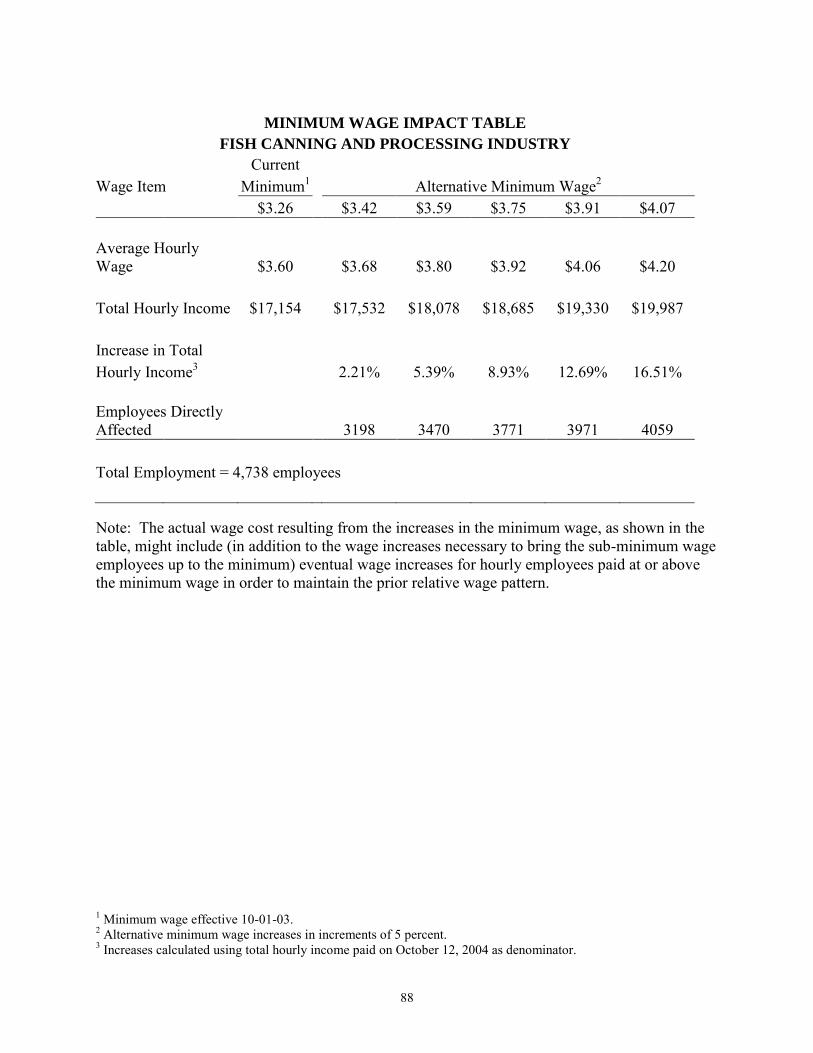
88
MINIMUM WAGE IMPACT TABLE
FISH CANNING AND PROCESSING INDUSTRY
Current Wage Item Minimum1 Alternative Minimum Wage2 $3.26 $3.42 $3.59 $3.75 $3.91 $4.07 Average Hourly Wage $3.60 $3.68 $3.80 $3.92 $4.06 $4.20 Total Hourly Income $17,154 $17,532 $18,078 $18,685 $19,330 $19,987 Increase in Total Hourly Income3 2.21% 5.39% 8.93% 12.69% 16.51% Employees Directly Affected 3198 3470 3771 3971 4059 Total Employment = 4,738 employees Note: The actual wage cost resulting from the increases in the minimum wage, as shown in the table, might include (in addition to the wage increases necessary to bring the sub-minimum wage employees up to the minimum) eventual wage increases for hourly employees paid at or above the minimum wage in order to maintain the prior relative wage pattern.
1 Minimum wage effective 10-01-03. 2 Alternative minimum wage increases in increments of 5 percent. 3 Increases calculated using total hourly income paid on October 12, 2004 as denominator.
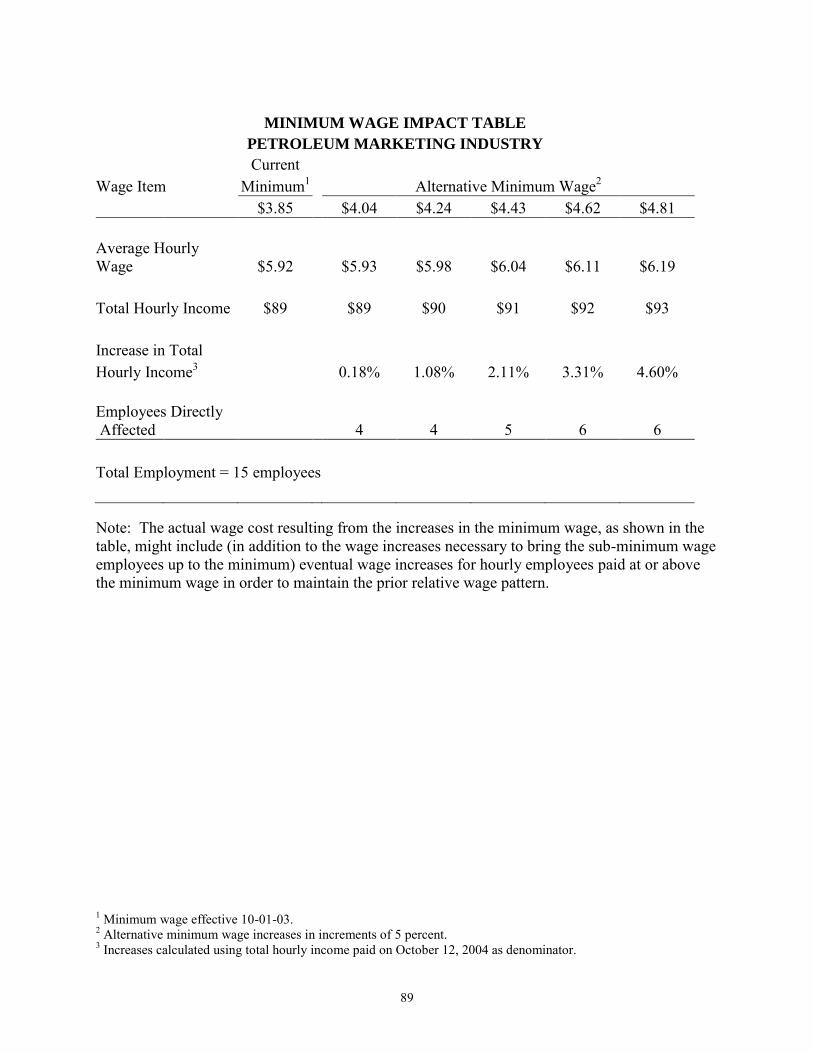
89
MINIMUM WAGE IMPACT TABLE
PETROLEUM MARKETING INDUSTRY
Current Wage Item Minimum1 Alternative Minimum Wage2 $3.85 $4.04 $4.24 $4.43 $4.62 $4.81 Average Hourly Wage $5.92 $5.93 $5.98 $6.04 $6.11 $6.19 Total Hourly Income $89 $89 $90 $91 $92 $93 Increase in Total Hourly Income3 0.18% 1.08% 2.11% 3.31% 4.60% Employees Directly Affected 4 4 5 6 6 Total Employment = 15 employees Note: The actual wage cost resulting from the increases in the minimum wage, as shown in the table, might include (in addition to the wage increases necessary to bring the sub-minimum wage employees up to the minimum) eventual wage increases for hourly employees paid at or above the minimum wage in order to maintain the prior relative wage pattern.
1 Minimum wage effective 10-01-03. 2 Alternative minimum wage increases in increments of 5 percent. 3 Increases calculated using total hourly income paid on October 12, 2004 as denominator.
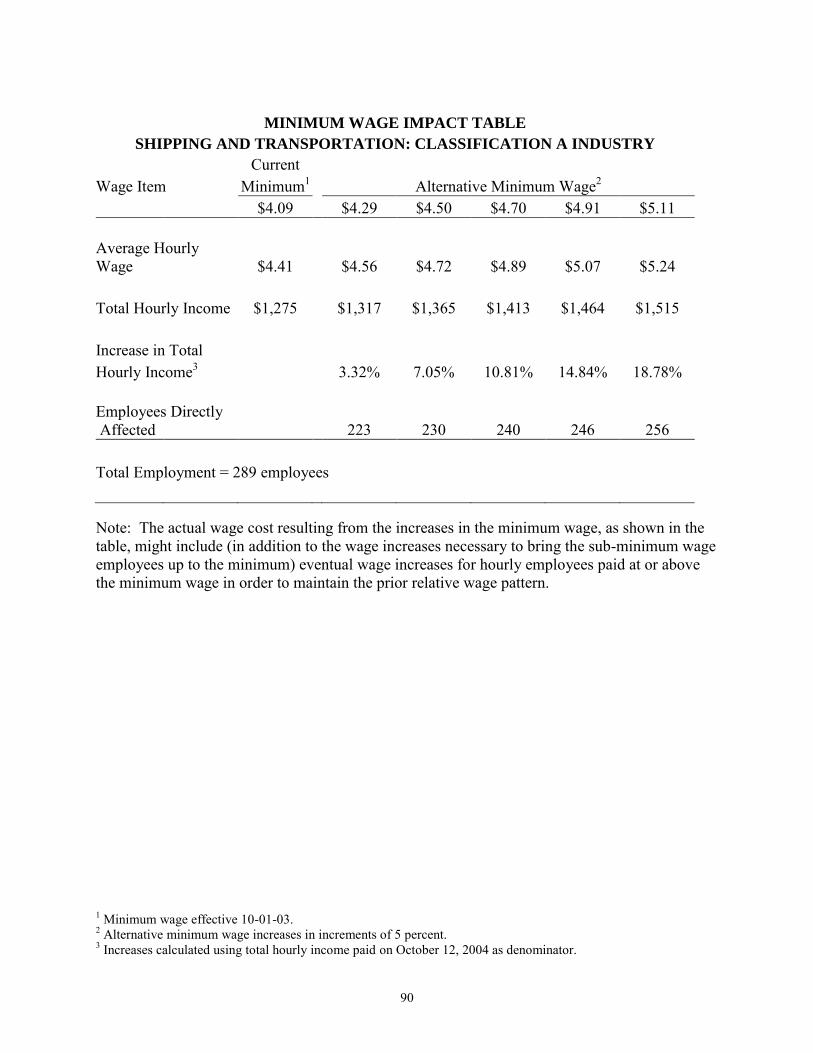
90
MINIMUM WAGE IMPACT TABLE
SHIPPING AND TRANSPORTATION: CLASSIFICATION A INDUSTRY
Current Wage Item Minimum1 Alternative Minimum Wage2 $4.09 $4.29 $4.50 $4.70 $4.91 $5.11 Average Hourly Wage $4.41 $4.56 $4.72 $4.89 $5.07 $5.24 Total Hourly Income $1,275 $1,317 $1,365 $1,413 $1,464 $1,515 Increase in Total Hourly Income3 3.32% 7.05% 10.81% 14.84% 18.78% Employees Directly Affected 223 230 240 246 256 Total Employment = 289 employees Note: The actual wage cost resulting from the increases in the minimum wage, as shown in the table, might include (in addition to the wage increases necessary to bring the sub-minimum wage employees up to the minimum) eventual wage increases for hourly employees paid at or above the minimum wage in order to maintain the prior relative wage pattern.
1 Minimum wage effective 10-01-03. 2 Alternative minimum wage increases in increments of 5 percent. 3 Increases calculated using total hourly income paid on October 12, 2004 as denominator.
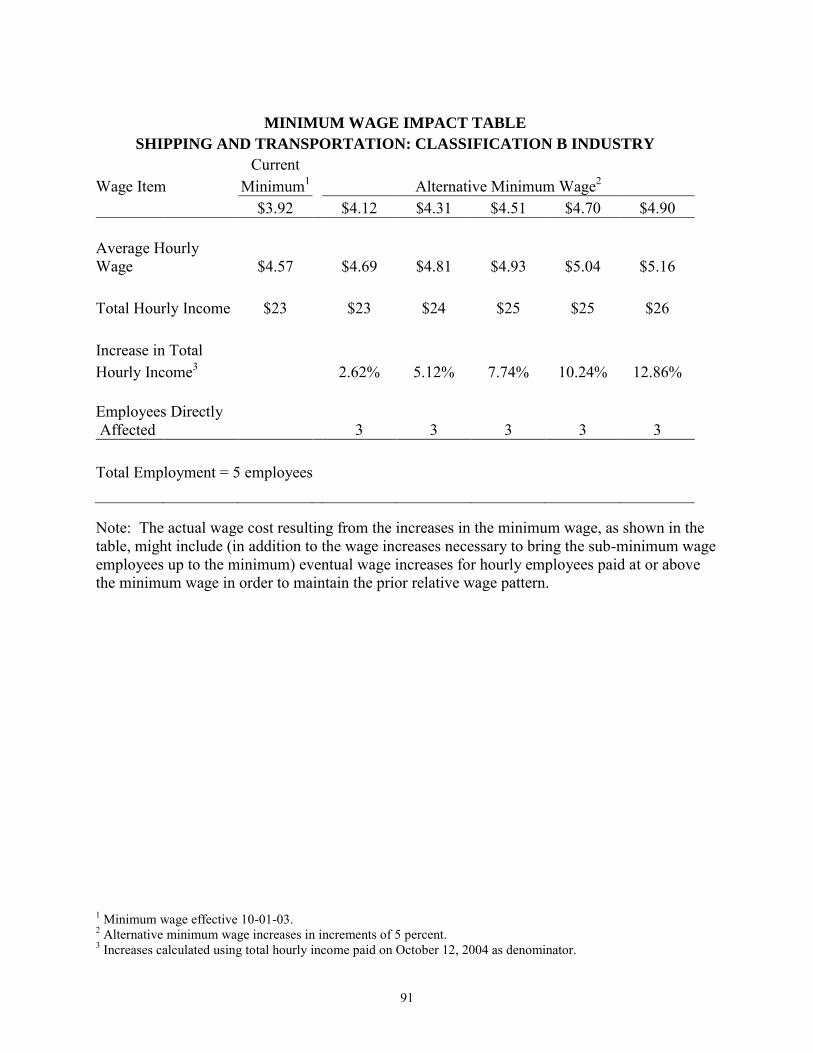
91
MINIMUM WAGE IMPACT TABLE
SHIPPING AND TRANSPORTATION: CLASSIFICATION B INDUSTRY
Current Wage Item Minimum1 Alternative Minimum Wage2 $3.92 $4.12 $4.31 $4.51 $4.70 $4.90 Average Hourly Wage $4.57 $4.69 $4.81 $4.93 $5.04 $5.16 Total Hourly Income $23 $23 $24 $25 $25 $26 Increase in Total Hourly Income3 2.62% 5.12% 7.74% 10.24% 12.86% Employees Directly Affected 3 3 3 3 3 Total Employment = 5 employees Note: The actual wage cost resulting from the increases in the minimum wage, as shown in the table, might include (in addition to the wage increases necessary to bring the sub-minimum wage employees up to the minimum) eventual wage increases for hourly employees paid at or above the minimum wage in order to maintain the prior relative wage pattern.
1 Minimum wage effective 10-01-03. 2 Alternative minimum wage increases in increments of 5 percent. 3 Increases calculated using total hourly income paid on October 12, 2004 as denominator.
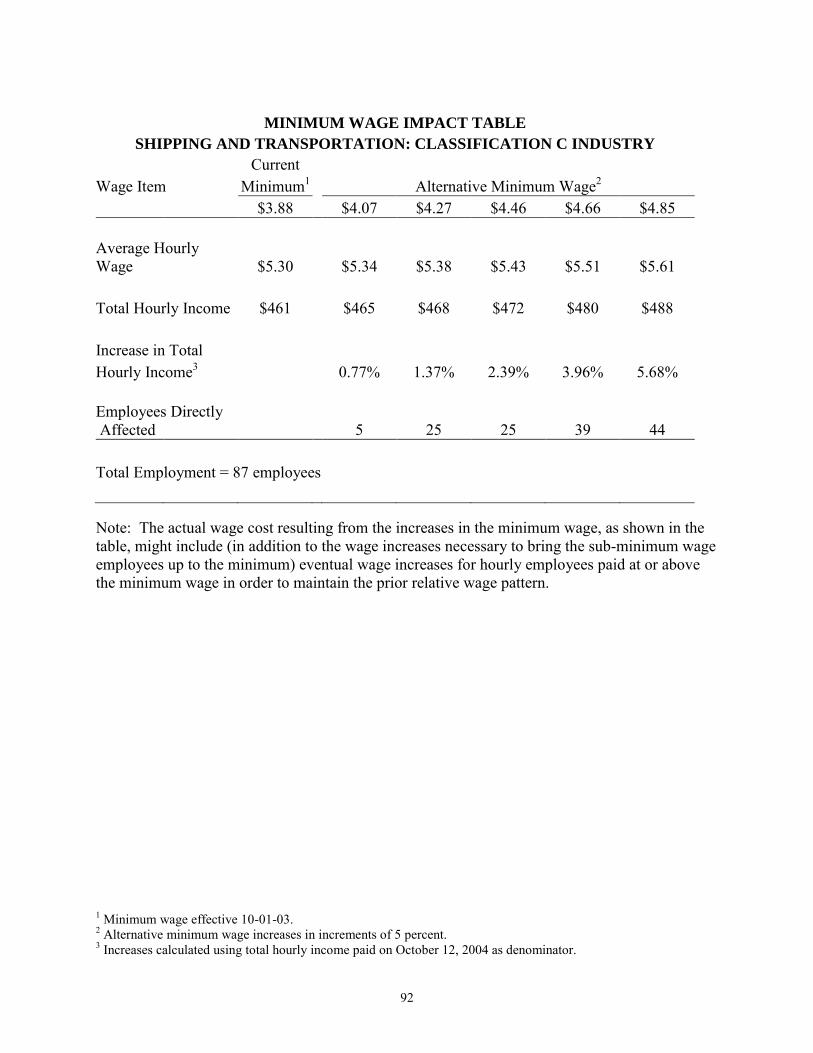
92
MINIMUM WAGE IMPACT TABLE
SHIPPING AND TRANSPORTATION: CLASSIFICATION C INDUSTRY
Current Wage Item Minimum1 Alternative Minimum Wage2 $3.88 $4.07 $4.27 $4.46 $4.66 $4.85 Average Hourly Wage $5.30 $5.34 $5.38 $5.43 $5.51 $5.61 Total Hourly Income $461 $465 $468 $472 $480 $488 Increase in Total Hourly Income3 0.77% 1.37% 2.39% 3.96% 5.68% Employees Directly Affected 5 25 25 39 44 Total Employment = 87 employees Note: The actual wage cost resulting from the increases in the minimum wage, as shown in the table, might include (in addition to the wage increases necessary to bring the sub-minimum wage employees up to the minimum) eventual wage increases for hourly employees paid at or above the minimum wage in order to maintain the prior relative wage pattern.
1 Minimum wage effective 10-01-03. 2 Alternative minimum wage increases in increments of 5 percent. 3 Increases calculated using total hourly income paid on October 12, 2004 as denominator.
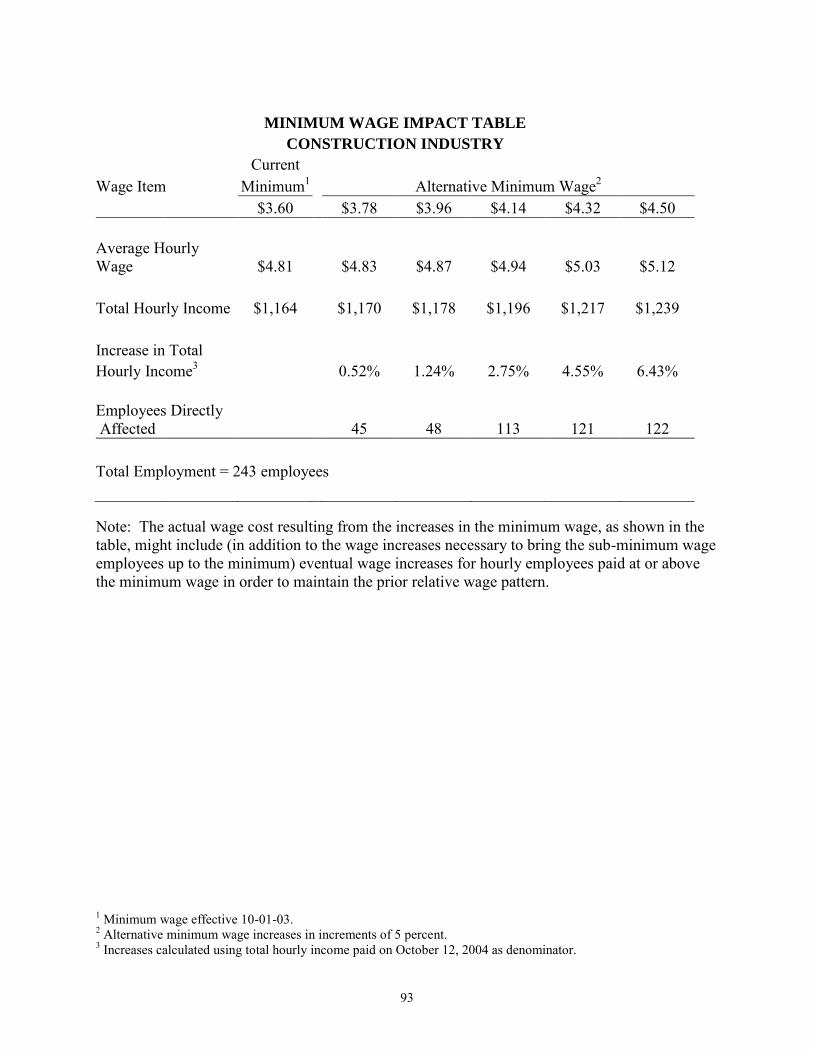
93
MINIMUM WAGE IMPACT TABLE
CONSTRUCTION INDUSTRY
Current Wage Item Minimum1 Alternative Minimum Wage2 $3.60 $3.78 $3.96 $4.14 $4.32 $4.50 Average Hourly Wage $4.81 $4.83 $4.87 $4.94 $5.03 $5.12 Total Hourly Income $1,164 $1,170 $1,178 $1,196 $1,217 $1,239 Increase in Total Hourly Income3 0.52% 1.24% 2.75% 4.55% 6.43% Employees Directly Affected 45 48 113 121 122 Total Employment = 243 employees Note: The actual wage cost resulting from the increases in the minimum wage, as shown in the table, might include (in addition to the wage increases necessary to bring the sub-minimum wage employees up to the minimum) eventual wage increases for hourly employees paid at or above the minimum wage in order to maintain the prior relative wage pattern.
1 Minimum wage effective 10-01-03. 2 Alternative minimum wage increases in increments of 5 percent. 3 Increases calculated using total hourly income paid on October 12, 2004 as denominator.
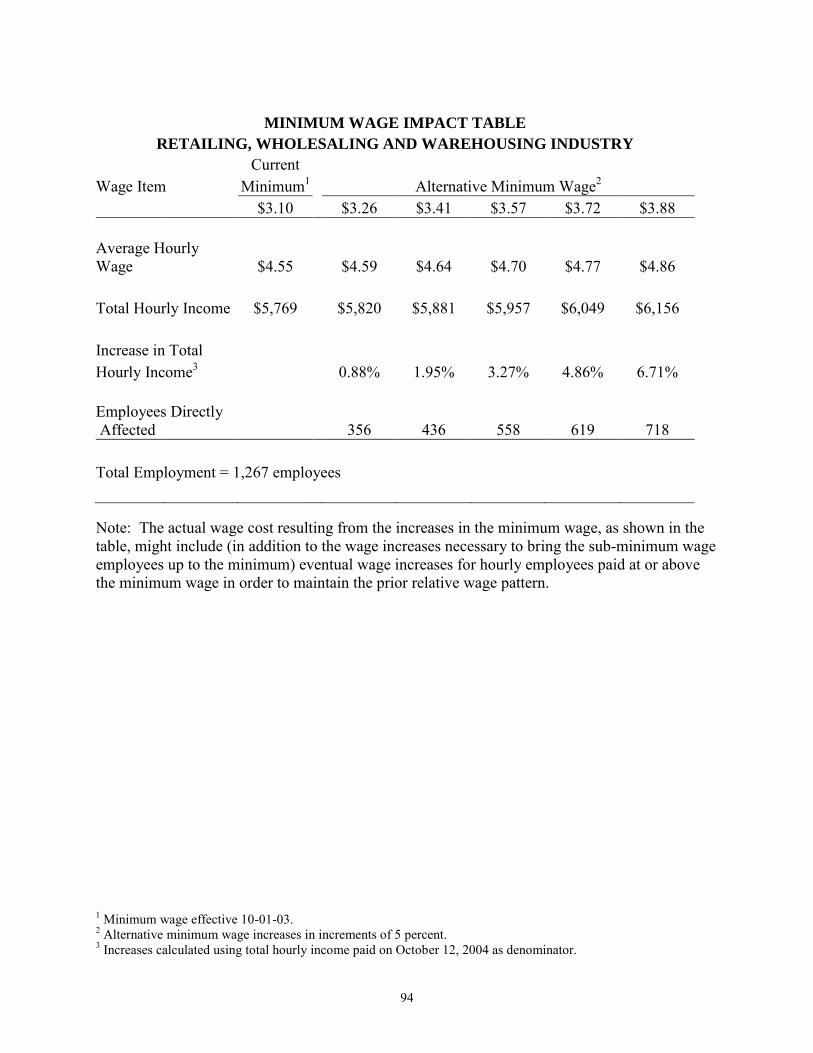
94
MINIMUM WAGE IMPACT TABLE
RETAILING, WHOLESALING AND WAREHOUSING INDUSTRY
Current Wage Item Minimum1 Alternative Minimum Wage2 $3.10 $3.26 $3.41 $3.57 $3.72 $3.88 Average Hourly Wage $4.55 $4.59 $4.64 $4.70 $4.77 $4.86 Total Hourly Income $5,769 $5,820 $5,881 $5,957 $6,049 $6,156 Increase in Total Hourly Income3 0.88% 1.95% 3.27% 4.86% 6.71% Employees Directly Affected 356 436 558 619 718 Total Employment = 1,267 employees Note: The actual wage cost resulting from the increases in the minimum wage, as shown in the table, might include (in addition to the wage increases necessary to bring the sub-minimum wage employees up to the minimum) eventual wage increases for hourly employees paid at or above the minimum wage in order to maintain the prior relative wage pattern.
1 Minimum wage effective 10-01-03. 2 Alternative minimum wage increases in increments of 5 percent. 3 Increases calculated using total hourly income paid on October 12, 2004 as denominator.
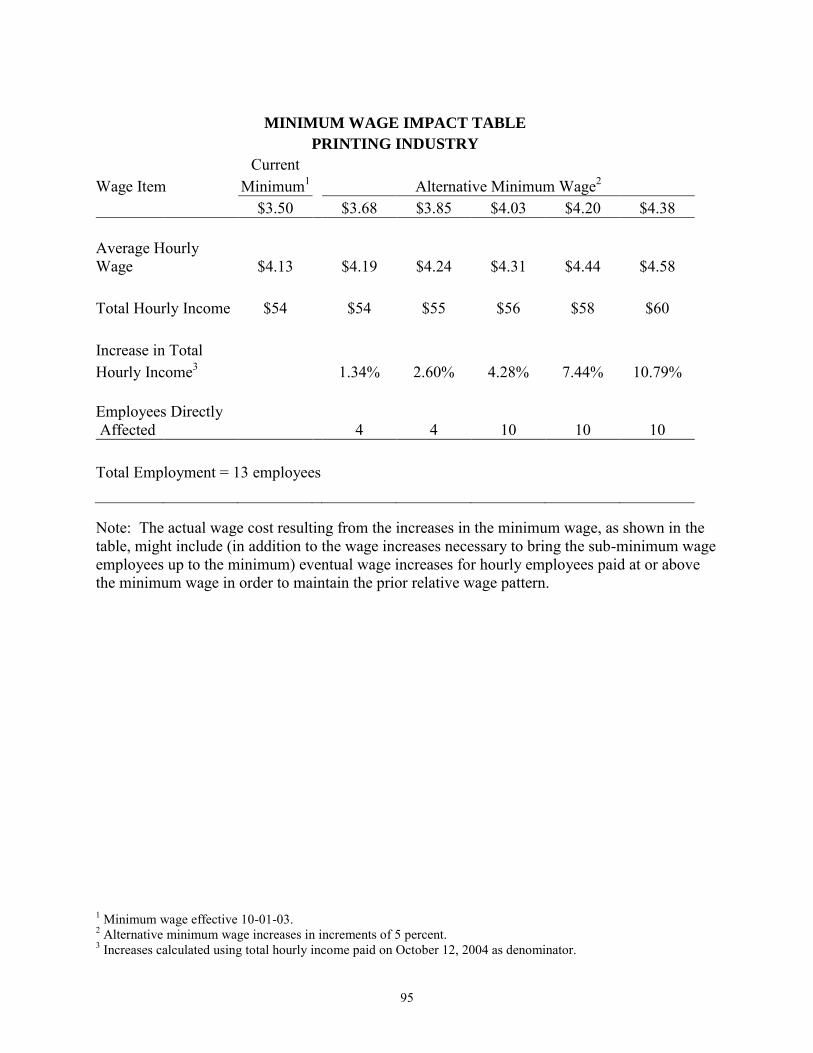
95
MINIMUM WAGE IMPACT TABLE
PRINTING INDUSTRY
Current Wage Item Minimum1 Alternative Minimum Wage2 $3.50 $3.68 $3.85 $4.03 $4.20 $4.38 Average Hourly Wage $4.13 $4.19 $4.24 $4.31 $4.44 $4.58 Total Hourly Income $54 $54 $55 $56 $58 $60 Increase in Total Hourly Income3 1.34% 2.60% 4.28% 7.44% 10.79% Employees Directly Affected 4 4 10 10 10 Total Employment = 13 employees Note: The actual wage cost resulting from the increases in the minimum wage, as shown in the table, might include (in addition to the wage increases necessary to bring the sub-minimum wage employees up to the minimum) eventual wage increases for hourly employees paid at or above the minimum wage in order to maintain the prior relative wage pattern.
1 Minimum wage effective 10-01-03. 2 Alternative minimum wage increases in increments of 5 percent. 3 Increases calculated using total hourly income paid on October 12, 2004 as denominator.
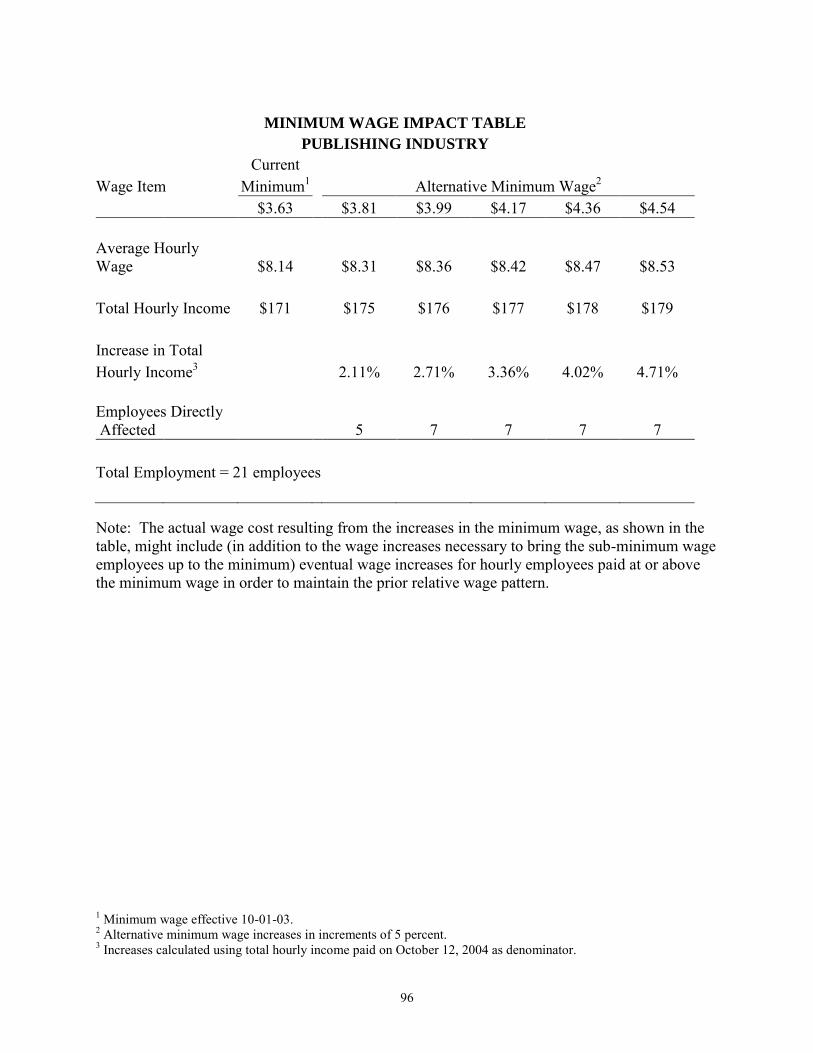
96
MINIMUM WAGE IMPACT TABLE
PUBLISHING INDUSTRY
Current Wage Item Minimum1 Alternative Minimum Wage2 $3.63 $3.81 $3.99 $4.17 $4.36 $4.54 Average Hourly Wage $8.14 $8.31 $8.36 $8.42 $8.47 $8.53 Total Hourly Income $171 $175 $176 $177 $178 $179 Increase in Total Hourly Income3 2.11% 2.71% 3.36% 4.02% 4.71% Employees Directly Affected 5 7 7 7 7 Total Employment = 21 employees Note: The actual wage cost resulting from the increases in the minimum wage, as shown in the table, might include (in addition to the wage increases necessary to bring the sub-minimum wage employees up to the minimum) eventual wage increases for hourly employees paid at or above the minimum wage in order to maintain the prior relative wage pattern.
1 Minimum wage effective 10-01-03. 2 Alternative minimum wage increases in increments of 5 percent. 3 Increases calculated using total hourly income paid on October 12, 2004 as denominator.
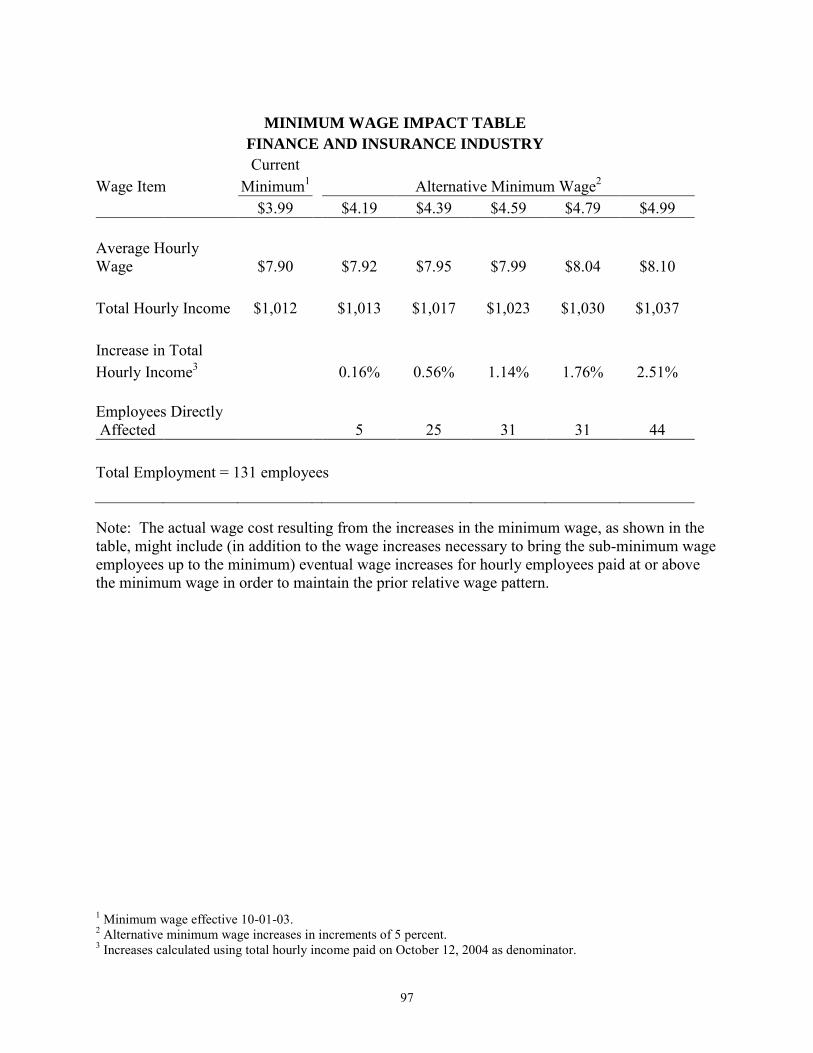
97
MINIMUM WAGE IMPACT TABLE
FINANCE AND INSURANCE INDUSTRY
Current Wage Item Minimum1 Alternative Minimum Wage2 $3.99 $4.19 $4.39 $4.59 $4.79 $4.99 Average Hourly Wage $7.90 $7.92 $7.95 $7.99 $8.04 $8.10 Total Hourly Income $1,012 $1,013 $1,017 $1,023 $1,030 $1,037 Increase in Total Hourly Income3 0.16% 0.56% 1.14% 1.76% 2.51% Employees Directly Affected 5 25 31 31 44 Total Employment = 131 employees Note: The actual wage cost resulting from the increases in the minimum wage, as shown in the table, might include (in addition to the wage increases necessary to bring the sub-minimum wage employees up to the minimum) eventual wage increases for hourly employees paid at or above the minimum wage in order to maintain the prior relative wage pattern.
1 Minimum wage effective 10-01-03. 2 Alternative minimum wage increases in increments of 5 percent. 3 Increases calculated using total hourly income paid on October 12, 2004 as denominator.
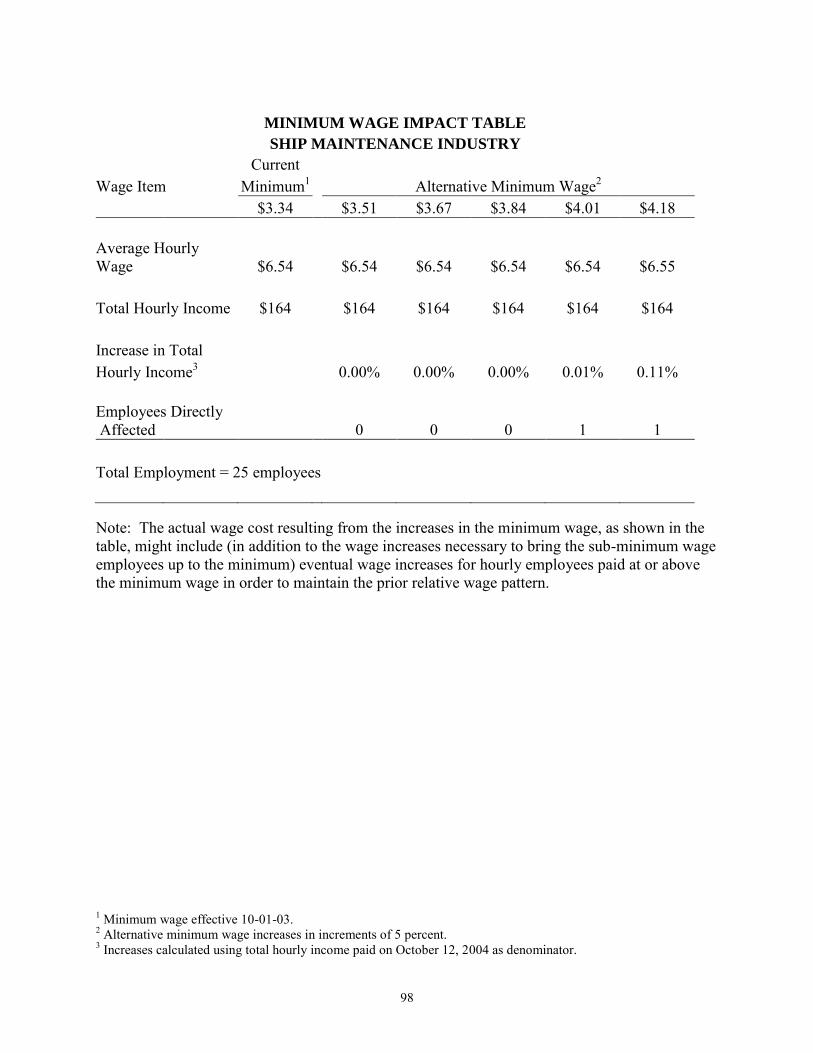
98
MINIMUM WAGE IMPACT TABLE SHIP MAINTENANCE INDUSTRY
Current Wage Item Minimum1 Alternative Minimum Wage2 $3.34 $3.51 $3.67 $3.84 $4.01 $4.18 Average Hourly Wage $6.54 $6.54 $6.54 $6.54 $6.54 $6.55 Total Hourly Income $164 $164 $164 $164 $164 $164 Increase in Total Hourly Income3 0.00% 0.00% 0.00% 0.01% 0.11% Employees Directly Affected 0 0 0 1 1 Total Employment = 25 employees Note: The actual wage cost resulting from the increases in the minimum wage, as shown in the table, might include (in addition to the wage increases necessary to bring the sub-minimum wage employees up to the minimum) eventual wage increases for hourly employees paid at or above the minimum wage in order to maintain the prior relative wage pattern.
1 Minimum wage effective 10-01-03. 2 Alternative minimum wage increases in increments of 5 percent. 3 Increases calculated using total hourly income paid on October 12, 2004 as denominator.
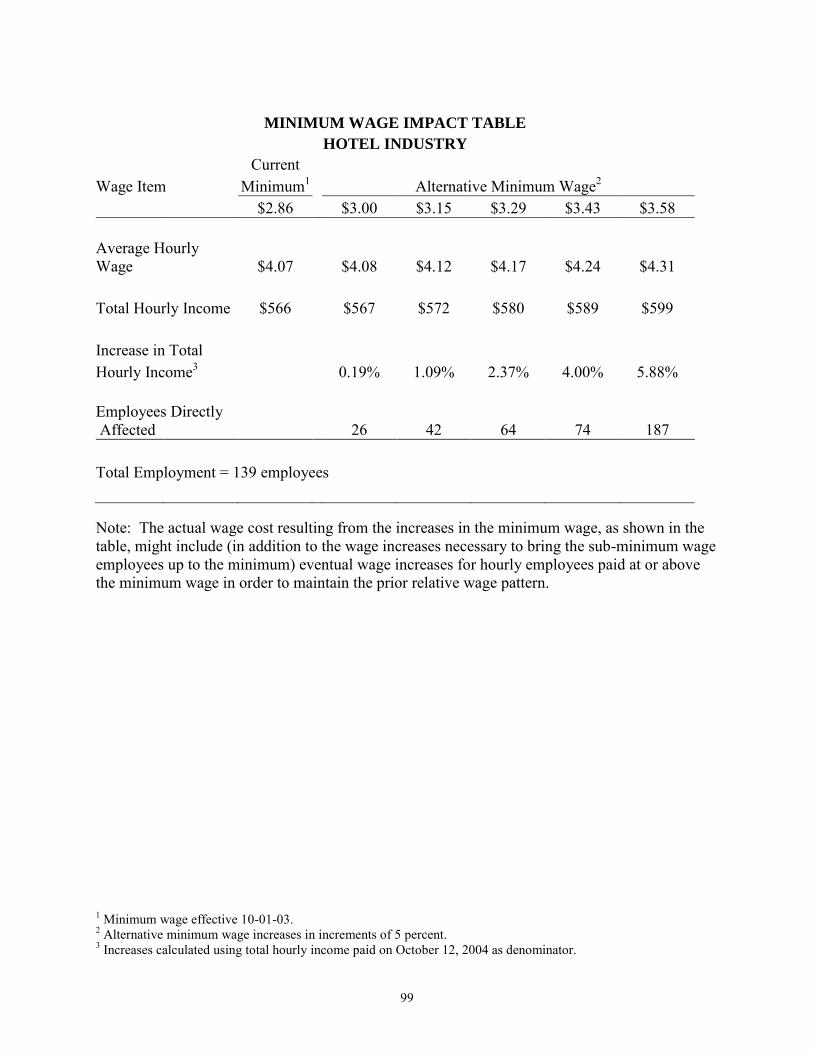
99
MINIMUM WAGE IMPACT TABLE
HOTEL INDUSTRY
Current Wage Item Minimum1 Alternative Minimum Wage2 $2.86 $3.00 $3.15 $3.29 $3.43 $3.58 Average Hourly Wage $4.07 $4.08 $4.12 $4.17 $4.24 $4.31 Total Hourly Income $566 $567 $572 $580 $589 $599 Increase in Total Hourly Income3 0.19% 1.09% 2.37% 4.00% 5.88% Employees Directly Affected 26 42 64 74 187 Total Employment = 139 employees Note: The actual wage cost resulting from the increases in the minimum wage, as shown in the table, might include (in addition to the wage increases necessary to bring the sub-minimum wage employees up to the minimum) eventual wage increases for hourly employees paid at or above the minimum wage in order to maintain the prior relative wage pattern.
1 Minimum wage effective 10-01-03. 2 Alternative minimum wage increases in increments of 5 percent. 3 Increases calculated using total hourly income paid on October 12, 2004 as denominator.
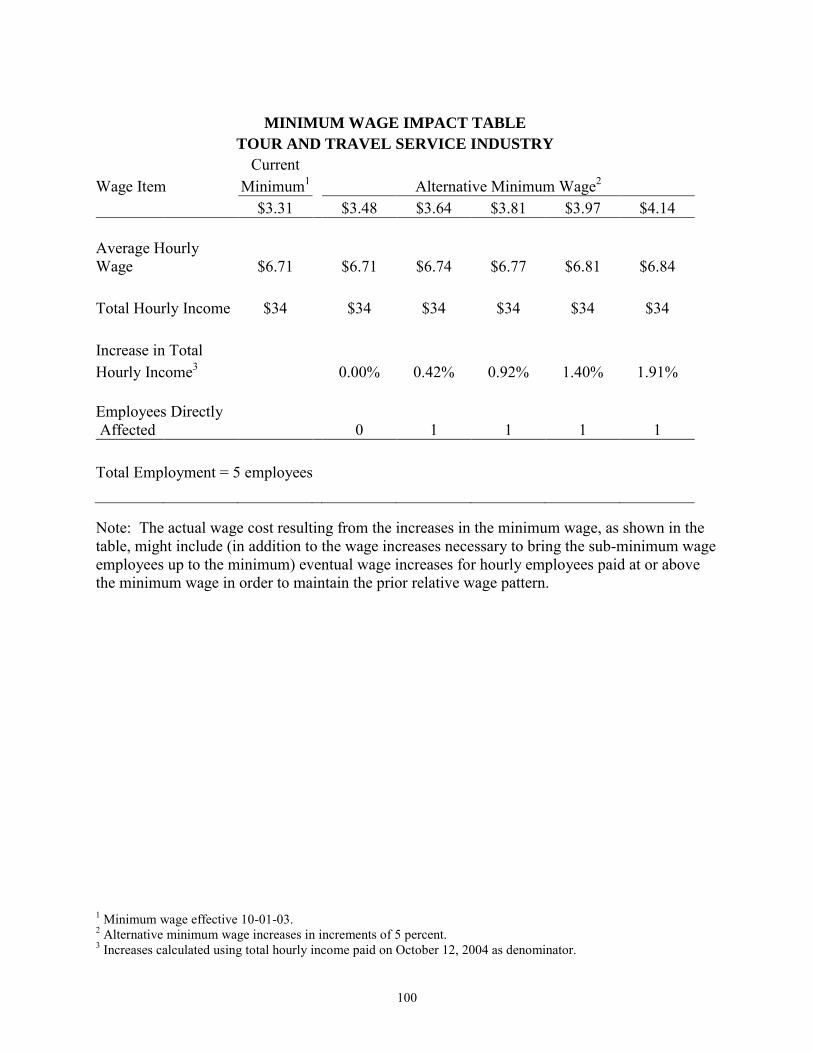
100
MINIMUM WAGE IMPACT TABLE
TOUR AND TRAVEL SERVICE INDUSTRY
Current Wage Item Minimum1 Alternative Minimum Wage2 $3.31 $3.48 $3.64 $3.81 $3.97 $4.14 Average Hourly Wage $6.71 $6.71 $6.74 $6.77 $6.81 $6.84 Total Hourly Income $34 $34 $34 $34 $34 $34 Increase in Total Hourly Income3 0.00% 0.42% 0.92% 1.40% 1.91% Employees Directly Affected 0 1 1 1 1 Total Employment = 5 employees Note: The actual wage cost resulting from the increases in the minimum wage, as shown in the table, might include (in addition to the wage increases necessary to bring the sub-minimum wage employees up to the minimum) eventual wage increases for hourly employees paid at or above the minimum wage in order to maintain the prior relative wage pattern.
1 Minimum wage effective 10-01-03. 2 Alternative minimum wage increases in increments of 5 percent. 3 Increases calculated using total hourly income paid on October 12, 2004 as denominator.
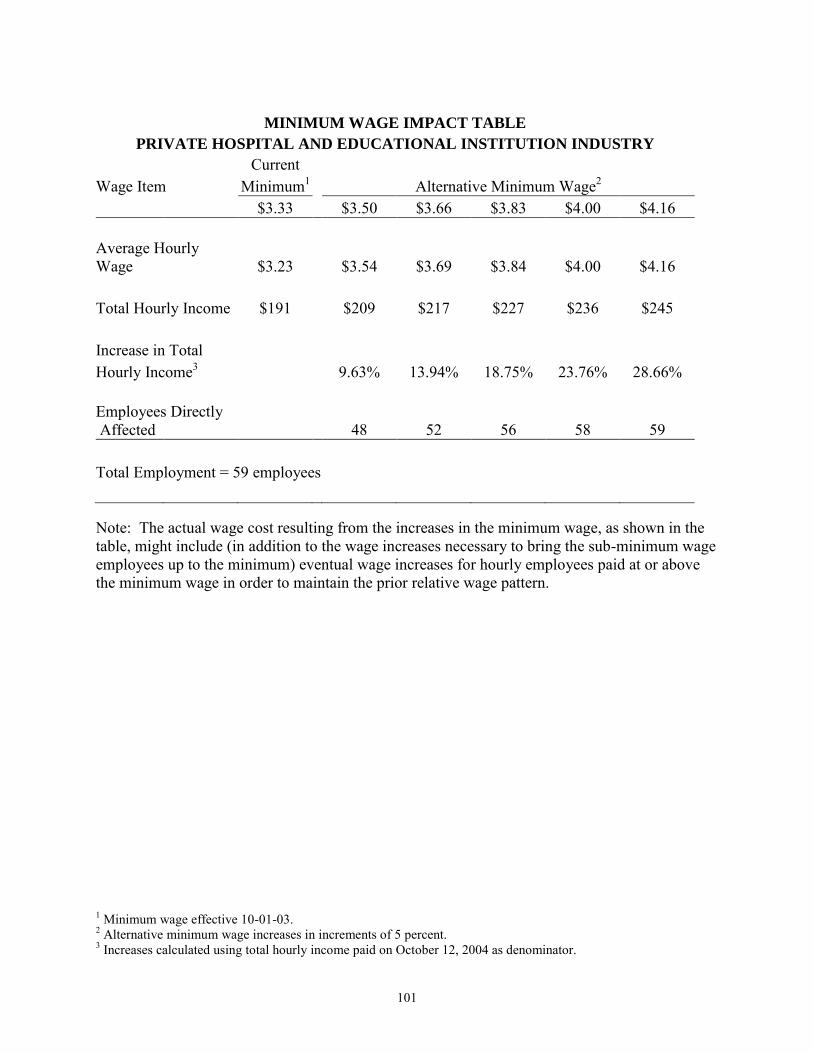
101
MINIMUM WAGE IMPACT TABLE
PRIVATE HOSPITAL AND EDUCATIONAL INSTITUTION INDUSTRY
Current Wage Item Minimum1 Alternative Minimum Wage2 $3.33 $3.50 $3.66 $3.83 $4.00 $4.16 Average Hourly Wage $3.23 $3.54 $3.69 $3.84 $4.00 $4.16 Total Hourly Income $191 $209 $217 $227 $236 $245 Increase in Total Hourly Income3 9.63% 13.94% 18.75% 23.76% 28.66% Employees Directly Affected 48 52 56 58 59 Total Employment = 59 employees Note: The actual wage cost resulting from the increases in the minimum wage, as shown in the table, might include (in addition to the wage increases necessary to bring the sub-minimum wage employees up to the minimum) eventual wage increases for hourly employees paid at or above the minimum wage in order to maintain the prior relative wage pattern.
1 Minimum wage effective 10-01-03. 2 Alternative minimum wage increases in increments of 5 percent. 3 Increases calculated using total hourly income paid on October 12, 2004 as denominator.

102
MINIMUM WAGE IMPACT TABLE
MISCELLANEOUS INDUSTRY
Current Wage Item Minimum1 Alternative Minimum Wage2 $2.57 $2.70 $2.83 $2.96 $3.08 $3.21 Average Hourly Wage $5.01 $5.01 $5.01 $5.02 $5.04 $5.06 Total Hourly Income $516 $516 $516 $517 $519 $521 Increase in Total Hourly Income3 0.05% 0.12% 0.22% 0.55% 1.00% Employees Directly Affected 2 4 4 18 19 Total Employment = 103 employees Note: The actual wage cost resulting from the increases in the minimum wage, as shown in the table, might include (in addition to the wage increases necessary to bring the sub-minimum wage employees up to the minimum) eventual wage increases for hourly employees paid at or above the minimum wage in order to maintain the prior relative wage pattern.
1 Minimum wage effective 10-01-03. 2 Alternative minimum wage increases in increments of 5 percent. 3 Increases calculated using total hourly income paid on October 12, 2004 as denominator.

103
Appendix C.
Tables for Chapter V Figures
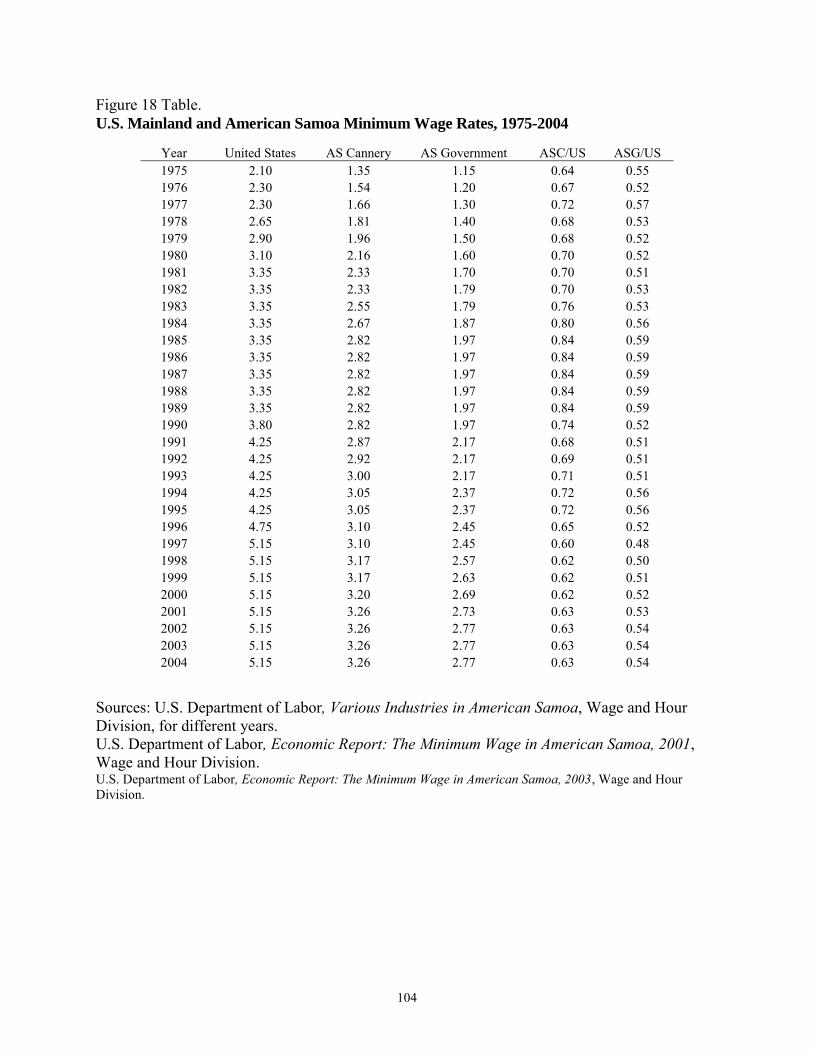
104
Figure 18 Table. U.S. Mainland and American Samoa Minimum Wage Rates, 1975-2004 Sources: U.S. Department of Labor, Various Industries in American Samoa, Wage and Hour Division, for different years. U.S. Department of Labor, Economic Report: The Minimum Wage in American Samoa, 2001, Wage and Hour Division. U.S. Department of Labor, Economic Report: The Minimum Wage in American Samoa, 2003, Wage and Hour Division.
Year United States AS Cannery AS Government ASC/US ASG/US 1975 2.10 1.35 1.15 0.64 0.55 1976 2.30 1.54 1.20 0.67 0.52 1977 2.30 1.66 1.30 0.72 0.57 1978 2.65 1.81 1.40 0.68 0.53 1979 2.90 1.96 1.50 0.68 0.52 1980 3.10 2.16 1.60 0.70 0.52 1981 3.35 2.33 1.70 0.70 0.51 1982 3.35 2.33 1.79 0.70 0.53 1983 3.35 2.55 1.79 0.76 0.53 1984 3.35 2.67 1.87 0.80 0.56 1985 3.35 2.82 1.97 0.84 0.59 1986 3.35 2.82 1.97 0.84 0.59 1987 3.35 2.82 1.97 0.84 0.59 1988 3.35 2.82 1.97 0.84 0.59 1989 3.35 2.82 1.97 0.84 0.59 1990 3.80 2.82 1.97 0.74 0.52 1991 4.25 2.87 2.17 0.68 0.51 1992 4.25 2.92 2.17 0.69 0.51 1993 4.25 3.00 2.17 0.71 0.51 1994 4.25 3.05 2.37 0.72 0.56 1995 4.25 3.05 2.37 0.72 0.56 1996 4.75 3.10 2.45 0.65 0.52 1997 5.15 3.10 2.45 0.60 0.48 1998 5.15 3.17 2.57 0.62 0.50 1999 5.15 3.17 2.63 0.62 0.51 2000 5.15 3.20 2.69 0.62 0.52 2001 5.15 3.26 2.73 0.63 0.53 2002 5.15 3.26 2.77 0.63 0.54 2003 5.15 3.26 2.77 0.63 0.54 2004 5.15 3.26 2.77 0.63 0.54
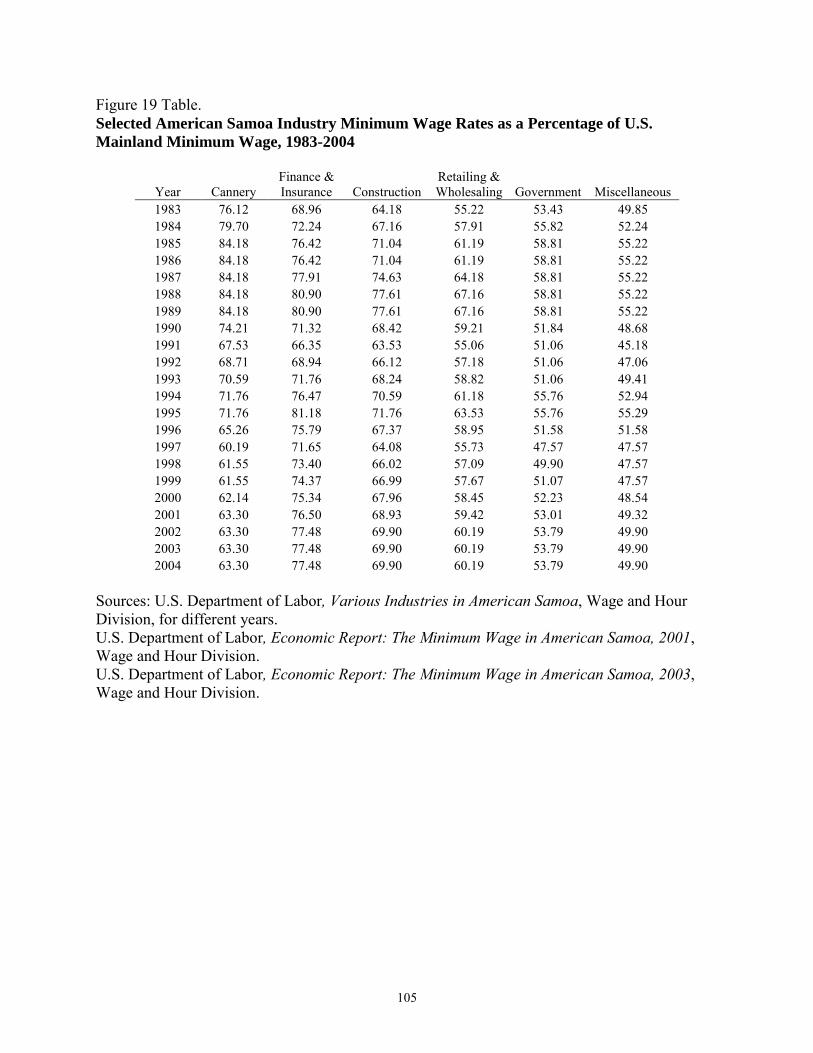
105
Figure 19 Table. Selected American Samoa Industry Minimum Wage Rates as a Percentage of U.S.
Mainland Minimum Wage, 1983-2004
Year Cannery Finance & Insurance Construction
Retailing & Wholesaling Government Miscellaneous
1983 76.12 68.96 64.18 55.22 53.43 49.85 1984 79.70 72.24 67.16 57.91 55.82 52.24 1985 84.18 76.42 71.04 61.19 58.81 55.22 1986 84.18 76.42 71.04 61.19 58.81 55.22 1987 84.18 77.91 74.63 64.18 58.81 55.22 1988 84.18 80.90 77.61 67.16 58.81 55.22 1989 84.18 80.90 77.61 67.16 58.81 55.22 1990 74.21 71.32 68.42 59.21 51.84 48.68 1991 67.53 66.35 63.53 55.06 51.06 45.18 1992 68.71 68.94 66.12 57.18 51.06 47.06 1993 70.59 71.76 68.24 58.82 51.06 49.41 1994 71.76 76.47 70.59 61.18 55.76 52.94 1995 71.76 81.18 71.76 63.53 55.76 55.29 1996 65.26 75.79 67.37 58.95 51.58 51.58 1997 60.19 71.65 64.08 55.73 47.57 47.57 1998 61.55 73.40 66.02 57.09 49.90 47.57 1999 61.55 74.37 66.99 57.67 51.07 47.57 2000 62.14 75.34 67.96 58.45 52.23 48.54 2001 63.30 76.50 68.93 59.42 53.01 49.32 2002 63.30 77.48 69.90 60.19 53.79 49.90 2003 63.30 77.48 69.90 60.19 53.79 49.90 2004 63.30 77.48 69.90 60.19 53.79 49.90
Sources: U.S. Department of Labor, Various Industries in American Samoa, Wage and Hour Division, for different years. U.S. Department of Labor, Economic Report: The Minimum Wage in American Samoa, 2001, Wage and Hour Division. U.S. Department of Labor, Economic Report: The Minimum Wage in American Samoa, 2003, Wage and Hour Division.
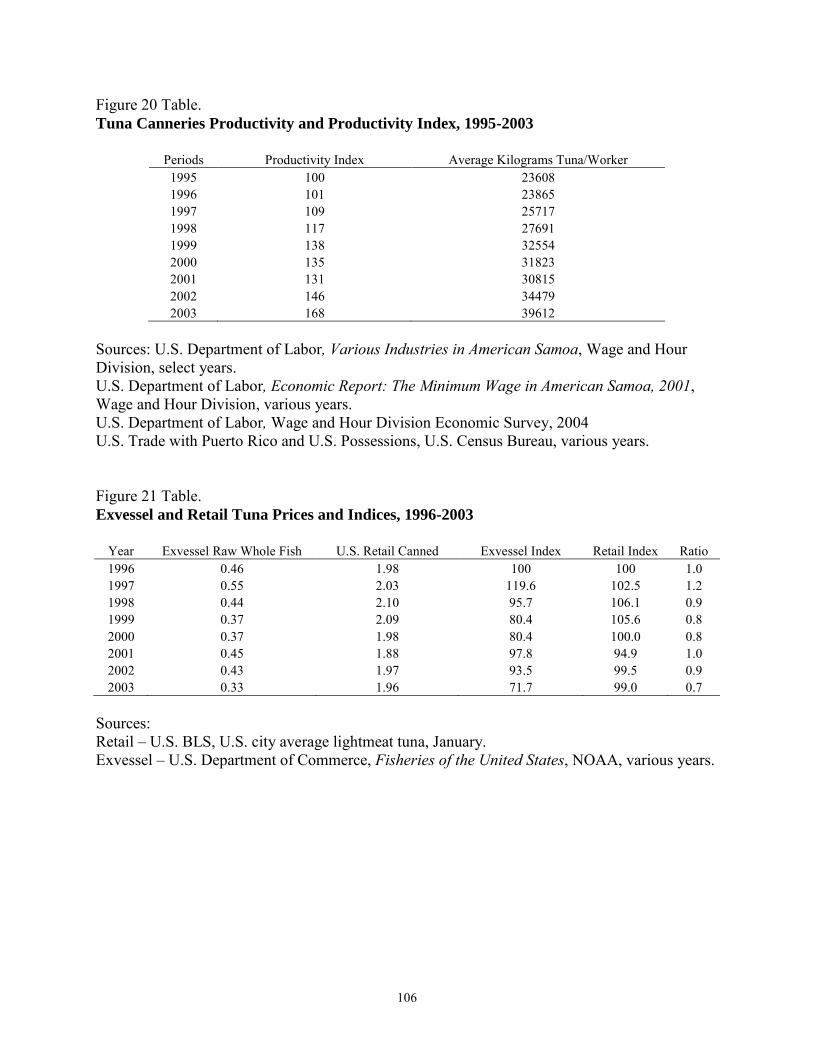
106
Figure 20 Table. Tuna Canneries Productivity and Productivity Index, 1995-2003
Periods Productivity Index Average Kilograms Tuna/Worker 1995 100 23608 1996 101 23865 1997 109 25717 1998 117 27691 1999 138 32554 2000 135 31823 2001 131 30815 2002 146 34479 2003 168 39612
Sources: U.S. Department of Labor, Various Industries in American Samoa, Wage and Hour Division, select years. U.S. Department of Labor, Economic Report: The Minimum Wage in American Samoa, 2001, Wage and Hour Division, various years. U.S. Department of Labor, Wage and Hour Division Economic Survey, 2004 U.S. Trade with Puerto Rico and U.S. Possessions, U.S. Census Bureau, various years. Figure 21 Table. Exvessel and Retail Tuna Prices and Indices, 1996-2003
Year Exvessel Raw Whole Fish U.S. Retail Canned Exvessel Index Retail Index Ratio 1996 0.46 1.98 100 100 1.0 1997 0.55 2.03 119.6 102.5 1.2 1998 0.44 2.10 95.7 106.1 0.9 1999 0.37 2.09 80.4 105.6 0.8 2000 0.37 1.98 80.4 100.0 0.8 2001 0.45 1.88 97.8 94.9 1.0 2002 0.43 1.97 93.5 99.5 0.9 2003 0.33 1.96 71.7 99.0 0.7
Sources: Retail – U.S. BLS, U.S. city average lightmeat tuna, January. Exvessel – U.S. Department of Commerce, Fisheries of the United States, NOAA, various years.
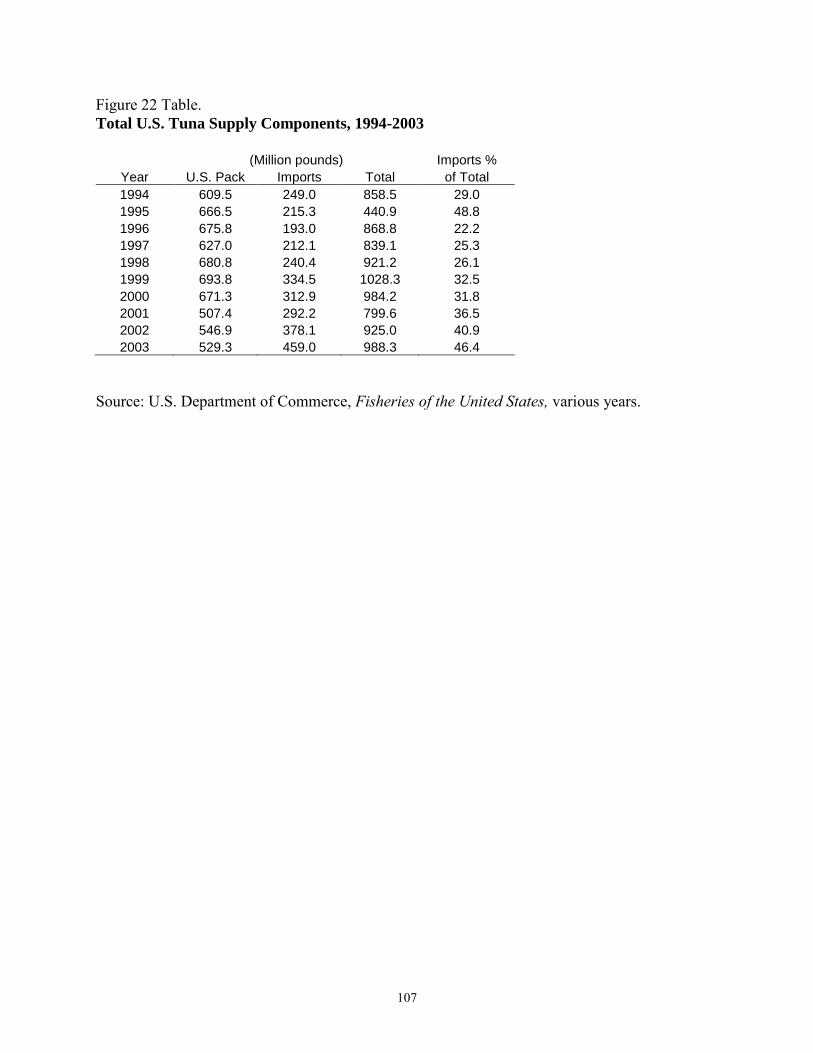
107
Figure 22 Table. Total U.S. Tuna Supply Components, 1994-2003
(Million pounds) Imports %
Year U.S. Pack Imports Total of Total
1994 609.5 249.0 858.5 29.0
1995 666.5 215.3 440.9 48.8
1996 675.8 193.0 868.8 22.2
1997 627.0 212.1 839.1 25.3
1998 680.8 240.4 921.2 26.1
1999 693.8 334.5 1028.3 32.5
2000 671.3 312.9 984.2 31.8
2001 507.4 292.2 799.6 36.5
2002 546.9 378.1 925.0 40.9
2003 529.3 459.0 988.3 46.4
Source: U.S. Department of Commerce, Fisheries of the United States, various years.
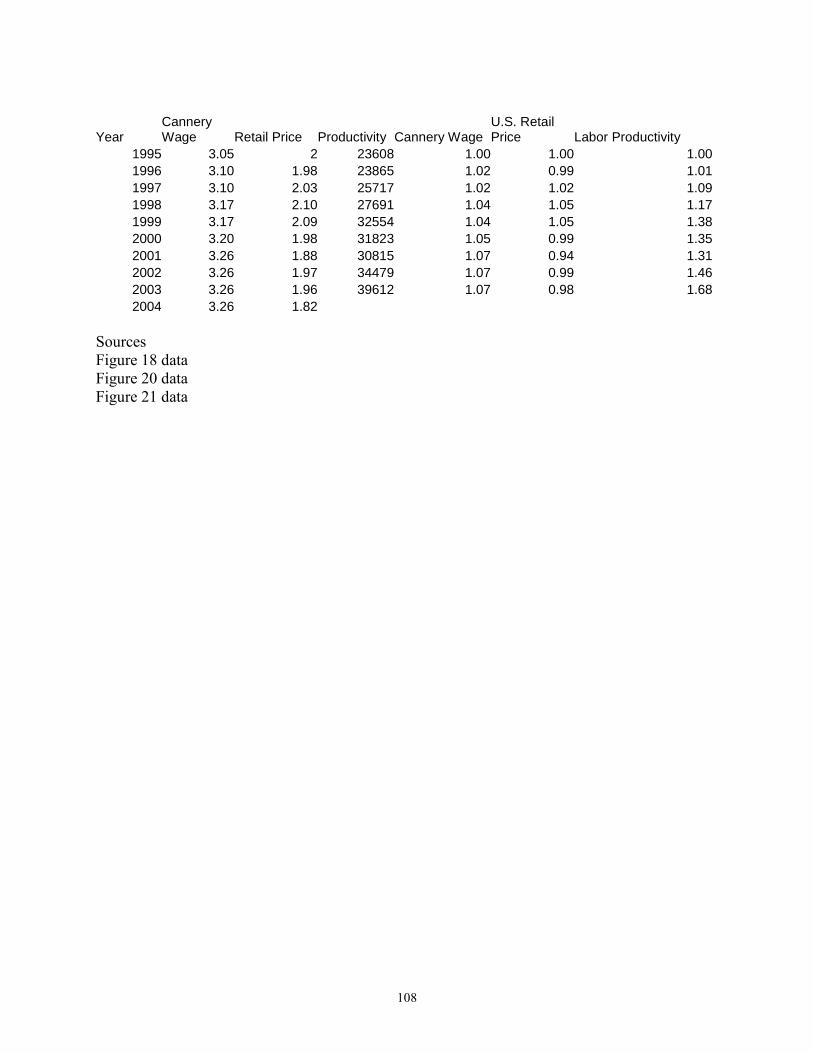
108
Year Cannery Wage Retail Price Productivity Cannery Wage
U.S. Retail Price Labor Productivity
1995 3.05 2 23608 1.00 1.00 1.00
1996 3.10 1.98 23865 1.02 0.99 1.01
1997 3.10 2.03 25717 1.02 1.02 1.09
1998 3.17 2.10 27691 1.04 1.05 1.17
1999 3.17 2.09 32554 1.04 1.05 1.38
2000 3.20 1.98 31823 1.05 0.99 1.35
2001 3.26 1.88 30815 1.07 0.94 1.31
2002 3.26 1.97 34479 1.07 0.99 1.46
2003 3.26 1.96 39612 1.07 0.98 1.68
2004 3.26 1.82
Sources Figure 18 data Figure 20 data Figure 21 data

109
Appendix D.
Detailed Minimum Wage
Impact Tables
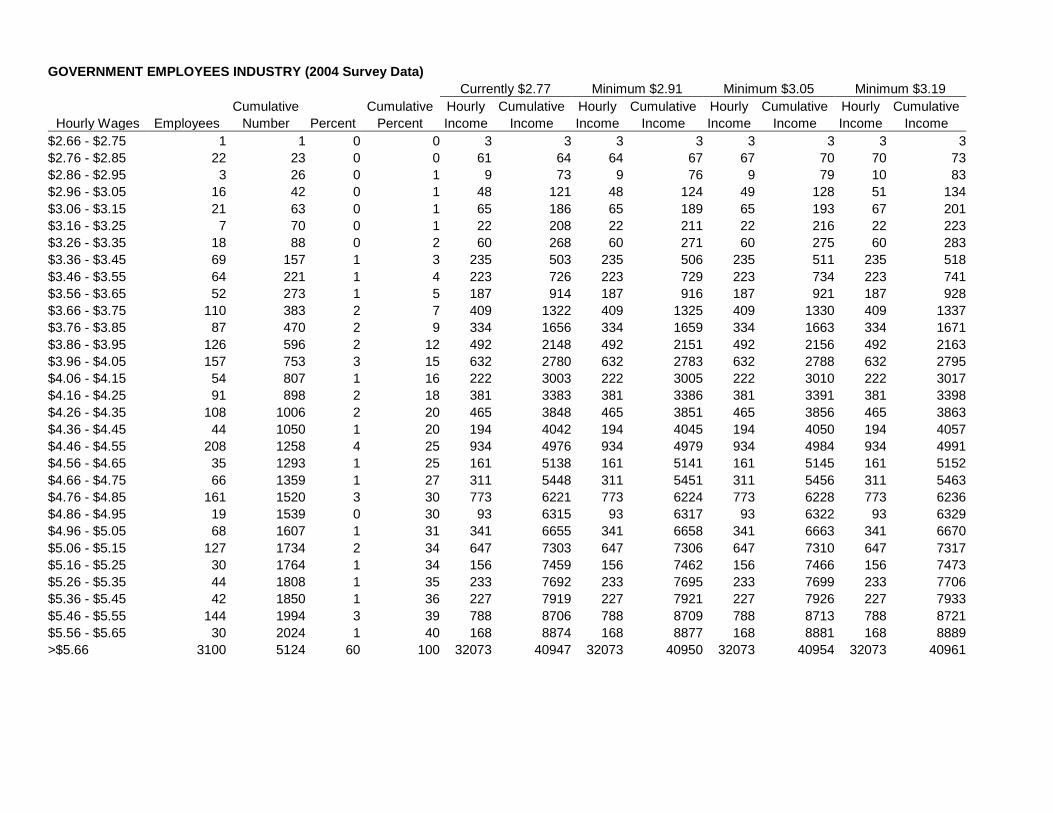
- 110 -
GOVERNMENT EMPLOYEES INDUSTRY (2004 Survey Data)
Currently $2.77 Minimum $2.91 Minimum $3.05 Minimum $3.19
Cumulative Cumulative Hourly Cumulative Hourly Cumulative Hourly Cumulative Hourly Cumulative
Hourly Wages Employees Number Percent Percent Income Income Income Income Income Income Income Income
$2.66 - $2.75 1 1 0 0 3 3 3 3 3 3 3 3
$2.76 - $2.85 22 23 0 0 61 64 64 67 67 70 70 73
$2.86 - $2.95 3 26 0 1 9 73 9 76 9 79 10 83
$2.96 - $3.05 16 42 0 1 48 121 48 124 49 128 51 134
$3.06 - $3.15 21 63 0 1 65 186 65 189 65 193 67 201
$3.16 - $3.25 7 70 0 1 22 208 22 211 22 216 22 223
$3.26 - $3.35 18 88 0 2 60 268 60 271 60 275 60 283
$3.36 - $3.45 69 157 1 3 235 503 235 506 235 511 235 518
$3.46 - $3.55 64 221 1 4 223 726 223 729 223 734 223 741
$3.56 - $3.65 52 273 1 5 187 914 187 916 187 921 187 928
$3.66 - $3.75 110 383 2 7 409 1322 409 1325 409 1330 409 1337
$3.76 - $3.85 87 470 2 9 334 1656 334 1659 334 1663 334 1671
$3.86 - $3.95 126 596 2 12 492 2148 492 2151 492 2156 492 2163
$3.96 - $4.05 157 753 3 15 632 2780 632 2783 632 2788 632 2795
$4.06 - $4.15 54 807 1 16 222 3003 222 3005 222 3010 222 3017
$4.16 - $4.25 91 898 2 18 381 3383 381 3386 381 3391 381 3398
$4.26 - $4.35 108 1006 2 20 465 3848 465 3851 465 3856 465 3863
$4.36 - $4.45 44 1050 1 20 194 4042 194 4045 194 4050 194 4057
$4.46 - $4.55 208 1258 4 25 934 4976 934 4979 934 4984 934 4991
$4.56 - $4.65 35 1293 1 25 161 5138 161 5141 161 5145 161 5152
$4.66 - $4.75 66 1359 1 27 311 5448 311 5451 311 5456 311 5463
$4.76 - $4.85 161 1520 3 30 773 6221 773 6224 773 6228 773 6236
$4.86 - $4.95 19 1539 0 30 93 6315 93 6317 93 6322 93 6329
$4.96 - $5.05 68 1607 1 31 341 6655 341 6658 341 6663 341 6670
$5.06 - $5.15 127 1734 2 34 647 7303 647 7306 647 7310 647 7317
$5.16 - $5.25 30 1764 1 34 156 7459 156 7462 156 7466 156 7473
$5.26 - $5.35 44 1808 1 35 233 7692 233 7695 233 7699 233 7706
$5.36 - $5.45 42 1850 1 36 227 7919 227 7921 227 7926 227 7933
$5.46 - $5.55 144 1994 3 39 788 8706 788 8709 788 8713 788 8721
$5.56 - $5.65 30 2024 1 40 168 8874 168 8877 168 8881 168 8889
>$5.66 3100 5124 60 100 32073 40947 32073 40950 32073 40954 32073 40961
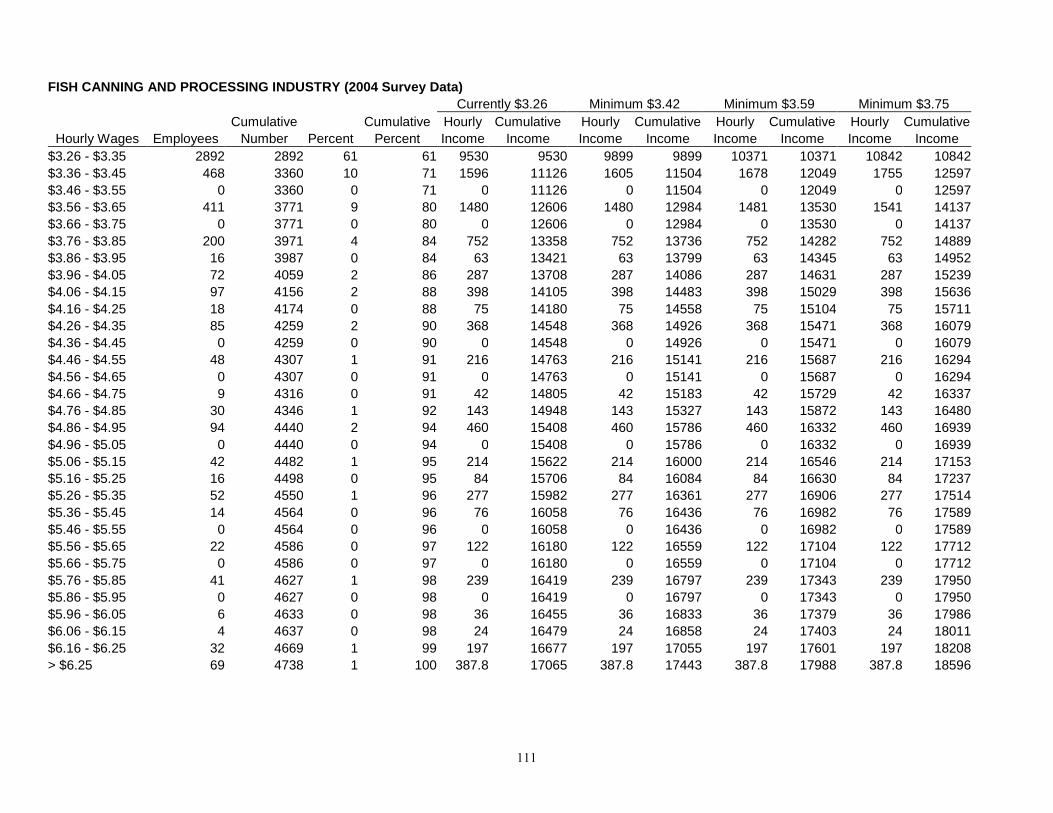
111
FISH CANNING AND PROCESSING INDUSTRY (2004 Survey Data)
Currently $3.26 Minimum $3.42 Minimum $3.59 Minimum $3.75
Cumulative Cumulative Hourly Cumulative Hourly Cumulative Hourly Cumulative Hourly Cumulative
Hourly Wages Employees Number Percent Percent Income Income Income Income Income Income Income Income
$3.26 - $3.35 2892 2892 61 61 9530 9530 9899 9899 10371 10371 10842 10842
$3.36 - $3.45 468 3360 10 71 1596 11126 1605 11504 1678 12049 1755 12597
$3.46 - $3.55 0 3360 0 71 0 11126 0 11504 0 12049 0 12597
$3.56 - $3.65 411 3771 9 80 1480 12606 1480 12984 1481 13530 1541 14137
$3.66 - $3.75 0 3771 0 80 0 12606 0 12984 0 13530 0 14137
$3.76 - $3.85 200 3971 4 84 752 13358 752 13736 752 14282 752 14889
$3.86 - $3.95 16 3987 0 84 63 13421 63 13799 63 14345 63 14952
$3.96 - $4.05 72 4059 2 86 287 13708 287 14086 287 14631 287 15239
$4.06 - $4.15 97 4156 2 88 398 14105 398 14483 398 15029 398 15636
$4.16 - $4.25 18 4174 0 88 75 14180 75 14558 75 15104 75 15711
$4.26 - $4.35 85 4259 2 90 368 14548 368 14926 368 15471 368 16079
$4.36 - $4.45 0 4259 0 90 0 14548 0 14926 0 15471 0 16079
$4.46 - $4.55 48 4307 1 91 216 14763 216 15141 216 15687 216 16294
$4.56 - $4.65 0 4307 0 91 0 14763 0 15141 0 15687 0 16294
$4.66 - $4.75 9 4316 0 91 42 14805 42 15183 42 15729 42 16337
$4.76 - $4.85 30 4346 1 92 143 14948 143 15327 143 15872 143 16480
$4.86 - $4.95 94 4440 2 94 460 15408 460 15786 460 16332 460 16939
$4.96 - $5.05 0 4440 0 94 0 15408 0 15786 0 16332 0 16939
$5.06 - $5.15 42 4482 1 95 214 15622 214 16000 214 16546 214 17153
$5.16 - $5.25 16 4498 0 95 84 15706 84 16084 84 16630 84 17237
$5.26 - $5.35 52 4550 1 96 277 15982 277 16361 277 16906 277 17514
$5.36 - $5.45 14 4564 0 96 76 16058 76 16436 76 16982 76 17589
$5.46 - $5.55 0 4564 0 96 0 16058 0 16436 0 16982 0 17589
$5.56 - $5.65 22 4586 0 97 122 16180 122 16559 122 17104 122 17712
$5.66 - $5.75 0 4586 0 97 0 16180 0 16559 0 17104 0 17712
$5.76 - $5.85 41 4627 1 98 239 16419 239 16797 239 17343 239 17950
$5.86 - $5.95 0 4627 0 98 0 16419 0 16797 0 17343 0 17950
$5.96 - $6.05 6 4633 0 98 36 16455 36 16833 36 17379 36 17986
$6.06 - $6.15 4 4637 0 98 24 16479 24 16858 24 17403 24 18011
$6.16 - $6.25 32 4669 1 99 197 16677 197 17055 197 17601 197 18208
> $6.25 69 4738 1 100 387.8 17065 387.8 17443 387.8 17988 387.8 18596
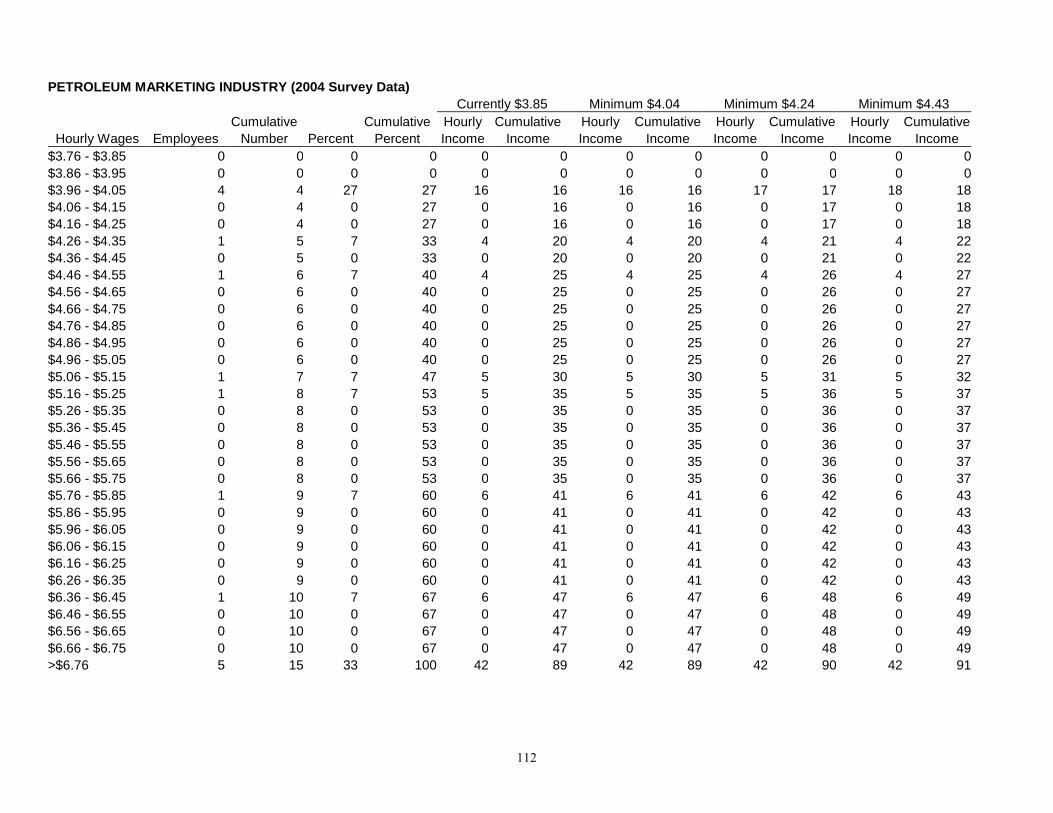
112
PETROLEUM MARKETING INDUSTRY (2004 Survey Data)
Currently $3.85 Minimum $4.04 Minimum $4.24 Minimum $4.43
Cumulative Cumulative Hourly Cumulative Hourly Cumulative Hourly Cumulative Hourly Cumulative
Hourly Wages Employees Number Percent Percent Income Income Income Income Income Income Income Income
$3.76 - $3.85 0 0 0 0 0 0 0 0 0 0 0 0
$3.86 - $3.95 0 0 0 0 0 0 0 0 0 0 0 0
$3.96 - $4.05 4 4 27 27 16 16 16 16 17 17 18 18
$4.06 - $4.15 0 4 0 27 0 16 0 16 0 17 0 18
$4.16 - $4.25 0 4 0 27 0 16 0 16 0 17 0 18
$4.26 - $4.35 1 5 7 33 4 20 4 20 4 21 4 22
$4.36 - $4.45 0 5 0 33 0 20 0 20 0 21 0 22
$4.46 - $4.55 1 6 7 40 4 25 4 25 4 26 4 27
$4.56 - $4.65 0 6 0 40 0 25 0 25 0 26 0 27
$4.66 - $4.75 0 6 0 40 0 25 0 25 0 26 0 27
$4.76 - $4.85 0 6 0 40 0 25 0 25 0 26 0 27
$4.86 - $4.95 0 6 0 40 0 25 0 25 0 26 0 27
$4.96 - $5.05 0 6 0 40 0 25 0 25 0 26 0 27
$5.06 - $5.15 1 7 7 47 5 30 5 30 5 31 5 32
$5.16 - $5.25 1 8 7 53 5 35 5 35 5 36 5 37
$5.26 - $5.35 0 8 0 53 0 35 0 35 0 36 0 37
$5.36 - $5.45 0 8 0 53 0 35 0 35 0 36 0 37
$5.46 - $5.55 0 8 0 53 0 35 0 35 0 36 0 37
$5.56 - $5.65 0 8 0 53 0 35 0 35 0 36 0 37
$5.66 - $5.75 0 8 0 53 0 35 0 35 0 36 0 37
$5.76 - $5.85 1 9 7 60 6 41 6 41 6 42 6 43
$5.86 - $5.95 0 9 0 60 0 41 0 41 0 42 0 43
$5.96 - $6.05 0 9 0 60 0 41 0 41 0 42 0 43
$6.06 - $6.15 0 9 0 60 0 41 0 41 0 42 0 43
$6.16 - $6.25 0 9 0 60 0 41 0 41 0 42 0 43
$6.26 - $6.35 0 9 0 60 0 41 0 41 0 42 0 43
$6.36 - $6.45 1 10 7 67 6 47 6 47 6 48 6 49
$6.46 - $6.55 0 10 0 67 0 47 0 47 0 48 0 49
$6.56 - $6.65 0 10 0 67 0 47 0 47 0 48 0 49
$6.66 - $6.75 0 10 0 67 0 47 0 47 0 48 0 49
>$6.76 5 15 33 100 42 89 42 89 42 90 42 91
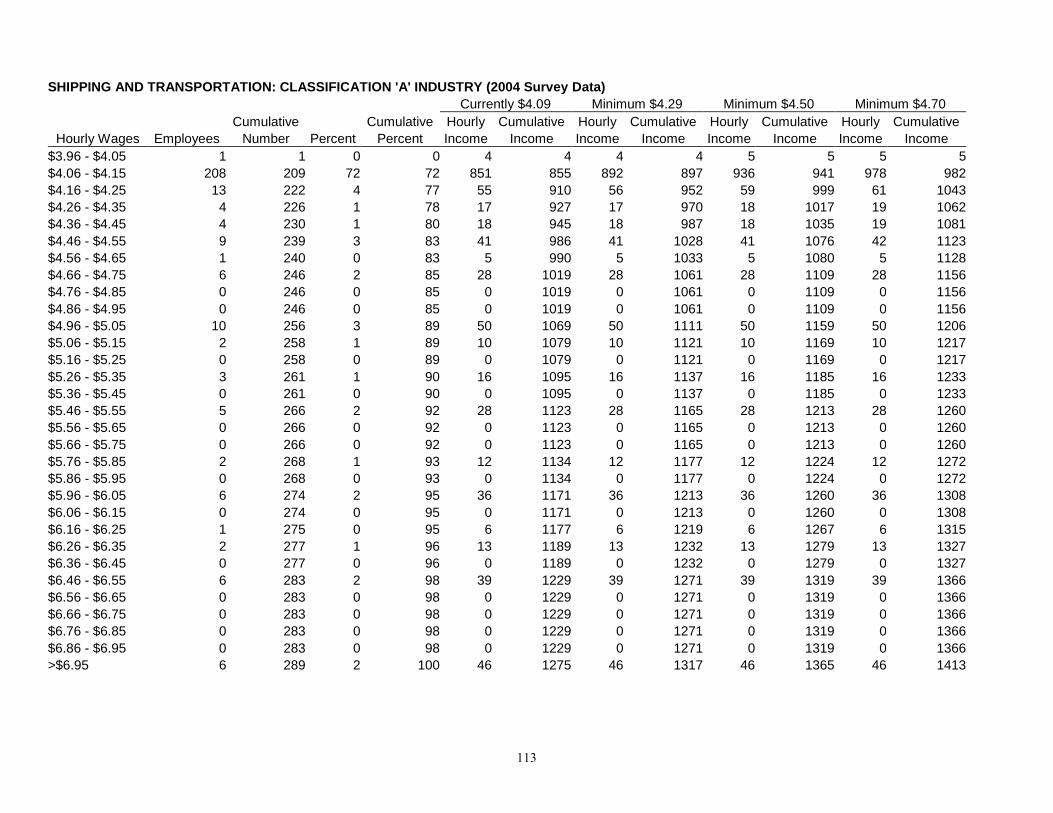
113
SHIPPING AND TRANSPORTATION: CLASSIFICATION 'A' INDUSTRY (2004 Survey Data)
Currently $4.09 Minimum $4.29 Minimum $4.50 Minimum $4.70
Cumulative Cumulative Hourly Cumulative Hourly Cumulative Hourly Cumulative Hourly Cumulative
Hourly Wages Employees Number Percent Percent Income Income Income Income Income Income Income Income
$3.96 - $4.05 1 1 0 0 4 4 4 4 5 5 5 5
$4.06 - $4.15 208 209 72 72 851 855 892 897 936 941 978 982
$4.16 - $4.25 13 222 4 77 55 910 56 952 59 999 61 1043
$4.26 - $4.35 4 226 1 78 17 927 17 970 18 1017 19 1062
$4.36 - $4.45 4 230 1 80 18 945 18 987 18 1035 19 1081
$4.46 - $4.55 9 239 3 83 41 986 41 1028 41 1076 42 1123
$4.56 - $4.65 1 240 0 83 5 990 5 1033 5 1080 5 1128
$4.66 - $4.75 6 246 2 85 28 1019 28 1061 28 1109 28 1156
$4.76 - $4.85 0 246 0 85 0 1019 0 1061 0 1109 0 1156
$4.86 - $4.95 0 246 0 85 0 1019 0 1061 0 1109 0 1156
$4.96 - $5.05 10 256 3 89 50 1069 50 1111 50 1159 50 1206
$5.06 - $5.15 2 258 1 89 10 1079 10 1121 10 1169 10 1217
$5.16 - $5.25 0 258 0 89 0 1079 0 1121 0 1169 0 1217
$5.26 - $5.35 3 261 1 90 16 1095 16 1137 16 1185 16 1233
$5.36 - $5.45 0 261 0 90 0 1095 0 1137 0 1185 0 1233
$5.46 - $5.55 5 266 2 92 28 1123 28 1165 28 1213 28 1260
$5.56 - $5.65 0 266 0 92 0 1123 0 1165 0 1213 0 1260
$5.66 - $5.75 0 266 0 92 0 1123 0 1165 0 1213 0 1260
$5.76 - $5.85 2 268 1 93 12 1134 12 1177 12 1224 12 1272
$5.86 - $5.95 0 268 0 93 0 1134 0 1177 0 1224 0 1272
$5.96 - $6.05 6 274 2 95 36 1171 36 1213 36 1260 36 1308
$6.06 - $6.15 0 274 0 95 0 1171 0 1213 0 1260 0 1308
$6.16 - $6.25 1 275 0 95 6 1177 6 1219 6 1267 6 1315
$6.26 - $6.35 2 277 1 96 13 1189 13 1232 13 1279 13 1327
$6.36 - $6.45 0 277 0 96 0 1189 0 1232 0 1279 0 1327
$6.46 - $6.55 6 283 2 98 39 1229 39 1271 39 1319 39 1366
$6.56 - $6.65 0 283 0 98 0 1229 0 1271 0 1319 0 1366
$6.66 - $6.75 0 283 0 98 0 1229 0 1271 0 1319 0 1366
$6.76 - $6.85 0 283 0 98 0 1229 0 1271 0 1319 0 1366
$6.86 - $6.95 0 283 0 98 0 1229 0 1271 0 1319 0 1366
>$6.95 6 289 2 100 46 1275 46 1317 46 1365 46 1413
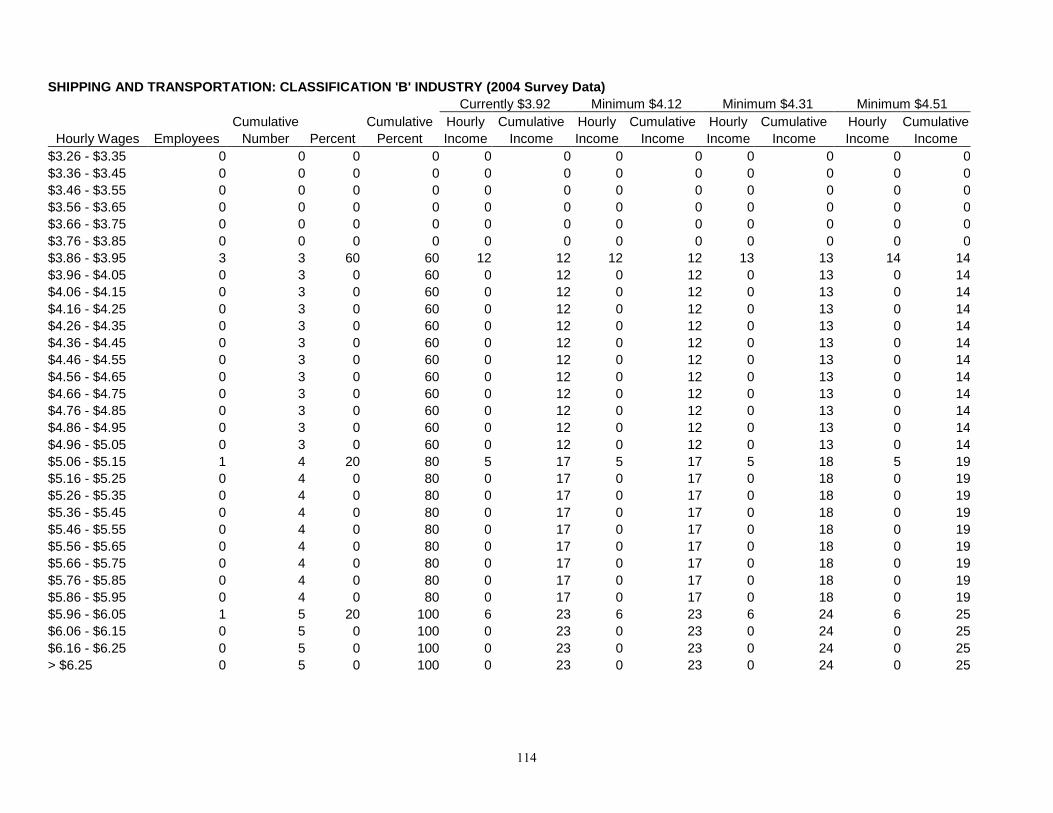
114
SHIPPING AND TRANSPORTATION: CLASSIFICATION 'B' INDUSTRY (2004 Survey Data)
Currently $3.92 Minimum $4.12 Minimum $4.31 Minimum $4.51
Cumulative Cumulative Hourly Cumulative Hourly Cumulative Hourly Cumulative Hourly Cumulative
Hourly Wages Employees Number Percent Percent Income Income Income Income Income Income Income Income
$3.26 - $3.35 0 0 0 0 0 0 0 0 0 0 0 0
$3.36 - $3.45 0 0 0 0 0 0 0 0 0 0 0 0
$3.46 - $3.55 0 0 0 0 0 0 0 0 0 0 0 0
$3.56 - $3.65 0 0 0 0 0 0 0 0 0 0 0 0
$3.66 - $3.75 0 0 0 0 0 0 0 0 0 0 0 0
$3.76 - $3.85 0 0 0 0 0 0 0 0 0 0 0 0
$3.86 - $3.95 3 3 60 60 12 12 12 12 13 13 14 14
$3.96 - $4.05 0 3 0 60 0 12 0 12 0 13 0 14
$4.06 - $4.15 0 3 0 60 0 12 0 12 0 13 0 14
$4.16 - $4.25 0 3 0 60 0 12 0 12 0 13 0 14
$4.26 - $4.35 0 3 0 60 0 12 0 12 0 13 0 14
$4.36 - $4.45 0 3 0 60 0 12 0 12 0 13 0 14
$4.46 - $4.55 0 3 0 60 0 12 0 12 0 13 0 14
$4.56 - $4.65 0 3 0 60 0 12 0 12 0 13 0 14
$4.66 - $4.75 0 3 0 60 0 12 0 12 0 13 0 14
$4.76 - $4.85 0 3 0 60 0 12 0 12 0 13 0 14
$4.86 - $4.95 0 3 0 60 0 12 0 12 0 13 0 14
$4.96 - $5.05 0 3 0 60 0 12 0 12 0 13 0 14
$5.06 - $5.15 1 4 20 80 5 17 5 17 5 18 5 19
$5.16 - $5.25 0 4 0 80 0 17 0 17 0 18 0 19
$5.26 - $5.35 0 4 0 80 0 17 0 17 0 18 0 19
$5.36 - $5.45 0 4 0 80 0 17 0 17 0 18 0 19
$5.46 - $5.55 0 4 0 80 0 17 0 17 0 18 0 19
$5.56 - $5.65 0 4 0 80 0 17 0 17 0 18 0 19
$5.66 - $5.75 0 4 0 80 0 17 0 17 0 18 0 19
$5.76 - $5.85 0 4 0 80 0 17 0 17 0 18 0 19
$5.86 - $5.95 0 4 0 80 0 17 0 17 0 18 0 19
$5.96 - $6.05 1 5 20 100 6 23 6 23 6 24 6 25
$6.06 - $6.15 0 5 0 100 0 23 0 23 0 24 0 25
$6.16 - $6.25 0 5 0 100 0 23 0 23 0 24 0 25
> $6.25 0 5 0 100 0 23 0 23 0 24 0 25
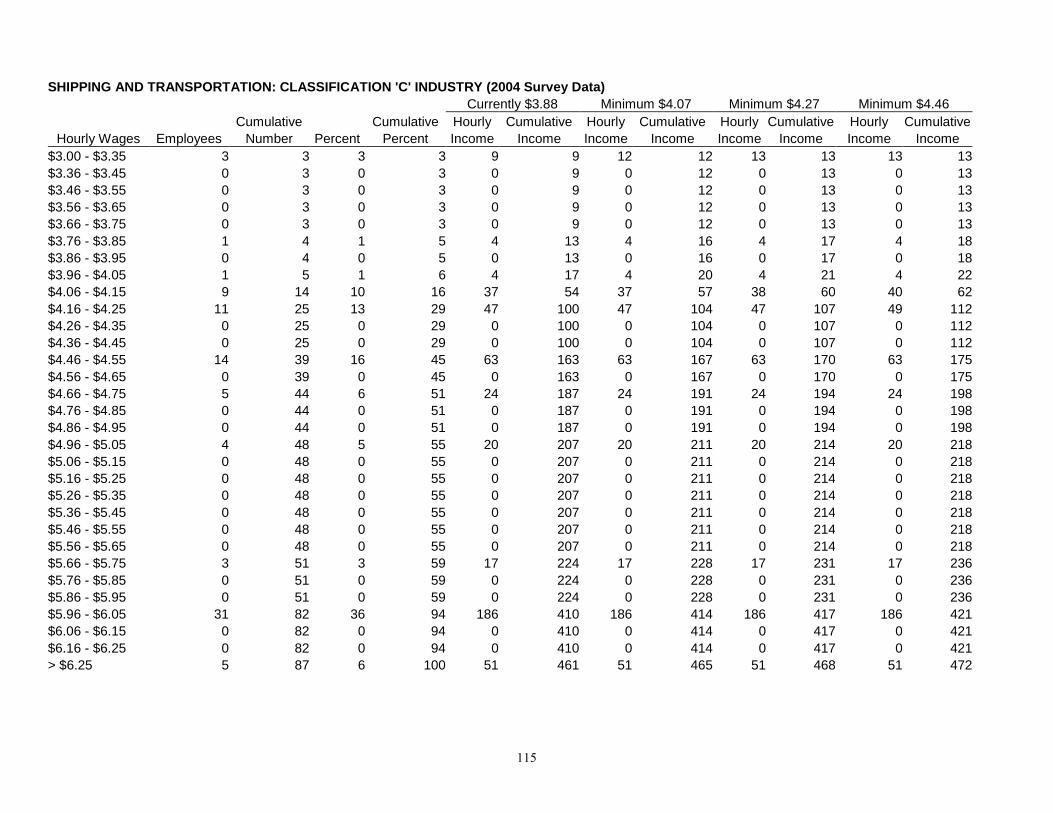
115
SHIPPING AND TRANSPORTATION: CLASSIFICATION 'C' INDUSTRY (2004 Survey Data)
Currently $3.88 Minimum $4.07 Minimum $4.27 Minimum $4.46
Cumulative Cumulative Hourly Cumulative Hourly Cumulative Hourly Cumulative Hourly Cumulative
Hourly Wages Employees Number Percent Percent Income Income Income Income Income Income Income Income
$3.00 - $3.35 3 3 3 3 9 9 12 12 13 13 13 13
$3.36 - $3.45 0 3 0 3 0 9 0 12 0 13 0 13
$3.46 - $3.55 0 3 0 3 0 9 0 12 0 13 0 13
$3.56 - $3.65 0 3 0 3 0 9 0 12 0 13 0 13
$3.66 - $3.75 0 3 0 3 0 9 0 12 0 13 0 13
$3.76 - $3.85 1 4 1 5 4 13 4 16 4 17 4 18
$3.86 - $3.95 0 4 0 5 0 13 0 16 0 17 0 18
$3.96 - $4.05 1 5 1 6 4 17 4 20 4 21 4 22
$4.06 - $4.15 9 14 10 16 37 54 37 57 38 60 40 62
$4.16 - $4.25 11 25 13 29 47 100 47 104 47 107 49 112
$4.26 - $4.35 0 25 0 29 0 100 0 104 0 107 0 112
$4.36 - $4.45 0 25 0 29 0 100 0 104 0 107 0 112
$4.46 - $4.55 14 39 16 45 63 163 63 167 63 170 63 175
$4.56 - $4.65 0 39 0 45 0 163 0 167 0 170 0 175
$4.66 - $4.75 5 44 6 51 24 187 24 191 24 194 24 198
$4.76 - $4.85 0 44 0 51 0 187 0 191 0 194 0 198
$4.86 - $4.95 0 44 0 51 0 187 0 191 0 194 0 198
$4.96 - $5.05 4 48 5 55 20 207 20 211 20 214 20 218
$5.06 - $5.15 0 48 0 55 0 207 0 211 0 214 0 218
$5.16 - $5.25 0 48 0 55 0 207 0 211 0 214 0 218
$5.26 - $5.35 0 48 0 55 0 207 0 211 0 214 0 218
$5.36 - $5.45 0 48 0 55 0 207 0 211 0 214 0 218
$5.46 - $5.55 0 48 0 55 0 207 0 211 0 214 0 218
$5.56 - $5.65 0 48 0 55 0 207 0 211 0 214 0 218
$5.66 - $5.75 3 51 3 59 17 224 17 228 17 231 17 236
$5.76 - $5.85 0 51 0 59 0 224 0 228 0 231 0 236
$5.86 - $5.95 0 51 0 59 0 224 0 228 0 231 0 236
$5.96 - $6.05 31 82 36 94 186 410 186 414 186 417 186 421
$6.06 - $6.15 0 82 0 94 0 410 0 414 0 417 0 421
$6.16 - $6.25 0 82 0 94 0 410 0 414 0 417 0 421
> $6.25 5 87 6 100 51 461 51 465 51 468 51 472
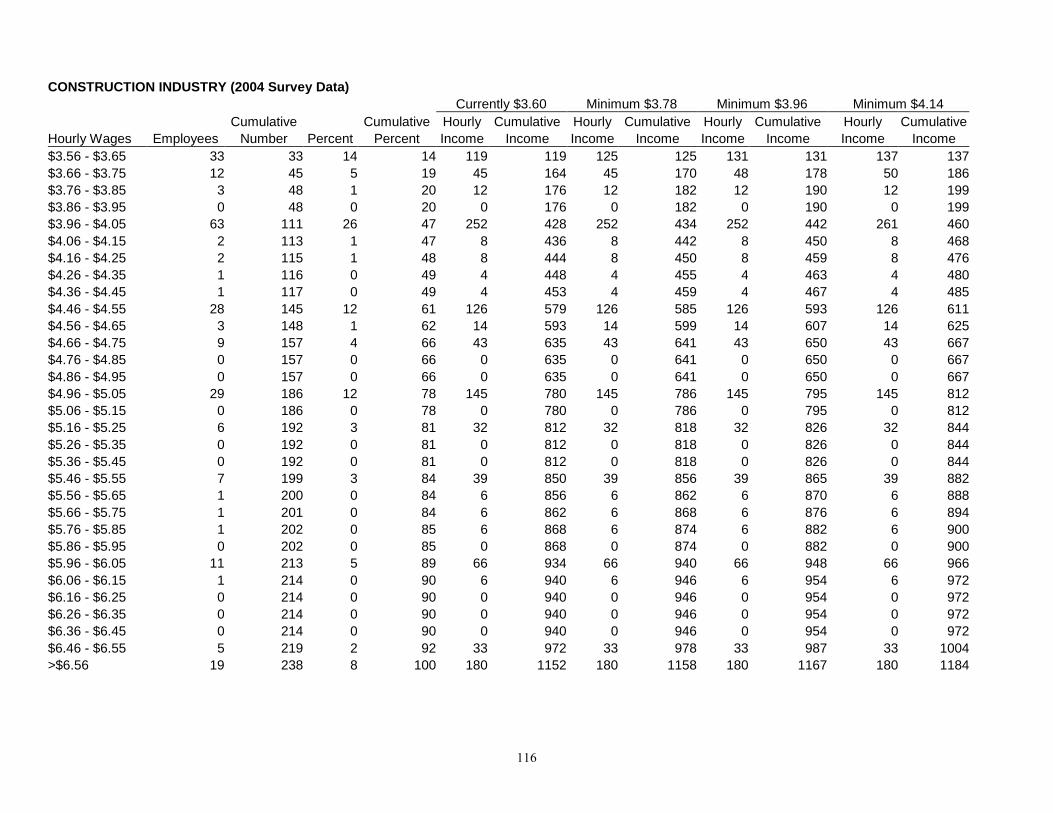
116
CONSTRUCTION INDUSTRY (2004 Survey Data)
Currently $3.60 Minimum $3.78 Minimum $3.96 Minimum $4.14
Cumulative Cumulative Hourly Cumulative Hourly Cumulative Hourly Cumulative Hourly Cumulative
Hourly Wages Employees Number Percent Percent Income Income Income Income Income Income Income Income
$3.56 - $3.65 33 33 14 14 119 119 125 125 131 131 137 137
$3.66 - $3.75 12 45 5 19 45 164 45 170 48 178 50 186
$3.76 - $3.85 3 48 1 20 12 176 12 182 12 190 12 199
$3.86 - $3.95 0 48 0 20 0 176 0 182 0 190 0 199
$3.96 - $4.05 63 111 26 47 252 428 252 434 252 442 261 460
$4.06 - $4.15 2 113 1 47 8 436 8 442 8 450 8 468
$4.16 - $4.25 2 115 1 48 8 444 8 450 8 459 8 476
$4.26 - $4.35 1 116 0 49 4 448 4 455 4 463 4 480
$4.36 - $4.45 1 117 0 49 4 453 4 459 4 467 4 485
$4.46 - $4.55 28 145 12 61 126 579 126 585 126 593 126 611
$4.56 - $4.65 3 148 1 62 14 593 14 599 14 607 14 625
$4.66 - $4.75 9 157 4 66 43 635 43 641 43 650 43 667
$4.76 - $4.85 0 157 0 66 0 635 0 641 0 650 0 667
$4.86 - $4.95 0 157 0 66 0 635 0 641 0 650 0 667
$4.96 - $5.05 29 186 12 78 145 780 145 786 145 795 145 812
$5.06 - $5.15 0 186 0 78 0 780 0 786 0 795 0 812
$5.16 - $5.25 6 192 3 81 32 812 32 818 32 826 32 844
$5.26 - $5.35 0 192 0 81 0 812 0 818 0 826 0 844
$5.36 - $5.45 0 192 0 81 0 812 0 818 0 826 0 844
$5.46 - $5.55 7 199 3 84 39 850 39 856 39 865 39 882
$5.56 - $5.65 1 200 0 84 6 856 6 862 6 870 6 888
$5.66 - $5.75 1 201 0 84 6 862 6 868 6 876 6 894
$5.76 - $5.85 1 202 0 85 6 868 6 874 6 882 6 900
$5.86 - $5.95 0 202 0 85 0 868 0 874 0 882 0 900
$5.96 - $6.05 11 213 5 89 66 934 66 940 66 948 66 966
$6.06 - $6.15 1 214 0 90 6 940 6 946 6 954 6 972
$6.16 - $6.25 0 214 0 90 0 940 0 946 0 954 0 972
$6.26 - $6.35 0 214 0 90 0 940 0 946 0 954 0 972
$6.36 - $6.45 0 214 0 90 0 940 0 946 0 954 0 972
$6.46 - $6.55 5 219 2 92 33 972 33 978 33 987 33 1004
>$6.56 19 238 8 100 180 1152 180 1158 180 1167 180 1184
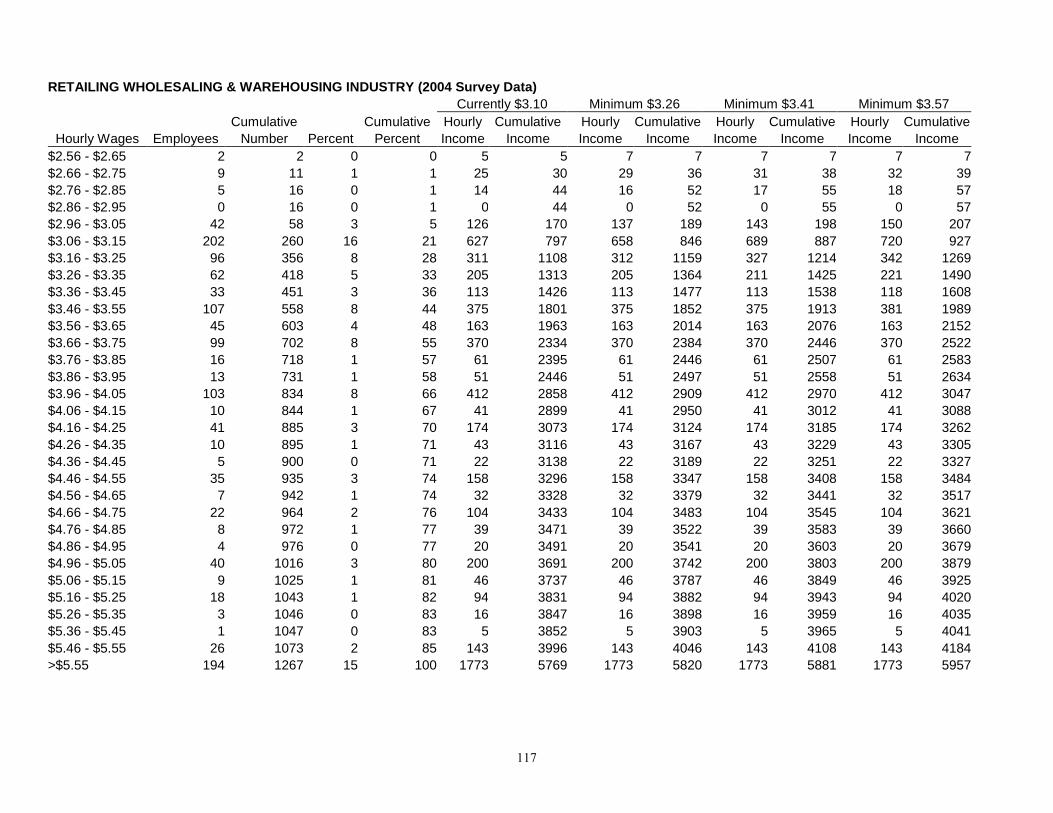
117
RETAILING WHOLESALING & WAREHOUSING INDUSTRY (2004 Survey Data)
Currently $3.10 Minimum $3.26 Minimum $3.41 Minimum $3.57
Cumulative Cumulative Hourly Cumulative Hourly Cumulative Hourly Cumulative Hourly Cumulative
Hourly Wages Employees Number Percent Percent Income Income Income Income Income Income Income Income
$2.56 - $2.65 2 2 0 0 5 5 7 7 7 7 7 7
$2.66 - $2.75 9 11 1 1 25 30 29 36 31 38 32 39
$2.76 - $2.85 5 16 0 1 14 44 16 52 17 55 18 57
$2.86 - $2.95 0 16 0 1 0 44 0 52 0 55 0 57
$2.96 - $3.05 42 58 3 5 126 170 137 189 143 198 150 207
$3.06 - $3.15 202 260 16 21 627 797 658 846 689 887 720 927
$3.16 - $3.25 96 356 8 28 311 1108 312 1159 327 1214 342 1269
$3.26 - $3.35 62 418 5 33 205 1313 205 1364 211 1425 221 1490
$3.36 - $3.45 33 451 3 36 113 1426 113 1477 113 1538 118 1608
$3.46 - $3.55 107 558 8 44 375 1801 375 1852 375 1913 381 1989
$3.56 - $3.65 45 603 4 48 163 1963 163 2014 163 2076 163 2152
$3.66 - $3.75 99 702 8 55 370 2334 370 2384 370 2446 370 2522
$3.76 - $3.85 16 718 1 57 61 2395 61 2446 61 2507 61 2583
$3.86 - $3.95 13 731 1 58 51 2446 51 2497 51 2558 51 2634
$3.96 - $4.05 103 834 8 66 412 2858 412 2909 412 2970 412 3047
$4.06 - $4.15 10 844 1 67 41 2899 41 2950 41 3012 41 3088
$4.16 - $4.25 41 885 3 70 174 3073 174 3124 174 3185 174 3262
$4.26 - $4.35 10 895 1 71 43 3116 43 3167 43 3229 43 3305
$4.36 - $4.45 5 900 0 71 22 3138 22 3189 22 3251 22 3327
$4.46 - $4.55 35 935 3 74 158 3296 158 3347 158 3408 158 3484
$4.56 - $4.65 7 942 1 74 32 3328 32 3379 32 3441 32 3517
$4.66 - $4.75 22 964 2 76 104 3433 104 3483 104 3545 104 3621
$4.76 - $4.85 8 972 1 77 39 3471 39 3522 39 3583 39 3660
$4.86 - $4.95 4 976 0 77 20 3491 20 3541 20 3603 20 3679
$4.96 - $5.05 40 1016 3 80 200 3691 200 3742 200 3803 200 3879
$5.06 - $5.15 9 1025 1 81 46 3737 46 3787 46 3849 46 3925
$5.16 - $5.25 18 1043 1 82 94 3831 94 3882 94 3943 94 4020
$5.26 - $5.35 3 1046 0 83 16 3847 16 3898 16 3959 16 4035
$5.36 - $5.45 1 1047 0 83 5 3852 5 3903 5 3965 5 4041
$5.46 - $5.55 26 1073 2 85 143 3996 143 4046 143 4108 143 4184
>$5.55 194 1267 15 100 1773 5769 1773 5820 1773 5881 1773 5957
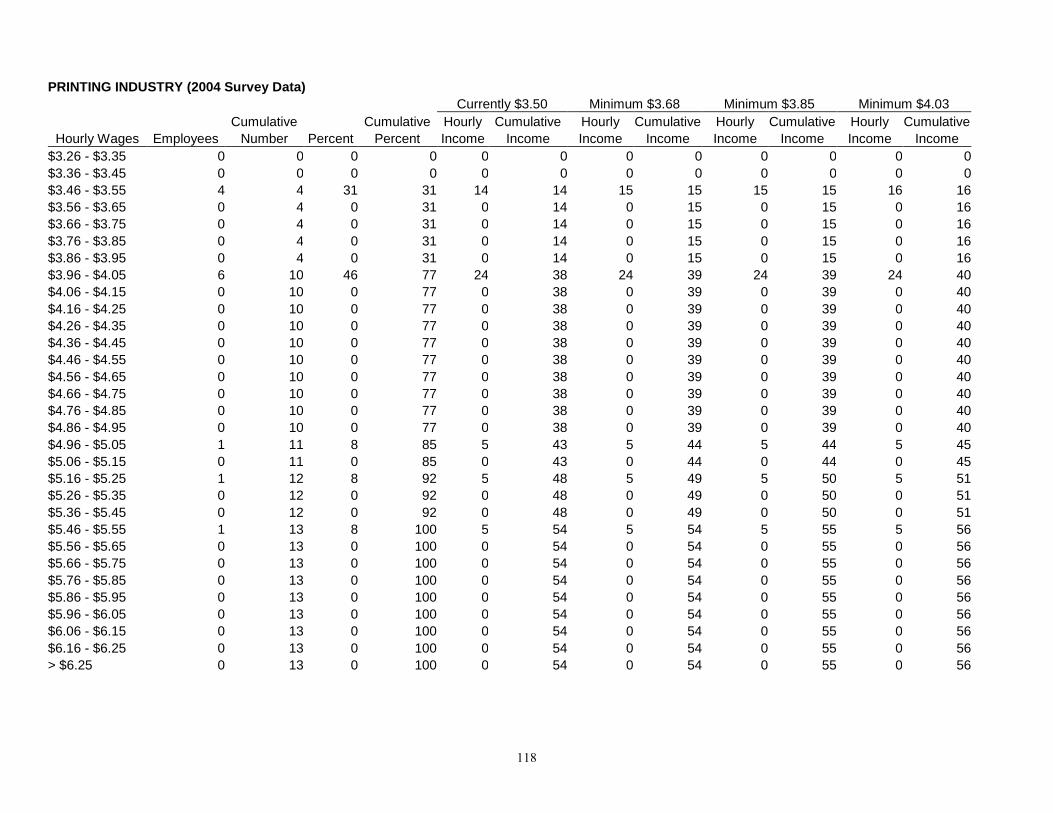
118
PRINTING INDUSTRY (2004 Survey Data)
Currently $3.50 Minimum $3.68 Minimum $3.85 Minimum $4.03
Cumulative Cumulative Hourly Cumulative Hourly Cumulative Hourly Cumulative Hourly Cumulative
Hourly Wages Employees Number Percent Percent Income Income Income Income Income Income Income Income
$3.26 - $3.35 0 0 0 0 0 0 0 0 0 0 0 0
$3.36 - $3.45 0 0 0 0 0 0 0 0 0 0 0 0
$3.46 - $3.55 4 4 31 31 14 14 15 15 15 15 16 16
$3.56 - $3.65 0 4 0 31 0 14 0 15 0 15 0 16
$3.66 - $3.75 0 4 0 31 0 14 0 15 0 15 0 16
$3.76 - $3.85 0 4 0 31 0 14 0 15 0 15 0 16
$3.86 - $3.95 0 4 0 31 0 14 0 15 0 15 0 16
$3.96 - $4.05 6 10 46 77 24 38 24 39 24 39 24 40
$4.06 - $4.15 0 10 0 77 0 38 0 39 0 39 0 40
$4.16 - $4.25 0 10 0 77 0 38 0 39 0 39 0 40
$4.26 - $4.35 0 10 0 77 0 38 0 39 0 39 0 40
$4.36 - $4.45 0 10 0 77 0 38 0 39 0 39 0 40
$4.46 - $4.55 0 10 0 77 0 38 0 39 0 39 0 40
$4.56 - $4.65 0 10 0 77 0 38 0 39 0 39 0 40
$4.66 - $4.75 0 10 0 77 0 38 0 39 0 39 0 40
$4.76 - $4.85 0 10 0 77 0 38 0 39 0 39 0 40
$4.86 - $4.95 0 10 0 77 0 38 0 39 0 39 0 40
$4.96 - $5.05 1 11 8 85 5 43 5 44 5 44 5 45
$5.06 - $5.15 0 11 0 85 0 43 0 44 0 44 0 45
$5.16 - $5.25 1 12 8 92 5 48 5 49 5 50 5 51
$5.26 - $5.35 0 12 0 92 0 48 0 49 0 50 0 51
$5.36 - $5.45 0 12 0 92 0 48 0 49 0 50 0 51
$5.46 - $5.55 1 13 8 100 5 54 5 54 5 55 5 56
$5.56 - $5.65 0 13 0 100 0 54 0 54 0 55 0 56
$5.66 - $5.75 0 13 0 100 0 54 0 54 0 55 0 56
$5.76 - $5.85 0 13 0 100 0 54 0 54 0 55 0 56
$5.86 - $5.95 0 13 0 100 0 54 0 54 0 55 0 56
$5.96 - $6.05 0 13 0 100 0 54 0 54 0 55 0 56
$6.06 - $6.15 0 13 0 100 0 54 0 54 0 55 0 56
$6.16 - $6.25 0 13 0 100 0 54 0 54 0 55 0 56
> $6.25 0 13 0 100 0 54 0 54 0 55 0 56
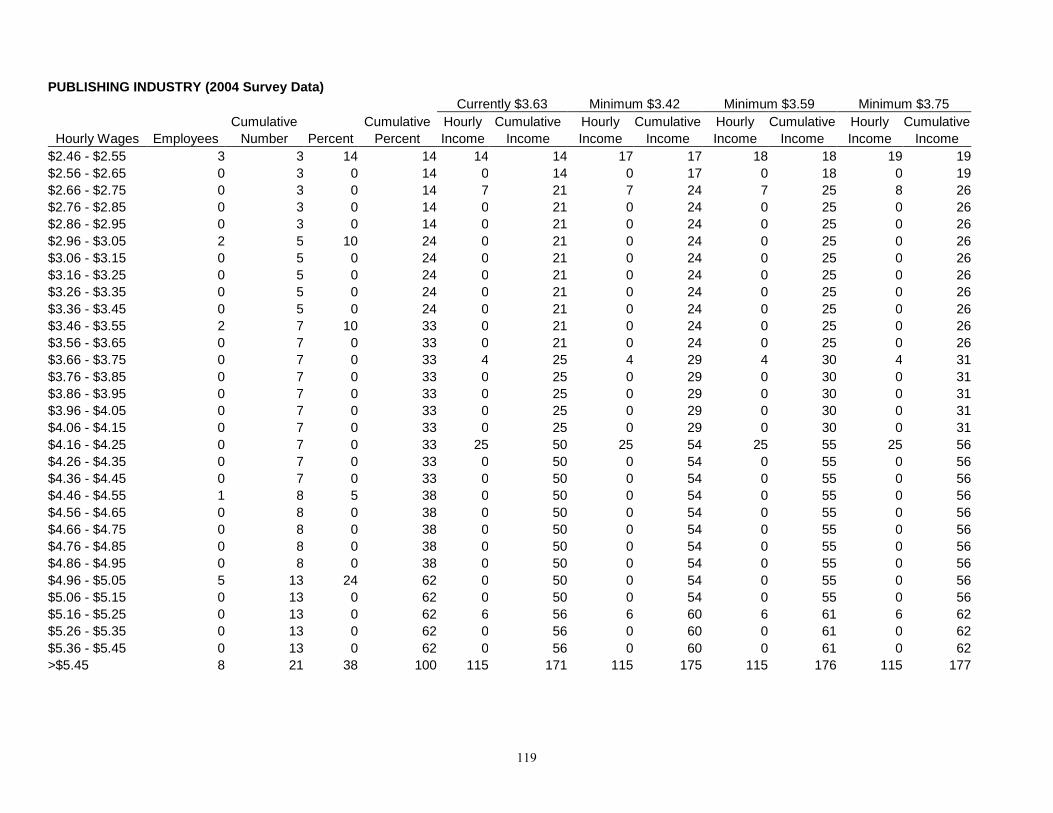
119
PUBLISHING INDUSTRY (2004 Survey Data)
Currently $3.63 Minimum $3.42 Minimum $3.59 Minimum $3.75
Cumulative Cumulative Hourly Cumulative Hourly Cumulative Hourly Cumulative Hourly Cumulative
Hourly Wages Employees Number Percent Percent Income Income Income Income Income Income Income Income
$2.46 - $2.55 3 3 14 14 14 14 17 17 18 18 19 19
$2.56 - $2.65 0 3 0 14 0 14 0 17 0 18 0 19
$2.66 - $2.75 0 3 0 14 7 21 7 24 7 25 8 26
$2.76 - $2.85 0 3 0 14 0 21 0 24 0 25 0 26
$2.86 - $2.95 0 3 0 14 0 21 0 24 0 25 0 26
$2.96 - $3.05 2 5 10 24 0 21 0 24 0 25 0 26
$3.06 - $3.15 0 5 0 24 0 21 0 24 0 25 0 26
$3.16 - $3.25 0 5 0 24 0 21 0 24 0 25 0 26
$3.26 - $3.35 0 5 0 24 0 21 0 24 0 25 0 26
$3.36 - $3.45 0 5 0 24 0 21 0 24 0 25 0 26
$3.46 - $3.55 2 7 10 33 0 21 0 24 0 25 0 26
$3.56 - $3.65 0 7 0 33 0 21 0 24 0 25 0 26
$3.66 - $3.75 0 7 0 33 4 25 4 29 4 30 4 31
$3.76 - $3.85 0 7 0 33 0 25 0 29 0 30 0 31
$3.86 - $3.95 0 7 0 33 0 25 0 29 0 30 0 31
$3.96 - $4.05 0 7 0 33 0 25 0 29 0 30 0 31
$4.06 - $4.15 0 7 0 33 0 25 0 29 0 30 0 31
$4.16 - $4.25 0 7 0 33 25 50 25 54 25 55 25 56
$4.26 - $4.35 0 7 0 33 0 50 0 54 0 55 0 56
$4.36 - $4.45 0 7 0 33 0 50 0 54 0 55 0 56
$4.46 - $4.55 1 8 5 38 0 50 0 54 0 55 0 56
$4.56 - $4.65 0 8 0 38 0 50 0 54 0 55 0 56
$4.66 - $4.75 0 8 0 38 0 50 0 54 0 55 0 56
$4.76 - $4.85 0 8 0 38 0 50 0 54 0 55 0 56
$4.86 - $4.95 0 8 0 38 0 50 0 54 0 55 0 56
$4.96 - $5.05 5 13 24 62 0 50 0 54 0 55 0 56
$5.06 - $5.15 0 13 0 62 0 50 0 54 0 55 0 56
$5.16 - $5.25 0 13 0 62 6 56 6 60 6 61 6 62
$5.26 - $5.35 0 13 0 62 0 56 0 60 0 61 0 62
$5.36 - $5.45 0 13 0 62 0 56 0 60 0 61 0 62
>$5.45 8 21 38 100 115 171 115 175 115 176 115 177
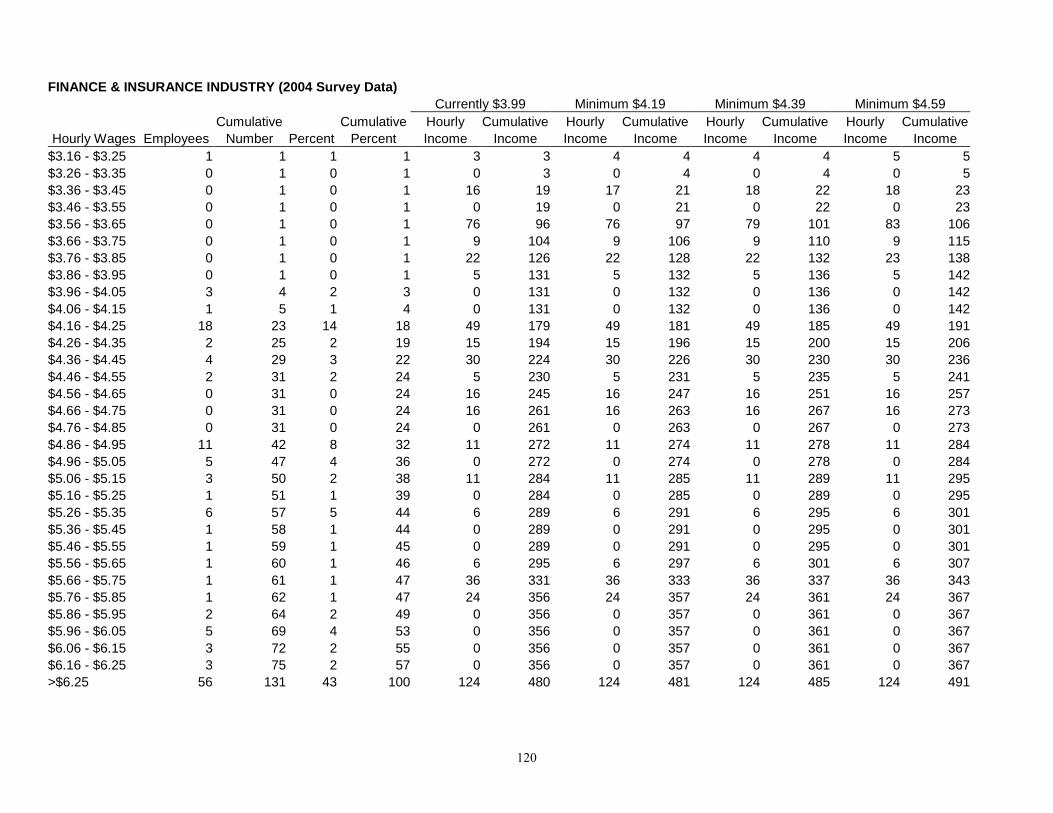
120
FINANCE & INSURANCE INDUSTRY (2004 Survey Data)
Currently $3.99 Minimum $4.19 Minimum $4.39 Minimum $4.59
Cumulative Cumulative Hourly Cumulative Hourly Cumulative Hourly Cumulative Hourly Cumulative
Hourly Wages Employees Number Percent Percent Income Income Income Income Income Income Income Income
$3.16 - $3.25 1 1 1 1 3 3 4 4 4 4 5 5
$3.26 - $3.35 0 1 0 1 0 3 0 4 0 4 0 5
$3.36 - $3.45 0 1 0 1 16 19 17 21 18 22 18 23
$3.46 - $3.55 0 1 0 1 0 19 0 21 0 22 0 23
$3.56 - $3.65 0 1 0 1 76 96 76 97 79 101 83 106
$3.66 - $3.75 0 1 0 1 9 104 9 106 9 110 9 115
$3.76 - $3.85 0 1 0 1 22 126 22 128 22 132 23 138
$3.86 - $3.95 0 1 0 1 5 131 5 132 5 136 5 142
$3.96 - $4.05 3 4 2 3 0 131 0 132 0 136 0 142
$4.06 - $4.15 1 5 1 4 0 131 0 132 0 136 0 142
$4.16 - $4.25 18 23 14 18 49 179 49 181 49 185 49 191
$4.26 - $4.35 2 25 2 19 15 194 15 196 15 200 15 206
$4.36 - $4.45 4 29 3 22 30 224 30 226 30 230 30 236
$4.46 - $4.55 2 31 2 24 5 230 5 231 5 235 5 241
$4.56 - $4.65 0 31 0 24 16 245 16 247 16 251 16 257
$4.66 - $4.75 0 31 0 24 16 261 16 263 16 267 16 273
$4.76 - $4.85 0 31 0 24 0 261 0 263 0 267 0 273
$4.86 - $4.95 11 42 8 32 11 272 11 274 11 278 11 284
$4.96 - $5.05 5 47 4 36 0 272 0 274 0 278 0 284
$5.06 - $5.15 3 50 2 38 11 284 11 285 11 289 11 295
$5.16 - $5.25 1 51 1 39 0 284 0 285 0 289 0 295
$5.26 - $5.35 6 57 5 44 6 289 6 291 6 295 6 301
$5.36 - $5.45 1 58 1 44 0 289 0 291 0 295 0 301
$5.46 - $5.55 1 59 1 45 0 289 0 291 0 295 0 301
$5.56 - $5.65 1 60 1 46 6 295 6 297 6 301 6 307
$5.66 - $5.75 1 61 1 47 36 331 36 333 36 337 36 343
$5.76 - $5.85 1 62 1 47 24 356 24 357 24 361 24 367
$5.86 - $5.95 2 64 2 49 0 356 0 357 0 361 0 367
$5.96 - $6.05 5 69 4 53 0 356 0 357 0 361 0 367
$6.06 - $6.15 3 72 2 55 0 356 0 357 0 361 0 367
$6.16 - $6.25 3 75 2 57 0 356 0 357 0 361 0 367
>$6.25 56 131 43 100 124 480 124 481 124 485 124 491
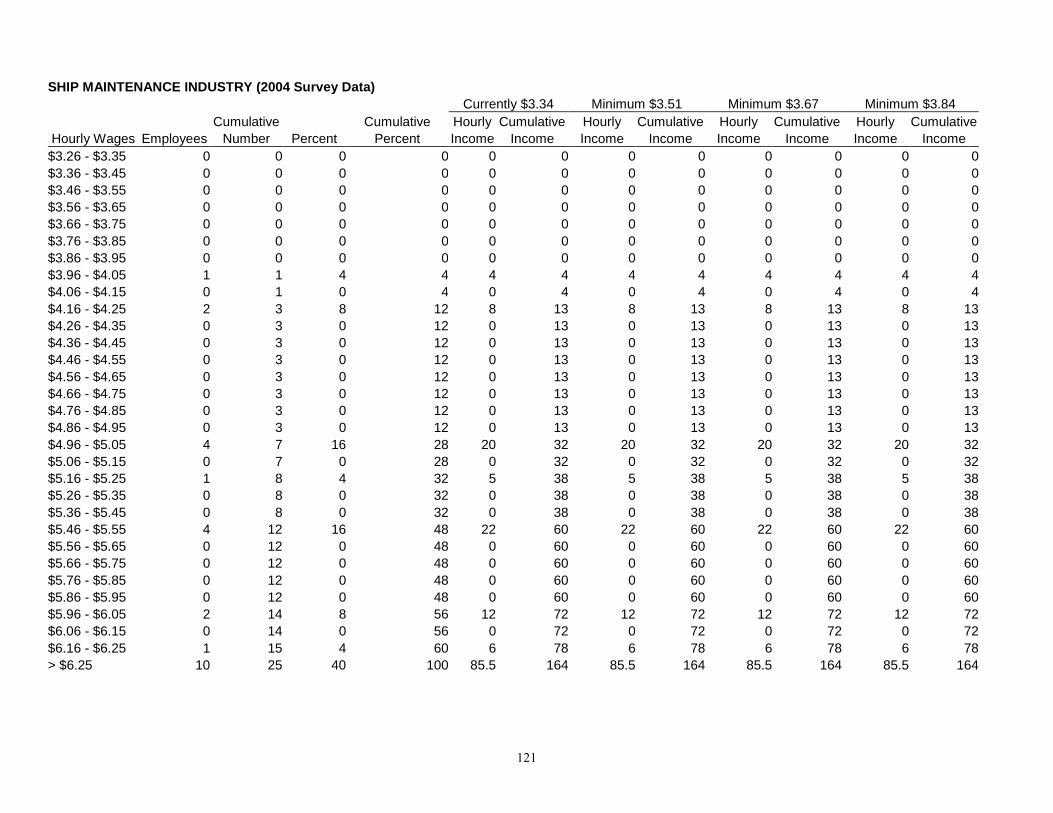
121
SHIP MAINTENANCE INDUSTRY (2004 Survey Data)
Currently $3.34 Minimum $3.51 Minimum $3.67 Minimum $3.84
Cumulative Cumulative Hourly Cumulative Hourly Cumulative Hourly Cumulative Hourly Cumulative
Hourly Wages Employees Number Percent Percent Income Income Income Income Income Income Income Income
$3.26 - $3.35 0 0 0 0 0 0 0 0 0 0 0 0
$3.36 - $3.45 0 0 0 0 0 0 0 0 0 0 0 0
$3.46 - $3.55 0 0 0 0 0 0 0 0 0 0 0 0
$3.56 - $3.65 0 0 0 0 0 0 0 0 0 0 0 0
$3.66 - $3.75 0 0 0 0 0 0 0 0 0 0 0 0
$3.76 - $3.85 0 0 0 0 0 0 0 0 0 0 0 0
$3.86 - $3.95 0 0 0 0 0 0 0 0 0 0 0 0
$3.96 - $4.05 1 1 4 4 4 4 4 4 4 4 4 4
$4.06 - $4.15 0 1 0 4 0 4 0 4 0 4 0 4
$4.16 - $4.25 2 3 8 12 8 13 8 13 8 13 8 13
$4.26 - $4.35 0 3 0 12 0 13 0 13 0 13 0 13
$4.36 - $4.45 0 3 0 12 0 13 0 13 0 13 0 13
$4.46 - $4.55 0 3 0 12 0 13 0 13 0 13 0 13
$4.56 - $4.65 0 3 0 12 0 13 0 13 0 13 0 13
$4.66 - $4.75 0 3 0 12 0 13 0 13 0 13 0 13
$4.76 - $4.85 0 3 0 12 0 13 0 13 0 13 0 13
$4.86 - $4.95 0 3 0 12 0 13 0 13 0 13 0 13
$4.96 - $5.05 4 7 16 28 20 32 20 32 20 32 20 32
$5.06 - $5.15 0 7 0 28 0 32 0 32 0 32 0 32
$5.16 - $5.25 1 8 4 32 5 38 5 38 5 38 5 38
$5.26 - $5.35 0 8 0 32 0 38 0 38 0 38 0 38
$5.36 - $5.45 0 8 0 32 0 38 0 38 0 38 0 38
$5.46 - $5.55 4 12 16 48 22 60 22 60 22 60 22 60
$5.56 - $5.65 0 12 0 48 0 60 0 60 0 60 0 60
$5.66 - $5.75 0 12 0 48 0 60 0 60 0 60 0 60
$5.76 - $5.85 0 12 0 48 0 60 0 60 0 60 0 60
$5.86 - $5.95 0 12 0 48 0 60 0 60 0 60 0 60
$5.96 - $6.05 2 14 8 56 12 72 12 72 12 72 12 72
$6.06 - $6.15 0 14 0 56 0 72 0 72 0 72 0 72
$6.16 - $6.25 1 15 4 60 6 78 6 78 6 78 6 78
> $6.25 10 25 40 100 85.5 164 85.5 164 85.5 164 85.5 164
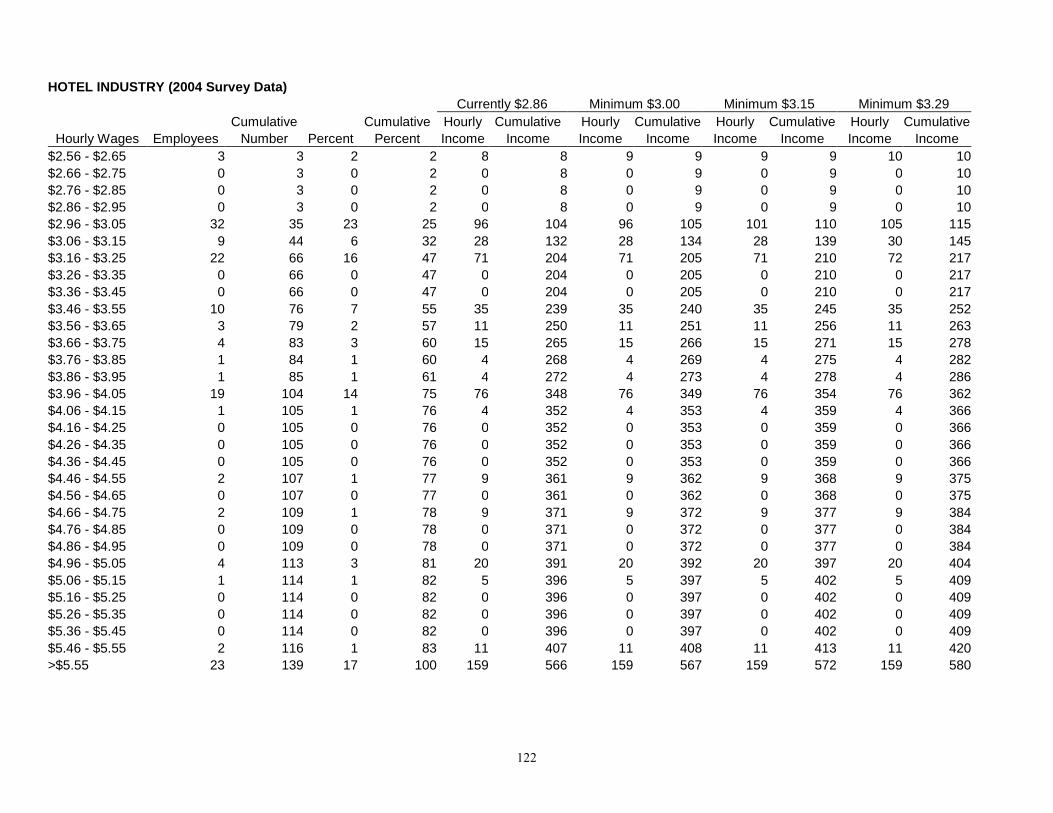
122
HOTEL INDUSTRY (2004 Survey Data)
Currently $2.86 Minimum $3.00 Minimum $3.15 Minimum $3.29
Cumulative Cumulative Hourly Cumulative Hourly Cumulative Hourly Cumulative Hourly Cumulative
Hourly Wages Employees Number Percent Percent Income Income Income Income Income Income Income Income
$2.56 - $2.65 3 3 2 2 8 8 9 9 9 9 10 10
$2.66 - $2.75 0 3 0 2 0 8 0 9 0 9 0 10
$2.76 - $2.85 0 3 0 2 0 8 0 9 0 9 0 10
$2.86 - $2.95 0 3 0 2 0 8 0 9 0 9 0 10
$2.96 - $3.05 32 35 23 25 96 104 96 105 101 110 105 115
$3.06 - $3.15 9 44 6 32 28 132 28 134 28 139 30 145
$3.16 - $3.25 22 66 16 47 71 204 71 205 71 210 72 217
$3.26 - $3.35 0 66 0 47 0 204 0 205 0 210 0 217
$3.36 - $3.45 0 66 0 47 0 204 0 205 0 210 0 217
$3.46 - $3.55 10 76 7 55 35 239 35 240 35 245 35 252
$3.56 - $3.65 3 79 2 57 11 250 11 251 11 256 11 263
$3.66 - $3.75 4 83 3 60 15 265 15 266 15 271 15 278
$3.76 - $3.85 1 84 1 60 4 268 4 269 4 275 4 282
$3.86 - $3.95 1 85 1 61 4 272 4 273 4 278 4 286
$3.96 - $4.05 19 104 14 75 76 348 76 349 76 354 76 362
$4.06 - $4.15 1 105 1 76 4 352 4 353 4 359 4 366
$4.16 - $4.25 0 105 0 76 0 352 0 353 0 359 0 366
$4.26 - $4.35 0 105 0 76 0 352 0 353 0 359 0 366
$4.36 - $4.45 0 105 0 76 0 352 0 353 0 359 0 366
$4.46 - $4.55 2 107 1 77 9 361 9 362 9 368 9 375
$4.56 - $4.65 0 107 0 77 0 361 0 362 0 368 0 375
$4.66 - $4.75 2 109 1 78 9 371 9 372 9 377 9 384
$4.76 - $4.85 0 109 0 78 0 371 0 372 0 377 0 384
$4.86 - $4.95 0 109 0 78 0 371 0 372 0 377 0 384
$4.96 - $5.05 4 113 3 81 20 391 20 392 20 397 20 404
$5.06 - $5.15 1 114 1 82 5 396 5 397 5 402 5 409
$5.16 - $5.25 0 114 0 82 0 396 0 397 0 402 0 409
$5.26 - $5.35 0 114 0 82 0 396 0 397 0 402 0 409
$5.36 - $5.45 0 114 0 82 0 396 0 397 0 402 0 409
$5.46 - $5.55 2 116 1 83 11 407 11 408 11 413 11 420
>$5.55 23 139 17 100 159 566 159 567 159 572 159 580
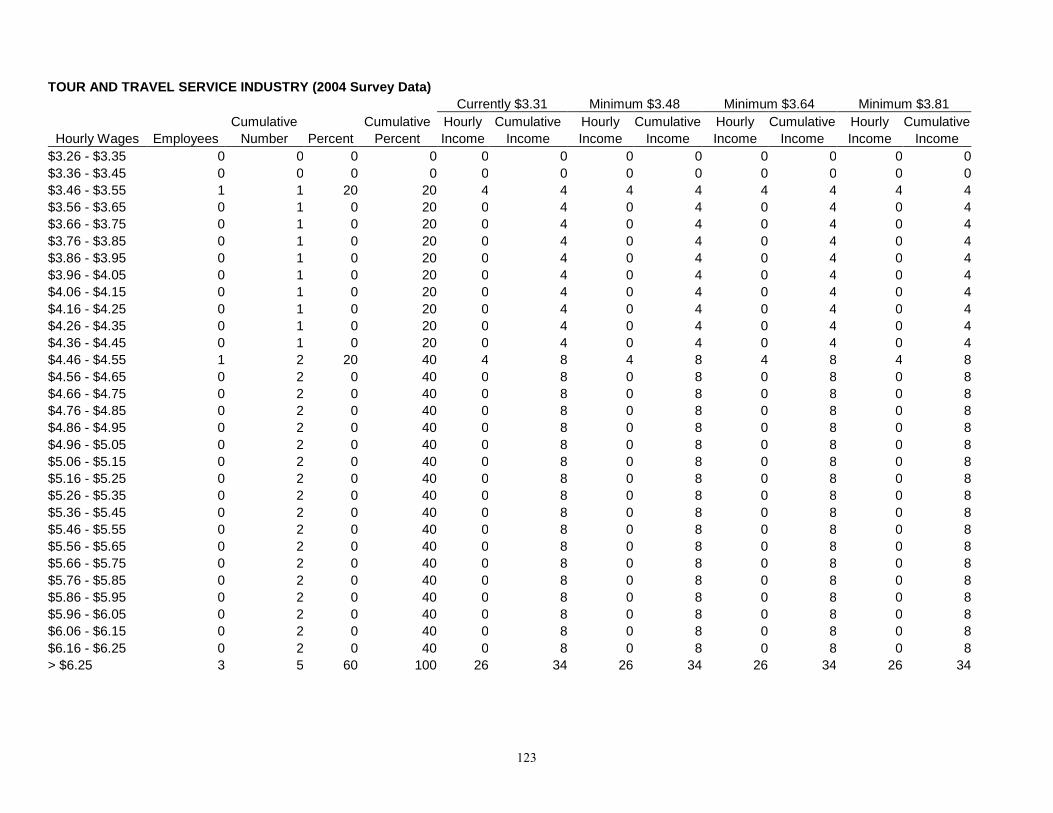
123
TOUR AND TRAVEL SERVICE INDUSTRY (2004 Survey Data)
Currently $3.31 Minimum $3.48 Minimum $3.64 Minimum $3.81
Cumulative Cumulative Hourly Cumulative Hourly Cumulative Hourly Cumulative Hourly Cumulative
Hourly Wages Employees Number Percent Percent Income Income Income Income Income Income Income Income
$3.26 - $3.35 0 0 0 0 0 0 0 0 0 0 0 0
$3.36 - $3.45 0 0 0 0 0 0 0 0 0 0 0 0
$3.46 - $3.55 1 1 20 20 4 4 4 4 4 4 4 4
$3.56 - $3.65 0 1 0 20 0 4 0 4 0 4 0 4
$3.66 - $3.75 0 1 0 20 0 4 0 4 0 4 0 4
$3.76 - $3.85 0 1 0 20 0 4 0 4 0 4 0 4
$3.86 - $3.95 0 1 0 20 0 4 0 4 0 4 0 4
$3.96 - $4.05 0 1 0 20 0 4 0 4 0 4 0 4
$4.06 - $4.15 0 1 0 20 0 4 0 4 0 4 0 4
$4.16 - $4.25 0 1 0 20 0 4 0 4 0 4 0 4
$4.26 - $4.35 0 1 0 20 0 4 0 4 0 4 0 4
$4.36 - $4.45 0 1 0 20 0 4 0 4 0 4 0 4
$4.46 - $4.55 1 2 20 40 4 8 4 8 4 8 4 8
$4.56 - $4.65 0 2 0 40 0 8 0 8 0 8 0 8
$4.66 - $4.75 0 2 0 40 0 8 0 8 0 8 0 8
$4.76 - $4.85 0 2 0 40 0 8 0 8 0 8 0 8
$4.86 - $4.95 0 2 0 40 0 8 0 8 0 8 0 8
$4.96 - $5.05 0 2 0 40 0 8 0 8 0 8 0 8
$5.06 - $5.15 0 2 0 40 0 8 0 8 0 8 0 8
$5.16 - $5.25 0 2 0 40 0 8 0 8 0 8 0 8
$5.26 - $5.35 0 2 0 40 0 8 0 8 0 8 0 8
$5.36 - $5.45 0 2 0 40 0 8 0 8 0 8 0 8
$5.46 - $5.55 0 2 0 40 0 8 0 8 0 8 0 8
$5.56 - $5.65 0 2 0 40 0 8 0 8 0 8 0 8
$5.66 - $5.75 0 2 0 40 0 8 0 8 0 8 0 8
$5.76 - $5.85 0 2 0 40 0 8 0 8 0 8 0 8
$5.86 - $5.95 0 2 0 40 0 8 0 8 0 8 0 8
$5.96 - $6.05 0 2 0 40 0 8 0 8 0 8 0 8
$6.06 - $6.15 0 2 0 40 0 8 0 8 0 8 0 8
$6.16 - $6.25 0 2 0 40 0 8 0 8 0 8 0 8
> $6.25 3 5 60 100 26 34 26 34 26 34 26 34
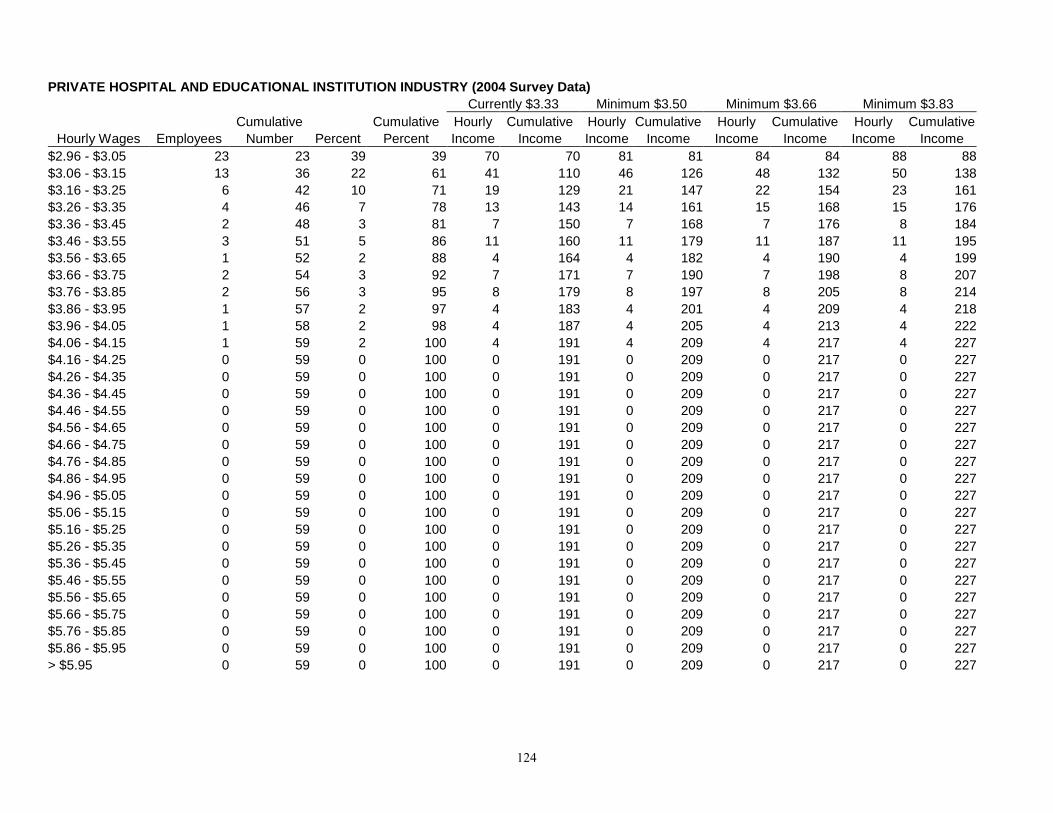
124
PRIVATE HOSPITAL AND EDUCATIONAL INSTITUTION INDUSTRY (2004 Survey Data)
Currently $3.33 Minimum $3.50 Minimum $3.66 Minimum $3.83
Cumulative Cumulative Hourly Cumulative Hourly Cumulative Hourly Cumulative Hourly Cumulative
Hourly Wages Employees Number Percent Percent Income Income Income Income Income Income Income Income
$2.96 - $3.05 23 23 39 39 70 70 81 81 84 84 88 88
$3.06 - $3.15 13 36 22 61 41 110 46 126 48 132 50 138
$3.16 - $3.25 6 42 10 71 19 129 21 147 22 154 23 161
$3.26 - $3.35 4 46 7 78 13 143 14 161 15 168 15 176
$3.36 - $3.45 2 48 3 81 7 150 7 168 7 176 8 184
$3.46 - $3.55 3 51 5 86 11 160 11 179 11 187 11 195
$3.56 - $3.65 1 52 2 88 4 164 4 182 4 190 4 199
$3.66 - $3.75 2 54 3 92 7 171 7 190 7 198 8 207
$3.76 - $3.85 2 56 3 95 8 179 8 197 8 205 8 214
$3.86 - $3.95 1 57 2 97 4 183 4 201 4 209 4 218
$3.96 - $4.05 1 58 2 98 4 187 4 205 4 213 4 222
$4.06 - $4.15 1 59 2 100 4 191 4 209 4 217 4 227
$4.16 - $4.25 0 59 0 100 0 191 0 209 0 217 0 227
$4.26 - $4.35 0 59 0 100 0 191 0 209 0 217 0 227
$4.36 - $4.45 0 59 0 100 0 191 0 209 0 217 0 227
$4.46 - $4.55 0 59 0 100 0 191 0 209 0 217 0 227
$4.56 - $4.65 0 59 0 100 0 191 0 209 0 217 0 227
$4.66 - $4.75 0 59 0 100 0 191 0 209 0 217 0 227
$4.76 - $4.85 0 59 0 100 0 191 0 209 0 217 0 227
$4.86 - $4.95 0 59 0 100 0 191 0 209 0 217 0 227
$4.96 - $5.05 0 59 0 100 0 191 0 209 0 217 0 227
$5.06 - $5.15 0 59 0 100 0 191 0 209 0 217 0 227
$5.16 - $5.25 0 59 0 100 0 191 0 209 0 217 0 227
$5.26 - $5.35 0 59 0 100 0 191 0 209 0 217 0 227
$5.36 - $5.45 0 59 0 100 0 191 0 209 0 217 0 227
$5.46 - $5.55 0 59 0 100 0 191 0 209 0 217 0 227
$5.56 - $5.65 0 59 0 100 0 191 0 209 0 217 0 227
$5.66 - $5.75 0 59 0 100 0 191 0 209 0 217 0 227
$5.76 - $5.85 0 59 0 100 0 191 0 209 0 217 0 227
$5.86 - $5.95 0 59 0 100 0 191 0 209 0 217 0 227
> $5.95 0 59 0 100 0 191 0 209 0 217 0 227
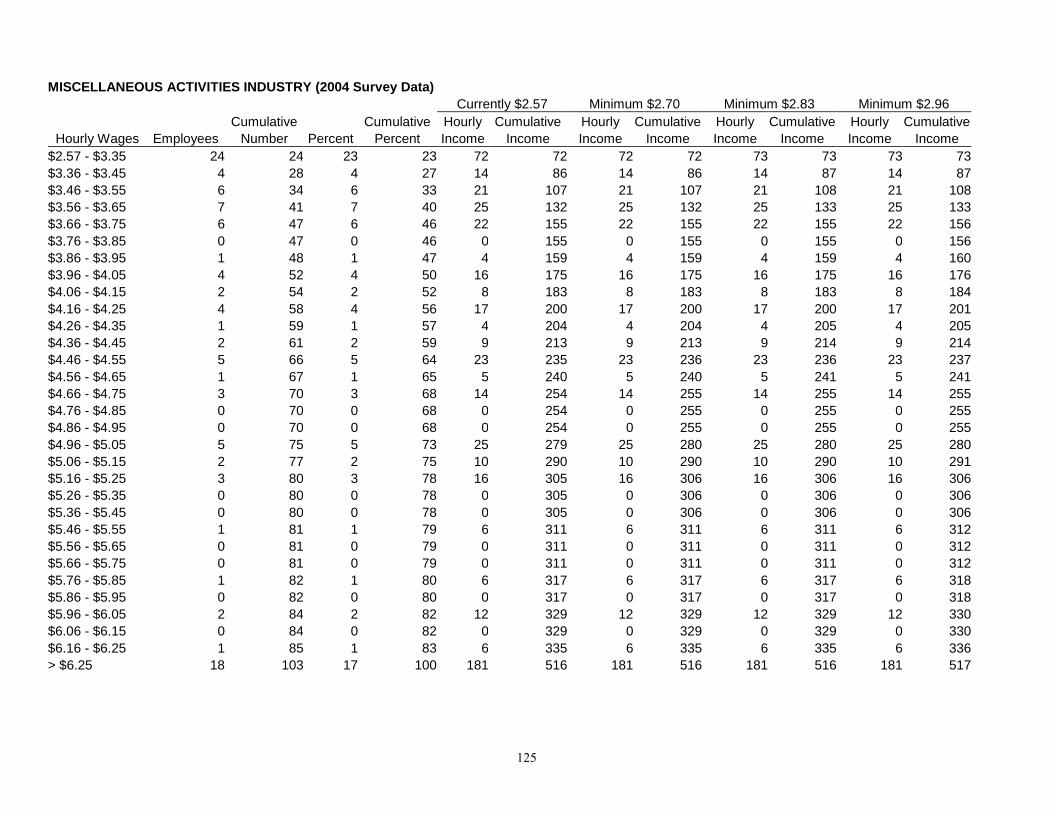
125
MISCELLANEOUS ACTIVITIES INDUSTRY (2004 Survey Data)
Currently $2.57 Minimum $2.70 Minimum $2.83 Minimum $2.96
Cumulative Cumulative Hourly Cumulative Hourly Cumulative Hourly Cumulative Hourly Cumulative
Hourly Wages Employees Number Percent Percent Income Income Income Income Income Income Income Income
$2.57 - $3.35 24 24 23 23 72 72 72 72 73 73 73 73
$3.36 - $3.45 4 28 4 27 14 86 14 86 14 87 14 87
$3.46 - $3.55 6 34 6 33 21 107 21 107 21 108 21 108
$3.56 - $3.65 7 41 7 40 25 132 25 132 25 133 25 133
$3.66 - $3.75 6 47 6 46 22 155 22 155 22 155 22 156
$3.76 - $3.85 0 47 0 46 0 155 0 155 0 155 0 156
$3.86 - $3.95 1 48 1 47 4 159 4 159 4 159 4 160
$3.96 - $4.05 4 52 4 50 16 175 16 175 16 175 16 176
$4.06 - $4.15 2 54 2 52 8 183 8 183 8 183 8 184
$4.16 - $4.25 4 58 4 56 17 200 17 200 17 200 17 201
$4.26 - $4.35 1 59 1 57 4 204 4 204 4 205 4 205
$4.36 - $4.45 2 61 2 59 9 213 9 213 9 214 9 214
$4.46 - $4.55 5 66 5 64 23 235 23 236 23 236 23 237
$4.56 - $4.65 1 67 1 65 5 240 5 240 5 241 5 241
$4.66 - $4.75 3 70 3 68 14 254 14 255 14 255 14 255
$4.76 - $4.85 0 70 0 68 0 254 0 255 0 255 0 255
$4.86 - $4.95 0 70 0 68 0 254 0 255 0 255 0 255
$4.96 - $5.05 5 75 5 73 25 279 25 280 25 280 25 280
$5.06 - $5.15 2 77 2 75 10 290 10 290 10 290 10 291
$5.16 - $5.25 3 80 3 78 16 305 16 306 16 306 16 306
$5.26 - $5.35 0 80 0 78 0 305 0 306 0 306 0 306
$5.36 - $5.45 0 80 0 78 0 305 0 306 0 306 0 306
$5.46 - $5.55 1 81 1 79 6 311 6 311 6 311 6 312
$5.56 - $5.65 0 81 0 79 0 311 0 311 0 311 0 312
$5.66 - $5.75 0 81 0 79 0 311 0 311 0 311 0 312
$5.76 - $5.85 1 82 1 80 6 317 6 317 6 317 6 318
$5.86 - $5.95 0 82 0 80 0 317 0 317 0 317 0 318
$5.96 - $6.05 2 84 2 82 12 329 12 329 12 329 12 330
$6.06 - $6.15 0 84 0 82 0 329 0 329 0 329 0 330
$6.16 - $6.25 1 85 1 83 6 335 6 335 6 335 6 336
> $6.25 18 103 17 100 181 516 181 516 181 516 181 517
- 126 -
Appendix E.
Recommendations of Industry
Committee Numbers 18-25
for Wage Minimums, 1987-
2003
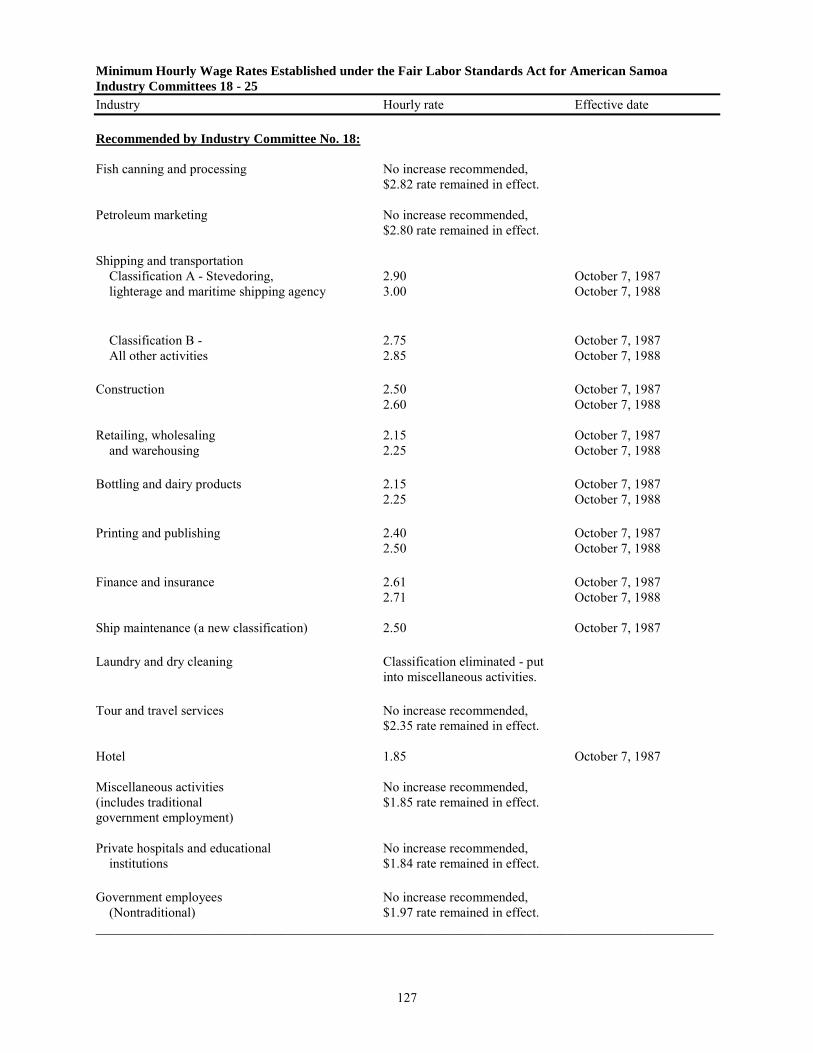
127
Minimum Hourly Wage Rates Established under the Fair Labor Standards Act for American Samoa
Industry Committees 18 - 25 Industry Hourly rate Effective date
Recommended by Industry Committee No. 18:
Fish canning and processing No increase recommended, $2.82 rate remained in effect.
Petroleum marketing No increase recommended, $2.80 rate remained in effect. Shipping and transportation Classification A - Stevedoring, 2.90 October 7, 1987 lighterage and maritime shipping agency 3.00 October 7, 1988 Classification B - 2.75 October 7, 1987 All other activities 2.85 October 7, 1988
Construction 2.50 October 7, 1987 2.60 October 7, 1988 Retailing, wholesaling 2.15 October 7, 1987 and warehousing 2.25 October 7, 1988 Bottling and dairy products 2.15 October 7, 1987 2.25 October 7, 1988 Printing and publishing 2.40 October 7, 1987 2.50 October 7, 1988 Finance and insurance 2.61 October 7, 1987 2.71 October 7, 1988 Ship maintenance (a new classification) 2.50 October 7, 1987 Laundry and dry cleaning Classification eliminated - put into miscellaneous activities. Tour and travel services No increase recommended, $2.35 rate remained in effect. Hotel 1.85 October 7, 1987 Miscellaneous activities No increase recommended, (includes traditional $1.85 rate remained in effect. government employment) Private hospitals and educational No increase recommended, institutions $1.84 rate remained in effect. Government employees No increase recommended, (Nontraditional) $1.97 rate remained in effect. _____________________________________________________________________________________________
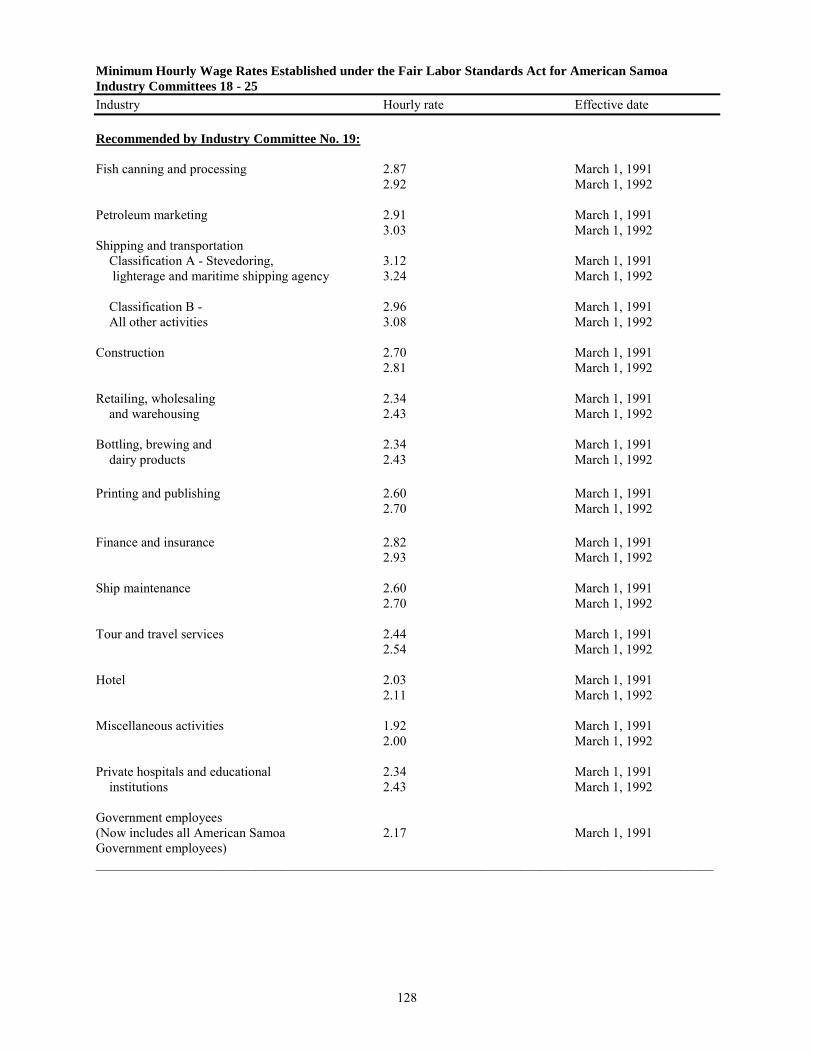
128
Minimum Hourly Wage Rates Established under the Fair Labor Standards Act for American Samoa
Industry Committees 18 - 25 Industry Hourly rate Effective date
Recommended by Industry Committee No. 19:
Fish canning and processing 2.87 March 1, 1991 2.92 March 1, 1992 Petroleum marketing 2.91 March 1, 1991 3.03 March 1, 1992 Shipping and transportation Classification A - Stevedoring, 3.12 March 1, 1991 lighterage and maritime shipping agency 3.24 March 1, 1992 Classification B - 2.96 March 1, 1991 All other activities 3.08 March 1, 1992
Construction 2.70 March 1, 1991 2.81 March 1, 1992 Retailing, wholesaling 2.34 March 1, 1991 and warehousing 2.43 March 1, 1992 Bottling, brewing and 2.34 March 1, 1991 dairy products 2.43 March 1, 1992 Printing and publishing 2.60 March 1, 1991 2.70 March 1, 1992 Finance and insurance 2.82 March 1, 1991 2.93 March 1, 1992 Ship maintenance 2.60 March 1, 1991 2.70 March 1, 1992 Tour and travel services 2.44 March 1, 1991 2.54 March 1, 1992 Hotel 2.03 March 1, 1991 2.11 March 1, 1992 Miscellaneous activities 1.92 March 1, 1991 2.00 March 1, 1992 Private hospitals and educational 2.34 March 1, 1991 institutions 2.43 March 1, 1992 Government employees (Now includes all American Samoa 2.17 March 1, 1991 Government employees) _____________________________________________________________________________________________
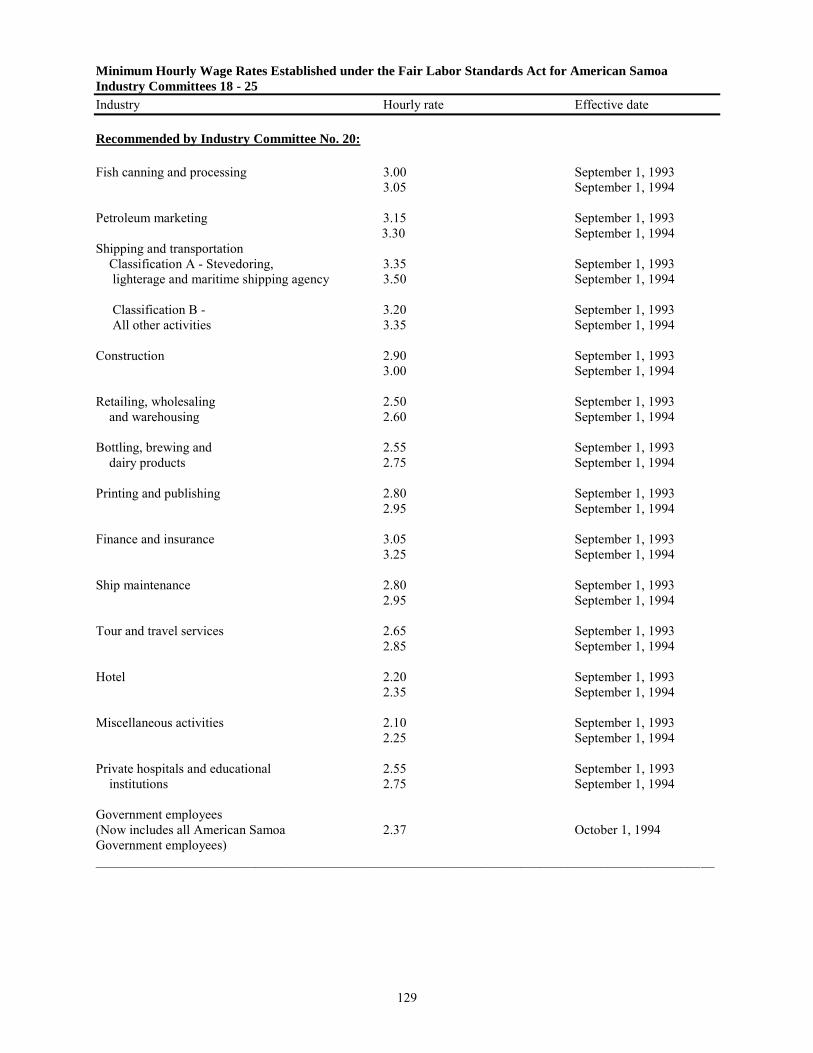
129
Minimum Hourly Wage Rates Established under the Fair Labor Standards Act for American Samoa
Industry Committees 18 - 25 Industry Hourly rate Effective date
Recommended by Industry Committee No. 20:
Fish canning and processing 3.00 September 1, 1993 3.05 September 1, 1994 Petroleum marketing 3.15 September 1, 1993 3.30 September 1, 1994 Shipping and transportation Classification A - Stevedoring, 3.35 September 1, 1993 lighterage and maritime shipping agency 3.50 September 1, 1994 Classification B - 3.20 September 1, 1993 All other activities 3.35 September 1, 1994
Construction 2.90 September 1, 1993 3.00 September 1, 1994 Retailing, wholesaling 2.50 September 1, 1993 and warehousing 2.60 September 1, 1994 Bottling, brewing and 2.55 September 1, 1993 dairy products 2.75 September 1, 1994 Printing and publishing 2.80 September 1, 1993
2.95 September 1, 1994 Finance and insurance 3.05 September 1, 1993 3.25 September 1, 1994 Ship maintenance 2.80 September 1, 1993 2.95 September 1, 1994 Tour and travel services 2.65 September 1, 1993 2.85 September 1, 1994 Hotel 2.20 September 1, 1993 2.35 September 1, 1994 Miscellaneous activities 2.10 September 1, 1993 2.25 September 1, 1994 Private hospitals and educational 2.55 September 1, 1993 institutions 2.75 September 1, 1994 Government employees (Now includes all American Samoa 2.37 October 1, 1994 Government employees) _____________________________________________________________________________________________
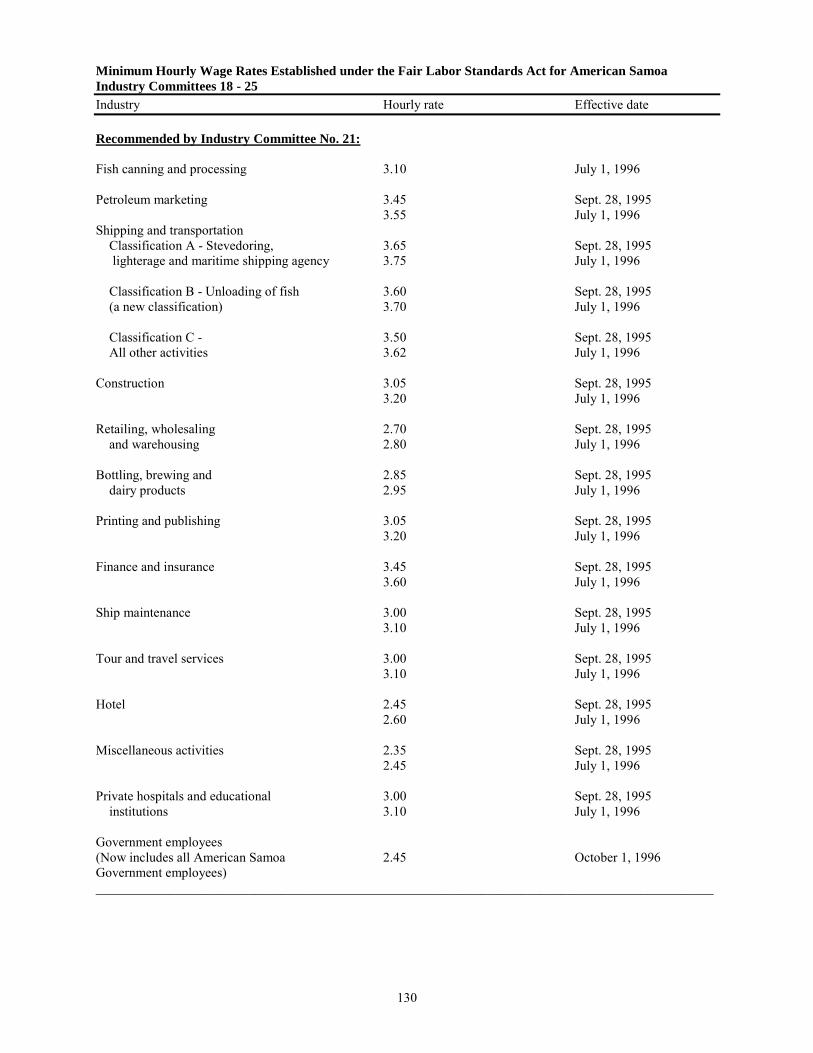
130
Minimum Hourly Wage Rates Established under the Fair Labor Standards Act for American Samoa
Industry Committees 18 - 25 Industry Hourly rate Effective date
Recommended by Industry Committee No. 21:
Fish canning and processing 3.10 July 1, 1996 Petroleum marketing 3.45 Sept. 28, 1995 3.55 July 1, 1996 Shipping and transportation Classification A - Stevedoring, 3.65 Sept. 28, 1995 lighterage and maritime shipping agency 3.75 July 1, 1996 Classification B - Unloading of fish 3.60 Sept. 28, 1995 (a new classification) 3.70 July 1, 1996
Classification C - 3.50 Sept. 28, 1995 All other activities 3.62 July 1, 1996 Construction 3.05 Sept. 28, 1995 3.20 July 1, 1996 Retailing, wholesaling 2.70 Sept. 28, 1995 and warehousing 2.80 July 1, 1996 Bottling, brewing and 2.85 Sept. 28, 1995 dairy products 2.95 July 1, 1996 Printing and publishing 3.05 Sept. 28, 1995 3.20 July 1, 1996
Finance and insurance 3.45 Sept. 28, 1995 3.60 July 1, 1996 Ship maintenance 3.00 Sept. 28, 1995 3.10 July 1, 1996 Tour and travel services 3.00 Sept. 28, 1995 3.10 July 1, 1996 Hotel 2.45 Sept. 28, 1995 2.60 July 1, 1996 Miscellaneous activities 2.35 Sept. 28, 1995 2.45 July 1, 1996 Private hospitals and educational 3.00 Sept. 28, 1995 institutions 3.10 July 1, 1996 Government employees (Now includes all American Samoa 2.45 October 1, 1996 Government employees) _____________________________________________________________________________________________
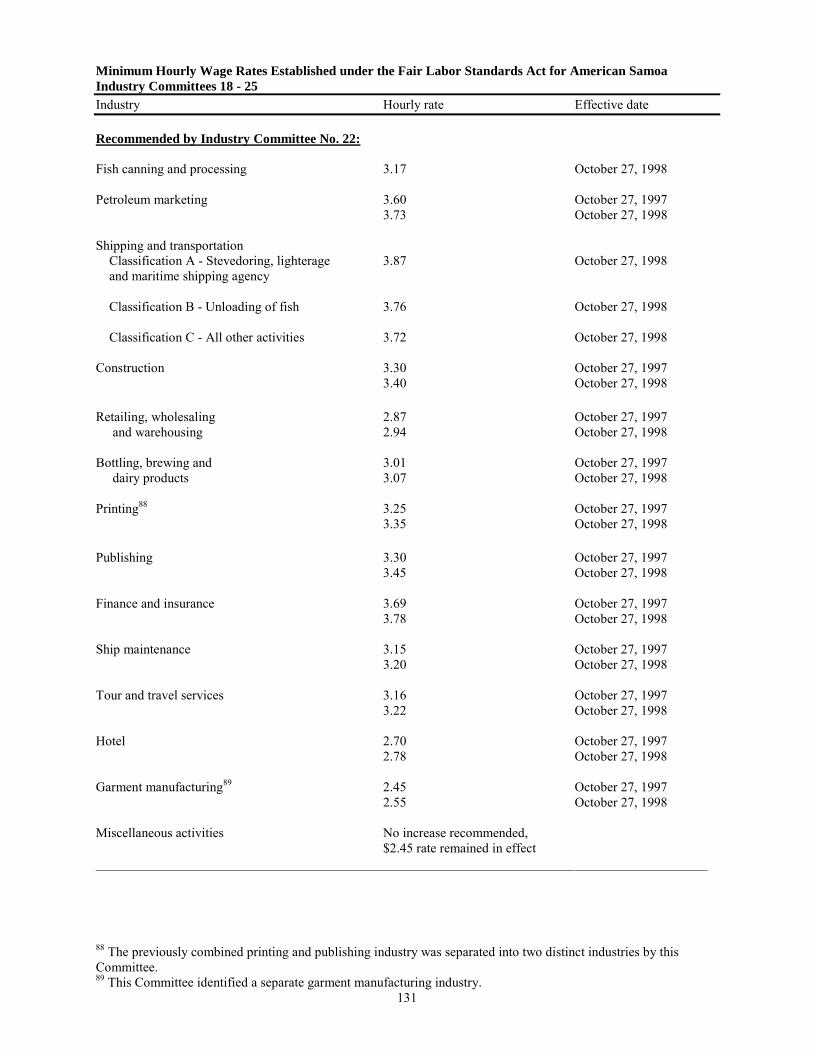
131
Minimum Hourly Wage Rates Established under the Fair Labor Standards Act for American Samoa
Industry Committees 18 - 25 Industry Hourly rate Effective date
Recommended by Industry Committee No. 22:
Fish canning and processing 3.17 October 27, 1998 Petroleum marketing 3.60 October 27, 1997
3.73 October 27, 1998 Shipping and transportation Classification A - Stevedoring, lighterage 3.87 October 27, 1998 and maritime shipping agency
Classification B - Unloading of fish 3.76 October 27, 1998 Classification C - All other activities 3.72 October 27, 1998 Construction 3.30 October 27, 1997 3.40 October 27, 1998 Retailing, wholesaling 2.87 October 27, 1997 and warehousing 2.94 October 27, 1998 Bottling, brewing and 3.01 October 27, 1997 dairy products 3.07 October 27, 1998 Printing88 3.25 October 27, 1997
3.35 October 27, 1998 Publishing 3.30 October 27, 1997 3.45 October 27, 1998 Finance and insurance 3.69 October 27, 1997 3.78 October 27, 1998 Ship maintenance 3.15 October 27, 1997 3.20 October 27, 1998 Tour and travel services 3.16 October 27, 1997 3.22 October 27, 1998 Hotel 2.70 October 27, 1997 2.78 October 27, 1998 Garment manufacturing89 2.45 October 27, 1997
2.55 October 27, 1998 Miscellaneous activities No increase recommended,
$2.45 rate remained in effect ____________________________________________________________________________________________
88 The previously combined printing and publishing industry was separated into two distinct industries by this Committee. 89 This Committee identified a separate garment manufacturing industry.
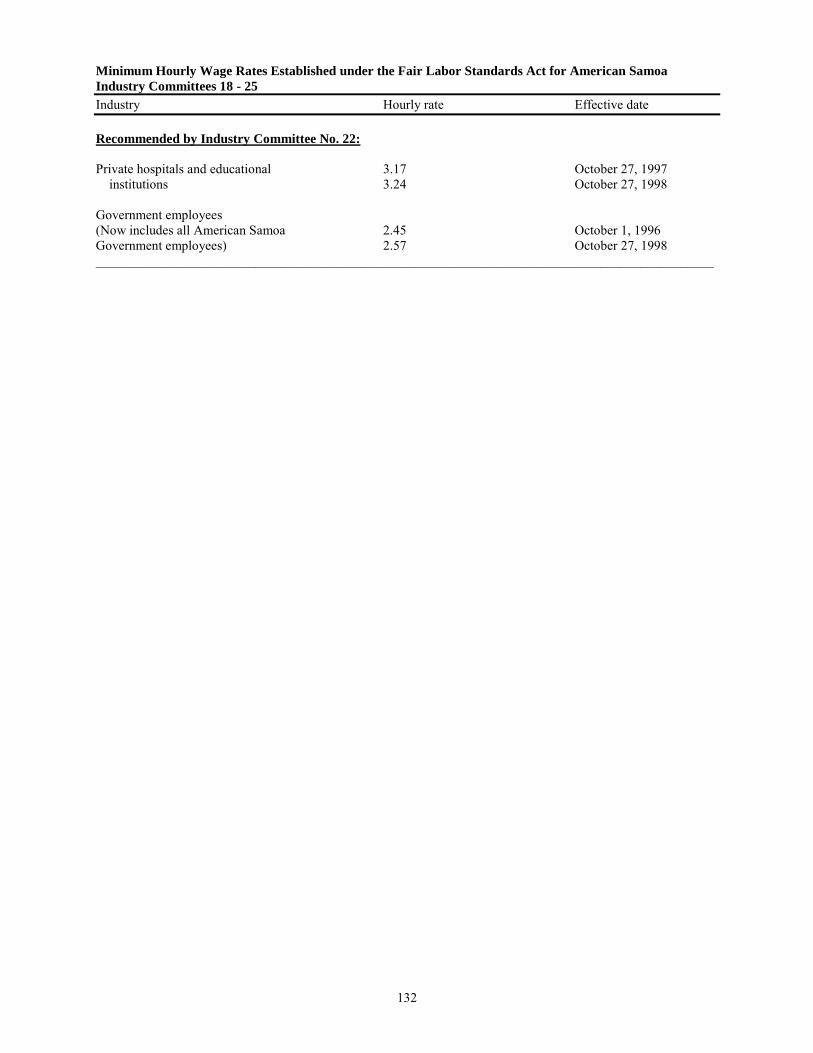
132
Minimum Hourly Wage Rates Established under the Fair Labor Standards Act for American Samoa
Industry Committees 18 - 25 Industry Hourly rate Effective date
Recommended by Industry Committee No. 22: Private hospitals and educational 3.17 October 27, 1997 institutions 3.24 October 27, 1998 Government employees (Now includes all American Samoa 2.45 October 1, 1996 Government employees) 2.57 October 27, 1998 _____________________________________________________________________________________________
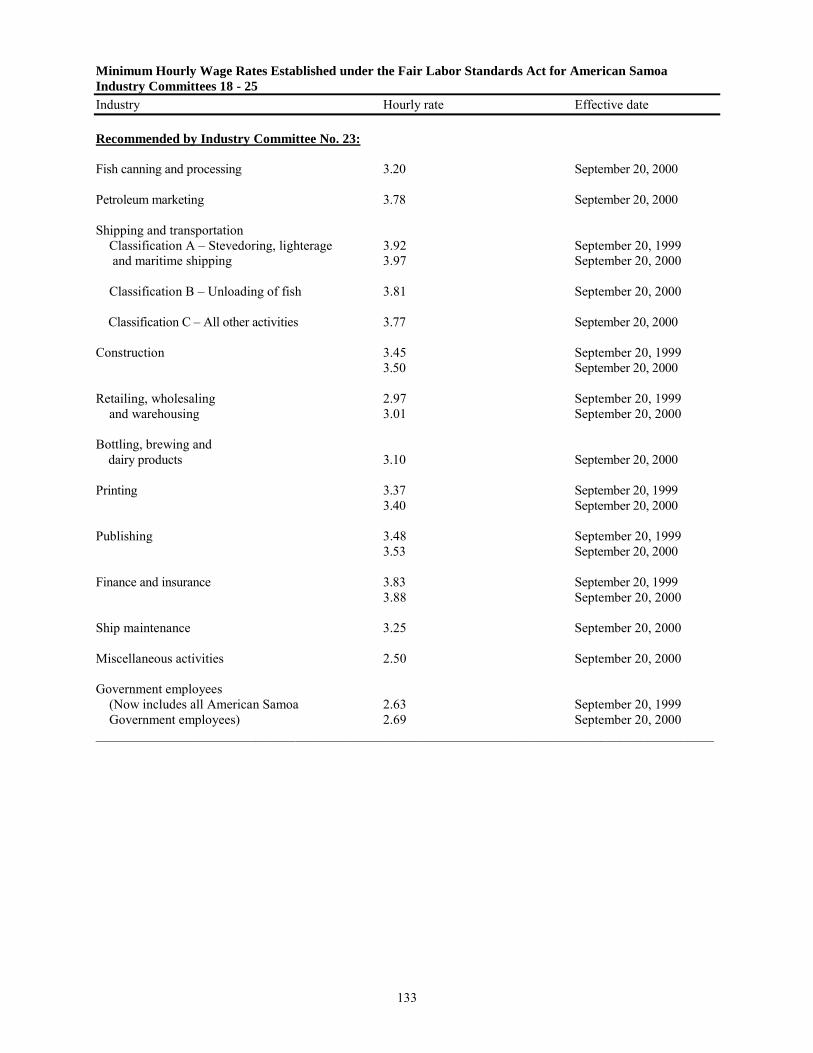
133
Minimum Hourly Wage Rates Established under the Fair Labor Standards Act for American Samoa
Industry Committees 18 - 25 Industry Hourly rate Effective date
Recommended by Industry Committee No. 23:
Fish canning and processing 3.20 September 20, 2000 Petroleum marketing 3.78 September 20, 2000 Shipping and transportation Classification A – Stevedoring, lighterage 3.92 September 20, 1999 and maritime shipping 3.97 September 20, 2000 Classification B – Unloading of fish 3.81 September 20, 2000 Classification C – All other activities 3.77 September 20, 2000 Construction 3.45 September 20, 1999 3.50 September 20, 2000 Retailing, wholesaling 2.97 September 20, 1999 and warehousing 3.01 September 20, 2000 Bottling, brewing and dairy products 3.10 September 20, 2000 Printing 3.37 September 20, 1999 3.40 September 20, 2000 Publishing 3.48 September 20, 1999 3.53 September 20, 2000 Finance and insurance 3.83 September 20, 1999
3.88 September 20, 2000 Ship maintenance 3.25 September 20, 2000 Miscellaneous activities 2.50 September 20, 2000 Government employees (Now includes all American Samoa 2.63 September 20, 1999 Government employees) 2.69 September 20, 2000 _____________________________________________________________________________________________
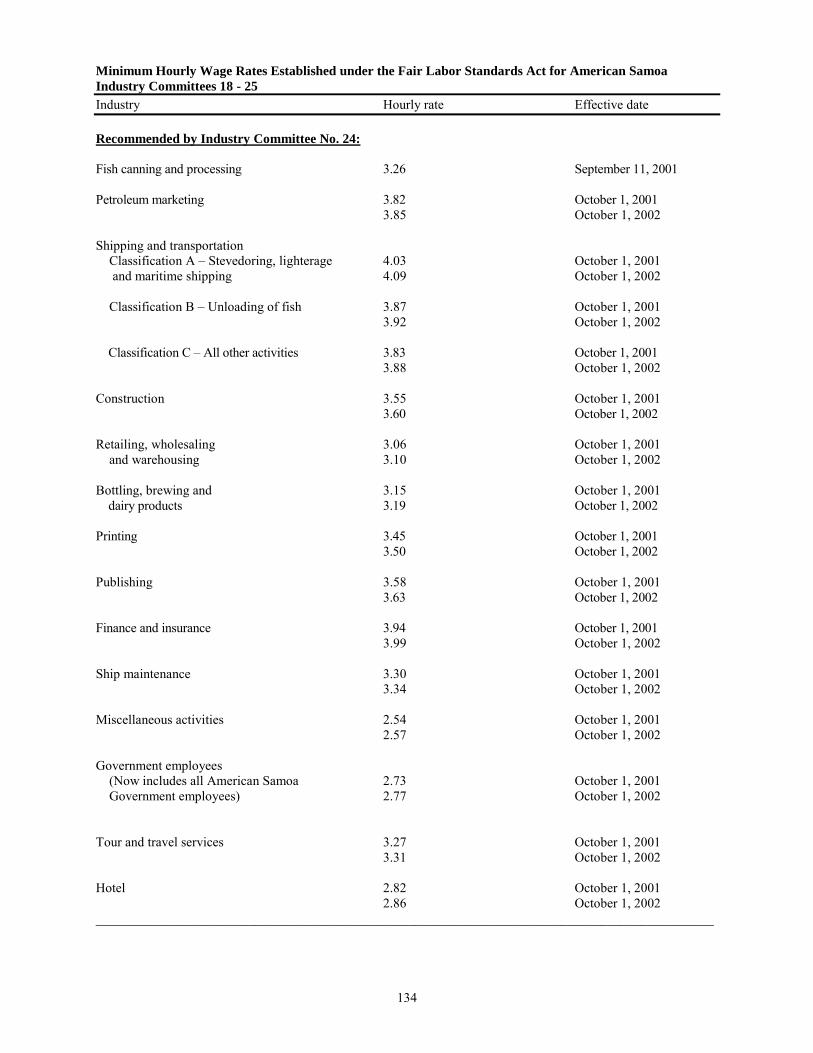
134
Minimum Hourly Wage Rates Established under the Fair Labor Standards Act for American Samoa
Industry Committees 18 - 25 Industry Hourly rate Effective date
Recommended by Industry Committee No. 24:
Fish canning and processing 3.26 September 11, 2001 Petroleum marketing 3.82 October 1, 2001 3.85 October 1, 2002 Shipping and transportation Classification A – Stevedoring, lighterage 4.03 October 1, 2001 and maritime shipping 4.09 October 1, 2002 Classification B – Unloading of fish 3.87 October 1, 2001 3.92 October 1, 2002 Classification C – All other activities 3.83 October 1, 2001 3.88 October 1, 2002 Construction 3.55 October 1, 2001 3.60 October 1, 2002 Retailing, wholesaling 3.06 October 1, 2001 and warehousing 3.10 October 1, 2002 Bottling, brewing and 3.15 October 1, 2001 dairy products 3.19 October 1, 2002 Printing 3.45 October 1, 2001 3.50 October 1, 2002 Publishing 3.58 October 1, 2001 3.63 October 1, 2002 Finance and insurance 3.94 October 1, 2001
3.99 October 1, 2002 Ship maintenance 3.30 October 1, 2001 3.34 October 1, 2002 Miscellaneous activities 2.54 October 1, 2001 2.57 October 1, 2002 Government employees (Now includes all American Samoa 2.73 October 1, 2001 Government employees) 2.77 October 1, 2002 Tour and travel services 3.27 October 1, 2001 3.31 October 1, 2002 Hotel 2.82 October 1, 2001 2.86 October 1, 2002 _____________________________________________________________________________________________
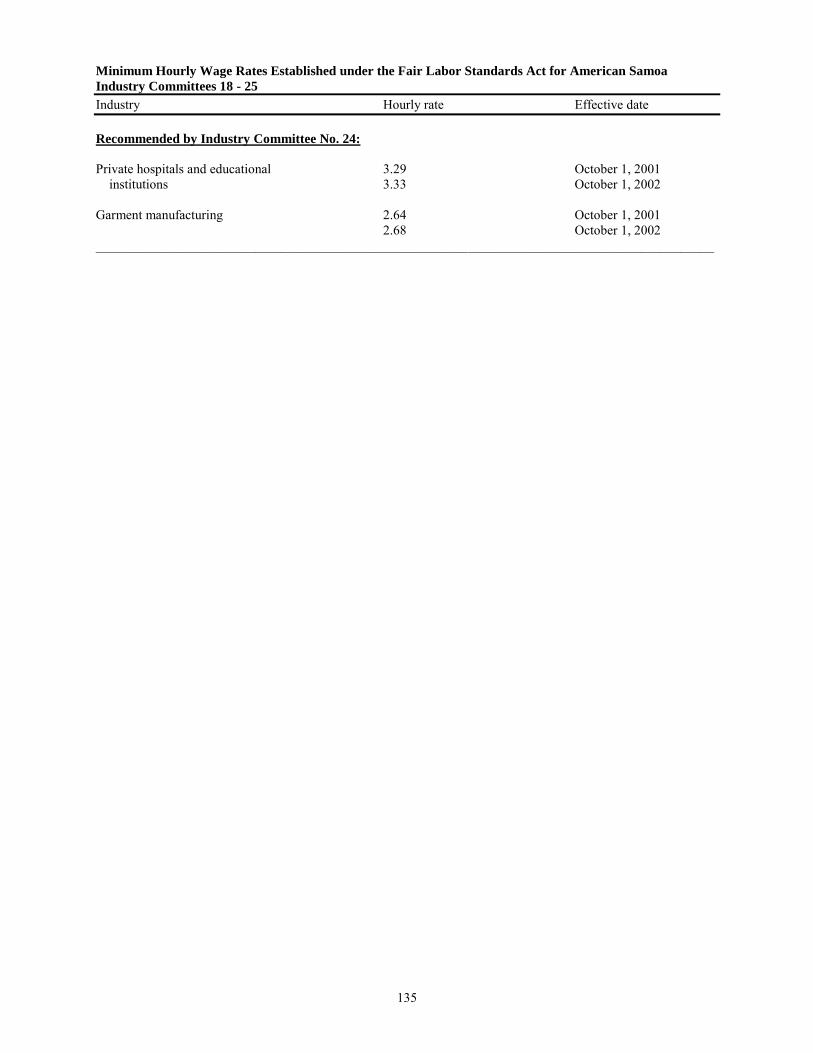
135
Minimum Hourly Wage Rates Established under the Fair Labor Standards Act for American Samoa
Industry Committees 18 - 25 Industry Hourly rate Effective date
Recommended by Industry Committee No. 24:
Private hospitals and educational 3.29 October 1, 2001 institutions 3.33 October 1, 2002 Garment manufacturing 2.64 October 1, 2001
2.68 October 1, 2002 _____________________________________________________________________________________________
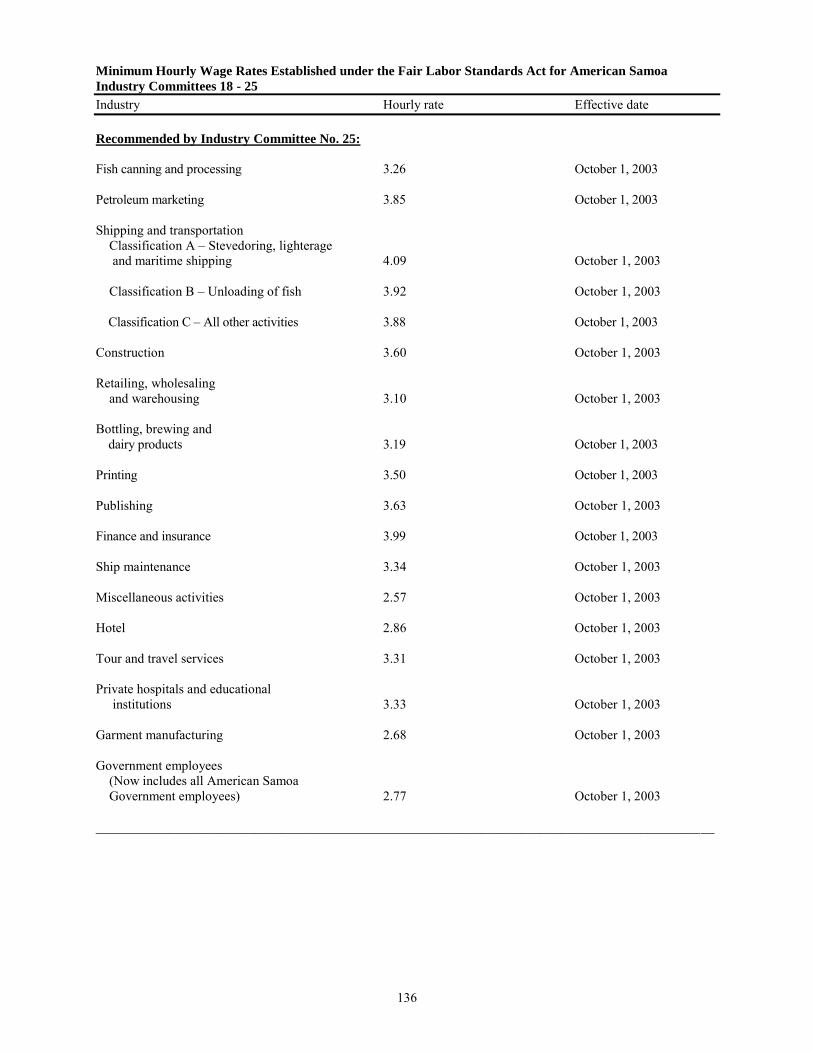
136
Minimum Hourly Wage Rates Established under the Fair Labor Standards Act for American Samoa
Industry Committees 18 - 25 Industry Hourly rate Effective date
Recommended by Industry Committee No. 25:
Fish canning and processing 3.26 October 1, 2003 Petroleum marketing 3.85 October 1, 2003 Shipping and transportation Classification A – Stevedoring, lighterage and maritime shipping 4.09 October 1, 2003 Classification B – Unloading of fish 3.92 October 1, 2003 Classification C – All other activities 3.88 October 1, 2003 Construction 3.60 October 1, 2003 Retailing, wholesaling and warehousing 3.10 October 1, 2003 Bottling, brewing and dairy products 3.19 October 1, 2003 Printing 3.50 October 1, 2003 Publishing 3.63 October 1, 2003 Finance and insurance 3.99 October 1, 2003 Ship maintenance 3.34 October 1, 2003 Miscellaneous activities 2.57 October 1, 2003 Hotel 2.86 October 1, 2003 Tour and travel services 3.31 October 1, 2003 Private hospitals and educational institutions 3.33 October 1, 2003 Garment manufacturing 2.68 October 1, 2003 Government employees (Now includes all American Samoa Government employees) 2.77 October 1, 2003 _____________________________________________________________________________________________
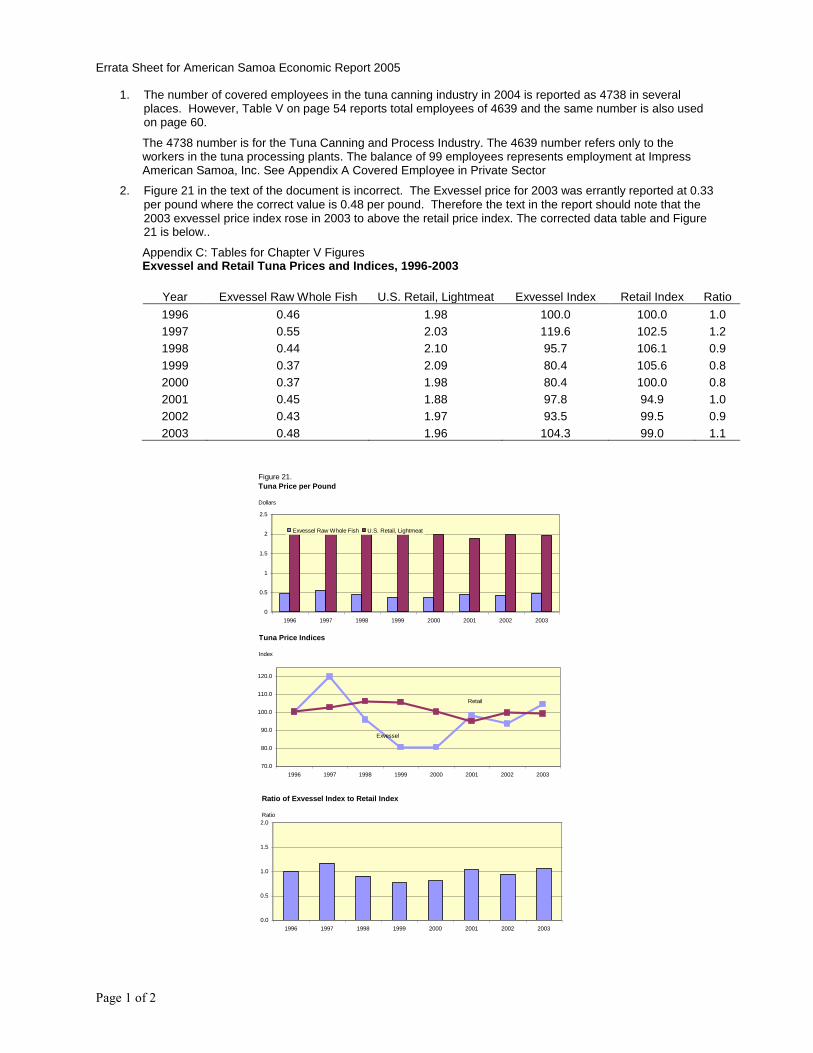
Page 1 of 2
Errata Sheet for American Samoa Economic Report 2005
1. The number of covered employees in the tuna canning industry in 2004 is reported as 4738 in several places. However, Table V on page 54 reports total employees of 4639 and the same number is also used on page 60.
The 4738 number is for the Tuna Canning and Process Industry. The 4639 number refers only to the workers in the tuna processing plants. The balance of 99 employees represents employment at Impress American Samoa, Inc. See Appendix A Covered Employee in Private Sector
2. Figure 21 in the text of the document is incorrect. The Exvessel price for 2003 was errantly reported at 0.33 per pound where the correct value is 0.48 per pound. Therefore the text in the report should note that the 2003 exvessel price index rose in 2003 to above the retail price index. The corrected data table and Figure 21 is below..
Appendix C: Tables for Chapter V Figures Exvessel and Retail Tuna Prices and Indices, 1996-2003
Year Exvessel Raw Whole Fish U.S. Retail, Lightmeat Exvessel Index Retail Index Ratio
1996 0.46 1.98 100.0 100.0 1.0
1997 0.55 2.03 119.6 102.5 1.2
1998 0.44 2.10 95.7 106.1 0.9
1999 0.37 2.09 80.4 105.6 0.8
2000 0.37 1.98 80.4 100.0 0.8
2001 0.45 1.88 97.8 94.9 1.0
2002 0.43 1.97 93.5 99.5 0.9
2003 0.48 1.96 104.3 99.0 1.1
0
0.5
1
1.5
2
2.5
1996 1997 1998 1999 2000 2001 2002 2003
Exvessel Raw Whole Fish U.S. Retail, Lightmeat
70.0
80.0
90.0
100.0
110.0
120.0
1996 1997 1998 1999 2000 2001 2002 2003
Tuna Price Indices
Index
Retail
Exvessel
Figure 21.
Tuna Price per Pound
Dollars
0.0
0.5
1.0
1.5
2.0
1996 1997 1998 1999 2000 2001 2002 2003
Ratio of Exvessel Index to Retail Index
Ratio
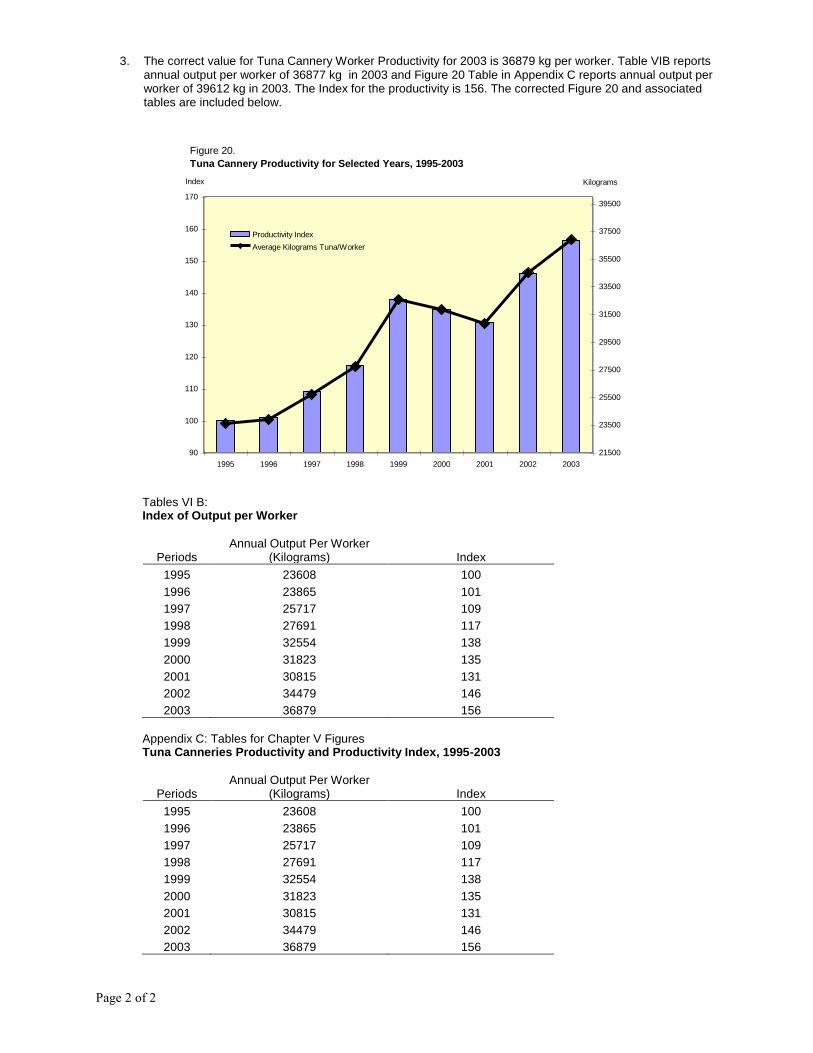
Page 2 of 2
3. The correct value for Tuna Cannery Worker Productivity for 2003 is 36879 kg per worker. Table VIB reports annual output per worker of 36877 kg in 2003 and Figure 20 Table in Appendix C reports annual output per worker of 39612 kg in 2003. The Index for the productivity is 156. The corrected Figure 20 and associated tables are included below.
Tables VI B: Index of Output per Worker
Periods Annual Output Per Worker
(Kilograms) Index
1995 23608 100
1996 23865 101
1997 25717 109
1998 27691 117
1999 32554 138
2000 31823 135
2001 30815 131
2002 34479 146
2003 36879 156
Appendix C: Tables for Chapter V Figures Tuna Canneries Productivity and Productivity Index, 1995-2003
Periods Annual Output Per Worker
(Kilograms) Index
1995 23608 100
1996 23865 101
1997 25717 109
1998 27691 117
1999 32554 138
2000 31823 135
2001 30815 131
2002 34479 146
2003 36879 156
Figure 20.
Tuna Cannery Productivity for Selected Years, 1995-2003
90
100
110
120
130
140
150
160
170
1995 1996 1997 1998 1999 2000 2001 2002 2003
21500
23500
25500
27500
29500
31500
33500
35500
37500
39500
Productivity Index
Average Kilograms Tuna/Worker
Index Kilograms