Embed Size (px)
Citation preview
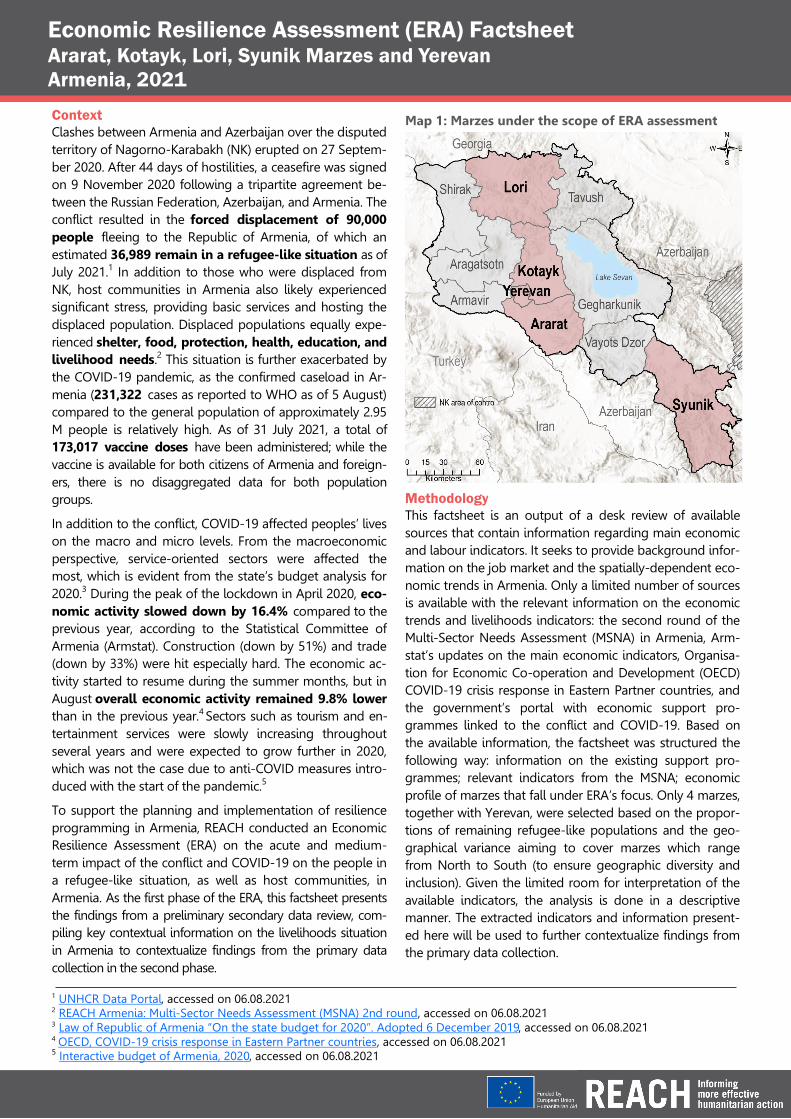
Economic Resilience Assessment (ERA) Factsheet Ararat, Kotayk, Lori, Syunik Marzes and Yerevan
Armenia, 2021
Context
Clashes between Armenia and Azerbaijan over the disputed territory of Nagorno-Karabakh (NK) erupted on 27 Septem-ber 2020. After 44 days of hostilities, a ceasefire was signed on 9 November 2020 following a tripartite agreement be-tween the Russian Federation, Azerbaijan, and Armenia. The conflict resulted in the forced displacement of 90,000 people fleeing to the Republic of Armenia, of which an estimated 36,989 remain in a refugee-like situation as of July 2021.1 In addition to those who were displaced from NK, host communities in Armenia also likely experienced significant stress, providing basic services and hosting the displaced population. Displaced populations equally expe-rienced shelter, food, protection, health, education, and livelihood needs.2 This situation is further exacerbated by the COVID-19 pandemic, as the confirmed caseload in Ar-menia (231,322 cases as reported to WHO as of 5 August) compared to the general population of approximately 2.95 M people is relatively high. As of 31 July 2021, a total of 173,017 vaccine doses have been administered; while the vaccine is available for both citizens of Armenia and foreign-ers, there is no disaggregated data for both population groups.
In addition to the conflict, COVID-19 affected peoples’ lives on the macro and micro levels. From the macroeconomic perspective, service-oriented sectors were affected the most, which is evident from the state’s budget analysis for 2020.3 During the peak of the lockdown in April 2020, eco-nomic activity slowed down by 16.4% compared to the previous year, according to the Statistical Committee of Armenia (Armstat). Construction (down by 51%) and trade (down by 33%) were hit especially hard. The economic ac-tivity started to resume during the summer months, but in August overall economic activity remained 9.8% lower than in the previous year.4 Sectors such as tourism and en-tertainment services were slowly increasing throughout several years and were expected to grow further in 2020, which was not the case due to anti-COVID measures intro-duced with the start of the pandemic.5
To support the planning and implementation of resilience programming in Armenia, REACH conducted an Economic Resilience Assessment (ERA) on the acute and medium-term impact of the conflict and COVID-19 on the people in a refugee-like situation, as well as host communities, in Armenia. As the first phase of the ERA, this factsheet presents the findings from a preliminary secondary data review, com-piling key contextual information on the livelihoods situation in Armenia to contextualize findings from the primary data collection in the second phase.
Methodology
This factsheet is an output of a desk review of available sources that contain information regarding main economic and labour indicators. It seeks to provide background infor-mation on the job market and the spatially-dependent eco-nomic trends in Armenia. Only a limited number of sources is available with the relevant information on the economic trends and livelihoods indicators: the second round of the Multi-Sector Needs Assessment (MSNA) in Armenia, Arm-stat’s updates on the main economic indicators, Organisa-tion for Economic Co-operation and Development (OECD) COVID-19 crisis response in Eastern Partner countries, and the government’s portal with economic support pro-grammes linked to the conflict and COVID-19. Based on the available information, the factsheet was structured the following way: information on the existing support pro-grammes; relevant indicators from the MSNA; economic profile of marzes that fall under ERA’s focus. Only 4 marzes, together with Yerevan, were selected based on the propor-tions of remaining refugee-like populations and the geo-graphical variance aiming to cover marzes which range from North to South (to ensure geographic diversity and inclusion). Given the limited room for interpretation of the available indicators, the analysis is done in a descriptive manner. The extracted indicators and information present-ed here will be used to further contextualize findings from the primary data collection.
1 UNHCR Data Portal, accessed on 06.08.2021 2 REACH Armenia: Multi-Sector Needs Assessment (MSNA) 2nd round, accessed on 06.08.2021 3 Law of Republic of Armenia “On the state budget for 2020”. Adopted 6 December 2019, accessed on 06.08.2021 4 OECD, COVID-19 crisis response in Eastern Partner countries, accessed on 06.08.2021 5 Interactive budget of Armenia, 2020, accessed on 06.08.2021
Map 1: Marzes under the scope of ERA assessment
2
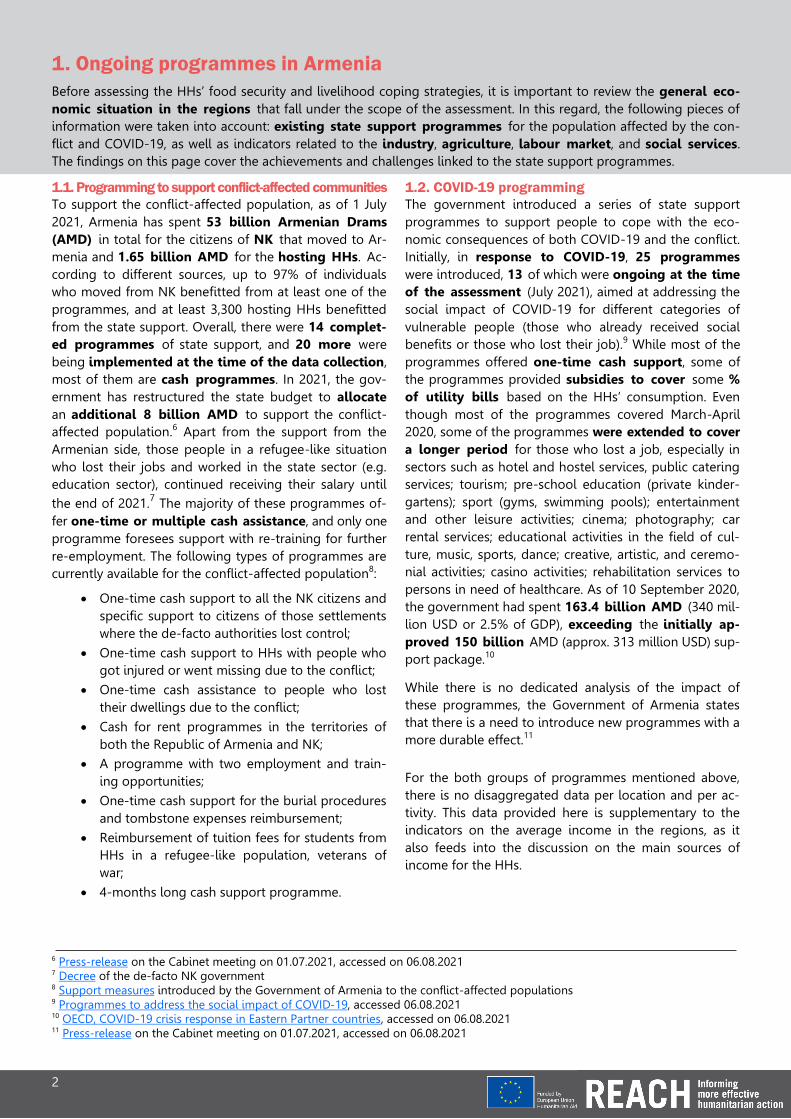
1. Ongoing programmes in Armenia
Before assessing the HHs’ food security and livelihood coping strategies, it is important to review the general eco-nomic situation in the regions that fall under the scope of the assessment. In this regard, the following pieces of information were taken into account: existing state support programmes for the population affected by the con-flict and COVID-19, as well as indicators related to the industry, agriculture, labour market, and social services. The findings on this page cover the achievements and challenges linked to the state support programmes.
1.1. Programming to support conflict-affected communities
To support the conflict-affected population, as of 1 July 2021, Armenia has spent 53 billion Armenian Drams (AMD) in total for the citizens of NK that moved to Ar-menia and 1.65 billion AMD for the hosting HHs. Ac-cording to different sources, up to 97% of individuals who moved from NK benefitted from at least one of the programmes, and at least 3,300 hosting HHs benefitted from the state support. Overall, there were 14 complet-ed programmes of state support, and 20 more were being implemented at the time of the data collection, most of them are cash programmes. In 2021, the gov-ernment has restructured the state budget to allocate an additional 8 billion AMD to support the conflict-affected population.6 Apart from the support from the Armenian side, those people in a refugee-like situation who lost their jobs and worked in the state sector (e.g. education sector), continued receiving their salary until the end of 2021.7 The majority of these programmes of-fer one-time or multiple cash assistance, and only one programme foresees support with re-training for further re-employment. The following types of programmes are currently available for the conflict-affected population8:
• One-time cash support to all the NK citizens and specific support to citizens of those settlements where the de-facto authorities lost control;
• One-time cash support to HHs with people who got injured or went missing due to the conflict;
• One-time cash assistance to people who lost their dwellings due to the conflict;
• Cash for rent programmes in the territories of both the Republic of Armenia and NK;
• A programme with two employment and train-ing opportunities;
• One-time cash support for the burial procedures and tombstone expenses reimbursement;
• Reimbursement of tuition fees for students from HHs in a refugee-like population, veterans of war;
• 4-months long cash support programme.
1.2. COVID-19 programming
The government introduced a series of state support programmes to support people to cope with the eco-nomic consequences of both COVID-19 and the conflict. Initially, in response to COVID-19, 25 programmes were introduced, 13 of which were ongoing at the time of the assessment (July 2021), aimed at addressing the social impact of COVID-19 for different categories of vulnerable people (those who already received social benefits or those who lost their job).9 While most of the programmes offered one-time cash support, some of the programmes provided subsidies to cover some % of utility bills based on the HHs’ consumption. Even though most of the programmes covered March-April 2020, some of the programmes were extended to cover a longer period for those who lost a job, especially in sectors such as hotel and hostel services, public catering services; tourism; pre-school education (private kinder-gartens); sport (gyms, swimming pools); entertainment and other leisure activities; cinema; photography; car rental services; educational activities in the field of cul-ture, music, sports, dance; creative, artistic, and ceremo-nial activities; casino activities; rehabilitation services to persons in need of healthcare. As of 10 September 2020, the government had spent 163.4 billion AMD (340 mil-lion USD or 2.5% of GDP), exceeding the initially ap-proved 150 billion AMD (approx. 313 million USD) sup-port package.10
While there is no dedicated analysis of the impact of these programmes, the Government of Armenia states that there is a need to introduce new programmes with a more durable effect.11
For the both groups of programmes mentioned above, there is no disaggregated data per location and per ac-tivity. This data provided here is supplementary to the indicators on the average income in the regions, as it also feeds into the discussion on the main sources of income for the HHs.
6 Press-release on the Cabinet meeting on 01.07.2021, accessed on 06.08.2021 7 Decree of the de-facto NK government 8 Support measures introduced by the Government of Armenia to the conflict-affected populations 9 Programmes to address the social impact of COVID-19, accessed 06.08.2021 10 OECD, COVID-19 crisis response in Eastern Partner countries, accessed on 06.08.2021 11 Press-release on the Cabinet meeting on 01.07.2021, accessed on 06.08.2021
3
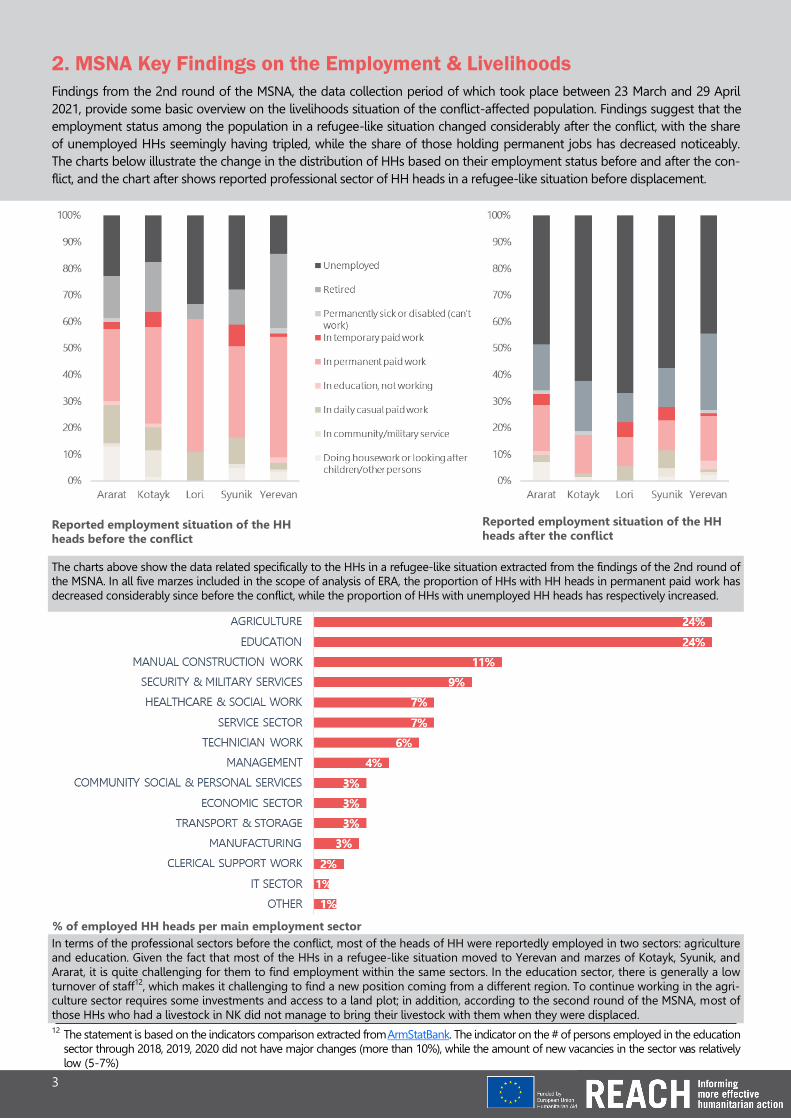
2. MSNA Key Findings on the Employment & Livelihoods
Findings from the 2nd round of the MSNA, the data collection period of which took place between 23 March and 29 April 2021, provide some basic overview on the livelihoods situation of the conflict-affected population. Findings suggest that the employment status among the population in a refugee-like situation changed considerably after the conflict, with the share of unemployed HHs seemingly having tripled, while the share of those holding permanent jobs has decreased noticeably. The charts below illustrate the change in the distribution of HHs based on their employment status before and after the con-flict, and the chart after shows reported professional sector of HH heads in a refugee-like situation before displacement.
The charts above show the data related specifically to the HHs in a refugee-like situation extracted from the findings of the 2nd round of the MSNA. In all five marzes included in the scope of analysis of ERA, the proportion of HHs with HH heads in permanent paid work has decreased considerably since before the conflict, while the proportion of HHs with unemployed HH heads has respectively increased.
Reported employment situation of the HH heads before the conflict
Reported employment situation of the HH heads after the conflict
In terms of the professional sectors before the conflict, most of the heads of HH were reportedly employed in two sectors: agriculture and education. Given the fact that most of the HHs in a refugee-like situation moved to Yerevan and marzes of Kotayk, Syunik, and Ararat, it is quite challenging for them to find employment within the same sectors. In the education sector, there is generally a low turnover of staff12, which makes it challenging to find a new position coming from a different region. To continue working in the agri-culture sector requires some investments and access to a land plot; in addition, according to the second round of the MSNA, most of those HHs who had a livestock in NK did not manage to bring their livestock with them when they were displaced. 12 The statement is based on the indicators comparison extracted from ArmStatBank. The indicator on the # of persons employed in the education sector through 2018, 2019, 2020 did not have major changes (more than 10%), while the amount of new vacancies in the sector was relatively low (5-7%)
% of employed HH heads per main employment sector
4
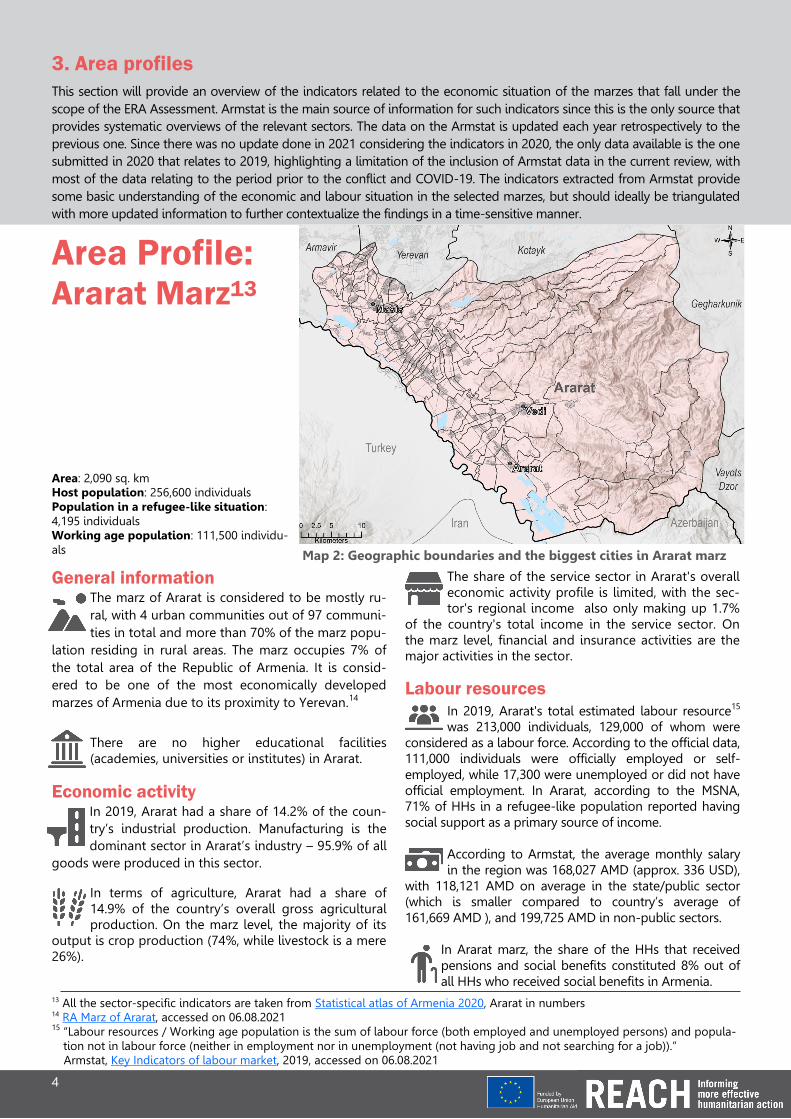
Area Profile: Ararat Marz13
General information The marz of Ararat is considered to be mostly ru-ral, with 4 urban communities out of 97 communi-ties in total and more than 70% of the marz popu-
lation residing in rural areas. The marz occupies 7% of the total area of the Republic of Armenia. It is consid-ered to be one of the most economically developed marzes of Armenia due to its proximity to Yerevan.14
There are no higher educational facilities (academies, universities or institutes) in Ararat.
Economic activity In 2019, Ararat had a share of 14.2% of the coun-try’s industrial production. Manufacturing is the dominant sector in Ararat’s industry – 95.9% of all
goods were produced in this sector.
In terms of agriculture, Ararat had a share of 14.9% of the country’s overall gross agricultural production. On the marz level, the majority of its
output is crop production (74%, while livestock is a mere 26%).
The share of the service sector in Ararat's overall economic activity profile is limited, with the sec-tor's regional income also only making up 1.7%
of the country's total income in the service sector. On the marz level, financial and insurance activities are the major activities in the sector.
Labour resources
In 2019, Ararat's total estimated labour resource15 was 213,000 individuals, 129,000 of whom were
considered as a labour force. According to the official data, 111,000 individuals were officially employed or self-employed, while 17,300 were unemployed or did not have official employment. In Ararat, according to the MSNA, 71% of HHs in a refugee-like population reported having social support as a primary source of income.
According to Armstat, the average monthly salary in the region was 168,027 AMD (approx. 336 USD),
with 118,121 AMD on average in the state/public sector (which is smaller compared to country’s average of 161,669 AMD ), and 199,725 AMD in non-public sectors.
In Ararat marz, the share of the HHs that received pensions and social benefits constituted 8% out of all HHs who received social benefits in Armenia.
Map 2: Geographic boundaries and the biggest cities in Ararat marz
13 All the sector-specific indicators are taken from Statistical atlas of Armenia 2020, Ararat in numbers 14 RA Marz of Ararat, accessed on 06.08.2021 15 “Labour resources / Working age population is the sum of labour force (both employed and unemployed persons) and popula-
tion not in labour force (neither in employment nor in unemployment (not having job and not searching for a job)).” Armstat, Key Indicators of labour market, 2019, accessed on 06.08.2021
3. Area profiles
This section will provide an overview of the indicators related to the economic situation of the marzes that fall under the scope of the ERA Assessment. Armstat is the main source of information for such indicators since this is the only source that provides systematic overviews of the relevant sectors. The data on the Armstat is updated each year retrospectively to the previous one. Since there was no update done in 2021 considering the indicators in 2020, the only data available is the one submitted in 2020 that relates to 2019, highlighting a limitation of the inclusion of Armstat data in the current review, with most of the data relating to the period prior to the conflict and COVID-19. The indicators extracted from Armstat provide some basic understanding of the economic and labour situation in the selected marzes, but should ideally be triangulated with more updated information to further contextualize the findings in a time-sensitive manner.
Area: 2,090 sq. km Host population: 256,600 individuals Population in a refugee-like situation: 4,195 individuals Working age population: 111,500 individu-als
5
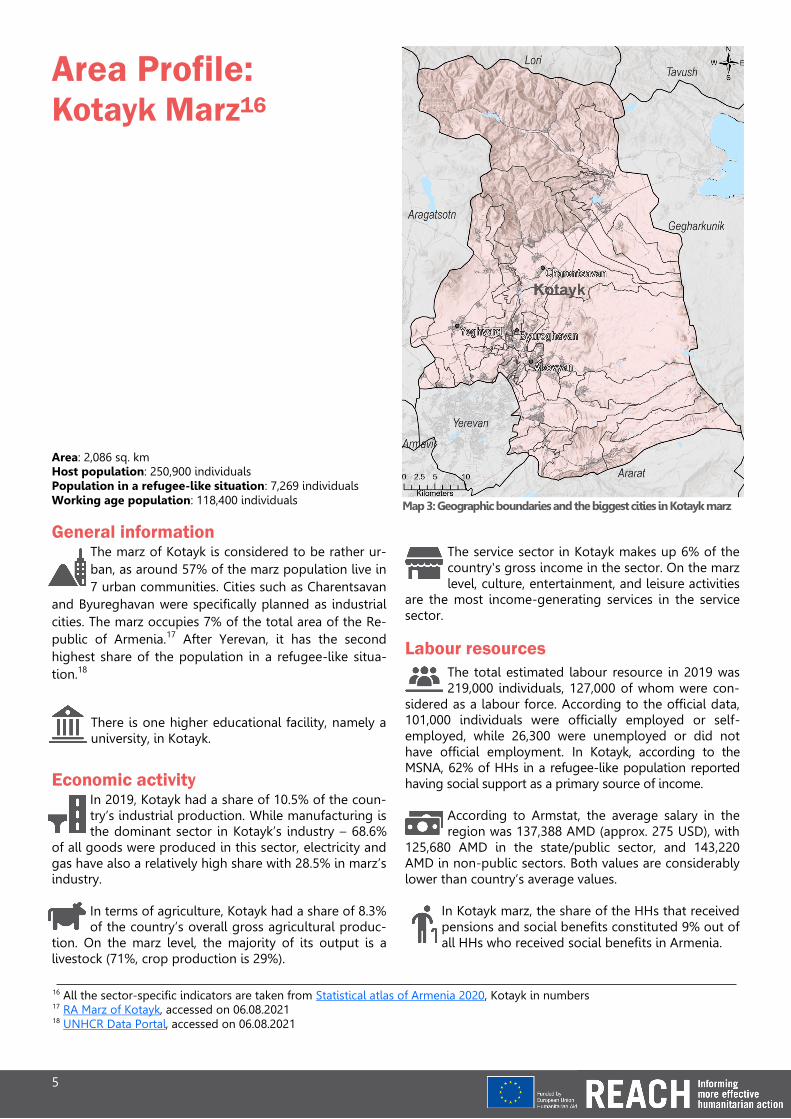
Area Profile: Kotayk Marz16
General information The marz of Kotayk is considered to be rather ur-ban, as around 57% of the marz population live in 7 urban communities. Cities such as Charentsavan
and Byureghavan were specifically planned as industrial cities. The marz occupies 7% of the total area of the Re-public of Armenia.17 After Yerevan, it has the second highest share of the population in a refugee-like situa-tion.18
There is one higher educational facility, namely a university, in Kotayk.
Economic activity In 2019, Kotayk had a share of 10.5% of the coun-try’s industrial production. While manufacturing is the dominant sector in Kotayk’s industry – 68.6%
of all goods were produced in this sector, electricity and gas have also a relatively high share with 28.5% in marz’s industry.
In terms of agriculture, Kotayk had a share of 8.3% of the country’s overall gross agricultural produc-
tion. On the marz level, the majority of its output is a livestock (71%, crop production is 29%).
The service sector in Kotayk makes up 6% of the country's gross income in the sector. On the marz level, culture, entertainment, and leisure activities
are the most income-generating services in the service sector. Labour resources
The total estimated labour resource in 2019 was 219,000 individuals, 127,000 of whom were con-
sidered as a labour force. According to the official data, 101,000 individuals were officially employed or self-employed, while 26,300 were unemployed or did not have official employment. In Kotayk, according to the MSNA, 62% of HHs in a refugee-like population reported having social support as a primary source of income.
According to Armstat, the average salary in the region was 137,388 AMD (approx. 275 USD), with
125,680 AMD in the state/public sector, and 143,220 AMD in non-public sectors. Both values are considerably lower than country’s average values.
In Kotayk marz, the share of the HHs that received pensions and social benefits constituted 9% out of all HHs who received social benefits in Armenia.
Map 3: Geographic boundaries and the biggest cities in Kotayk marz
16 All the sector-specific indicators are taken from Statistical atlas of Armenia 2020, Kotayk in numbers 17 RA Marz of Kotayk, accessed on 06.08.2021 18 UNHCR Data Portal, accessed on 06.08.2021
Area: 2,086 sq. km Host population: 250,900 individuals Population in a refugee-like situation: 7,269 individuals Working age population: 118,400 individuals
6
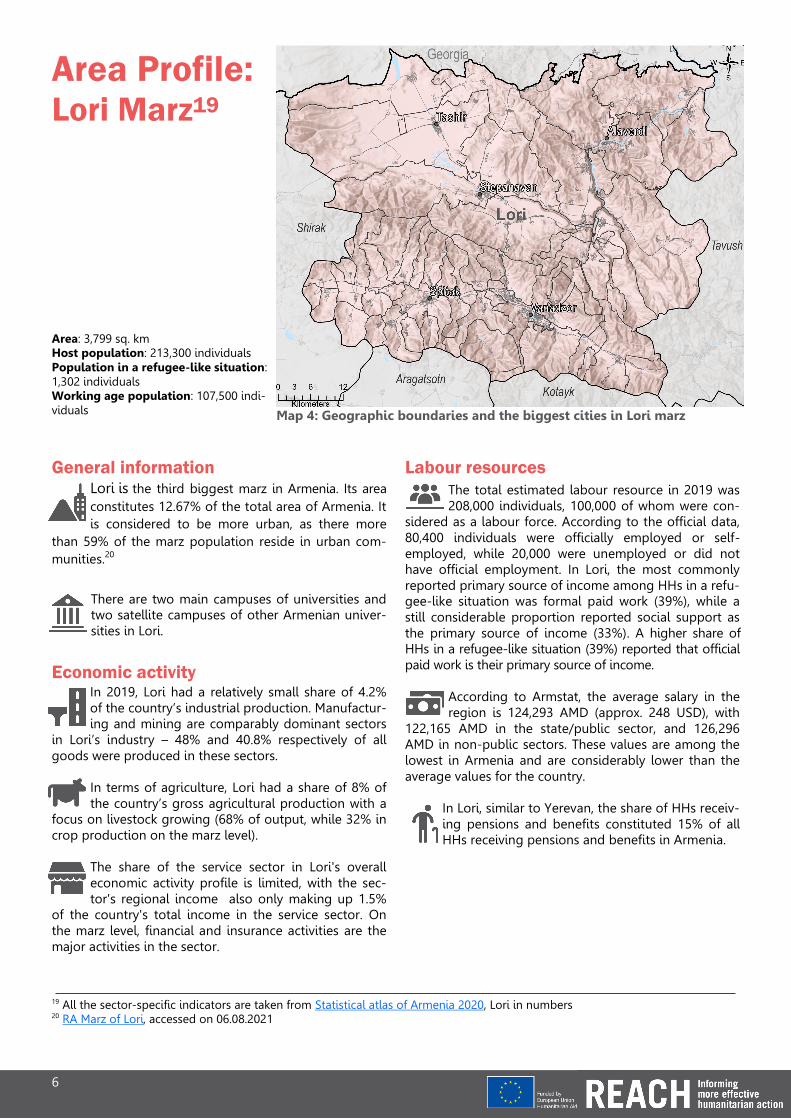
Area Profile: Lori Marz19
General information Lori is the third biggest marz in Armenia. Its area constitutes 12.67% of the total area of Armenia. It is considered to be more urban, as there more
than 59% of the marz population reside in urban com-munities.20
There are two main campuses of universities and two satellite campuses of other Armenian univer-sities in Lori.
Economic activity In 2019, Lori had a relatively small share of 4.2% of the country’s industrial production. Manufactur-ing and mining are comparably dominant sectors
in Lori’s industry – 48% and 40.8% respectively of all goods were produced in these sectors.
In terms of agriculture, Lori had a share of 8% of the country’s gross agricultural production with a
focus on livestock growing (68% of output, while 32% in crop production on the marz level).
The share of the service sector in Lori's overall economic activity profile is limited, with the sec-tor's regional income also only making up 1.5%
of the country's total income in the service sector. On the marz level, financial and insurance activities are the major activities in the sector.
Labour resources
The total estimated labour resource in 2019 was 208,000 individuals, 100,000 of whom were con-
sidered as a labour force. According to the official data, 80,400 individuals were officially employed or self-employed, while 20,000 were unemployed or did not have official employment. In Lori, the most commonly reported primary source of income among HHs in a refu-gee-like situation was formal paid work (39%), while a still considerable proportion reported social support as the primary source of income (33%). A higher share of HHs in a refugee-like situation (39%) reported that official paid work is their primary source of income.
According to Armstat, the average salary in the region is 124,293 AMD (approx. 248 USD), with
122,165 AMD in the state/public sector, and 126,296 AMD in non-public sectors. These values are among the lowest in Armenia and are considerably lower than the average values for the country.
In Lori, similar to Yerevan, the share of HHs receiv-ing pensions and benefits constituted 15% of all HHs receiving pensions and benefits in Armenia.
Map 4: Geographic boundaries and the biggest cities in Lori marz
19 All the sector-specific indicators are taken from Statistical atlas of Armenia 2020, Lori in numbers 20 RA Marz of Lori, accessed on 06.08.2021
Area: 3,799 sq. km Host population: 213,300 individuals Population in a refugee-like situation: 1,302 individuals Working age population: 107,500 indi-viduals
7
Area Profile: Syunik Marz21
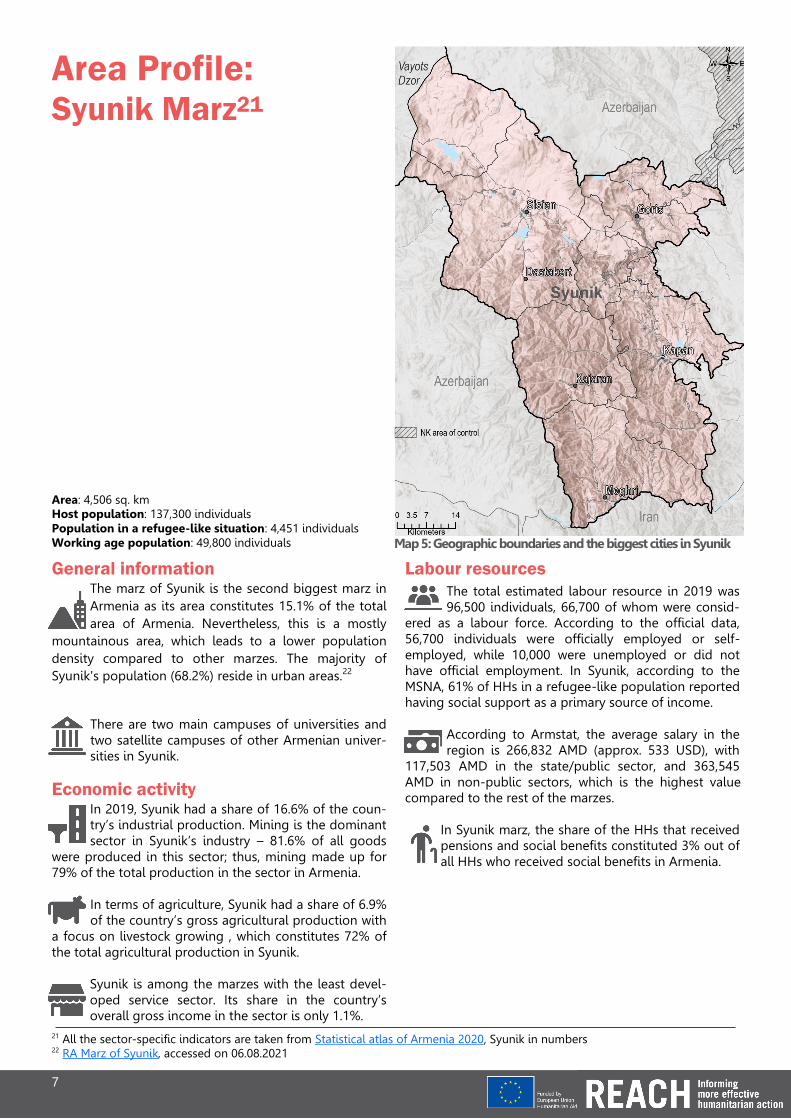
Map 5: Geographic boundaries and the biggest cities in Syunik
21 All the sector-specific indicators are taken from Statistical atlas of Armenia 2020, Syunik in numbers 22 RA Marz of Syunik, accessed on 06.08.2021
General information The marz of Syunik is the second biggest marz in Armenia as its area constitutes 15.1% of the total area of Armenia. Nevertheless, this is a mostly
mountainous area, which leads to a lower population density compared to other marzes. The majority of Syunik's population (68.2%) reside in urban areas.22
There are two main campuses of universities and two satellite campuses of other Armenian univer-sities in Syunik.
Economic activity
In 2019, Syunik had a share of 16.6% of the coun-try’s industrial production. Mining is the dominant sector in Syunik’s industry – 81.6% of all goods
were produced in this sector; thus, mining made up for 79% of the total production in the sector in Armenia.
In terms of agriculture, Syunik had a share of 6.9% of the country’s gross agricultural production with
a focus on livestock growing , which constitutes 72% of the total agricultural production in Syunik.
Syunik is among the marzes with the least devel-oped service sector. Its share in the country’s overall gross income in the sector is only 1.1%.
Labour resources
The total estimated labour resource in 2019 was 96,500 individuals, 66,700 of whom were consid-
ered as a labour force. According to the official data, 56,700 individuals were officially employed or self-employed, while 10,000 were unemployed or did not have official employment. In Syunik, according to the MSNA, 61% of HHs in a refugee-like population reported having social support as a primary source of income.
According to Armstat, the average salary in the region is 266,832 AMD (approx. 533 USD), with
117,503 AMD in the state/public sector, and 363,545 AMD in non-public sectors, which is the highest value compared to the rest of the marzes.
In Syunik marz, the share of the HHs that received pensions and social benefits constituted 3% out of all HHs who received social benefits in Armenia.
Area: 4,506 sq. km Host population: 137,300 individuals Population in a refugee-like situation: 4,451 individuals Working age population: 49,800 individuals
8
Area Profile: Yerevan23
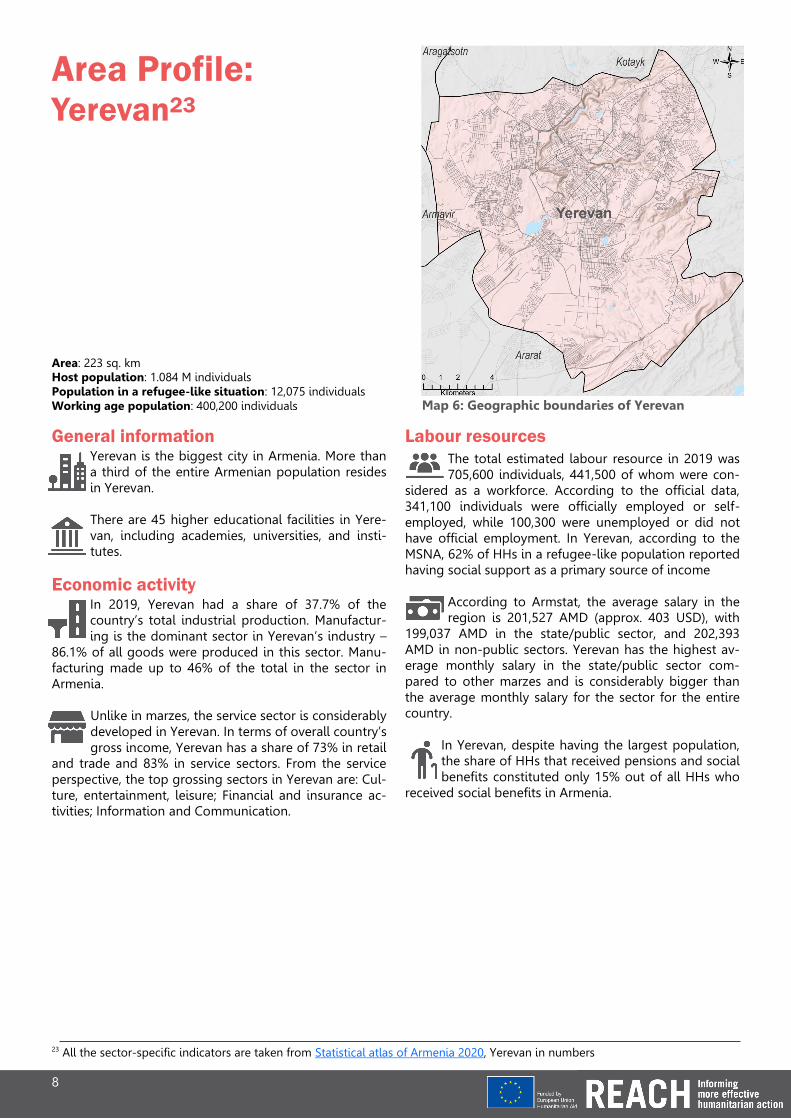
Map 6: Geographic boundaries of Yerevan
23 All the sector-specific indicators are taken from Statistical atlas of Armenia 2020, Yerevan in numbers
General information
Yerevan is the biggest city in Armenia. More than a third of the entire Armenian population resides in Yerevan.
There are 45 higher educational facilities in Yere-van, including academies, universities, and insti-tutes.
Economic activity
In 2019, Yerevan had a share of 37.7% of the country’s total industrial production. Manufactur-ing is the dominant sector in Yerevan’s industry –
86.1% of all goods were produced in this sector. Manu-facturing made up to 46% of the total in the sector in Armenia.
Unlike in marzes, the service sector is considerably developed in Yerevan. In terms of overall country’s gross income, Yerevan has a share of 73% in retail
and trade and 83% in service sectors. From the service perspective, the top grossing sectors in Yerevan are: Cul-ture, entertainment, leisure; Financial and insurance ac-tivities; Information and Communication.
Labour resources
The total estimated labour resource in 2019 was 705,600 individuals, 441,500 of whom were con-
sidered as a workforce. According to the official data, 341,100 individuals were officially employed or self-employed, while 100,300 were unemployed or did not have official employment. In Yerevan, according to the MSNA, 62% of HHs in a refugee-like population reported having social support as a primary source of income
According to Armstat, the average salary in the region is 201,527 AMD (approx. 403 USD), with
199,037 AMD in the state/public sector, and 202,393 AMD in non-public sectors. Yerevan has the highest av-erage monthly salary in the state/public sector com-pared to other marzes and is considerably bigger than the average monthly salary for the sector for the entire country.
In Yerevan, despite having the largest population, the share of HHs that received pensions and social benefits constituted only 15% out of all HHs who
received social benefits in Armenia.
Area: 223 sq. km Host population: 1.084 M individuals Population in a refugee-like situation: 12,075 individuals Working age population: 400,200 individuals