Embed Size (px)
Citation preview

11 Copyright © Canadian Research & Development Center of Sciences and Cultures
ISSN 1925-542X [Print] ISSN 1925-5438 [Online]
www.cscanada.netwww.cscanada.org
Advances in Petroleum Exploration and DevelopmentVol. 6, No. 1, 2013, pp. 11-21DOI:10.3968/j.aped.1925543820130601.1598
Economics Analysis on the Development of Nigerian Offshore Marginal Fields Using Probabilistic Approach
Adamu, M. A.[a]; Ajienka, J. A.[a]; Ikiensikimama, S. S.[a],*
[a] Department of Petroleum and Gas Engineering, University of Port Harcourt.*Corresponding author.
Received 26 July 2013; accepted 3 September 2013
AbstractMarginal Field Development in the prolific Niger Delta environment is of strategic importance to the Federal Government of Nigeria’s drive towards aggressive Reserve and Production Capacity enhancement. The objective of this study is to provide a perspective on portfolio diversification, investment and resource development on offshore marginal field in Nigeria. The economic analysis was carried out deterministically using economic indices like Net Present Value, Internal Rate of Return, Present Value Rate and others. Probabilistic model was also incorporated to assess the impact of the uncertainties in the input parameters using Monte Carlo simulation through the use of Crystal ball software. The key uncertainties were represented and their respective impacts on economic viability defined. The deterministic model results obtained from the studies were very impressive with Net Present Value of $526,749,924.84 at a discount value of 15% and Internal Rate of Return at 60%. Probabilistically, certainty of having a positive net present value (NPV) and good internal rate of return (IRR) values far above the hurdle rate for investment in Nigeria was obtained. The sensitivity analysis outlined oil price and tax rate as key sensitive parameters in maximizing profit. These clearly showed that the development of offshore marginal fields in Niger Delta of Nigeria is economically viable. Key words: Offshore marginal field; Probabilistic approach; Sensitivity analysis; Economic yardstick
Adamu, M. A., Ajienka, J. A., & Ikiensikimama, S. S. (2013). Economics Analysis on the Development of Nigerian Offshore Marginal Fields Using Probabilistic Approach. Advances in Petroleum Exploration and Development, 6(1), 11-21. Available from: URL: http://www.cscanada.net/index.php/aped/article/view/j.aped.1925543820130601.1598 DOI: http://dx.doi.org/10.3968/j.aped.1925543820130601.1598
NOMENCLATUREFPSO = Floating Production Storage and OffloadingSPM = Single Point MooringCAPEX = Capital ExpenditureOPEX = Operating ExpenditureNPV = Net Present ValueDCFROR= Discounted Cash Flow Rate of ReturnPI = Profitability IndexDPIR = Profit-To-Investment RatioIRR = Internal Rate of Return ETF = Educational Tax FundNCF = Net Cash FlowPBP = Payback PeriodPBP = Payback PeriodP10 = Probability at 10%P50 = Probability at 50%P90 = Probability at 90%
INTRODUCTIONMarginal Field Development in the prolific Niger Delta environment is of strategic importance to the Federal Government of Nigeria’s drive towards aggressive reserve and production capacity enhancement. Aside from the anticipated Revenue from an improved production base, the Government is also aiming at building up indigenous participation in the Nigeria Upstream Oil and Gas industry.

12Copyright © Canadian Research & Development Center of Sciences and Cultures
Economics Analysis on the Development of Nigerian Offshore Marginal Fields Using Probabilistic Approach
As at end of 2005, total production contribution of all the indigenous E & P Companies was 100, 000 bbls, 5% of total Daily Country production of 2 million barrels/day[1]. In a sense, it is not only a drive to broaden the revenue base of the country but also, a strategic imperative with the long term goal of establishing linkages to the broader Nigerian Economy and local content development.
Marginal field comprise the small and abandoned fields, which have remained undeveloped by the joint venture operators (multinational oil companies) in Nigeria. Such fields contain reserves that are uneconomic when produced by the multinationals but might be profitable if operated by Nigeria (indigenous ) entrepreneurs due to their low overhead and operating cost. A total number of 116 of such fields have been identified in Nigeria. They contain collective reserves of about 1.3 billion barrels, and another 20 fields contain between 15 million to 20 million barrels each[2].
A number of papers have been published addressing the issue of Marginal field development in Nigeria[3,4,5,6]. Thomas and Hough[7] noted way to cut down costs on marginal field development using the TPG500 drilling/production jack-up platform. They showed that this platform has been designed not only to be re-locatable and reduced costs on marginal fields’ development but also to meet the latest safety regulations and requirement. Grandi et al.[6] discussed an overview of low cost drilling techniques using an innovative drilling rig. They highlighted the significance of well costs in overall Marginal field economics and hence the need to drive down drilling costs.
Chucks outlined a process for the formulation and selection of an operating plan for Ukpokiti field that is particularly useful for Marginal field development. From experience and detailed works of others, operating expenditure potentially has a large impact on Marginal field economics, especially during the late production stage when volumes are down[8]. Using an integrated team approach, a detailed operating cost model was developed through extensive research and discussions. The model developed was used as a front end loading tool, and as a road map to identify the significant cost variables and their ranges, in the process of selecting the most cost effective overall field development strategy.
Aret examined the progress so far in “marginal field development” in Niger Delta. He stated that the fields are “marginal”, however, only to the major companies with their huge overheads and more productive oil fields which command priority attention and investment .To learner, meaner (small, knowledge and technically competent) oil companies, many of these fields would be very profitable and attractive. Elsewhere in the world such companies, therefore, offer to take over such small fields on commercial terms and develop them at their own risk and for their own account[9].
Ayodele and Frimpong the authors called for the setting up of a special contractual agreement between the Federal Government and the oil companies that is exclusive to marginal fields development in the Niger Delta. The proposed (new) sharing agreement is a modification of existing agreements in Nigeria and takes into consideration the peculiar nature of marginal fields. Their main proposal was currently held but have not developed these fields would take equity stakes (in the fields) in lieu of their prior investments and the indigenous producer would supply developed these fields in lieu of their prior investments and the indigenous producer would supply development capital. The results of their economic analysis indicate that seismic survey and signature costs incurred by the Major producer prior to allocation of field to an indigenous producer, as well as oil price had significant impact on the profitability of a Marginal field project[4].
Bergesen stated that the world energy demand is expected to grow and would reach twelve tons of oil equivalents in 2020. Presently, there is an increase demand in the world crude oil consumption arises mainly from countries like China, India, America etc. due to increased in their energy consumption therefore, there is need to improve the economic viability of producing marginal oilfields using innovative technologies and best fields practice in order to meet the increasing world demand for oil/gas. As nuclear programmes are constantly behind schedule or even reconsidered for environmental reasons and other substitutions for oil uses are coming up against growing difficulties. Bergesen (2003) equally highlighted that in 1973, hard-to-substitute oil uses in the world accounted for 47% of oil consumption, in 1990, the share was 60% and it is expected to reach 80% in 2020. In other words, even if legal or environmental restrictions were lifted allowing new energy sources to come onto the market, it would be very difficult to substitute them for oil in a foreseeable future. Based on the considerations mentioned above, the share of hydrocarbons in the world’s energy demand by the year 2020 is estimated to remain practically unchanged in comparison with the present situation. In fact, oil and gas would cover more than a half of the demand. Oil will be chosen for its unsubstitutable feature and gas for its favorable environment qualities[5].
Kue and Orodu explored the economic impacts of innovation approaches to marginal field development in Nigeria. They considered four development options for a marginal field remotely located from any existing infrastructure viz: use of Floating Production Storage (FPSO), converted Jack Up Rig with Subsea Storage, Light Reuseable platform with Floating Storage Systems and a converted Semi Submersible Platform. Using typical Niger Delta Cost data, “look ahead” deterministic economics models were developed to compare the economics of the various development concepts. Their results showed that the converted Jack Up rig with

13 Copyright © Canadian Research & Development Center of Sciences and Cultures
Adamu, M. A.; Ajienka, J. A.; Ikiensikimama, S. S. (2013). Advances in Petroleum Exploration and Development, 6(1), 11-21
Subsea storage was the most economical. An important recommendation for marginal field development should be fit- for- purpose and leasing/strategic alliances should be fully explored to drive costs down and spread risk[3].
Akinpelu and Omole presented a paper on The Economics of Nigeria Marginal Oil Fields to identify high impact variables. They examined the economics of marginal field development using the latest NNPC fiscal/regulatory terms of December, 2000 with a view to identifying the economics. From knowledge of the economics variables and their impact, insights into potentially proactive strategies to improve Marginal field economics are developed[1].
The literature on Nigeria marginal field development will continue to grow as the Niger Delta matures as an oil province, oil continues to be the fuel of choice for rapidly growing economics around the World with the attendant price levels witnessed in the last few years. The paper therefore, addresses the economics of developing Nigerian offshore Marginal Field with the main objective of identifying the most important parameters impacting economics and decision making. Identifying such parameters will inform the Marginal field producer (major or indigenous) on what actions to take to positively impact the potential realizable economic values from these fields. Regulators and Government will also be informed on the potential impact of their stated objective of attracting investments in this segment of the Nigeria oil and Gas industry to be realized.
1. CLASSIFICATION OF OIL AND GAS ACCUMULATIONSCommercial fields: These are fields that take into account the current risks of production operations (geological, technical, political, economical, etc) development would normally result in a profitable operation for the producing company. The probability of reaching a positive Net Present Value (NPV) at the end of the project is near one if not one.
Non commercial fields: These are fields, even when in the lowest risk situation; a profitable operation cannot be expected. The probability of reaching a positive NPV is low, say less than 30%.
Marginal fields: These are fields in the middle zone, with parameters set at their best, development can be profitable, at their worst economically disastrous. The probability of reaching a positive NPV is then somewhere between 30-70%. This is illustrated by Figure 1 Using such a classification clearly indicates the dependence of ‘marginality’ on technical conditions which partly govern the development cost, on economic conditions, which means mainly the oil price and taxation system, and on risks, whether they are time related or not to effectively characterize the reservoirs[10].
Figure 1Fields Classification – Definition of Marginality
2. MODEL BACKBONEThe model for assessing the economic viability of developing offshore marginal fields in Nigeria adopted here was according to[11,12,13,14] for cash flow analysis, Net Present Value, Internal Rate of Return, Payback time, Profitability Index, Present Value Rate, Undiscounted profit to Investment Ratio. This also corresponds to excel inbuilt formulas with corrections made by Charnes[15] for NPV. The algorithms that were adopted in this economic analysis are in line with all Monte Carlo simulation processes. This includes identifying options, building a model, adding Stochastic assumptions, running the Crystal Ball, analyzing forecasts, running sensitivity analysis, running Tornado and Spider plots and finally making Decision[11,12,13,15].
2.1 Economic Yardstick Model Equations2.1.1 Payback PeriodThe Payback Period also referred to as the breakeven point is defined as the expected number of years required for recovering the original investment. Payback period incorporates the idea of recovering one’s investment. In its simplest form, it is the point at which the cumulative NCF is zero that is the time taken, from the start of the project, to reach this position. Mathematically,
Payback Period=Cum.-ve NCF Years+
( ve NCF ( ve NCF)) ( ve NCF)1
#+ - - - - (1)
WhereCum. –ve NCF Years = Last year with negative cash
flow+ve NCF = Positive Net Cash flow-ve NCF = Negative Net Cash flow
2.1.2 Net Present ValueNet Present Value [NPV] is the sum of all project cash flows, discounted back to a common point in time. Mathematically;
NPV =( )iNCF1 d
ti
n
1 +=/ (2)
14Copyright © Canadian Research & Development Center of Sciences and Cultures
Economics Analysis on the Development of Nigerian Offshore Marginal Fields Using Probabilistic Approach
WhereNCF = Net Cash flowid = Discount factort = Time (years)
2.1.3 Internal Rate of ReturnThe Internal Rate of Return [IRR] is the discount rate, which reduces the project NPV to zero. It is, therefore, the solution to the following equation:-
IRR ( )IRR
NCF1
0t
t
i
n
1 +=
=/ (3)
WhereNCFt= Net Cash flow over a period of time at iterative
rate2.1.4 Profitability IndexProfitability Index (PI) is a dimensionless ratio obtained by dividing the present value of future operating cash flows by present value of the investment. Mathematically written as,
PI =(Present Value of Capital Investment)
(Present Value of Future Operating Cash Flow)
(4)2.1.5 Present Value RatePresent Value Rate is the ratio of the NPV to the present value of capital investment.
PVR =PV of Capital Investment
NPV (5)
2.1.6 Profit to Investment RatioThe Profit to Investment Ratio is a measure of investment efficiency, incorporating the idea of optimizing profit earned for every dollar invested. This is likely to be important in a situation, where resources for investment are limited.
Profit to Investment Ratio =Investment
Undiscounted Profit (6)
2.2 Crystal BallCrystal Ball is a software tool that is very important for managing risk in a dynamic business environment. Analyzing risk using crystal ball relies on developing a mathematical model in Excel that represents a situation of interest. The crystal ball uses the point estimates with probability distribution assumptions and forecast distribution of the output using Monte Carlos Simulation. The forecasted output distribution is used to assess the riskiness of the situation or it provides information needed to make more accurate, efficient and confident decisions. Using Crystal Ball/Monte Carlos simulation, we need to determine which element has the most influence on the project’s profitability and which element is more important. Also, the ranges of the minimum and maximum values can be described using Crystal Ball. It is also important to note that Crystal Ball is one of the software packages used to quantity the impact of uncertainty through Monte Carlos Simulation. To use Crystal Ball for this purpose, the following steps are required:
1) Build a discounted cash flow model of the intended project in a spreadsheet.
2) Identify the main uncertainties. 3) Define a realistic statistical distribution for those
uncertainties that represent the full range of uncertainty (positive and negative).
4) Generate the distribution of the profitability criteria. The distribution of the profitability indicators will
show the estimated likelihood that the project will meet the required profitability criteria. Oras[16] outlined the risks and uncertainties in economic evaluations and showed the influence of these uncertainties on the economic indicators.
3. METHODOLOGYA spreadsheet-based deterministic economic model was utilized in the early evaluation stages of this study to appreciate and characterize the opportunities and the impact of uncertainties through single point sensitivity analysis as shown in Table 1. However, a purely deterministic approach is limited in capturing the full impact of the high number of interdependencies of the characteristic variables on the marginal field development. A stochastic approach was incorporated in this analysis. This probabilistic approach has an advantage over deterministic approach that uses a single point solution and would not show how optimistic or pessimistic the results might be as stated by[17,15] . According to William et al.[15] it is imperative for any economic analysis to be able to provide logical and well-thought through answers to the following questions: a) what is the probability of achieving the key profitability metrics? b) What is the probability of breakeven at a given price? c) What is the maximum exposure?
The economic analyses involved cash flow modeling, project profitability and sensitivity analysis. The deterministic and probabilistic approach of economic analysis through Monte Carlo simulation using Crystal Ball to determine the influential factors to the profitability of offshore marginal fields development. The Tornado, Spider and Sensitivity charts analyses of Net Present Value and other economic parameters were used as yardstick to enhance quick and easier decision making. These aid to investigate the effect of changes in economic, technical cost, and production parameters on the net present value and generally accepted economic, finance and technical data about Nigeria operating environment. The base case for this economic analysis considered an offshore field in the Niger Delta. The field is located in approximately 88ft of water, 15 miles offshore in Niger Delta, Nigeria. The field has a reserve of 77.4 MMBbls and production schedules were 10 years.
The input data being the base case for computation of the economic, cost and general data set is shown on Tables 2 and 3.

15 Copyright © Canadian Research & Development Center of Sciences and Cultures
Adamu, M. A.; Ajienka, J. A.; Ikiensikimama, S. S. (2013). Advances in Petroleum Exploration and Development, 6(1), 11-21
Table 1Marginal Field Cash Flow Analysis
Cash Flow Year0 Year1 Year2 Year3 Year10OPEX ($) 38,051,637.228 38,951,709.340 39,774,047.344 47,060,244.610Net Oil Produced (STB) 8,548,560.022 7,964,872.537 7,421,034.803 4,523,322.642Revenue ($) 598,407,023.857 557,549,132.073 519,480,947.615 316,633,029.730Royalty 18.5% 110,705,299.414 103,146,589.433 96,103,975.309 58,577,110.500Depreciation 20% 76,100,000.000 76,100,000.000 76,100,000.000 76,100,000.000Total Cost 114,151,637.228 115,051,709.340 115,874,047.344 47,060,244.610Gross Revenue ($) 487,701,724.444 454,402,542.639 423,376,972.306 258,055,919.230Taxable Income ($) 373,550,087.216 339,350,833.299 307,502,924.962 210,995,674.620Tax 65.75% 186,775,043.608 169,675,416.650 153,751,462.481 105,497,837.310Net Revenue /yr (380,500,000.000) 262,875,043.608 245,775,416.650 229,851,462.481 105,497,837.310Cumulative Net Cash Flow (380,500,000.000) (117,624,956.392) 128,150,460.258 358,001,922.739 1,409,670,100.257
Table 2The Input Data Set
Production Parameters Base Case Tax InputNo. of Producing Days 365 Reserve Capacity (MMbbl) 77.4 Tax Rate (%) 50No. of Producing Wells 5 Minimum rate of Return (%) 15 Royalty (%) 18.2Field Production rate (bbl/d) 5000 Exponential Field Decline Rate (%/Yr) 7 Depreciation (%) 20Production Year 10 Initial Field BS & W (%) 3 Depreciation last 5 BS & W Incremental Rate (%/Yr) 7 ETF Rate (%) 25 Inflation Rate (%) 7 NDDC Rate 3%
Table 3Monte Carlo Input Data
Items NumberOil Price ($) 70.0Tax Rate (%) 50.0Capex ($) 380, 500, 000 .00Gas Price ($/MSCF) 3.0Royalty Rate (%) 18.5Operating Cost ($) 47, 060, 244.61
3.1 Probabilistic AssumptionsThe probability distribution chosen reflects the fitted distribution for the historical realization of the variable. Triangular distribution was used for most of the variables because it best estimates the distribution using the maximum and minimum plus most likely values. To implement this aspect of generating the probabilistic data, Crystal Ball 11.1.1 software was used for the analysis. The software is an add-in to excel. It performs an iterative recalculation of values of the economic measures of the cash flow model already developed in spreadsheet when there are changes in any or all of the parameters that drives the cash flow model[15]. This software uses a Monte Carlo simulation procedure to generate for each trial values of the key parameters such as oil Price, Capex, Opex, Gas price and royalty rate corresponding to the economic measures ( NPV, IRR, Proftability Index, Payback time, profit to Investment Ratio) as indicated by[11,12,13,15].For this study sampled 10,000 trials for each of the six models was used. The distribution of the profitability indicators will show the estimated likelihood that the project will meet the required profitability criteria.
4. RESULTS AND DISCUSSIONThe sensitivity analysis, Tornado and Spider charts of this study with respect to the Net Present Value (NPV) and the Internal Rate of Return (IRR) as yardsticks will be shown to enhance quicker and easier decision making. Probabilistic plots of acceptable ranges will be displayed to drive home the economic analysis of the project.
The cash flow spreadsheet (Table 1) model result for Nigerian marginal oil field economics analysis is as presented in Table 4 shows the deterministic output forecast computation of the economic measures. The cash flow model result showed some impressive outcomes about the profitability of developing offshore marginal field projects in Nigeria based on deterministic model. It returned a positive and large NPV after tax of $538, 956, 628 .87 at a discount value of 15%. A discount rate of 15% was used in this study because by the World Bank standard it stands to be the hurdle rate for oil and gas investments in Nigeria [14] .The decision rule is to accept all projects with positive NPV values. The discount factor is assumed to take care of inflation and some uncertainty in the time value of money. The undiscounted cumulative profit to investment ratio deterministically is obtained as 3.76. This implies that the profit is 3.76 times as big as the initial investment. It is a good ratio for an investment without considering time value of money. The Present Value Rate tries to evaluate the effects of inflation rate and other uncertainty in the investment. It also helps to portray or quantify the size of the investment. Its decision rule is to accept investment with positive PVR. As shown in Table 4, the value of PVR is 1.42 at a discount factor of 15%. In addition, an Internal Rate of Return of 61%

16Copyright © Canadian Research & Development Center of Sciences and Cultures
Economics Analysis on the Development of Nigerian Offshore Marginal Fields Using Probabilistic Approach
was obtained which is quite impressive as it is above the standard hurdle rate for investors in Nigeria [18, 14] .Internal Rate of Return takes care of factor such as high volatility of currency and exchange rate. This implies that inflation rate will hardly affect the profitability of the venture. The Net Present Value probability distribution as shown in Figure 2 gave the entire possible range of forecast for NPV taking cognizance of uncertainty in our input probability distribution.
Table 4Deterministic Output Forecast
Items NumberNet Present Value 538, 956, 628.87Internal Rate of Return 61%Profit to Investment Ratio 3.76Payment Back 1.42yearsProfitability Index 2.42
Table 5Comparison of Deterministic and Probabilistic Output Forecast
Deterministic P10 P50 P90NPV 538,956,628.87 429,319, 734.21 526,749,924.84 626,666,846.68IRR 61% 42 60 68Profit to Investment Ratio 3.76341 3.33056 3.77033 4.26019Present Value Rate 1.42 1.11 1.38 1.68Payment Back (years) 1.46 1.28 1.42 1.57Profitability Index 2.42 2.11 2.38 2.68
Table 5 shows the comparison for best economic output base on the deterministic and probabilistic approach. The NPV probabilistic distribution (Figure 2) shows the certainty of having NPV between the breakeven points (NPV of zero) to the maximum value of NPV $626,666,846.68 to be 90%. This shows a high confidence region in spite of uncertainties in the
exploration of marginal field. The probabilistic analysis gives NPV values at P10, P50 and P90 of $429,319,734.21, $526,749,924.84 and $626,666,846.68 respectively. These NPV values are impressive for a decision maker. Although, it is wiser to invest in a venture at P50 but it can be seen that the venture is also profitable at both P10 and P90 NPV values.
Figure 2Probability Distribution for NPV
The distribution for the Internal Rate of Return (Figure 3) shows 50% certainty of having an Internal Rate of Return (IRR) above 15% hurdle rate for investments
in Nigeria adopting World Bank guideline. This gave a possibility of having Internal Rate of Return up to 60% from this project.

17 Copyright © Canadian Research & Development Center of Sciences and Cultures
Adamu, M. A.; Ajienka, J. A.; Ikiensikimama, S. S. (2013). Advances in Petroleum Exploration and Development, 6(1), 11-21
Figure 3Probability Distribution for IRR
The Payback period distribution (see Figure 4) shows an early recovery of initial investment. This gave 50% certainty of recovering the initial investment at 1.42 years.
Since Capital is a scarce resource, short Payback period is more desirable as it will help the investor recover the Capital quickly.
Figure 4Probability Distribution for Pay back
Profitability index of above 1 is desired. The certainty of having Profitability Index of above 1 is as shown in Figure 5). In the case of PVR, above zero
is desirable. The PVR and Profit to Investment ratio probability distribution results gave a desired result of this project (Figures 6 and 7).
Figure 5Probability Distribution for Profitability Index

18Copyright © Canadian Research & Development Center of Sciences and Cultures
Economics Analysis on the Development of Nigerian Offshore Marginal Fields Using Probabilistic Approach
Figure 6Probability Distribution for PVR
Figure 7Probability Distribution for Profit Invesment Ratio
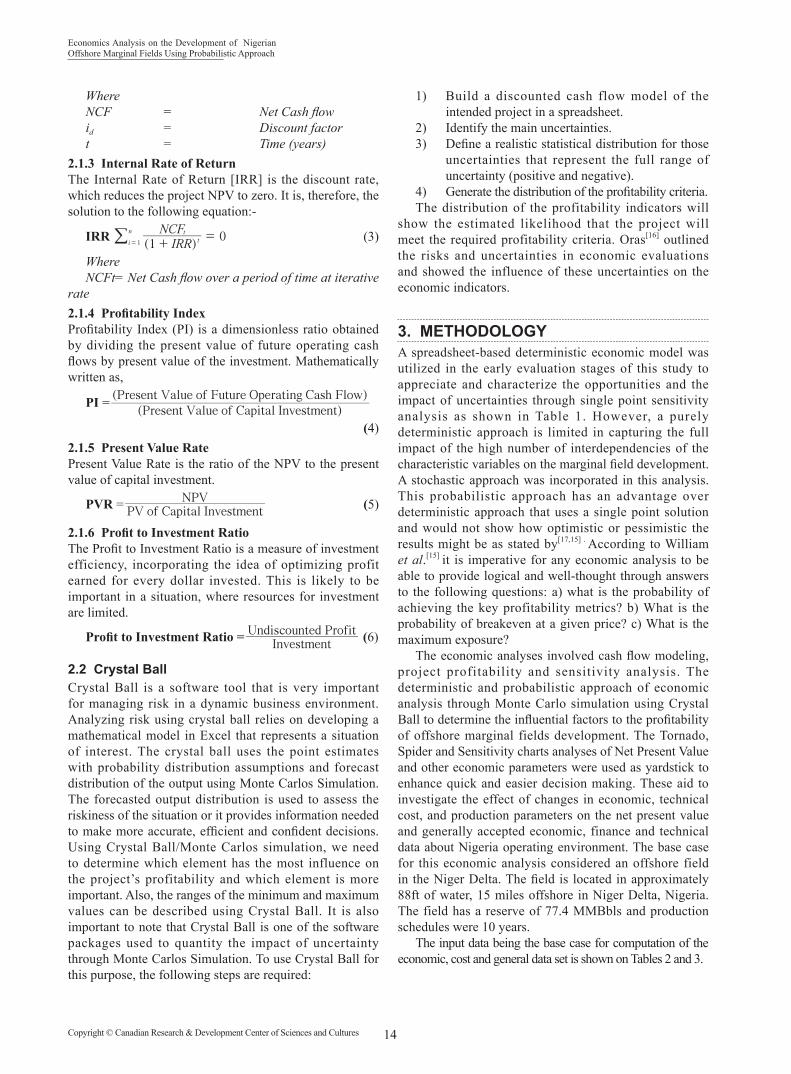
Figures 8 to 10 show the sensitivity analysis on NPV, IRR and Payback Period respectively. It shows the various effects of changes in the value of oil price, tax Rate, Capex, Gas Price and Operating Cost. It was equally observed that the sensitivity analysis of Profitability Index, profit to Investment Ratio and Present Value Rate followed the same trend (figures not included) with IRR. This would aid decision making as the oil price
and tax rate were discovered to be the most sensitive parameters whose slight changes will affect the profit earning of any investor. For instance as shown on Figures 8 to 10, the oil price will affect the IRR by 53.0%, NPV by 61.9% and Payback period by 40.3%. It is also clear from these figures that, increase in the value of oil price reduces the Payback period while it increases the value of NPV and IRR.
Figure 8IRR Sensitivity Chart
19 Copyright © Canadian Research & Development Center of Sciences and Cultures
Adamu, M. A.; Ajienka, J. A.; Ikiensikimama, S. S. (2013). Advances in Petroleum Exploration and Development, 6(1), 11-21
Figure 9NPV Sensitivity Chart
Figure 10Payback Period Sensitivity Chart
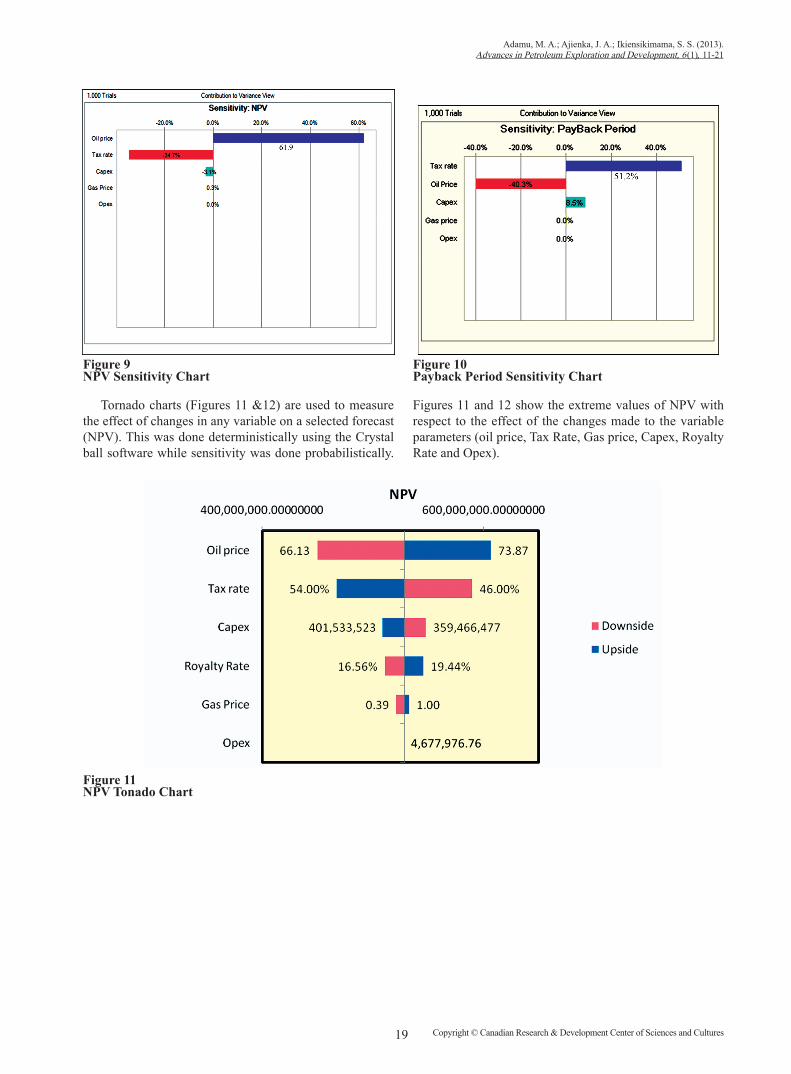
Tornado charts (Figures 11 &12) are used to measure the effect of changes in any variable on a selected forecast (NPV). This was done deterministically using the Crystal ball software while sensitivity was done probabilistically.
Figures 11 and 12 show the extreme values of NPV with respect to the effect of the changes made to the variable parameters (oil price, Tax Rate, Gas price, Capex, Royalty Rate and Opex).
Figure 11NPV Tonado Chart

20Copyright © Canadian Research & Development Center of Sciences and Cultures
Economics Analysis on the Development of Nigerian Offshore Marginal Fields Using Probabilistic Approach
Figure 12IRR Tonado Chart
The spider charts (Figures 13 &14) tries to depict the effect of the parameters with the steepness of the slope. The
spider charts show that Oil price and tax rate are the most sensitive. This is also confirmed by the Tornado charts.
Figure 13NPV Spider Diagram
Figure 14 IRR Spider Diagram

21 Copyright © Canadian Research & Development Center of Sciences and Cultures
Adamu, M. A.; Ajienka, J. A.; Ikiensikimama, S. S. (2013). Advances in Petroleum Exploration and Development, 6(1), 11-21
CONCLUSIONSThe results obtained from the deterministic model of this study were very impressive with NPV of $526, 749, 924.84 and IRR of 60%. Probabilistically, the certainty of having a positive net present value (NPV) and good IRR value were obtained and these clearly shows the profitability of developing offshore marginal fields in Nigeria.
The sensitivity analysis outlined oil price and tax rate as key sensitive parameters in maximizing profit. Therefore, the probabilistic approach helped to forecast the effects of the uncertainty associated with the variable parameters and gave ranges of all the possible profit/loss that would be encountered. With the help of the range of the economic indices shown in the results and discussion section, it is clear that development of Nigerian offshore marginal fields is economically viable.
REFERENCES[1] Akinpelu, L.O., & Omole, O.A. (2009). Economics of
Nigerian Marginal Oil Fields Identifying High Impact Variables. SPE International Technical Conference and Exhibition, Abuja, Nigeria, 3-5, August.
[2] Dixon, M. (2001). Nigeria Indigenous Licensing Rounds Begin (pp. 22). Houston: Hart’s E & P.
[3] Kue, Y. N., & Orodu, D. O. (2006). Economics of Innovative Approaches to Marginal Field Development. SPE paper 106001 Presented at the 30th Annual SPE International Technical Conference and Exhibition, Abuja, Nigeria.
[4] Ayodele, O. R., Frimpong, S. (2003). Economics of Nigeria Marginal Oil Fields. SPE Paper 81998 Presented at the SPE Hydrocarbon Economics & Evaluation Symposium, 5th - 8th of April, Dallas, Texas.
[5] Bergeson, A. (2003). Improve Economic Viability of Marginal Oilfields Using Innovative Technology and Best Field Practices. Third International Oil and Gas Summit, 12-14, November, NICON Hilton, Abuja.
[6] Grandi, M., Calderoni, A., Schenato, A., & Cicognani, C. (1996). Marginal Field Development Using an Innovative Drilling Rig. SPE/IADC Drilling Conference, 28 February-2 March 1995, Amsterdam, Netherlands.
[7] Thomas, P. A., & Hough, C. (1992). The TPG5000: A Way to Cut Down the Costs on Marginal Fields Development. European Petroleum Conference, 16-18, November, Cannes, France.
[8] Chuck, S. (2000). Offshore Operating Costs for Marginal Fields. Nigeria Annual Technical Conference and Exhibition, 7-9 August, Abuja, Nigeria.
[9] Aret, A. G. (2001). Marginal Field Developments. SPE Nigeria Council Sponsored Workshop NICON Hilton Hotel, Abuja, Nigeria, 16 March.
[10] Helge, H. H. (1993). EOR, IOR, Ouu, Atioraie and All That ….; A Pragmatic Approach. Seventh European Symposium on Oil Recovery, October 27-29.
[11] Ikoku C. U. (1984). Economic Analysis and Investment Decisions. USA: John Wiley & Sons Inc.
[12] Mian M. A. (2002). Project Economics and Decision Analysis, Vol. 2: Probabilistic Models. Oklahoma, USA: PennWell Corporation Tulsa.
[13] Mamora D. D. (2005). Fundamentals of Oil and Gas Economic Evaluations and Risk Management. Texas, USA: Texas A&M University College Station.
[14] World Bank (2004). Taxation and State Participation in Nigeria’s Oil and Gas. Retried October 2008 from www.esmap.org/filez/pubs/05704Nigeria. Taxation McPherson.pdf
[15] Charnes, J. M. (2007). Financial Modeling with Crystal Ball and Excel. New Jersey, USA: John Wiley & Sons, Inc.
[16] Oras, I. (2005). Uncertainty Analysis in Economic Evaluation. Amsterdam, Netherlands: Free University, Faculty of Science.
[17] Gray, W. M., Chiappe, A., & Koosh, V. H. (2007). A Probabilistic Approach to Shale Gas Economics. Texas, USA: SPE Hydrocarbon Economics and Evaluation Symposium.
[18] Adenikinju, A., & Oderinde, L. O. (2009). Economics of Offshore Oil Investment Projects and Production Sharing Contracts: A Meta Modelling Analysis. Nigeria: University of Ibadan.