Embed Size (px)
Citation preview
Economics II – Macroeconomics
Introduction to Course & Lecture One
E-mail: [email protected]
Class Blog: http://economics-donnelly.blogspot.com/
TR – 3:30 p.m. – 4:45 p.m. Olsen 104
TR - 5:00 – 6:15 p.m.Olsen 104
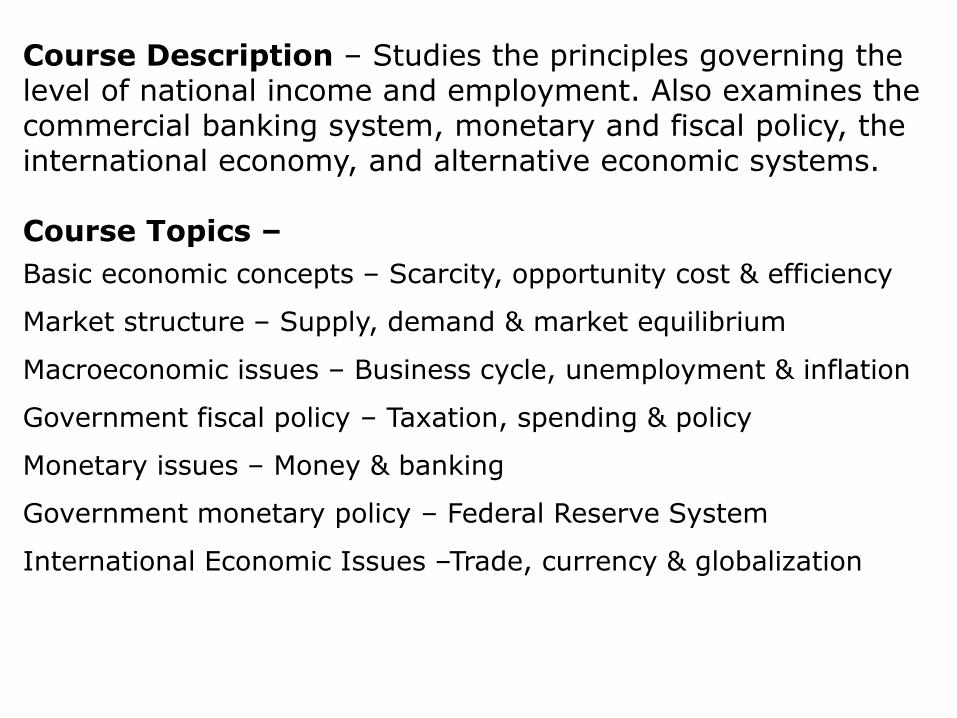
Course Description – Studies the principles governing the level of national income and employment. Also examines the commercial banking system, monetary and fiscal policy, the international economy, and alternative economic systems.
Course Topics –
Basic economic concepts – Scarcity, opportunity cost & efficiency
Market structure – Supply, demand & market equilibrium
Macroeconomic issues – Business cycle, unemployment & inflation
Government fiscal policy – Taxation, spending & policy
Monetary issues – Money & banking
Government monetary policy – Federal Reserve System
International Economic Issues –Trade, currency & globalization
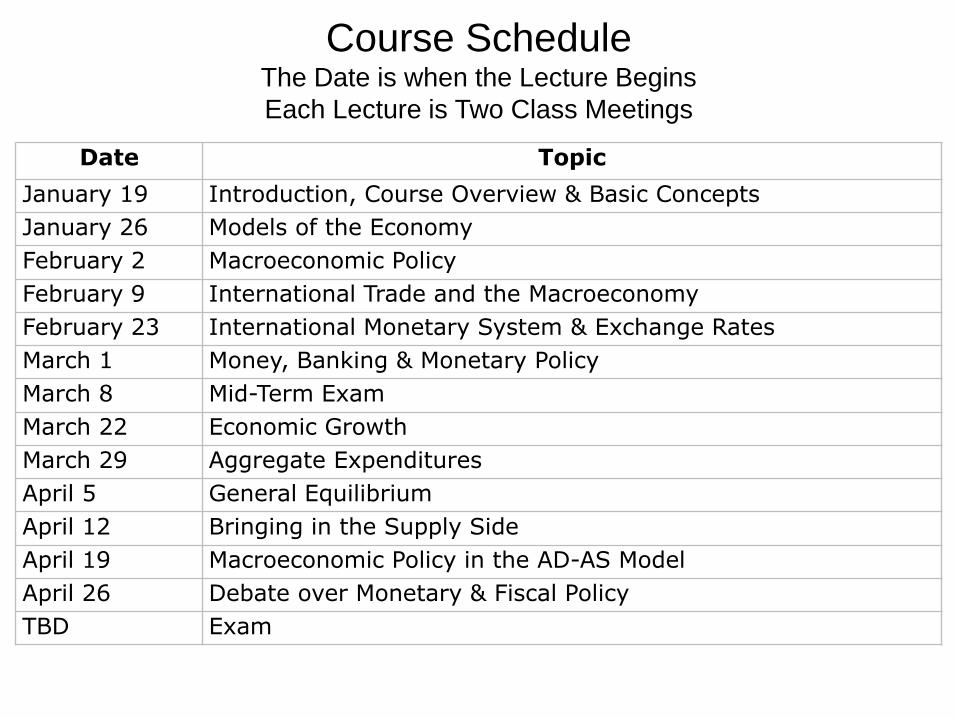
Course ScheduleThe Date is when the Lecture Begins
Each Lecture is Two Class Meetings
Date Topic
January 19 Introduction, Course Overview & Basic Concepts
January 26 Models of the Economy
February 2 Macroeconomic Policy
February 9 International Trade and the Macroeconomy
February 23 International Monetary System & Exchange Rates
March 1 Money, Banking & Monetary Policy
March 8 Mid-Term Exam
March 22 Economic Growth
March 29 Aggregate Expenditures
April 5 General Equilibrium
April 12 Bringing in the Supply Side
April 19 Macroeconomic Policy in the AD-AS Model
April 26 Debate over Monetary & Fiscal Policy
TBD Exam
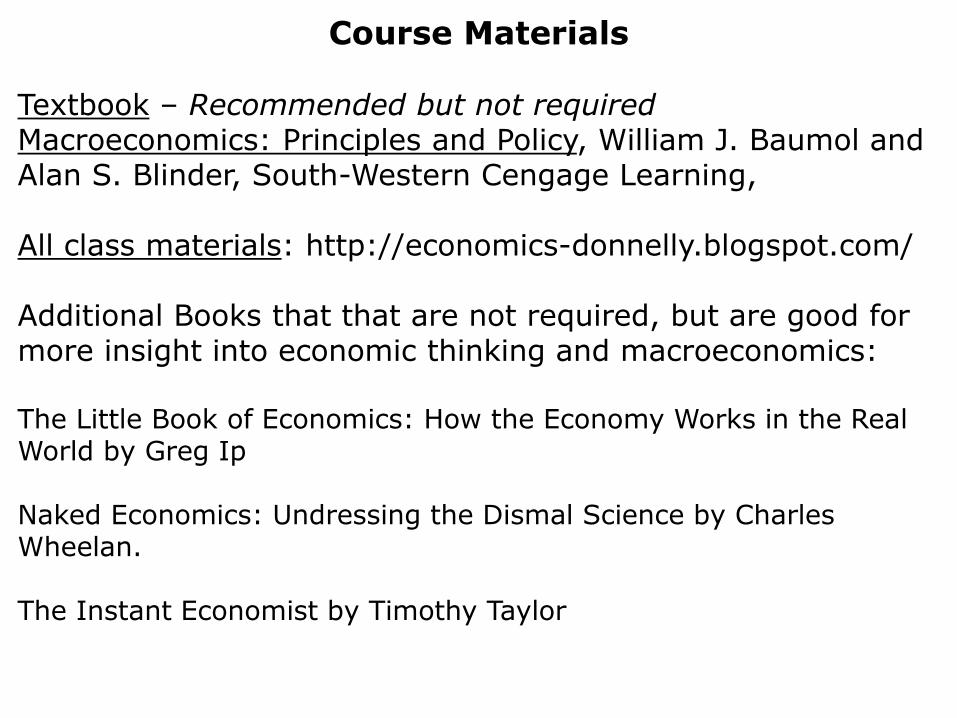
Course Materials
Textbook – Recommended but not requiredMacroeconomics: Principles and Policy, William J. Baumol and Alan S. Blinder, South-Western Cengage Learning,
All class materials: http://economics-donnelly.blogspot.com/
Additional Books that that are not required, but are good for more insight into economic thinking and macroeconomics:
The Little Book of Economics: How the Economy Works in the Real World by Greg Ip
Naked Economics: Undressing the Dismal Science by Charles Wheelan.
The Instant Economist by Timothy Taylor
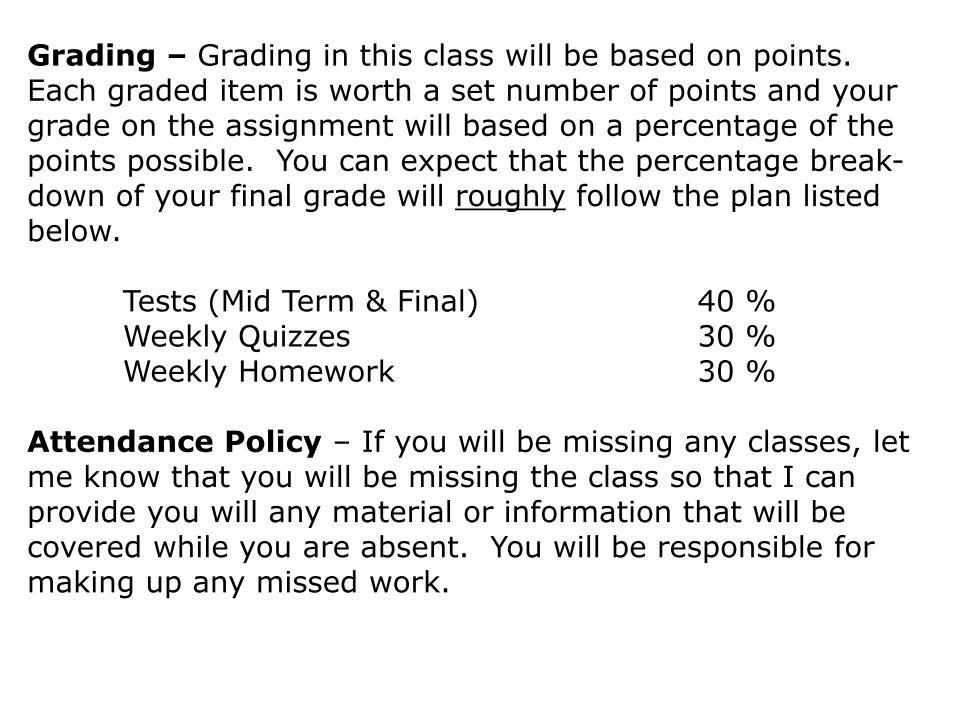
Grading – Grading in this class will be based on points. Each graded item is worth a set number of points and your grade on the assignment will based on a percentage of the points possible. You can expect that the percentage break-down of your final grade will roughly follow the plan listed below.
Tests (Mid Term & Final) 40 %Weekly Quizzes 30 %Weekly Homework 30 %
Attendance Policy – If you will be missing any classes, let me know that you will be missing the class so that I can provide you will any material or information that will be covered while you are absent. You will be responsible for making up any missed work.
Lecture 1 - Macroeconomics – Goals
•By the end of this lecture, you should…
•Know the current state of the United State’s economy
•Know what the major economic statistics are and what they can show about the economy
•Know the economic concepts from Economics I that will be used throughout Economics II
Lecture 1 - Macroeconomics - Overview
Macroeconomics is the study of how the economy as a whole should function. In contrast to microeconomics, focused on individuals and companies, macroeconomics focuses on the large economic issues that face society.
Macroeconomics is more than just a study of large-scale economic systems – the aggregate economy.
Macroeconomics at its core is debate about modern philosophy – it asks the age-old questions about how society should operate: •Why is something done? •Who must bear the costs? •Who receives the benefits? •What are the short-run and long-run effects?
Areas of Study
Macroeconomics covers more participants than studied in microeconomics. While it examines people and companies, it considers them as groups, not individuals.
The focus of macroeconomics is government policy – the legal system, fiscal policy (taxing and spending) and monetary policy (money and banking) – and how these things affect companies and individuals.
In addition macroeconomics includes international economics. The force of globalization have turned issues of national economies into international issues – governments not only think about exchange rates and trade in terms of globalization, but also levels of taxation, spending and banking systems.
Macroeconomic Issues
Macroeconomics is primarily focused on three issues:
•Economic Growth – both creating opportunities for and sustaining the growth of economies. The goal of economic growth is not just to create more stuff, but to improve peoples’ standard of living.
•Unemployment – reducing the economic and social impact of “involuntary” unemployment. Economist view involuntary unemployment as a waste of resources – it is time that wasted.
•Inflation – control the rate at which money loses its value in terms of its purchasing power. Inflation robs people of the value of their money and investments.
Economic Outlook – Slow Growth & Uncertainty
The current economic situation: The economy is currently growing → 2.0%The economy has a good unemployment rate → 5.0%The economy has a low rate of inflation → 0.5%
In a general sense the economy is going at a good pace (much better than the past few years) and hopefully it will continue grow strongly – however, it is still catching up from the losses due to the bad recession.
The real value in the statistics comes from putting them into context – this involves looking at these statistics in relation to recent history and connecting the statistics to each other.
These statistics are important and the class will be tracking them over the semester.
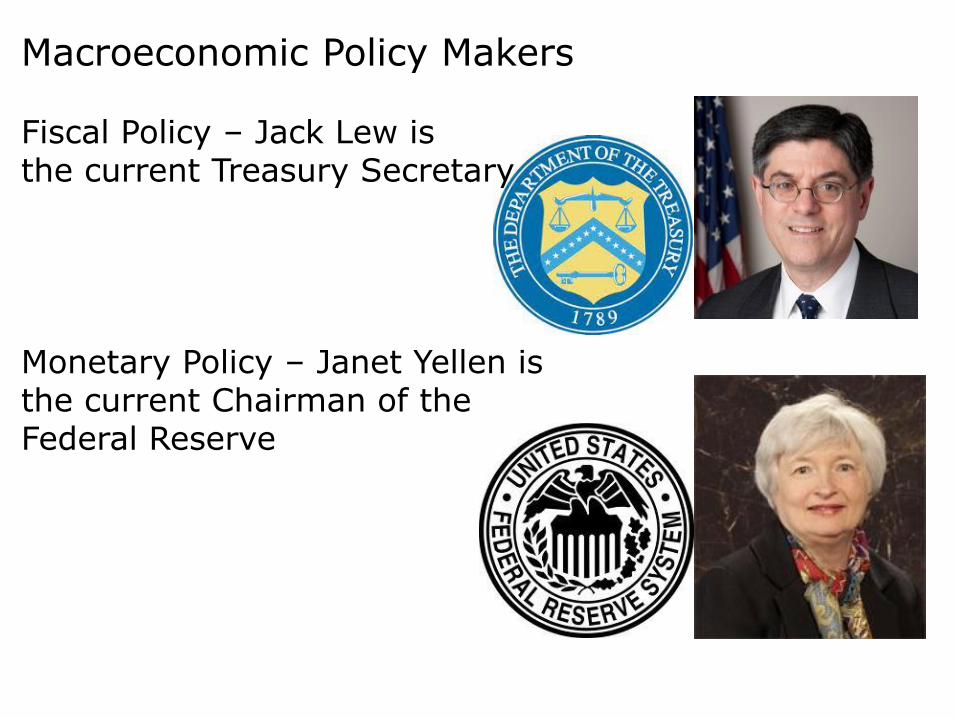
Macroeconomic Policy Makers
Fiscal Policy – Jack Lew is the current Treasury Secretary
Monetary Policy – Janet Yellen is the current Chairman of the Federal Reserve
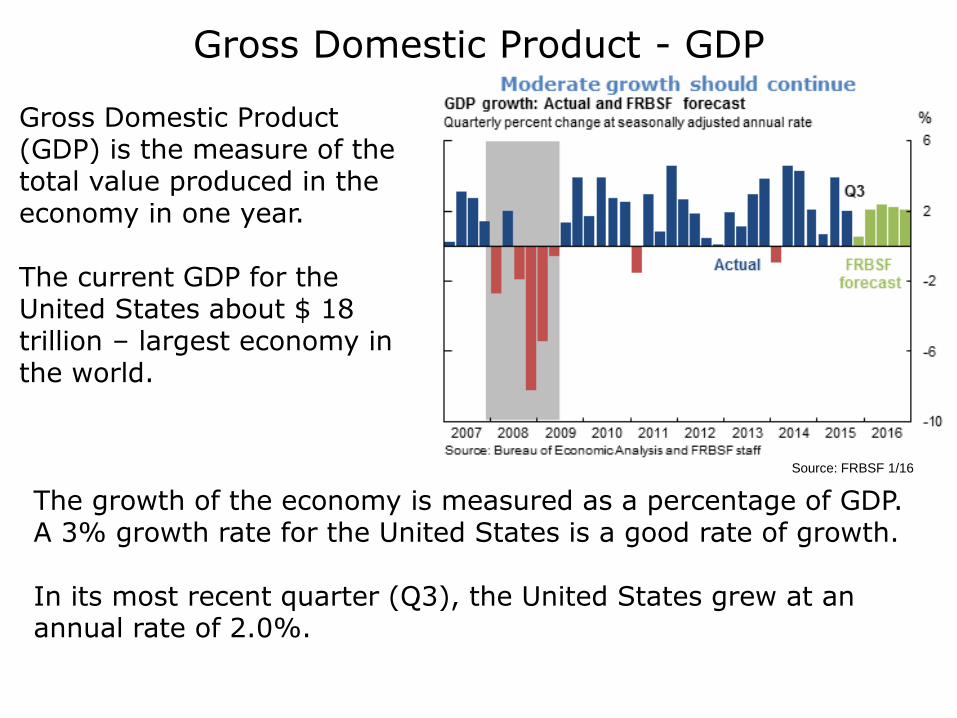
Gross Domestic Product (GDP) is the measure of the total value produced in the economy in one year.
The current GDP for the United States about $ 18 trillion – largest economy in the world.
Gross Domestic Product - GDP
The growth of the economy is measured as a percentage of GDP. A 3% growth rate for the United States is a good rate of growth.
In its most recent quarter (Q3), the United States grew at an annual rate of 2.0%.
Source: FRBSF 1/16
Measuring GDP
The Gross Domestic Product (GDP) is defined as the total market value of the final goods and services produced within the borders of a nation. This number is generally used as a measure of the total size of an economy. The Gross National Product (GNP) measures the total output of the citizens of a country – this measure is less used now because of issues of globalization.
Economists generally focus on GDP because it represents economic activity in a region, rather than a group of citizens who might be working in several regions.
GDP is measured in both nominal and real, adjusted for inflation amounts. Typically, economists pay more attention to the Real GDP since it more accurately shows changes in output – since it factors out inflation.
Calculating GDP
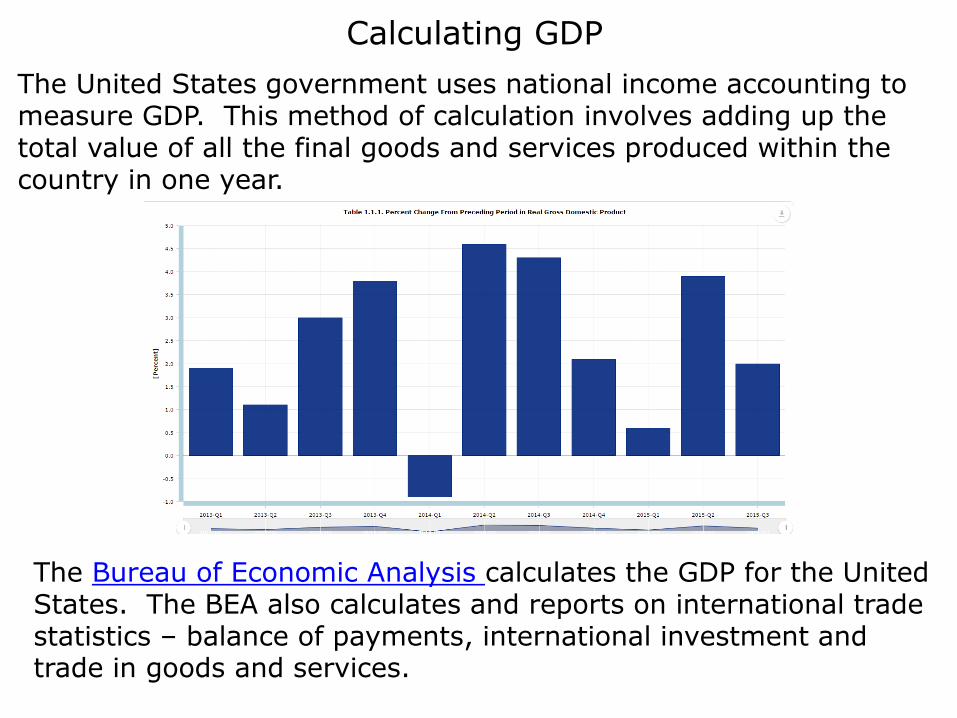
The United States government uses national income accounting to measure GDP. This method of calculation involves adding up the total value of all the final goods and services produced within the country in one year.
The Bureau of Economic Analysis calculates the GDP for the United States. The BEA also calculates and reports on international trade statistics – balance of payments, international investment and trade in goods and services.
Problems with GDP Accounting
GDP accounting provides a rough measure of the economy because it is incomplete as it does not account for many economic activities that improve national welfare and does not account for events that destroy economic welfare. GDP does not account for:
•Improved product quality.
•Non-Market transactions – work not paid for or part of the “underground” economy.
•The value of leisure – GDP values time working over time not working – even though not working may be more valuable to national welfare.
•Environmental damage – GDP does not account for loss of environmental resources.
•Government spending is accounted at cost, not value created.
GDP Through the Recession and into the Recovery
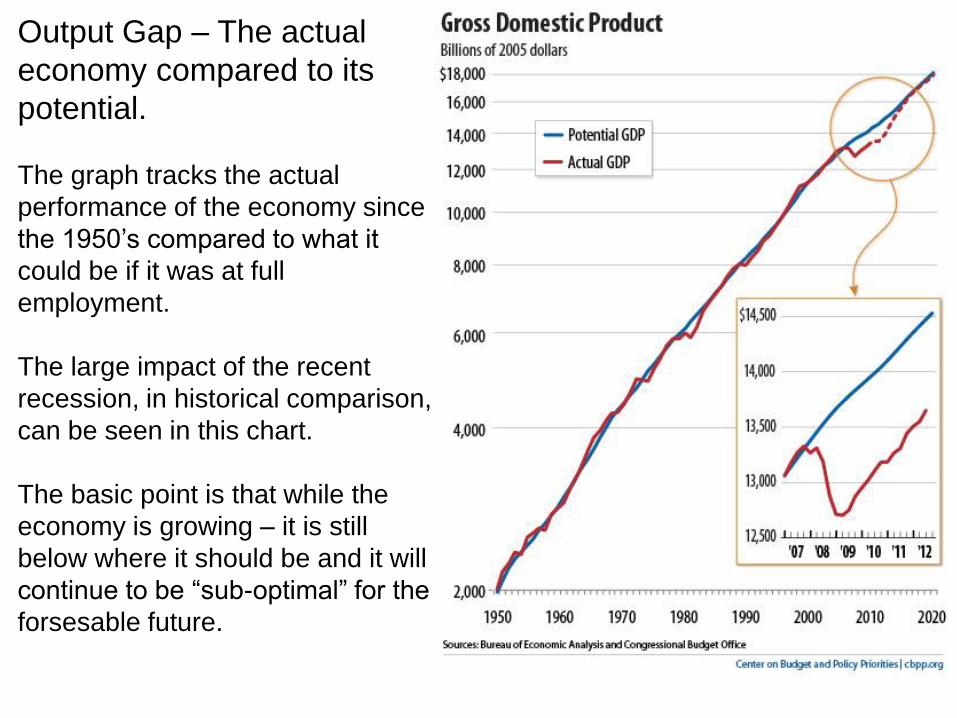
Output Gap – The actual
economy compared to its
potential.
The graph tracks the actual
performance of the economy since
the 1950’s compared to what it
could be if it was at full
employment.
The large impact of the recent
recession, in historical comparison,
can be seen in this chart.
The basic point is that while the
economy is growing – it is still
below where it should be and it will
continue to be “sub-optimal” for the
forsesable future.
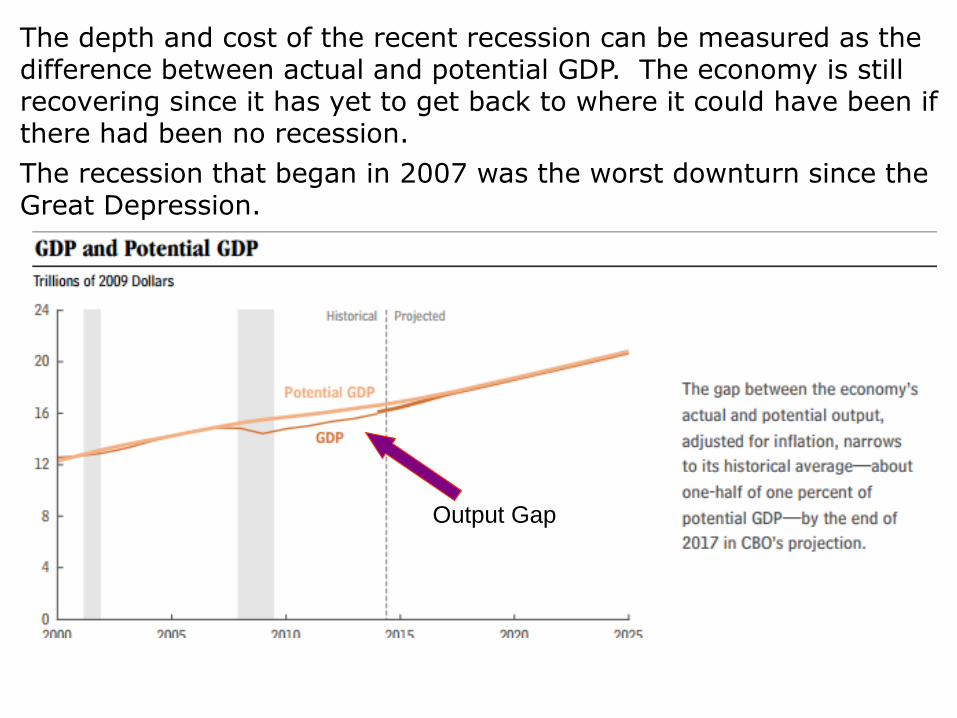
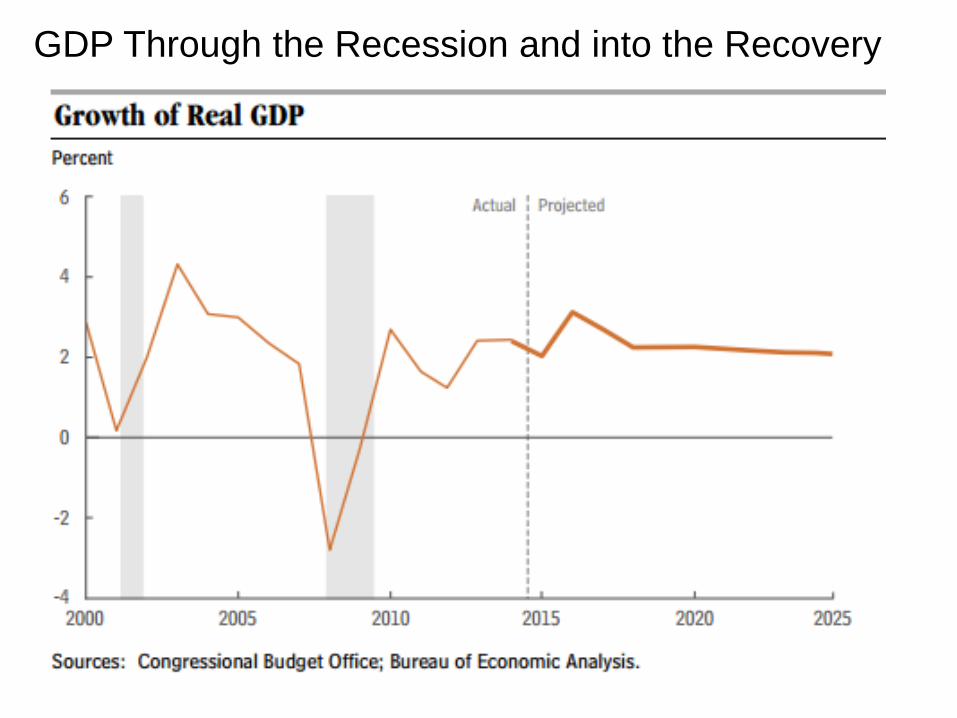
The depth and cost of the recent recession can be measured as the difference between actual and potential GDP. The economy is still recovering since it has yet to get back to where it could have been if there had been no recession.
The recession that began in 2007 was the worst downturn since the Great Depression.
Output Gap
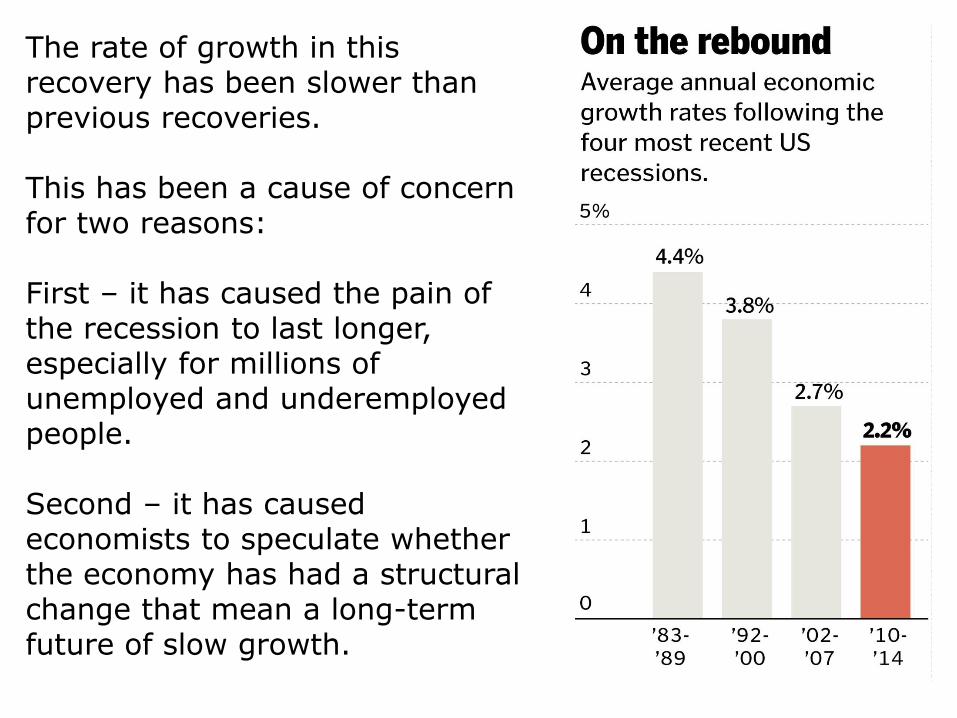
The rate of growth in this recovery has been slower than previous recoveries.
This has been a cause of concern for two reasons:
First – it has caused the pain of the recession to last longer, especially for millions of unemployed and underemployed people.
Second – it has caused economists to speculate whether the economy has had a structural change that mean a long-term future of slow growth.
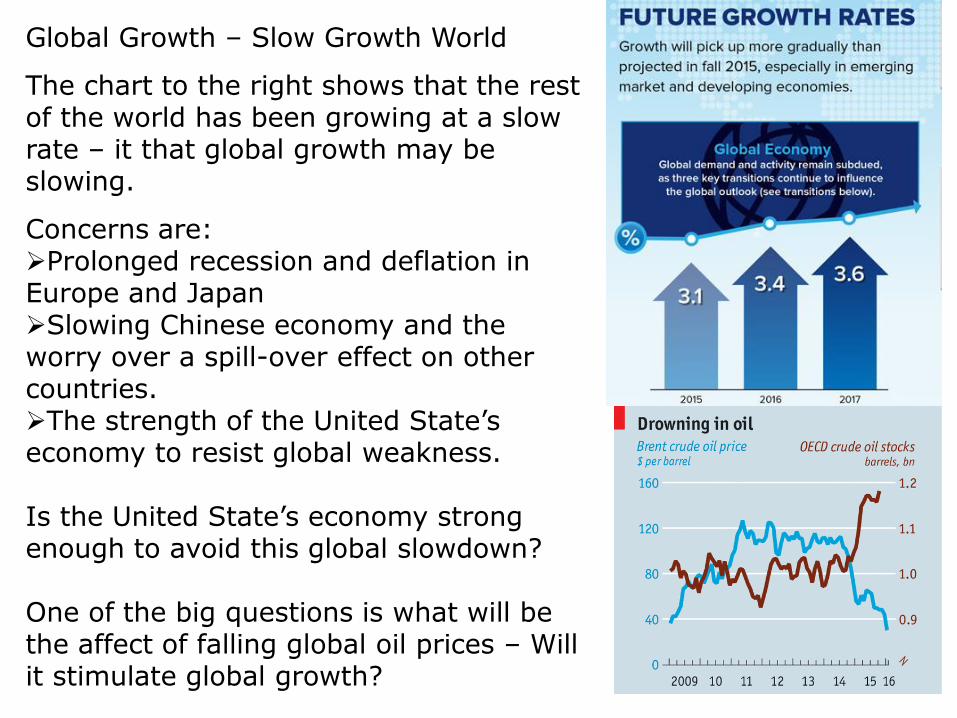
Global Growth – Slow Growth World
The chart to the right shows that the rest of the world has been growing at a slow rate – it that global growth may be slowing.
Concerns are:Prolonged recession and deflation in Europe and JapanSlowing Chinese economy and the worry over a spill-over effect on other countries. The strength of the United State’s economy to resist global weakness.
Is the United State’s economy strong enough to avoid this global slowdown?
One of the big questions is what will be the affect of falling global oil prices – Will it stimulate global growth?
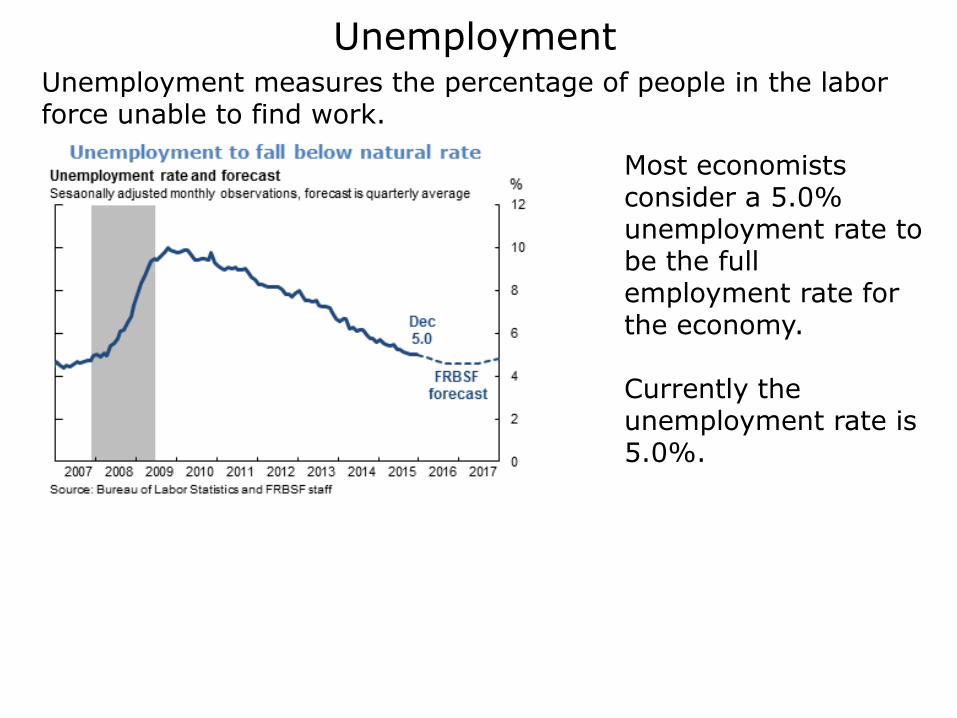
Most economists consider a 5.0% unemployment rate to be the full employment rate for the economy.
Currently the unemployment rate is 5.0%.
UnemploymentUnemployment measures the percentage of people in the labor force unable to find work.
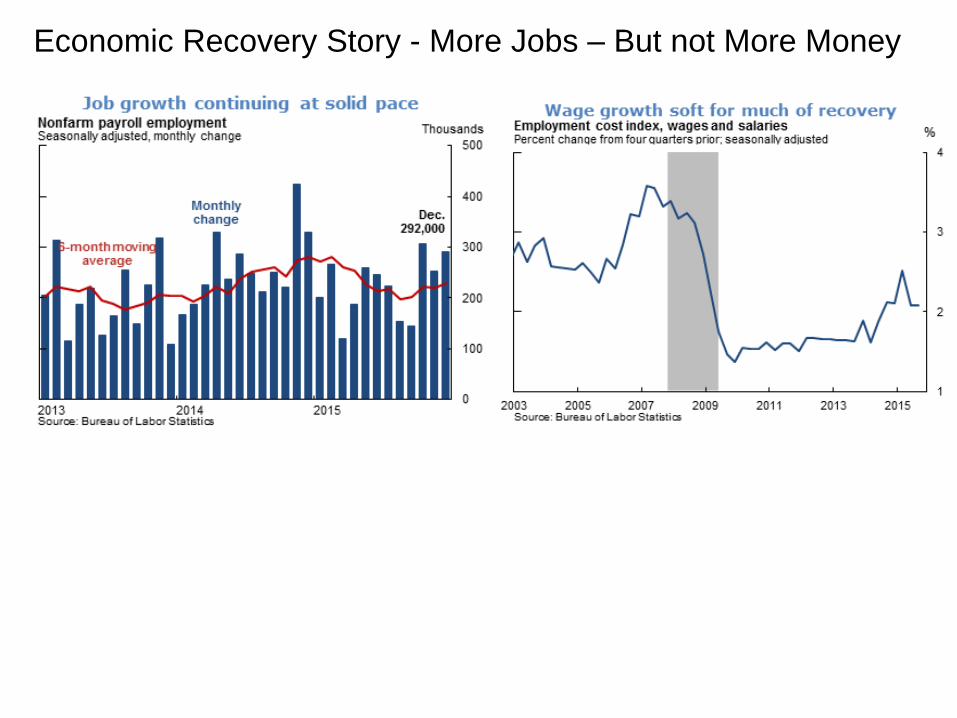
Economic Recovery Story - More Jobs – But not More Money
Unemployment
Unemployment is a psychological, social and economic problem. The economic problem is that it represents economic resources (human labor) that are not being utilized, which means that society is poorer than it otherwise would have been.
Unemployment statistics are based on the number of people in the labor force – not the population. The Bureau of Labor Statistics calculates the unemployment rate for the United States based on interviews with 60,000 households. It sorts the respondents into three categories:
•Employed – person who has a job
•Unemployed – did not have a job, but was actively looking.
•Not in Labor Force – students, non-working spouses, retires and “discouraged workers” – gave up on finding a job.
Calculating the Rate of Unemployment
The unemployment rate only accounts for the number of people in the labor force who are actively seeking employment but cannot find a job. The labor force is the sum of people employed and unemployed. Discouraged workers do not count as unemployed since they are not in the labor force. For this reason, the unemployment rate may understate the level of unemployment.
The unemployment rate is calculated by dividing the number of unemployed by the number of people in the labor force.
Unemployment Rate = Number of Unemployed
Labor Force
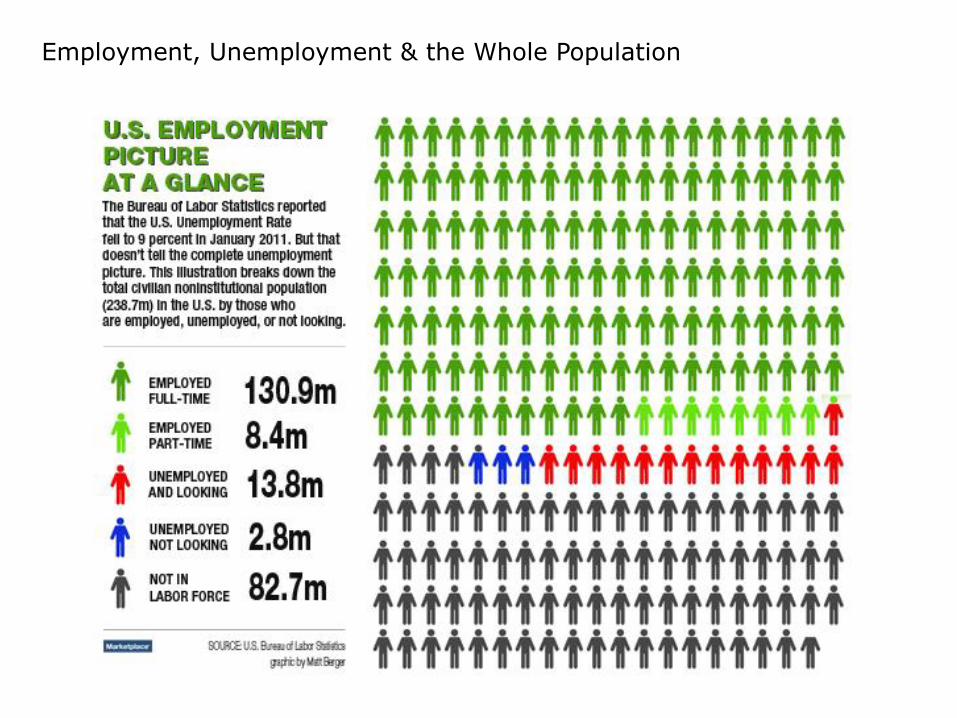
Employment, Unemployment & the Whole Population
Types of Unemployment
Economists divide unemployment into four categories.
•Frictional – unemployment created by people quitting to find better jobs or employers fire people to find better employees.
•Seasonal – unemployment caused by seasonal variation in industries (i.e. life guards and ski instructors)
•Cyclical – unemployment caused by changes in the business cycle – when cyclical unemployment is zero, the economy is considered at full employment.
•Structural – unemployment caused by structural changes in the economy that affect entire industries or types of jobs.
Macroeconomic policy focuses on the last two types of unemployment – Cyclical and Structural.
Prolonged Joblessness
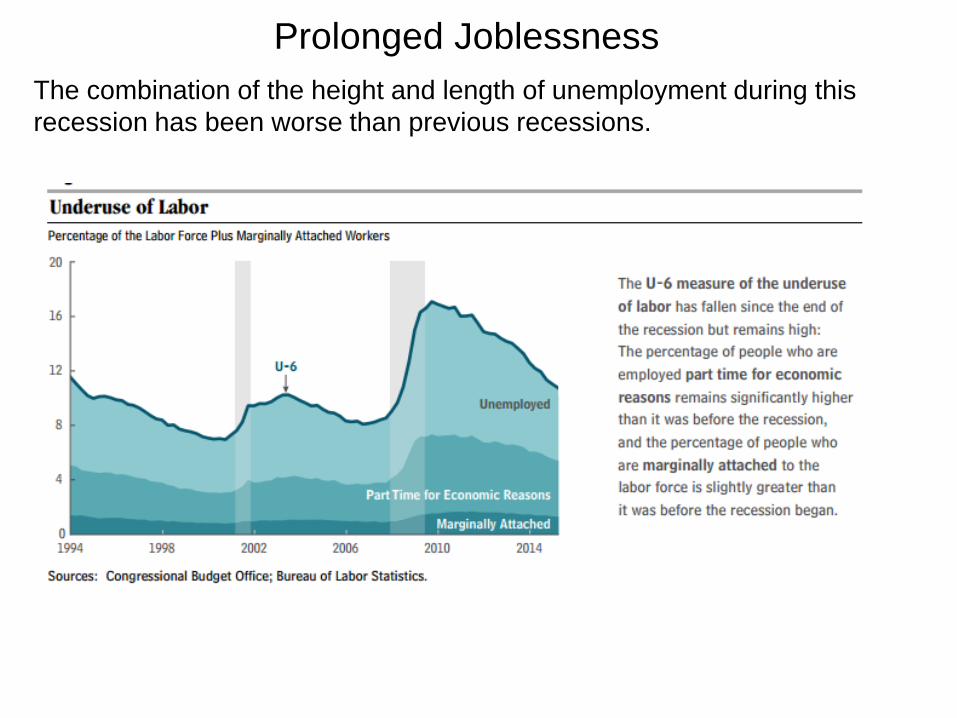
The combination of the height and length of unemployment during this
recession has been worse than previous recessions.
Shrinking Labor Force Participation
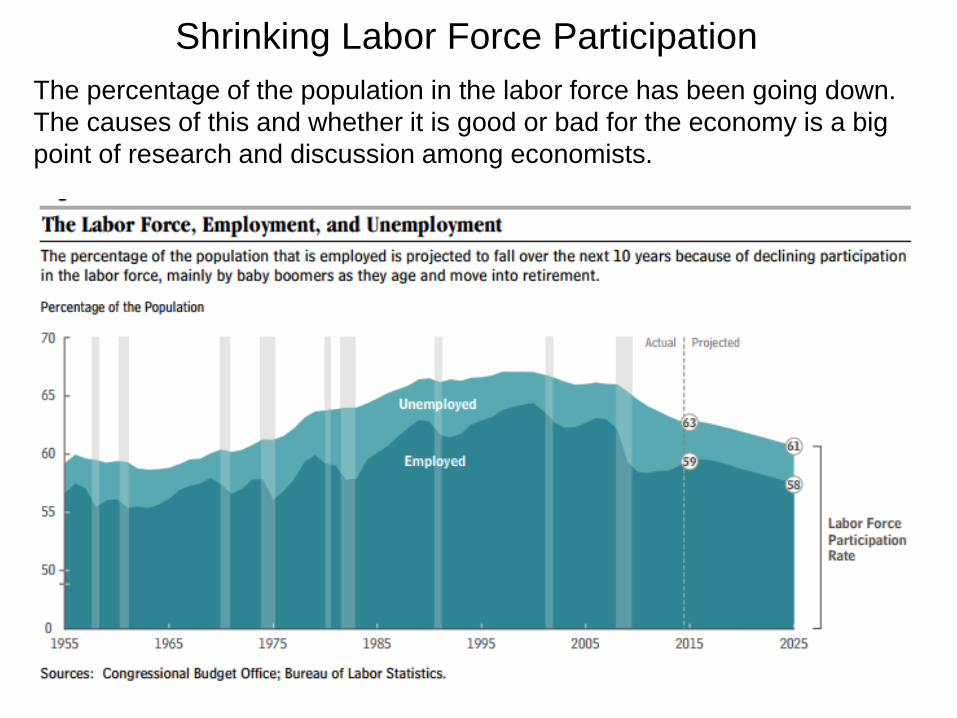
The percentage of the population in the labor force has been going down.
The causes of this and whether it is good or bad for the economy is a big
point of research and discussion among economists.
Economic Inequality
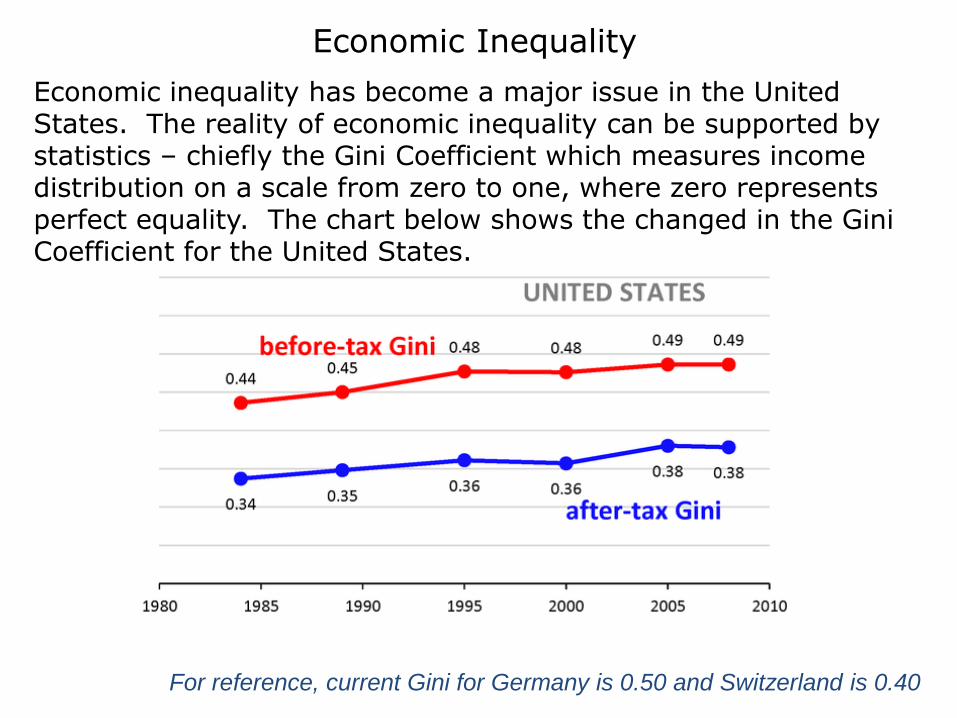
Economic inequality has become a major issue in the United States. The reality of economic inequality can be supported by statistics – chiefly the Gini Coefficient which measures income distribution on a scale from zero to one, where zero represents perfect equality. The chart below shows the changed in the Gini Coefficient for the United States.
For reference, current Gini for Germany is 0.50 and Switzerland is 0.40
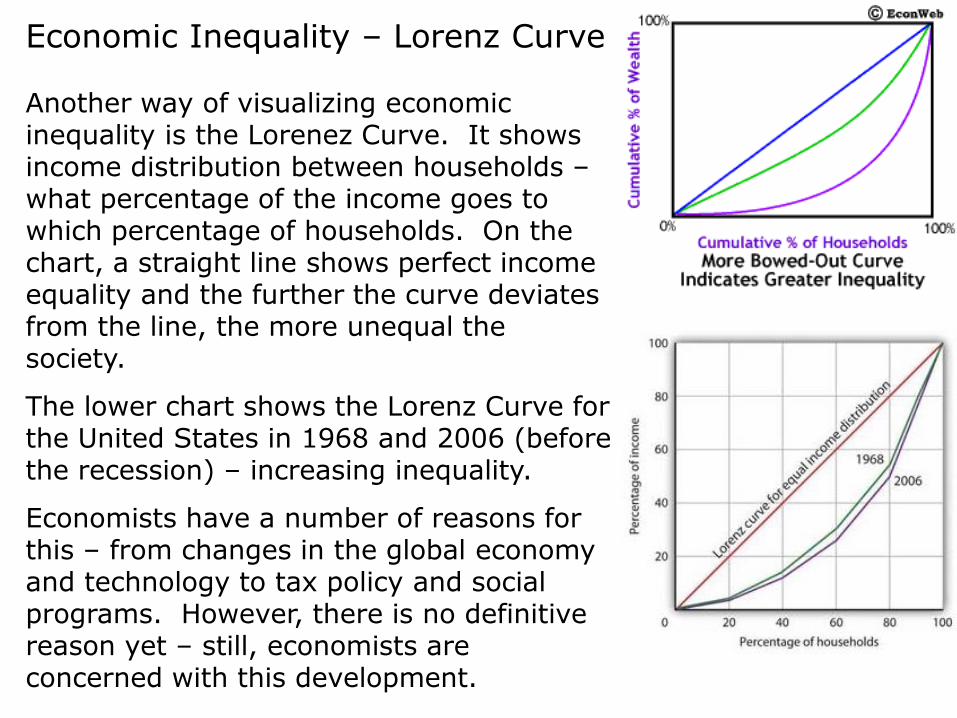
Economic Inequality – Lorenz Curve
Another way of visualizing economic inequality is the Lorenez Curve. It shows income distribution between households –what percentage of the income goes to which percentage of households. On the chart, a straight line shows perfect income equality and the further the curve deviates from the line, the more unequal the society.
The lower chart shows the Lorenz Curve for the United States in 1968 and 2006 (before the recession) – increasing inequality.
Economists have a number of reasons for this – from changes in the global economy and technology to tax policy and social programs. However, there is no definitive reason yet – still, economists are concerned with this development.
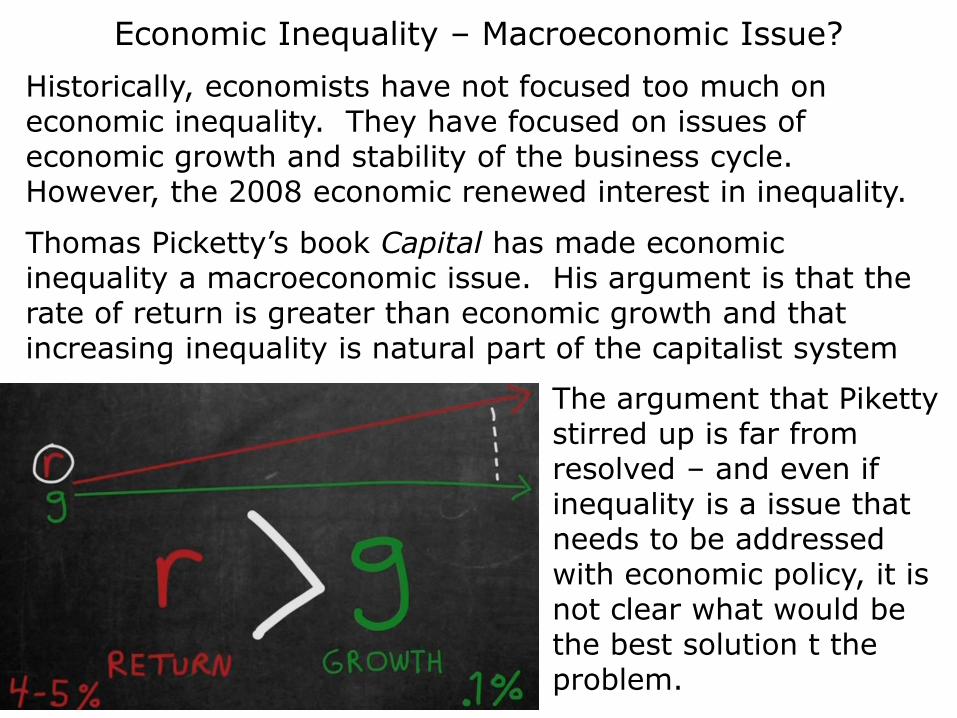
Economic Inequality – Macroeconomic Issue?
Historically, economists have not focused too much on economic inequality. They have focused on issues of economic growth and stability of the business cycle. However, the 2008 economic renewed interest in inequality.
Thomas Picketty’s book Capital has made economic inequality a macroeconomic issue. His argument is that the rate of return is greater than economic growth and that increasing inequality is natural part of the capitalist system
The argument that Piketty stirred up is far from resolved – and even if inequality is a issue that needs to be addressed with economic policy, it is not clear what would be the best solution t the problem.
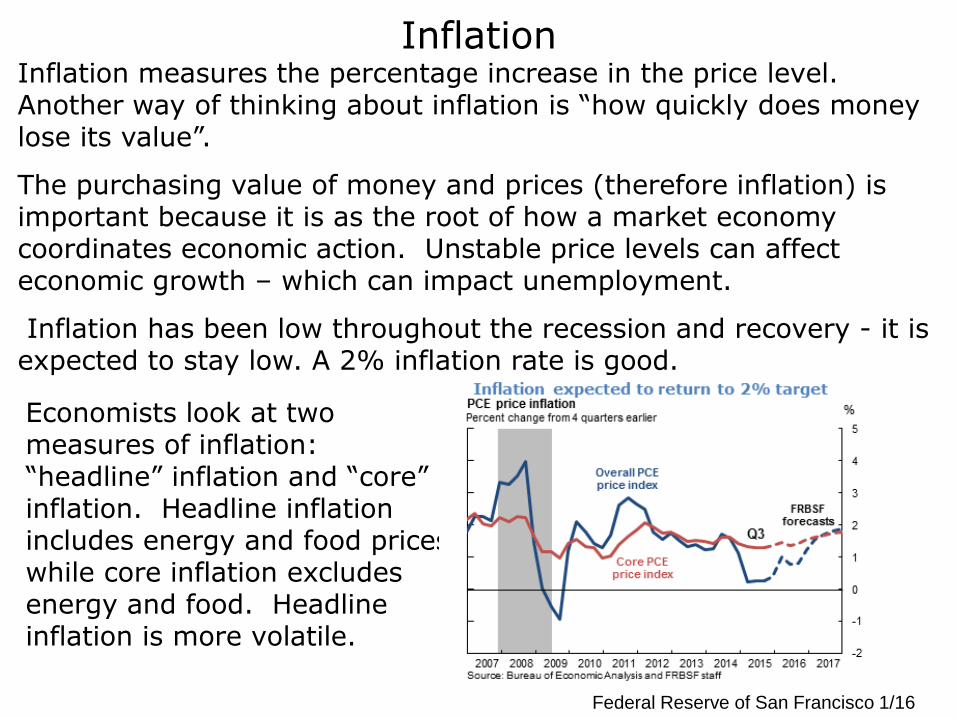
Economists look at two measures of inflation: “headline” inflation and “core” inflation. Headline inflation includes energy and food prices, while core inflation excludes energy and food. Headline inflation is more volatile.
InflationInflation measures the percentage increase in the price level. Another way of thinking about inflation is “how quickly does money lose its value”.
The purchasing value of money and prices (therefore inflation) is important because it is as the root of how a market economy coordinates economic action. Unstable price levels can affect economic growth – which can impact unemployment.
Inflation has been low throughout the recession and recovery - it is expected to stay low. A 2% inflation rate is good.
Federal Reserve of San Francisco 1/16
Calculating Inflation
The way government calculates inflation is by calculating a price index based on comparing the nominal prices for the same basket of goods on different years. In this calculation, one year is established as a “base year” and changes in prices are measured against that year. The index calculated is a percentage – rate of inflation. This is the equation:
Price Index = Price of Basket in specific year * 100Price of Basket in base year
The Bureau of Labor Statistics calculates the Consumer Price Index (CPI) and the Producer Price Index (PPI), through price check surveys, that are used to measure inflation in the United States. This is the equation for calculating inflation:
Inflation = [(CPI2 – CPI1)]* 100CPI1
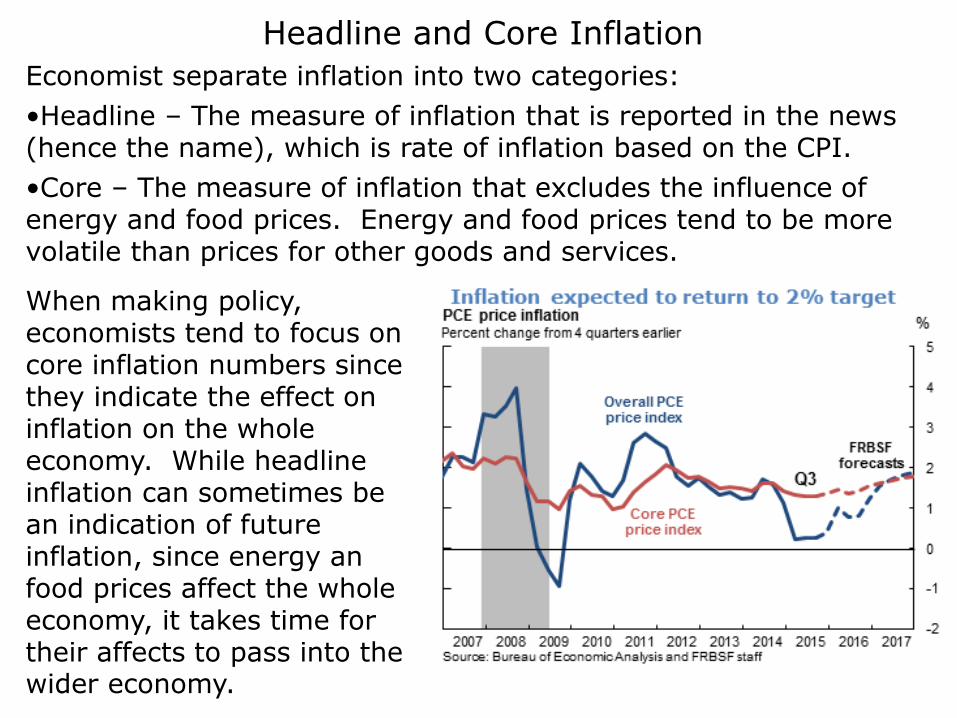
Headline and Core Inflation
Economist separate inflation into two categories:
•Headline – The measure of inflation that is reported in the news (hence the name), which is rate of inflation based on the CPI.
•Core – The measure of inflation that excludes the influence of energy and food prices. Energy and food prices tend to be more volatile than prices for other goods and services.
When making policy, economists tend to focus on core inflation numbers since they indicate the effect on inflation on the whole economy. While headline inflation can sometimes be an indication of future inflation, since energy an food prices affect the whole economy, it takes time for their affects to pass into the wider economy.
Important Concepts from Economics I (Microeconomics)
1. Opportunity cost is the basis of all economic decisions –every choice made is a choice forgone.
2. Trade is based on mutual advantage.
3. Specialization and trade makes a society wealthy.
4. Trade is based on comparative advantage – people should specialize in the production of good for which they have the lowest opportunity cost. Everyone has a comparative advantage in something.
Important Microeconomic Concepts Continued
5. Market prices work as signals to coordinate the efficient production and allocation of goods in the economy.
6. Markets can fail and there is a there is a role for the government to act as an economic agent to protect common resources, prevent monopoly and supply public goods.
7. Taxes result in a “dead weight” loss for society. Any benefits of government spending needs to take into account the “dead weight” loss of taxes.
8. The government can be an inefficient economic agent due to the problem of “rent seeking behavior”.