Embed Size (px)
Citation preview

Economywide Simulations
of Ethiopian MDG Strategies
by
Hans Lofgren
Carolina Diaz-Bonilla*
May 1, 2006
Revised version from July 22, 2005
GTAP Ninth Annual Conference, Addis Ababa
*Development Economics Prospects Group, World Bank, Washington, D.C. Hans Lofgren, Senior Economist: [email protected]. Carolina Diaz-Bonilla, Consultant: [email protected]. This paper reflects the views of the authors and not necessarily those of the World Bank.

1. Introduction and Summary1
As an input to the development of Ethiopia’s MDG strategy, this paper presents a set of
simulations that analyze the consequences of alternative scenarios. The scenarios were
designed in consultation with the Ethiopian government. The analysis is based on the
MAMS2 model, an economywide simulation model that the World Bank has developed
to analyze MDG strategies in different countries, with Ethiopia as a pilot case study.3
Many of the policies and foreign aid flows targeting MDGs have strong effects
throughout the economy that feed back on the MDG indicators through markets for labor,
goods, services, and foreign exchange. Therefore, economywide analysis of MDG
strategies is a necessary complement to sectoral studies.
More specifically, the simulations explore the consequences of alternative MDG
strategies that differ in terms of foreign aid requirements and their emphasis on growth,
poverty reduction, and human development. All scenarios suggest that a considerable
expansion in government consumption and investment is required to meet the different
MDGs. Under our core MDG scenario, the share of government demand in GDP doubles
from 29 percent in 2005 to 58 percent in 2015, while foreign aid per capita reaches
US$79 in 2015, which is almost five times the level in 2005.
Given that the amount of foreign financing required for this scenario may not be available
and/or considering that such a rapid expansion in government services may not be
feasible, our analysis explores two alternative scenarios that attempt to address the
relative merits of a focus on public infrastructure versus a focus on human development
in a resource-constrained setting. For both simulations, the government is constrained to
1 In this paper, the section on model structure and database draws on earlier MAMS papers on Ethiopia, including Lofgren and Diaz-Bonilla (2005) and Bourguignon et al. (2004). The simulations addressing trade-offs between infrastructure and human development are new. The model and database were revised in anticipation of this new round of analysis. 2 Maquette for MDG Simulations – MAMS 3 This core CGE model is an extension of the static, standard CGE model in Lofgren et al. (2002). See the technical documentation in Lofgren and Diaz-Bonilla (2006). The model is currently being applied in different regions, including some fifteen countries in Latin America and the Caribbean in the context of a joint World Bank – UNDP project.

receive 85 percent of the aid received in the core MDG scenario (that is, the present value
of total foreign aid during the period 2006-2015 reaches around US$ 26 billion as
compared to US$ 32 billion). Both simulations are therefore constrained to $66 in foreign
aid per capita in 2015. The scenario with a human development focus reaches the non-
poverty MDGs but falls short of the poverty target (with a 2015 rate of 22 percent as
against the target of 19 percent) and requires supplementary domestic taxation (raising
the tax share in GDP from about 19 to 22 percent). The scenario focused on infrastructure
produces more rapid GDP growth, reaches the poverty target (with a 2015 rate of 18.6
percent) and realizes more than 90 percent of the gain required for the other MDGs
relative to the situation in 1990.
In Section 2, we briefly describe the MAMS model. In Section 3, we present the
simulations and analyze their results. Readers who already are familiar with the model or
primarily are interested in the results may skip Section 2.
2. Model structure and database
The MAMS model integrates a relatively standard (recursive) dynamic general
equilibrium (GE) model with an additional MDG module that links specific MDG-related
interventions to MDG achievements. The core GE model follows the disaggregation
indicated in Table 1. As shown, the model has a relatively detailed treatment of
government activities, which are classified into 10 functions: four types of education (1st
and 2nd cycle primary, secondary, and tertiary), three types of health services (low-,
medium- and high-tech, divided into government and non-government), water-sanitation,
(other) infrastructure, and other government.4 Like other production activities, they use
production factors, and intermediate inputs to produce an activity-specific output (in the
case of the government, different types of services). The factors of production include
three types of labor (those with less than high school, high school, and more than high
4 This classification is driven by the analytical needs of this study. The category “other government” covers other government programs, some of which also may be essential for growth and/or MDG achievements, for example measures promoting agricultural growth and targeted efforts directed at the poor and the hungry both in rural and urban areas.

school education), public capital stocks by government activity, and a private capital
stock. The government finances its activities from domestic taxes, domestic borrowing,
and foreign aid (borrowing and grants). Provision of education, health, and water-
sanitation services contribute directly to the MDGs. Growth in the stock of public
infrastructure capital (including roads, energy and irrigation) contribute to overall growth
by adding to the productivity of other production activities. In health, the model accounts
for the fact that NGOs and the private sector provide part of the services and the
investments. The rest of the economy (representing agriculture, industry, and private,
non-health services) is treated as a single production sector. Its output is exported and
sold domestically, competing with imports.5 Apart from the government, the institutions
of the economy are divided into (health) NGOs, a household, and the rest of the world.
The model is intended to capture key interactions between the pursuit of the MDGs and
economic evolution. To keep it relatively simple, it does not cover all MDGs. It focuses
on the ones with the greatest cost and the greatest interaction with the rest of the
economy: universal primary school completion (MDG 2; measured by the net primary
completion rate), reduced under-five and maternal mortality rates (MDGs 4 and 5),
halting and reducing the incidence of HIV/AIDS (part of MDG 6), and increased access
to improved water sources and sanitation (part of MDG 7). We also address achievements
in terms of poverty reduction (MDG 1).
These different MDGs are covered in an additional set of functions that link the level of
each MDG indicator to a set of determinants, as summarized in Table 2. The
determinants include the delivery of relevant services (in education, health, and water-
sanitation) and other indicators, also allowing for the presence of synergies between
MDGs, i.e. the fact that achievements in terms of one MDG can have an impact on other
MDGs. Outside education, service delivery is expressed relative to the size of the
population. In education, the model tracks base-year stocks of students and new entrants
through the four cycles. In each year, students will successfully complete their grade,
5 In the model and the underlying database, production in the rest of the economy is currently being disaggregated into agriculture, industry, and private (non-health) services, drawing on Seyoum (2004) and the World Bank CEM Report No. 29383 (2004d).

repeat it, or drop out of their cycle. Student performance depends on educational quality
(quantity of services per student), household welfare (measure by per-capita household
consumption), the level of public infrastructure, wage incentives (expressed as the ratio
between the wages for labor at the next higher and current levels of education for the
student in question; an indicator of payoff from continued education), and health status
(proxied by MDG 4). The achievement of MDG 2 requires that (very close to) all
students in the relevant age cohort enter the 1st primary cycle (four years) and
successfully complete each year within this cycle. The functions for education and the
other MDGs have been calibrated to assure that, under base-year conditions, base-year
performance is replicated and that, under a set of other conditions identified by sector
studies, the target is fully achieved.
The model is built around an Ethiopian database for 2002, much of which is organized in
a Social Accounting Matrix (SAM), supplemented by more detailed data related to the
different MDGs and the labor market (including levels of service delivery required to
meet the different MDGs, stocks of students at different educational levels and of labor
by educational level, and student behavioral patterns in terms of graduation rates and
other indicators) as well as elasticities in production, trade, consumption and in the
different MDG functions. The data is primarily based on government and World Bank
studies and data sources, including sector studies [see for example: MOFED (2005),
Soucat (2005), Tan (2005), World Bank (2003), World Bank (2004a-2004e), World Bank
and Ministry of Health Ethiopia (2004)]. The model is simulated for the period 2002-
2015. For the initial period, 2002-2005, the model is tuned to available data so as to
provide a starting point in 2005 that reflects the current state Ethiopia’s economy
according to preliminary data.
The model includes several links between the MDG module and the rest of the economy.
An important link is that the provision of the additional government services needed to
reach the MDGs requires additional resources – capital and investment, labor, and
intermediate inputs – that become unavailable to the rest of the economy. The effects of
any program very much depend on how the program is financed: from foreign sources,

from domestic taxes (which will reduce consumption), and/or from domestic borrowing
(which will crowd out private investment). Even if foreign sources supply the finance,
resources available for the rest of the economy are affected as increased demand for labor
with a relatively high education withdraw this labor from employment elsewhere.
Increased foreign aid may lead to exchange rate appreciation with economywide
repercussions, including consumers benefiting from lower prices of imports and a loss of
competitiveness for producers of tradables (exporters or producers of import-substitutes).
At the same time, the pursuit of the MDGs generates additional resources as it influences
the educational composition of the labor force, raising its average level of education. The
performance of the rest of the economy will also influence the ease with which different
MDGs can be achieved. Higher private incomes provide additional resources that enable
private households to draw more benefit from government health and education
programs. More rapid growth raises government revenues, strengthening the ability of
governments to finance and operate efficient programs.
3. Simulations
The Base Simulation and General Model Assumptions
The BASE simulation is a business-as-usual moderate growth scenario in which specific
MDG targets are not pursued. In terms of domestic policy, the different components of
government consumption all grow at an exogenous rate of 4 percent per year, slightly
above the rate of real GDP, and similar to the over-all growth trend of the economy in
recent years.
For the other scenarios, growth rates for selected government services are endogenous,
driven by the objective of achieving specified MDGs, while some of the exogenous
growth rates are more rapid. Apart from the treatment of government consumption, the
features of the BASE simulation are identical to those of the other three simulations.
Starting from 2006, the (effective) direct and domestic indirect tax rates increase
exogenously over time while foreign borrowing is assumed to stay constant at the 2005
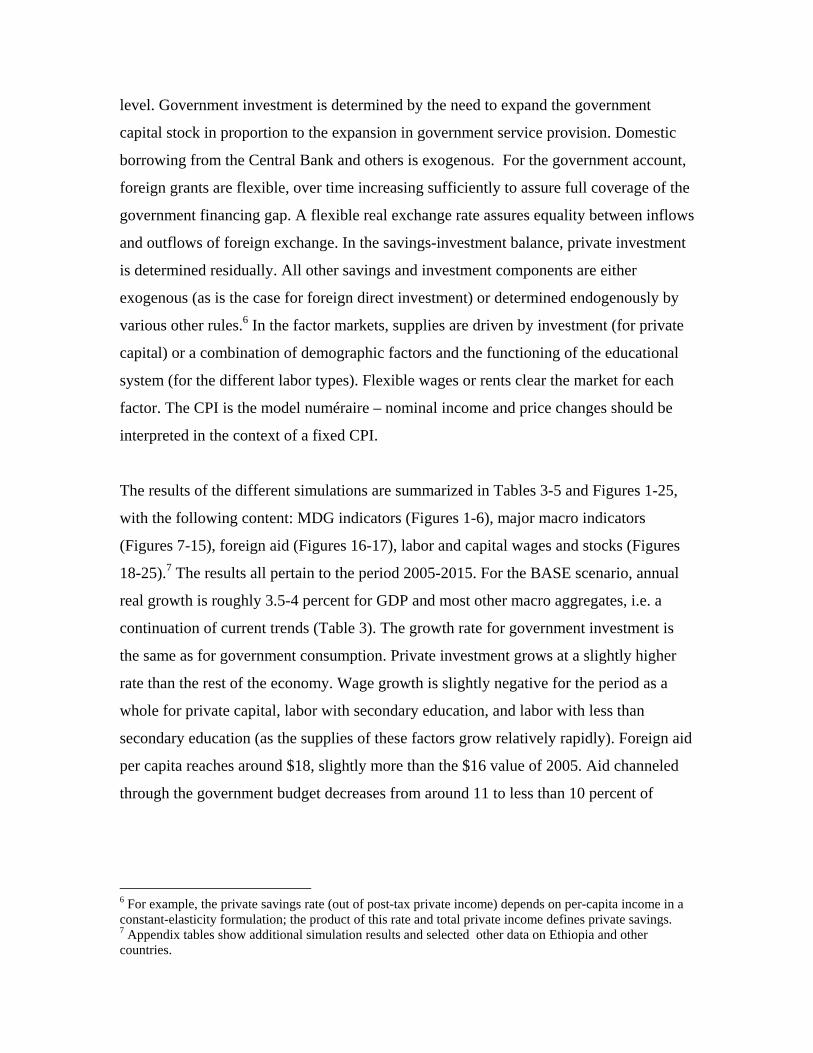
level. Government investment is determined by the need to expand the government
capital stock in proportion to the expansion in government service provision. Domestic
borrowing from the Central Bank and others is exogenous. For the government account,
foreign grants are flexible, over time increasing sufficiently to assure full coverage of the
government financing gap. A flexible real exchange rate assures equality between inflows
and outflows of foreign exchange. In the savings-investment balance, private investment
is determined residually. All other savings and investment components are either
exogenous (as is the case for foreign direct investment) or determined endogenously by
various other rules.6 In the factor markets, supplies are driven by investment (for private
capital) or a combination of demographic factors and the functioning of the educational
system (for the different labor types). Flexible wages or rents clear the market for each
factor. The CPI is the model numéraire – nominal income and price changes should be
interpreted in the context of a fixed CPI.
The results of the different simulations are summarized in Tables 3-5 and Figures 1-25,
with the following content: MDG indicators (Figures 1-6), major macro indicators
(Figures 7-15), foreign aid (Figures 16-17), labor and capital wages and stocks (Figures
18-25).7 The results all pertain to the period 2005-2015. For the BASE scenario, annual
real growth is roughly 3.5-4 percent for GDP and most other macro aggregates, i.e. a
continuation of current trends (Table 3). The growth rate for government investment is
the same as for government consumption. Private investment grows at a slightly higher
rate than the rest of the economy. Wage growth is slightly negative for the period as a
whole for private capital, labor with secondary education, and labor with less than
secondary education (as the supplies of these factors grow relatively rapidly). Foreign aid
per capita reaches around $18, slightly more than the $16 value of 2005. Aid channeled
through the government budget decreases from around 11 to less than 10 percent of
6 For example, the private savings rate (out of post-tax private income) depends on per-capita income in a constant-elasticity formulation; the product of this rate and total private income defines private savings. 7 Appendix tables show additional simulation results and selected other data on Ethiopia and other countries.

GDP.8 The endogenous annual rate of growth in total factor productivity (TFP) is around
2 percent for the private sector and 0.5 percent for the different government sectors. This
scenario registers significant improvements relative to the situation in 2005 for all MDG
targets; however, it falls short of achieving any one of them. The incremental capital-
output ratio (ICOR) for this scenario is relatively low, at 3.7, reflecting that, for this
scenario, growth in the two parts of capital that contribute most directly to GDP growth
(private capital and public infrastructure capital) is high relative to other (government)
capital.9
Core MDG scenario
The simulation MDG-BASE targets the full achievement of MDGs 2, 4, 5, 7a, and 7b
through an expansion of 1st cycle primary education, the different health services, and
water and sanitation services. The provision of health services is also sufficient to reach
the MDG target of halting the increase in HIV/AIDS via preventive services.10 Spending
on higher educational cycles and public infrastructure expands rapidly to generate
balanced growth in the educational system as a whole and to provide the infrastructure
services (roads, energy, and irrigation) that are needed to support more rapid growth.
MDG 1 is not targeted but monitored (assuming an elasticity of minus one for the
headcount poverty rate with respect to real per-capita consumption). In the areas of health
and water-sanitation, the service growth rate from 2005-2015 is constant, at a level that is
sufficient to meet the MDG targets. Apart from the 1st cycle of primary schooling,
educational expansion also takes place at a constant rate. For public infrastructure,
expansion is front loaded with growth twice as rapid in the years 2005-2009 as during the
remaining years. The rationale for this scenario is the need to build up the critical
8 In the different simulations, per-capita non-governnment aid increases from around US$5 in 2005 to US$7 in 2015, i.e. the share of aid that passes through the government budget increases from around 70 to 90 percent. 9 The ICOR is defined as the ratio between the change (from 2005 to 2015) in the total physical capital stock (both private and government; value at the base-year prices of new capital stock) and the change in real GDP at factor cost. 10 If donor support is available, these services could be supplemented by HIV/AIDS treatment programs. Given that such programs would be relatively import-intensive, their presence would not substantially alter the current analysis.

minimum in infrastructure that is needed for productivity-raising network effects. For 1st
cycle primary education, frontloading is needed to make sure that, by 2012, (close to)
every child in the proper cohort enters school and that (close to) every one in this group is
able to graduate from the 1st grade in 2012 and successfully complete the remaining three
grades in 2013-2015. Foreign grants grow in pace with government financing needs,
while domestic financing is the same as under the BASE scenario.
The results for MDG-BASE indicate that a rapid expansion of government services is
needed to achieve the MDG targets. The different government services related to the
MDGs all grow at very high rates, ranging between 11 and 21 percent per year.
Government MDG investment expands even more rapidly, by 21 to 40 percent, in
response to the need to expand the government capital stock in proportion to service
expansion. Growth in total government consumption and investment is kept in check due
to the fact that “other government” (which is not directly related to MDG services)
continues to grow at annual rates of 4 percent for each. Expressed as shares of GDP, the
sum of government consumption and investment increases from 29 percent in 2005 to 58
percent in 2015.
This government expansion gives rise to a similarly drastic increase in foreign aid
requirements, as foreign aid in the government budget increases from 11 percent of GDP
in 2005 to 37 percent in 2015. In per-capita terms, total foreign aid reaches $79 on 2015,
almost five times the 2005 level. Compared to the BASE scenario, the present value (PV)
of foreign aid is 4.5 times larger, reaching US$ 31 billion (on the basis of a discount rate
of 5 percent). Higher incomes and more rapid productivity growth (at 3.3 percent,
attributable to the increase in public infrastructure) permit real GDP growth to accelerate
by close to 2 percent, reaching a growth rate of 5.5 percent. The increase in aid inflows
imposes a strong increase in the trade deficit, with a drastic appreciation of the real
exchange rate (by 3.2 percent per year) providing the incentives for import and export
growth to accelerate and decelerate, respectively. The combination of an increase in the
trade deficit and more rapid GDP growth permits total absorption (the sum of private and
government consumption and investment demand) to expand at 8.5 percent per year,

including private consumption and investment growth at annual rates of 5.4 and 8.3,
respectively. Growth in private consumption leads to a fall in the headcount poverty rate
from about 34 percent in 2005 to less than 19 percent in 2015. Across the different
scenarios, the private sector grows at rates that are respectable, although clearly slower
than MDG-related government services. This result reflects that the availability of foreign
aid permits government expansion to take place without any significant crowding out of
private investment. For this and the following scenarios, the ICOR is considerably higher
than for BASE, between 6 and 7, given the allocation of a large share of investment to
human development with a relatively low payoff in growth during the simulation period.
Focusing on human development
Given that the amount of foreign financing required for MDG-BASE may not be
available and/or that such a rapid expansion in government services may not be
considered feasible, our analysis explores two alternative scenarios that attempt to
address the relative merits of a focus on public infrastructure versus a focus on human
development in a resource-constrained setting.
The simulation MDG-INFCUT introduces a cut in public infrastructure spending that, in
the context of an increase in effective domestic tax rates, is sufficient to limit foreign aid
per capita in 2015 to about $66, roughly four times the 2005 level. The achievement of
the targeted (non-poverty) MDGs is not compromised. However, preliminary simulations
indicated that reduced growth in infrastructure services alone is not sufficient to limit
final-year per-capita aid to $66 in the context of full achievement of the targeted non-
poverty MDGs. This is due to the negative impact of less infrastructure on growth in
incomes and government tax revenues; beyond a certain point, less spending on
infrastructure increases the need for foreign aid. Given this result, this scenario combines
a cut in infrastructure spending with an (additional) increase in direct tax rates (relative to
the other scenarios).

The over-all result is a decline in growth rates to levels between BASE and MDG-BASE
for all macro aggregates except government consumption, as a marginal increase is
needed in the different government service sectors to achieve the MDGs. This increase is
due to declining growth of household consumption and a lower level of infrastructure
compared to the scenario MDG-BASE (both are factors that, along with government
services, contribute positively to MDG achievements). The fact that the economy fails to
achieve the poverty target points to the presence of a short- and medium-run trade-off
between expanded human development and poverty reduction. The PV of foreign aid
2006-2015 falls by 15%, to about US$ 26 billion. The GDP share for government
demand reaches almost 57 percent, a slight decrease compared to MDG-BASE. Relative
to GDP, tax revenue in 2015 reaches 21.5 percent of GDP, while the other scenarios
remain between 16 and 18.8.11
Focusing on growth and infrastructure
The simulation MDG-HDCUT stays within the same foreign aid constraint as MDG-
INFCUT by reducing the targets that are imposed for the MDGs (other than MDG 1) to a
uniform share of the improvement needed to fully achieve these MDGs (relative to the
1990 rate). This scenario generates a reduction in the expansion of the different
government services that are directly related to the different MDGs (1st cycle primary
education services, the different health services, and water-sanitation services), with an
ensuing reduction in government spending and foreign aid requirements. As in MDG-
INFCUT, aid levels reach US$ 66 per capita in 2015.
The results for this simulation further demonstrates a trade-off between human
development versus growth and poverty reduction in a setting where foreign aid is
constrained or country absorptive capacity is limited. Compared to MDG-BASE, growth
in government consumption and investment shifts down by 1.7 percentage points whereas
growth in private consumption stays about the same and growth in investment declines
11 In 2002, among the 75 countries for which the World Bank Development Data Platform includes information on total tax revennues, 10 had a tax share exceeding 26 percent. The unweighted average for the 75 countries was 17 percent.

by 0.1 percentage points. The GDP growth rate is virtually unchanged. Private capital
grows by slightly less than in the MDG-BASE scenario, but growth for the infrastructure
capital stock remains the same. The fact that, compared to MDG-INFCUT, export growth
increases noticeably is due to more rapid GDP growth and productivity increases
resulting from successful infrastructure investments.
In terms of the MDGs, the poverty target is achieved, although by a smaller margin. For
the non-poverty MDGs, this simulation achieves 91 percent or more of the gain required
relative to the situation in 1990. During the simulation period, it reaches the levels of
MDG-BASE and MDG-INFCUT with a lag of only a few years.
The last two scenarios are comparable also in terms of the present value (PV) of foreign
aid for 2006-2015, which reaches US$ 26.3 billion, or about 85% of the US$ 30.9 billion
for MDG-BASE. The fact that MDG-HDCUT is less costly than MDG-BASE is
primarily due to two factors: lower wages of workers with secondary education and more
(slower expansion in human development leads to less pressure on this segment of the
labor market); and considerable real resource savings from falling slightly short of
achieving the non-poverty MDG targets by the 2015 deadline.
Given more rapid growth than for MDG-INFCUT and a slightly less ambitious agenda
than for MDG-BASE, the 2015 GDP share for government demand, at around 52 percent,
is slightly lower for this simulation than for the other two, which both landed at close to
57 percent of GDP. This observation leads to the related observation that the simulated
scenarios involve an expansion in government demand relative to GDP that is extreme by
international standards (in spite of relatively optimistic scenarios for GDP growth).12
One common feature of the different scenarios presented in this paper is that the GDP
share for total government consumption is only slightly larger than the GDP share for
total tax revenues – between 17 and 25 percent for the former and between 16 and 21.5
12 In 2002, among the 84 countries for which the World Bank Development Data Platform included information on both government consumption and investment, only two had a combined share in excess of 50 percent of GDP while only four exceeded 40 percent. (See Appendix Table A.3.)

percent for the latter. This outcome suggests that, in spite of rapid government expansion,
the Ethiopian government need not rely on foreign aid to cover the costs of its recurrent
activities.
4. Conclusions
This paper presents a set of simulations that analyzes the consequences of alternative
scenarios for Ethiopia’s MDG strategy. The analysis is based on the MAMS model, an
economywide simulation model developed to analyze MDG strategies in different
countries, with Ethiopia as a pilot case study. The simulations explore the consequences
of alternative MDG strategies that differ in terms of foreign aid requirements and their
emphasis on growth, poverty reduction, and human development. All scenarios suggest
that a considerable expansion in government consumption and investment is required to
meet the different MDGs: the share of government demand in GDP for the core MDG
scenario doubles to 58 percent in 2015 while foreign aid per capita increases five-fold to
US$79 in 2015 as compared to 2005.
Two alternative scenarios address the trade-offs between human development versus
infrastructure spending in the case of resource constraints. For both simulations, the
government is constrained to receive 85 percent of the aid received in the core MDG
scenario, therefore foreign aid per capita is held at US$66 in 2015. The scenario with a
human development focus reaches the non-poverty MDGs but falls short of the poverty
target (with a 2015 rate of 22 percent as against the target of 19 percent) and requires
supplementary domestic taxation (raising the tax share in GDP from about 19 to 22
percent). The scenario focused on infrastructure produces more rapid GDP growth,
reaches the poverty target and realizes more than 90 percent of the gain required for the
other MDGs relative to the situation in 1990. While the parameters underlying these
simulations are highly uncertain, the findings nevertheless point to trade-offs that should
be considered in the development of Ethiopia’s MDG strategy.

References
Bourguignon, François, Maurizio Bussolo, Hans Lofgren, Hans Timmer, Dominique van der Mensbrugghe. 2004. “Towards Achieving the MDGs in Ethiopia: An Economywide Analysis of Alternative Scenarios.” World Bank. Mimeo. December. Lofgren, Hans, Rebecca Lee Harris, and Sherman Robinson, with assistance from Moataz El-Said and Marcelle Thomas. 2002. A Standard Computable General Equilibrium (CGE) Model in GAMS. Microcomputers in Policy Research, Vol. 5. Washington, D.C.: IFPRI (http://www.ifpri.org/pubs/microcom/micro5.htm) Lofgren, Hans and Carolina Diaz-Bonilla. 2006. “MAMS: An Economywide Model for Analysis of MDG Country Strategies – Technical Documentation.” Mimeo. World Bank. March. Lofgren, Hans, and Carolina Diaz-Bonilla. 2005. “An Ethiopian Strategy for Achieving the Millennium Development Goals: Simulations with the MAMS model.” Mimeo. World Bank, Washington D.C. MOFED (Ministry of Finance and Economic Development). 2005. MDG Needs Assessments for Education, Health, Water, and Sanitation. Addis Ababa. Seyoum Taffesse, Alemayehu and Tadele Ferede. 2004. “The Structure of the Ethiopian Economy - A SAM-based Characterisation,” Background paper to CEM Report No. 29383. May. Soucat, Agnes. 2005. Simulation results for the health sector based on the Marginal Budgeting for Bottlenecks (MBB) model developed by UNICEF, World Bank, and WHO. Tan, Jee-Peng. 2005. Simulation results for the education sector based on the Ethiopia Education Policy Simulation Model (EPSM) developed by the World Bank in collaboration with the Ethiopian Ministry of Education. World Bank. 2003. “Higher Education Development for Ethiopia: Pursuing the Vision,” Working Paper Series, Report 29096. January 20. World Bank. 2004a. “Ethiopia: Public Expenditure Review. Volume I: Public Spending in the Social Sectors 2000-2020. The Emerging Challenge,” PER Report No. 29338-ET, Poverty Reduction and Economic Management 2 (AFTP2), Country Department for Ethiopia, Africa Region. June. World Bank. 2004b. “Well-Being and Poverty in Ethiopia – The Role of Agriculture, Aid and Agency,” Report No. XXXX-ET, Poverty Reduction and Economic Management 2, Africa Region. June 18.

World Bank. 2004c. “Education in Ethiopia: Strengthening the Foundation for Sustainable Progress.” AFTH3, Human Development Department, Africa Region, Report No. 28037-ET. August 26. (draft) World Bank. 2004d. "Ethiopia-A Strategy to Balance and Stimulate Growth," A Country Economic Memorandum, CEM Report No. 29383-ET. October. World Bank. 2004e. RMSM-X simulation for Ethiopia. Development Economics Data Group. October. World Bank and Ministry of Health Ethiopia. 2004. “Ethiopia: A Country Status Report on Health and Poverty,” Draft Report No. 28963-ET, Africa Region Human Development and Ministry of Health Ethiopia. September.

Table 1. Model disaggregation
Activities/Commodities (11)Non-government (4)
PrivateHealth sector low techHealth sector medium techHealth sector high tech
Government (10)Education 1st primary cycleEducation 2nd primary cycleEducation secondaryEducation tertiaryHealth sector low techHealth sector medium techHealth sector high techWater & sanitationPublic infrastructureOther government
Factors (17)Labor with less than completed secondary educationLabor with completed secondary educationLabor with completed tertiary educationCapital (14) - one stock for each model activity
Institutions (4)HouseholdNGOGovernmentRest of the World

Table 2. Determinants of MDG achievements
MDG
1 x2 x x x x 44 x x x 7a, 7b5 x x x 7a, 7b7a x x x7b x x x
Note: (*) The services covered are 1st cycle public education services (MDG2), different types of
health services (both public and private) (MDGs 4 and 5), and public water-sanitation services
(MDGs 7a and 7b). Education services are expressed per student, reflecting amount of class-
room space, teacher time, and materials inputs per student (an indicator of educational quality).
DeterminantsLevel of service
delivery*
Per-capita household
consumption
Wage incentives
Public infrastructure Other MDGs

Table 3. Real growth and MDG data 2006-2015 (various units) (1)2005 base mdg-base mdg-infcut mdg-hdcut target
Macro totals mn US$Absorption* 10150.4 3.4 8.5 7.4 7.9GDP at market prices 8524.4 3.5 5.7 5.1 5.7Private consumption 6731.4 3.1 5.4 4.4 5.4Government consumption 1453.2 4.0 8.4 9.1 6.7Private investment 946.3 4.2 8.3 6.9 8.2Government investment 1019.5 4.0 20.0 17.7 18.3Exports 1284.1 3.8 -0.8 -0.9 0.7Imports 2910.0 3.3 12.6 11.0 11.2GDP at factor cost (total) 7700.0 3.6 5.5 4.9 5.5GDP at factor cost (private sector) 7102.3 3.5 5.2 4.4 5.4GDP at factor cost (government) 597.7 4.0 8.7 9.6 7.3Real exchange rate (indexed) 1.0 0.3 -3.2 -2.9 -2.3Government Consumption mn US$1st cycle primary education 94.5 4.0 15.6 19.1 9.22nd cycle primary education 67.5 4.0 12.9 12.9 12.9Secondary education 55.6 4.0 11.2 11.2 11.2Tertiary education 51.2 4.0 13.1 13.1 13.1Low-tech health 22.0 4.0 14.7 16.4 8.0Medium-tech health 31.0 4.0 11.9 13.3 6.6High-tech health 110.6 4.0 15.5 17.3 8.5Water and sanitation 16.3 4.0 21.4 22.0 20.4Public infrastructure 17.0 4.0 15.4 11.6 15.4Other government 987.7 4.0 4.0 4.0 4.0Government Investment mn US$1st cycle primary education 18.6 4.0 24.1 30.1 12.32nd cycle primary education 13.7 4.0 24.4 24.4 24.4Secondary education 26.6 4.0 21.1 21.1 21.1Tertiary education 36.7 4.0 24.9 24.9 24.9Low-tech health 16.3 4.0 28.0 31.2 14.3Medium-tech health 23.9 4.0 22.6 25.3 10.8High-tech health 45.3 4.0 29.6 32.9 15.3Water and sanitation 15.4 4.0 40.4 41.3 38.5Public infrastructure 378.5 4.0 24.6 17.4 24.6Other government 444.4 4.0 4.0 4.0 4.0Factor wages (unit rents) '000 birr/yrLabor (< secondary education) 0.8 -0.4 3.8 3.0 3.3Labor (secondary education) 2.1 -0.8 1.4 1.1 0.9Labor (tertiary education) 9.5 1.9 3.1 3.1 2.3Private capital 2.7 -0.3 0.4 0.0 0.6Factor quantities mnLabor (< secondary education) 29.8 3.5 1.9 1.8 2.2Labor (secondary education) 2.3 3.9 5.0 5.0 4.8Labor (tertiary education) 0.2 1.9 4.4 4.2 4.4Private capital 7.7 3.5 4.9 4.5 4.7ICOR 3.7 6.8 6.5 6.2MDG indicators (4) rate in 2005MDG 1: headcount poverty rate (%) 33.8 27.8 18.6 21.7 18.6 19.2MDG 2: 1st cycle primary net completion rate (%) 29.1 48.0 99.9 100.0 93.5 100.0MDG 4: under-5 mortality rate (per 1000 live births) 156.1 110.1 68.0 67.8 79.4 68.0MDG 5: maternal mortality rate (per 100000 live births) 579.8 385.7 217.5 216.7 261.7 217.5MDG 7a: acess to safe drinking water (%) 24.4 26.4 62.5 62.5 59.4 62.5MDG 7b: acess to improved sanitation (%) 12.0 14.1 54.0 54.1 50.5 54.0Note:1. Simulation names and description: BASE = business-as-usual scenario; MDG-BASE = core MDG scenario BASE = business-as-usual scenario MDG-BASE = core MDG scenario MDG-MIX = MDG scenario with smaller increase in foreign aid MDG-INFCUT = MDG scenario with reduced spending on infrastructure (human-development focus) MDG-HDCUT = MDG scenario with reduced spending on human-development (growth focus)2. Macro closures: Government: fixed tax rates and borrowing; flexible foreign grants. Rest of World: flexible real exchange rate Savings-Investment: fixed MPS, flexible private investment. CPI is the numeraire3. 2005 values are simulated; the model is solved for 2002-20154. The 1990 values are: 38.4 (MDG 1); 24.0 (MDG 2); 204.0 (MDG 4); 870 (MDG 5); 25.0 (MDG 7a); 8.0 (MDG 7b) The targeted changes relative to the 1990 value: 50% cut (MDG 1); reach 100% in 2015 (MDG 2); 2/3 cut (MDG 4); 3/4 cut (MDG 5); 50% cut in share without (MDG 7a); 50% cut in share without (MDG 7b).
real annual growth 2006-2015 (%)
real annual growth 2006-2015 (%)
real annual growth 2006-2015 (%)
nominal annual growth 2006-2015 (%)
real annual growth 2006-2015 (%)
rate in 2015

Table 4. Macro and government data in 2005 and by simulation in 2015 (% of GDP)
2005 base mdg-base mdg-infcut mdg-hdcutMacro totals (% of GDP)Absorption* 119.1 118.4 141.7 138.6 138.5Private consumption 79.0 76.0 72.2 70.6 74.4Government consumption 17.0 17.6 21.6 24.7 18.6Private investment 11.1 12.1 12.0 11.3 12.5Government investment 12.0 12.7 35.9 32.0 33.0Exports 15.1 15.9 5.9 6.4 7.5Imports -34.1 -34.3 -47.6 -44.9 -46.0Government incomes (% of GDP)Direct taxes 6.3 6.0 5.8 8.7 3.5Import taxes 6.4 6.2 7.0 6.9 6.9Other indirect taxes 3.3 6.3 6.0 5.9 6.1Central bank borrowing 1.2 1.4 1.1 1.1 1.1Other domestic borrowing 2.0 2.5 1.9 2.1 2.0Foreign borrowing 5.8 4.2 2.5 2.7 2.7Foreign grants 5.1 5.4 34.5 30.5 30.5Net other capital inflows and errors 0.0 0.0 0.0 0.0 0.0
Total 30.1 32.0 58.7 57.9 52.8
Foreign aid per capita (US$) (2) 16.2 18.1 79.4 66.4 66.4
Government recurrent spending (% of GDP)1st cycle primary education 1.1 1.1 2.6 3.7 1.42nd cycle primary education 0.8 0.8 1.4 1.6 1.4Secondary education 0.7 0.7 1.1 1.2 1.1Tertiary education 0.6 0.6 1.2 1.3 1.2Low-tech health 0.3 0.3 0.6 0.7 0.3Medium-tech health 0.4 0.4 0.6 0.7 0.4High-tech health 1.3 1.4 3.0 3.8 1.6Water and sanitation 0.2 0.2 0.8 0.9 0.7Public infrastructure 0.2 0.2 0.5 0.4 0.5Other government 11.6 12.0 9.9 10.5 9.9Domestic interest payments 0.2 0.7 0.5 0.5 0.5Foreign interest payments 0.8 1.1 0.6 0.7 0.7Total recurrent government spending 18.1 19.3 22.8 25.9 19.8Government capital spending (% of GDP)1st cycle primary education 0.2 0.2 0.9 1.6 0.42nd cycle primary education 0.2 0.2 0.7 0.7 0.7Secondary education 0.3 0.3 1.0 1.1 1.1Tertiary education 0.4 0.5 1.9 2.1 2.0Low-tech health 0.2 0.2 1.1 1.5 0.4Medium-tech health 0.3 0.3 1.0 1.4 0.4High-tech health 0.5 0.6 3.4 4.8 1.1Water and sanitation 0.2 0.2 2.6 3.0 2.4Public infrastructure 4.4 4.7 19.4 11.6 20.5Other government 5.2 5.5 3.7 4.0 4.0Total capital government spending 12.0 12.7 35.9 32.0 33.0Total government spending (recur. + capital) 30.1 32.0 58.7 57.9 52.8Note:1. The simulations are defined under Table 1.2. Foreign aid per capita includes allowance for aid outside the government budget. In per-capita terms, aid in the government budget was around US$11 in 2005.
2015

Table 5. Total government spending and incomes 2006-2015 (US$mn 2005)
base mdg-base mdg-infcut mdg-hdcutGovernment incomesDirect taxes 6,372.4 7,299.2 7,423.3 6,864.1Import taxes 6,517.9 8,510.5 8,018.7 8,240.3Other indirect taxes 5,042.7 5,832.8 5,500.4 5,818.5Central Bank borrowing 1,353.8 1,353.8 1,353.8 1,353.8Other domestic borrowing 2,517.1 2,517.1 2,517.1 2,517.1Foreign Borrowing 5,038.0 4,141.6 4,201.2 4,338.1Foreign grants 5,424.5 35,903.3 30,313.6 31,233.9Net other capital inflows 0.0 0.0 0.0 0.0Total 32,266.4 65,558.3 59,328.2 60,365.7
PV of foreign aid 6,789.9 30,938.1 26,297.3 26,297.3
Government recurrent spending1st cycle primary education 1,132.0 2,481.9 3,046.4 1,655.72nd cycle primary education 810.4 1,404.4 1,398.5 1,367.5Secondary education 718.2 1,105.6 1,108.4 1,080.3Tertiary education 645.9 1,084.6 1,084.4 1,070.7Low-tech health 274.4 491.2 538.3 341.6Medium-tech health 386.5 591.4 636.9 442.9High-tech health 1,387.2 2,598.3 2,870.5 1,763.8Water and sanitation 200.1 558.3 571.2 514.8Public infrastructure 208.9 456.4 357.4 447.4Other government 12,205.7 12,841.2 12,762.7 12,676.2Domestic interest payments 454.0 454.0 454.0 454.0Foreign interest payments 1,030.9 842.6 853.2 885.7Government capital spending1st cycle primary education 233.5 1,180.0 1,718.6 540.82nd cycle primary education 171.6 662.4 665.4 678.5Secondary education 334.9 1,046.6 1,051.5 1,071.6Tertiary education 461.3 1,838.5 1,846.8 1,883.3Low-tech health 205.4 989.5 1,204.9 413.8Medium-tech health 299.8 1,029.5 1,227.9 471.1High-tech health 569.2 3,019.4 3,699.3 1,229.9Water and sanitation 194.0 1,931.2 2,046.2 1,780.3Public infrastructure 4,757.1 23,853.9 15,059.0 24,387.0Other government 5,585.4 5,097.3 5,126.7 5,208.7Total government spending (recur. + capital) 32,266.4 65,558.3 59,328.2 60,365.7
total 2006-2015

Table A.1. Balance of payments in 2005 and final year by simulation (% of GDP)
2005 base mdg-base mdg-inf mdg-hdPaymentsImports 22.3 21.6 22.2 22.0 22.1Factor payments 0.2 2.2 1.7 1.7 1.8Interest payments 0.9 1.1 0.6 0.7 0.7Total 35.2 37.6 49.9 47.4 48.5
ReceiptsExports 15.1 15.9 5.9 6.4 7.5Private Transfers 8.5 10.6 6.2 6.8 6.8FDI 0.7 1.6 0.9 1.0 1.0Foreign borrowing 5.8 4.2 2.5 2.7 2.7Foreign grants 5.1 5.4 34.5 30.5 30.5Net other* 0.0 0.0 0.0 0.0 0.0Total 35.2 37.6 49.9 47.4 48.5*Net other includes changes in Central Bank reserves and exceptional financing.
Table A.2. Aggregate savings-investment balance in 2005 and final year by simulation (% of GDP)
2005 base mdg-base mdg-inf mdg-hdSavingsPrivate 13.6 14.4 14.1 13.5 14.6Government 2.9 7.9 1.1 1.1 2.3Rest of world* 6.6 2.4 32.8 28.6 28.6Total 23.1 24.8 47.9 43.3 45.5
InvestmentPublic 12.0 12.7 35.9 32.0 33.0Private 11.1 12.1 12.0 11.3 12.5Total 23.1 24.8 47.9 43.3 45.5

gov c+i pub GFCF gov cons gov c+i pub GFCF gov consCountry % of GDP % of GDP % of GDP Country % of GDP % of GDP % of GDPEritrea 65.5 21.7 43.7 Bolivia 20.8 5.4 15.4West Bank and Gaza 54.8 3.0 51.7 Uganda 20.8 5.3 15.5Mauritania 45.9 27.4 18.4 Gambia, The 20.4 7.5 12.9Botswana 44.7 11.4 33.3 Burkina Faso 20.4 7.2 13.1Grenada 38.6 21.8 16.8 South Africa 20.1 1.4 18.7Guyana 38.5 12.6 25.9 Mauritius 19.8 7.0 12.8Sao Tome and Principe 37.9 14.8 23.1 Benin 19.4 6.4 13.0Suriname 37.6 3.1 34.5 Central African Republic 19.4 7.6 11.8St. Lucia 36.9 9.9 26.9 Turkey 19.3 5.3 14.0Namibia 36.6 9.2 27.4 Burundi 19.2 4.6 14.6Antigua and Barbuda 35.7 7.4 28.3 Rwanda 18.9 6.9 12.0Seychelles 35.3 9.4 25.9 Russian Federation 18.8 1.8 17.0Nigeria 34.9 10.2 24.7 Zimbabwe 18.7 1.7 16.9St. Vincent and the Grenadines 33.3 12.0 21.2 Honduras 18.6 4.8 13.8China 31.1 17.9 13.2 Jamaica 18.4 2.1 16.3Ethiopia 30.9 11.5 19.3 Yemen, Rep. 18.3 4.3 13.9St. Kitts and Nevis 30.2 11.3 18.9 Thailand 18.1 7.0 11.2Jordan 29.4 6.7 22.7 Chad 17.7 10.1 7.6Lesotho 28.8 9.9 18.9 Mali 17.7 7.0 10.7Dominica 28.3 6.6 21.7 Ghana 17.5 6.1 11.4Congo, Rep. 27.0 8.6 18.4 Singapore 17.5 5.4 12.1Macedonia, FYR 26.9 4.6 22.4 Tanzania 17.2 7.6 9.6Malawi 26.3 8.0 18.4 Chile 16.6 4.6 12.0Belize 25.6 12.9 12.7 Egypt, Arab Rep. 16.0 5.7 10.3Algeria 25.5 10.2 15.3 Cambodia 16.0 10.2 5.8Croatia 25.4 4.4 21.0 Trinidad and Tobago 15.9 4.7 11.2Mozambique 25.3 14.3 11.0 Mexico 15.4 3.3 12.1Morocco 25.1 5.0 20.1 Uruguay 15.3 2.5 12.9Barbados 24.9 8.2 16.7 Dominican Republic 15.2 7.0 8.3Sierra Leone 24.8 5.2 19.6 Albania 14.7 6.2 8.5Zambia 24.8 11.8 13.0 Venezuela, RB 14.6 6.5 8.1Syrian Arab Republic 24.1 12.9 11.2 Tajikistan 14.1 5.4 8.7Comoros 24.0 4.8 19.3 Lebanon 14.0 1.2 12.9Kenya 23.8 4.6 19.1 Cameroon 13.6 1.6 12.1Cape Verde 23.7 11.7 12.0 El Salvador 13.5 3.4 10.1Iran, Islamic Rep. 23.3 8.8 14.6 Argentina 13.1 0.9 12.2Nicaragua 22.7 6.8 15.9 Madagascar 13.0 4.8 8.2Swaziland 22.6 5.9 16.6 Paraguay 11.8 4.1 7.7Guinea-Bissau 22.5 9.6 12.8 Guinea 11.6 4.0 7.5Senegal 22.3 7.9 14.5 Cote d'Ivoire 10.8 3.2 7.7Serbia and Montenegro 21.9 3.6 18.3 Togo 9.8 1.4 8.4Niger 21.0 8.8 12.2 Congo, Dem. Rep. 3.9 0.1 3.8Source: World Bank, Development Data Platform, July 2005
Table A.3. Government consumption and investment as shares of GDP, available countries, 2002 (%)

Figure 1. MDG 1: Share of Population Living on $1 (PPP) per day or less (%).
0
5
10
15
20
25
30
35
40
2005 2006 2007 2008 2009 2010 2011 2012 2013 2014 2015
basemdg-basemdg-infcutmdg-hdcut
Figure 2. MDG 2: Net Primary School Completion Rate (%).
0
20
40
60
80
100
120
2005 2006 2007 2008 2009 2010 2011 2012 2013 2014 2015
basemdg-basemdg-infcutmdg-hdcut
Figure 3. MDG 4: Under-Five Mortality Per 1,000 Live Births.
0
20
40
60
80
100
120
140
160
180
2005 2006 2007 2008 2009 2010 2011 2012 2013 2014 2015
basemdg-basemdg-infcutmdg-hdcut

Figure 4. MDG 5: Maternal Mortality per 100,000 Live Births.
80
180
280
380
480
580
680
2005 2006 2007 2008 2009 2010 2011 2012 2013 2014 2015
basemdg-basemdg-infcutmdg-hdcut
Figure 5. MDG 7a: Share of population with access to improved water (percent).
0
10
20
30
40
50
60
70
2005 2006 2007 2008 2009 2010 2011 2012 2013 2014 2015
basemdg-basemdg-infcutmdg-hdcut
Figure 6. MDG 7b: Share of population with access to improved sanitation (percent).
0
10
20
30
40
50
60
2005 2006 2007 2008 2009 2010 2011 2012 2013 2014 2015
basemdg-basemdg-infcutmdg-hdcut

Figure 7. Absorption (Gross National Expenditure) (Index 2005 = 100).
80
100
120
140
160
180
200
220
240
2005 2006 2007 2008 2009 2010 2011 2012 2013 2014 2015
basemdg-basemdg-infcutmdg-hdcut
Figure 8. Real GDP at market prices (Index 2005 = 100).
80
90
100
110
120
130
140
150
160
170
180
2005 2006 2007 2008 2009 2010 2011 2012 2013 2014 2015
basemdg-basemdg-infcutmdg-hdcut
Figure 9. Private Consumption (Index 2005 = 100).
80
90
100
110
120
130
140
150
160
170
180
2005 2006 2007 2008 2009 2010 2011 2012 2013 2014 2015
basemdg-basemdg-infcutmdg-hdcut

Figure 10. Government Consumption (Index 2005 = 100).
80
100
120
140
160
180
200
220
240
260
2005 2006 2007 2008 2009 2010 2011 2012 2013 2014 2015
basemdg-basemdg-infcutmdg-hdcut
Figure 11. Private Investment (Index 2005 = 100).
80
100
120
140
160
180
200
220
240
2005 2006 2007 2008 2009 2010 2011 2012 2013 2014 2015
basemdg-basemdg-infcutmdg-hdcut
Figure 12. Government Investment (Index 2005 = 100).
0
100
200
300
400
500
600
700
2005 2006 2007 2008 2009 2010 2011 2012 2013 2014 2015
basemdg-basemdg-infcutmdg-hdcut

Figure 13. Exports (Index 2005 = 100).
0
20
40
60
80
100
120
140
160
2005 2006 2007 2008 2009 2010 2011 2012 2013 2014 2015
basemdg-basemdg-infcutmdg-hdcut
Figure 14. Imports (Index 2005 = 100).
0
50
100
150
200
250
300
350
2005 2006 2007 2008 2009 2010 2011 2012 2013 2014 2015
basemdg-basemdg-infcutmdg-hdcut
Figure 15. Real Exchange Rate (Index 2005 = 100).
60
65
70
75
80
85
90
95
100
105
110
2005 2006 2007 2008 2009 2010 2011 2012 2013 2014 2015
basemdg-basemdg-infcutmdg-hdcut

Figure 16. Present Value of Foreign Aid 2006-2015 (2005 US$ bn)
6.8
30.9
26.3 26.3
0
5
10
15
20
25
30
35
base mdg-base mdg-infcut mdg-hdcut Figure 17. Foreign Aid Per Capita (2005 US$)
0
10
20
30
40
50
60
70
80
90
2005 2006 2007 2008 2009 2010 2011 2012 2013 2014 2015
basemdg-basemdg-infcutmdg-hdcut
Figure 18. Workers with less than Secondary-School Education (millions).
20
25
30
35
40
45
2005 2006 2007 2008 2009 2010 2011 2012 2013 2014 2015
basemdg-basemdg-infcutmdg-hdcut

Figure 19. Secondary-School Educated Workers (millions).
2.0
2.2
2.4
2.6
2.8
3.0
3.2
3.4
3.6
3.8
4.0
2005 2006 2007 2008 2009 2010 2011 2012 2013 2014 2015
basemdg-basemdg-infcutmdg-hdcut
Figure 20. Workers with more than Secondary-School Education (millions).
0.15
0.17
0.19
0.21
0.23
0.25
0.27
0.29
2005 2006 2007 2008 2009 2010 2011 2012 2013 2014 2015
basemdg-basemdg-infcutmdg-hdcut
Figure 21. Stock of Private Capital (Index: 2005 = 100).
80
90
100
110
120
130
140
150
160
170
2005 2006 2007 2008 2009 2010 2011 2012 2013 2014 2015
basemdg-basemdg-infcutmdg-hdcut

Figure 22. Wage for Workers with Less Than Secondary-School Education (Index 2005 = 100).
80
90
100
110
120
130
140
150
1 2 3 4 5 6 7 8 9 10 11
basemdg-basemdg-infcutmdg-hdcut
Figure 23. Wage for Workers with Secondary-School Education (Index 2005 = 100).
80
85
90
95
100
105
110
115
120
125
2005 2006 2007 2008 2009 2010 2011 2012 2013 2014 2015
basemdg-basemdg-infcutmdg-hdcut
Figure 24. Wage for Workers with more than Secondary-School Education (Index 2005 = 100)
80
90
100
110
120
130
140
2005 2006 2007 2008 2009 2010 2011 2012 2013 2014 2015
basemdg-basemdg-infcutmdg-hdcut

Figure 25. Rent for Private Capital (Index 2005 = 100).
90
95
100
105
110
115
2005 2006 2007 2008 2009 2010 2011 2012 2013 2014 2015
basemdg-basemdg-infcutmdg-hdcut