Embed Size (px)
Citation preview

Peter Nijkamp • Adam Rose • Karima KourtitEditors
Regional Science Matters
Studies Dedicated to Walter Isard

EditorsPeter NijkampKarima KourtitDepartment of Spatial EconomicsVU UniversityAmsterdamThe Netherlands
Adam RoseUniversity of Southern California Price Schoolof Public Policy
Los AngelesCA, USA
ISBN 978-3-319-07304-0 ISBN 978-3-319-07305-7 (eBook)DOI 10.1007/978-3-319-07305-7Springer Cham Heidelberg New York Dordrecht London
Library of Congress Control Number: 2014955456
# Springer International Publishing Switzerland 2015This work is subject to copyright. All rights are reserved by the Publisher, whether the whole or partof the material is concerned, specifically the rights of translation, reprinting, reuse of illustrations,recitation, broadcasting, reproduction on microfilms or in any other physical way, and transmission orinformation storage and retrieval, electronic adaptation, computer software, or by similar or dissimilarmethodology now known or hereafter developed. Exempted from this legal reservation are brief excerptsin connection with reviews or scholarly analysis or material supplied specifically for the purpose of beingentered and executed on a computer system, for exclusive use by the purchaser of the work. Duplicationof this publication or parts thereof is permitted only under the provisions of the Copyright Law of thePublisher’s location, in its current version, and permission for use must always be obtained fromSpringer. Permissions for use may be obtained through RightsLink at the Copyright Clearance Center.Violations are liable to prosecution under the respective Copyright Law.The use of general descriptive names, registered names, trademarks, service marks, etc. in thispublication does not imply, even in the absence of a specific statement, that such names are exemptfrom the relevant protective laws and regulations and therefore free for general use.While the advice and information in this book are believed to be true and accurate at the date ofpublication, neither the authors nor the editors nor the publisher can accept any legal responsibility forany errors or omissions that may be made. The publisher makes no warranty, express or implied, withrespect to the material contained herein.
Printed on acid-free paper
Springer is part of Springer Science+Business Media (www.springer.com)
Contents
1 Regional Science: What Matters? Which Matters? . . . . . . . . . . . . . 1
Peter Nijkamp, Adam Rose, and Karima Kourtit
Part I Spatial Systems Analysis
2 The Spatial Economy: A Holistic Perspective . . . . . . . . . . . . . . . . . 15
Peter Nijkamp and Waldemar Ratajczak
3 Interregional and International Trade: Different Causes,
Different Trends? . . . . . . . . . . . . . . . . . . . . . . . . . . . . . . . . . . . . . . 27
Paul Krugman
4 Refining the Isard Multiregional Input–Output Model:
Theory, Operationality and Extensions . . . . . . . . . . . . . . . . . . . . . . 35
Jiyoung Park and Harry W. Richardson
5 Time in Economic Theory . . . . . . . . . . . . . . . . . . . . . . . . . . . . . . . . 55
Ake E. Andersson
6 The Regional Density Function and the Definition of Regional
Boundaries . . . . . . . . . . . . . . . . . . . . . . . . . . . . . . . . . . . . . . . . . . . 71
John B. Parr and Darryl Holden
7 German Roots of Regional Science . . . . . . . . . . . . . . . . . . . . . . . . . 87
Johannes Brocker
Part II Regional Growth and Distribution
8 The Process of Regional Economic Growth: A Case Study
of Washington State . . . . . . . . . . . . . . . . . . . . . . . . . . . . . . . . . . . . 107
Richard S. Conway Jr
9 Integration, Contagion, and Income Distribution . . . . . . . . . . . . . . 131
Iwan J. Azis
10 Spatial Impact of Transportation Infrastructure: A Spatial
Econometric CGE Approach . . . . . . . . . . . . . . . . . . . . . . . . . . . . . 163
Zhenhua Chen and Kingsley E. Haynes
v

Integration, Contagion, and IncomeDistribution 9Iwan J. Azis
Abstract
The 2008/2009 global financial crisis and the unprecedented policy response in
advanced economies have a worldwide impact. The episode also led many to
question the standard framework of economic thinking on regional integration,
financial liberalization and their repercussions on income disparity. The paper
argues that one needs to take a balanced view on integration—not just the
benefits but also the risks. If regional integration leads to greater inequality,
the expected growth and prospect of improved welfare can be diminished.
Utilizing a general equilibrium framework, it is also shown how financial
liberalization and the surge of capital inflows can produce not only financial
instability but also worsening income disparity. By combining model-based
results and theory-based ranking applied to the Asian case, and considering the
benefits, opportunities, costs and risks of alternative policies, it is revealed that
imposing levy on bank-led flows can be used to reduce instability and inequality.
This type of macro-prudential policy reflects a departure from the ‘First Best’ to
the ‘Second Best’ approach of liberalization, where the frictionless outcome of
the former is seriously questioned.
9.1 Introduction
Whether we understand it or not, what began the latter part of last decade is
changing global economic thinking. The subprime crisis, the resultant collapse of
Lehman Brothers in the United States (US), and the subsequent Eurozone crisis
humbled economists and regional scientists. Given that these two are the world’s
biggest, most advanced economies, it is not difficult to imagine the extent of
I.J. Azis (*)
Asian Development Bank, and former professor and director of graduate study,
Regional Science program, Cornell University, Ithaca, USA
e-mail: [email protected]; [email protected]
P. Nijkamp et al. (eds.), Regional Science Matters, DOI 10.1007/978-3-319-07305-7_9,# Springer International Publishing Switzerland 2015
131
repercussions on the rest of the world not only in terms of macroeconomic impact
but also on income inequality. The crisis also put the standard framework of
economic thinking on the spot, where the validity of some fundamental concepts
is now questioned. Three stand out: (1) the virtue of integration; (2) the risks of
financial liberalization; and (3) how finance affects income inequality.
To deal with the first, I revisit the concept of regional integration by taking a
more balanced view—not just the benefits but also the risks of integration. On the
second and third, I offer a model to show the mechanism how seemingly unrelated
financial phenomena are in fact closely interlinked with income inequality. I use the
case of capital flows intermediated by banks (bank-led flows) in emerging Asia,
given their importance to a region where integration has been accelerating since the
late 1990s. Capital inflows helped the financial sector grow, but it can also increase
the risk of instability and worsen the income inequality.
9.2 Regional Integration Revisited
9.2.1 Benefits and Opportunities of Integration
Proposition 1 Regional integration expands markets and input sources, better
allocating resources across the region and accelerating economic growth.
Regional economic integration is used by countries to achieve national interests—
only this time in concert with others. It expands national markets to the region.
Like globalization, it can be thought of as an alternative to international
embeddedness—or how one relates to the rest of the world. But unlike global-
ization, regional integration is geographical, and in some cases political.1 It is
institutionally stronger than globalization, as rules tend to be tighter and peer
pressure can be more intense.
Expanding markets and input sources beyond national boundaries is one of the
most compelling arguments for integration. With an expanded market for goods and
services, for both output and inputs, higher economic growth and improved welfare
can be expected (Fig. 9.1). Integration helps more efficient resource allocation
across the region (or globally) in line with the principle of comparative advantage.
If, as a result, productivity growth is enhanced, regional integration can accelerate
economic growth and increase employment.
Asia’s strong economic performance and resilience despite the recent global
financial crisis was largely supported by the region’s openness. The drop in external
demand from Europe and the US, the ‘traditional’ market for Asia’s final goods
1When integration is promoted for political reasons and to build trust, the political windfall that
follows can also lead to significant economic benefits.
132 I.J. Azis
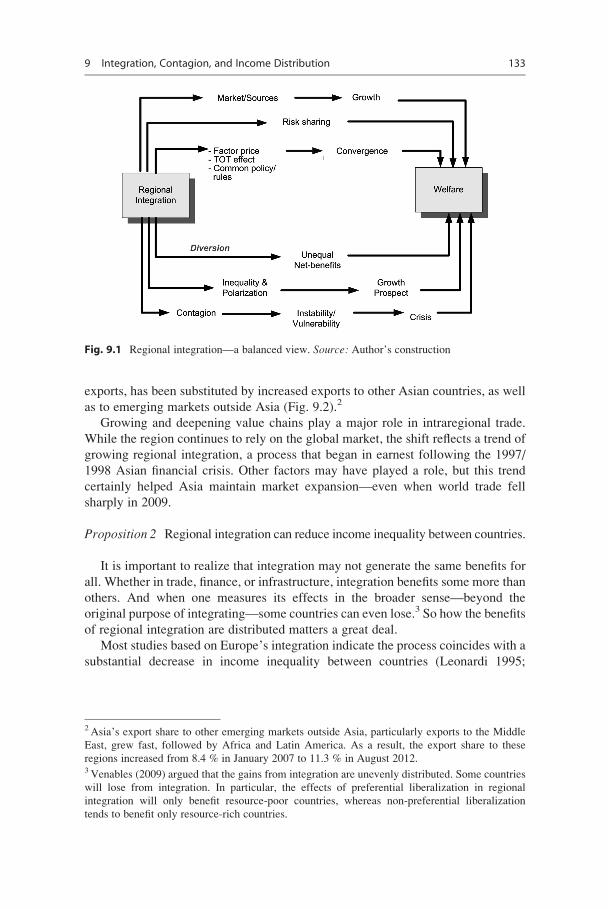
exports, has been substituted by increased exports to other Asian countries, as well
as to emerging markets outside Asia (Fig. 9.2).2
Growing and deepening value chains play a major role in intraregional trade.
While the region continues to rely on the global market, the shift reflects a trend of
growing regional integration, a process that began in earnest following the 1997/
1998 Asian financial crisis. Other factors may have played a role, but this trend
certainly helped Asia maintain market expansion—even when world trade fell
sharply in 2009.
Proposition 2 Regional integration can reduce income inequality between countries.
It is important to realize that integration may not generate the same benefits for
all. Whether in trade, finance, or infrastructure, integration benefits some more than
others. And when one measures its effects in the broader sense—beyond the
original purpose of integrating—some countries can even lose.3 So how the benefits
of regional integration are distributed matters a great deal.
Most studies based on Europe’s integration indicate the process coincides with a
substantial decrease in income inequality between countries (Leonardi 1995;
Fig. 9.1 Regional integration—a balanced view. Source: Author’s construction
2Asia’s export share to other emerging markets outside Asia, particularly exports to the Middle
East, grew fast, followed by Africa and Latin America. As a result, the export share to these
regions increased from 8.4 % in January 2007 to 11.3 % in August 2012.3 Venables (2009) argued that the gains from integration are unevenly distributed. Some countries
will lose from integration. In particular, the effects of preferential liberalization in regional
integration will only benefit resource-poor countries, whereas non-preferential liberalization
tends to benefit only resource-rich countries.
9 Integration, Contagion, and Income Distribution 133

Armstrong 1995).4 While economic factors are important, it is political integration
that appears to drive convergence. Institutional forces outweigh market forces in
drawing national economies closer together (Beckfield 2009). Economic arguments
show freer trade and factor mobility from integration allow less-developed
members to grow faster than more-developed ones. Factor price equalization
further supports the convergence hypothesis (Stolper and Samuelson 1941). In a
two-country resource-rich/resource-poor model, lowering tariffs has a negative
effect on real wages in the resource-rich country (most gains accrue to resource
rent), while the resource-poor country benefits through terms-of-trade. This also
supports the convergence hypothesis.
However, an institutionalist economic explanation emphasizes more the formal
structure and role actors play in integration initiatives. It suggests that as economic
actors follow common rules in a more integrated system, and markets increase in
size and complexity, convergence will likely result. It also stresses the importance
of politically established institutions. Thus, to analyze convergence, political
relations matter more than regional markets or economic development. Conver-
gence can come from the diffusion of common development policies and the
diffusion of common rules and market regulations.
Fig. 9.2 Increasing Intra-Asian exports
4 Evidence from Cross-Sectional Analysis of the Regional Growth Process within the European
Union is shown in Armstrong (1995); and Ben-David (2001). Some, however, found a pattern of
divergence; see Slaughter (2001); Arestis and Paliginis (1995). Part of the explanation rests on the
interpretation of σ- and β-convergence (Martin 1996), where σ-convergence is a decrease in GDP
dispersion, hence showing how the distribution of income evolves, and β-convergence points to a
negative relationship between growth and initial level of GDP.
134 I.J. Azis

In Asia’s case, convergence is also detected; inequality between countries has
been declining (Fig. 9.3). Whether this is due to regional integration or other
factors—or both—remains to be studied. Regardless, the theoretical arguments
above are likely part of the reason. This has an important meaning since the goal
of integration is fundamentally different than in Europe. Regional integration in
Asia has not been based on a singular fixed set of beliefs. It is more market-driven,
facilitated by unilateral investment and trade-enabling policies that change in
different times (flexible), and with awareness of different level of development in
different countries. While achieving “United States of Europe” is the goal in the
European integration, the implicit goal of Asian integration is to manage the
diversity.5 The deliberate act of forging a common platform including forming
regional institutions and inter-governmental organizations after the 1997/1998
Asian Financial Crisis does not negate such a goal.
Fig. 9.3 Gini coefficient index
5 Recent comment by Vice President of the European Commission, Vivane Reding, who is the
longest serving Brussels commissioner, is simply a re-confirmation. She called for the EU
(European Union) to become a “United States of Europe as the best weapon against the Euro-
skeptics.” She further argued that “We need to build a United States of Europe with the Commis-
sion as government and two chambers. . .. . .. . .. . .,” implying that individual sovereignty would be
a thing of the past.
9 Integration, Contagion, and Income Distribution 135

Proposition 3 Risk sharing is another possible benefit of integration; unfortunately,
there is little empirical evidence that it happens.
Intuitively, risk sharing through integration makes sense. But many empirical
studies show integration has a limited effect on the degree of risk sharing. Since the
work of Backus et al. (1992), there have been several studies examining the
presence of full risk sharing using cross-country income and consumption
correlations. Most of them found that perfect risk sharing does not happen. Asia
is no exception. Given an idiosyncratic shock, risk sharing was neither strong, nor
did it improve.
What causes this mismatch? Based on numerous cross-country studies, it could
stem from several factors, ranging from using domestic equity markets as a major
source of finance (French and Poterba 1991), to time horizon and measurement
errors (Canova and Ravn 1996), to consumption endowment uncertainty (Obstfeld
1994; Mendoza 1995), to the limited size of capital flows and higher sovereign
default (Bai and Zhang 2005).
The effect of financial integration on economic growth has been well
documented—more so than the effect of integration on risk sharing (Levine
2001). Theoretically, the consumption growth rate in integrating countries will be
cross-sectionally independent of idiosyncratic variables as financial integration
increases (Cochrane 1991). The key factor is greater insurance. If inter-regional
or international capital markets are well integrated, countries can insure against
Fig. 9.4 Intra-Asian portfolio investment
136 I.J. Azis

idiosyncratic shocks. Individuals will invest more in high-risk and high-return
assets if the risk can be shared or diversified (Obstfeld 1994).
Asia’s financial integration is increasing, especially since the 2008/2009 global
financial crisis, but remains limited (Fig 9.4). Using several welfare measures and
alternative risk sharing scenarios, Azis (2007) concludes that “. . ..while the level ofEast Asian financial integration may have increased, its benefits in terms of
consumption and investment risk sharing have been limited. Even the advantage
of having greater resilience to [an] external shock, that could be potentially reaped
from greater synchronization of business cycles, has not been evident.” In an IMF
Working Paper, Borensztein and Loungani (2011) also conclude that intraregional
risk sharing in Asia is low. For a given degree of contagion risk exposure, the US
stands out as the one that reaps the most benefit from sharing risks with Asia. The
study suggests that the region should work toward increasing risk sharing without
exposing countries to greater contagion risks: “pursuing these regional policy
avenues should receive a priority over a push for further overall financial inte-
gration whose welfare effect may be ambiguous.”
All in all, while the level of Asia’s financial integration may have increased, its
benefits in terms of consumption and investment risk sharing have been limited.
Although the concept of integration-driven risk sharing is ideal and conceptually
sound,6 the impact of regional integration must be predicated not on an ideal world,
but on the world as it is.
9.2.2 Costs and Risks of Integration
When regional initiatives are launched to strengthen integration—for example, those
that boost infrastructure connectivity, risk sharing, and market liberalization—
we hear more of its benefits. Far less is heard on the risks of integration.
Proposition 4 The cascading effect of the Eurozone crisis was a vivid reminder of
the contagion risk of highly integrated systems.
The main argument against excessive integration is that it exacerbates contagion
in times of crisis. Examples abound of financial crises rapidly spreading from one
country to another, especially when integration is deeper due to either geographical
proximity or a regional arrangement.
While a shock may originate in the financial sector of one country, it can rapidly
infect others across a region—affecting entire economies and damaging people’s
welfare. For Asia, the damage caused by the 1997/1998 Asian financial crisis is a
6Under certain circumstances, however, Stiglitz (2010) shows that risk sharing can be unfavor-
able. While the more integrated the regional economy the better risks can be dispersed, risk sharing
can lower expected utility when the standard assumption of convexity and concave utility function
does not hold. In particular, this is true when technologies are not convex. Following this dictum,
and given the fact that information, externalities, and learning processes may give rise to a natural
set of non-convexities, the intuition that integration should be desirable is not always accurate.
9 Integration, Contagion, and Income Distribution 137

powerful reminder of the danger of contagion. An idiosyncratic shock, an exchange
rate collapse followed by widespread financial crisis occurring in Thailand, leaped
across boundaries, devastating economies of Indonesia, Malaysia, and the Republic
of Korea. And yet the scale of integration in Asia at the time was more limited than
now, despite some policy convergence. One can only imagine how much worse the
crisis would have been had intra-Asian cross-border financial holdings had been
larger than they were.
In adopting a single currency, the risks of integration cannot be overemphasized.
Many studies prior to the formation of euro emphasized the benefits and
opportunities of a single currency. This could be true for Asia as well. But when
critical preconditions are not in place, and a desirable sequence is not followed (for
example, political before economic integration), forcing a single currency on a
group of countries can be risky—and costly as in the Eurozone today. Taking
account of these risks and costs—some of which are intangible—a single currency
remains a long-term prospect for Asia. Even after running some sensitivity tests, the
outcome is the same (Azis 2009). Clearly, it could be counterproductive to focus on
potential benefits while neglecting the risks and costs of a single currency in
promoting regional integration.
Proposition 5 Trade diversion is another potential risk from regional integration,
potentially detrimental to welfare.
Trade diversion is a classic integration risk debated among academics and policy
makers alike.7 It often occurs under free trade agreements (FTAs), when reduced
tariffs give a less efficient producer under the FTA comparative advantage over a
more efficient competitor outside. In Asia, the South Asia Free Trade Area is a
notable example. Given relatively high levels of protection in the region, many
predicted the risk of trade-diversion would be high (Baysan et al. 2006). This could
be minimized, however, if regional integration was driven by unilateral and multi-
lateral liberalization.8 When geographical agglomeration effects are also at work,
regional integration produces unequal net benefits; development takes place in a
few rather than in all.
Proposition 6 Integration tends to increase inequality within countries
In a report by the Commission on the Measurement of Economic Performance
and Social Progress, Stiglitz et al. (2010) viewed inequalities as the first cross-
cutting challenge for quality-of-life indicators. They argued that inequalities should
be assessed comprehensively by examining differences in the quality of life—
across people, groups, and generations.
7 A customs union is a form of regional integration likely to cause the largest trade diversion,
where effects are distributed unequally.8 The trade-off between trade creation and trade diversion is often used to back north-south FTAs.
South-south FTAs are more prone to trade diversion.
138 I.J. Azis

Unlike the relation between regional integration and income inequality betweenmember countries, the relation between regional integration and income inequality
within countries is based on the idea that market competition and the labor/capital
balance of power is a key determinant of income inequality. Unfortunately, there
are few empirical studies on this; and most relating to European integration. They
argue that economic integration tends to create a larger labor market and increase
wage competition between workers (Western 1997). With workers exposed to
competition beyond national boundaries, their bargaining power weakens—either
through unions losing influence or by other means. In this case, further integration is
expected to increase internal inequality (Alderson and Nielsen 2002).
So what is the difference between the impact of globalization and regional
integration, as both give rise to increased market competition? Labor markets expand
more readily and labor is more competitive within regions than between regions.
Consequently, firms can more easily exercise control over subsidiaries within than
between regions. Also, political institutions are more similar within than between
regions. So one can hypothesize that regional integration would likely reduce the
power of labor unions, and thus have a more pronounced effect on income inequality.
In some cases, more developed institutions (like in Western Europe) can insulate
workers from the pressures of international competition (Cameron 1978). Strong
welfare states with generous unemployment benefits and training programs can help
stabilize the national economy against the vicissitudes of international markets, such
that worsening inequality can be averted when regional integration increases.
Most empirical evidence on this is based on Europe’s integration. The welfare
state shapes stratification directly through income transfers, and can reduce inequal-
ity and poverty. But European integration also limited individual government
intervention. In addition, there was some retrenchment of Western European
welfare states through spending limits imposed by the “convergence criteria” of
the 1992 Maastricht treaty (Brady 2003). Thus, more limited national autonomy
due to regional integration contributes to the shrinking of the welfare state, one
consequence of which is greater income inequality.
In Asia, inequality within most countries has been rising (ADB 2012) alongside
economic integration. This does not imply causality, however. With limited inte-
gration compared with Europe, it is hard to positively link the two. Deepening
regional cooperation to remove barriers to trade and finance, and to further de-
regulate markets (“negative integration”) can have a stronger impact than those
from regulations designed to correct market failures (“positive integration”). This
has happened in Europe,9 and there is no reason it cannot happen in Asia as well.
When it does, inequality and polarization within countries may worsen.
9 The convergence effect of regionalization on between-country income inequality in Europe
outweighs the polarizing effect of regionalization on within-country inequality, such that the net
total income inequality has declined. In other words, regional integration has a positive net effect
on reducing total income inequality (Scharpf 1997).
9 Integration, Contagion, and Income Distribution 139

Unlike in the past, it is now widely acknowledged that income and wealth
inequality clearly inhibits future growth [see, among others, Nissanke and
Thorbecke (2010)]. Inequality is often associated with inadequate property rights,
lowering investment. This is common knowledge. But the uncertainty created by
the diffusion of political and social instability caused by inequality also tends to
raise rent-seeking and dampens investment. All this challenges the standard
argument for Kuznets’ U-hypothesis.10 Thus, if regional integration does lead to
greater inequality within a country, growth and the prospect of improved welfare is
diminished.
9.2.3 Welfare as the Goal and the Importance of Unilateral Policies
Like any policy and strategy, the goal of integration must be an improvement in
welfare and quality-of-life—especially for the largest segment of society. Indeed,
welfare measures must go beyond just consumption-based utility. Take trade
integration. The volume and composition of trade are standard indicators in
evaluating whether or not an FTA advances regional integration. But this is just
part of the story. How those indicators change will either improve or weaken some
socio-economic indicators matters as well. While these may not be on the FTA
agenda, they must be taken into account from the perspective of overall develop-
ment. Ignoring them could lead to misguided policies.
The policy response to a crisis caused by integration-driven contagion can
damage welfare, especially when governments are belt-tightening. According to
one Organisation for Economic Co-operation and Development (OECD) report,
some 20 million jobs in both developed and developing countries disappeared since
the 2008/2009 global financial crisis and 21 million jobs must be generated in G20
countries just to match the pre-crisis employment rate.11 The report also says this is
impossible in the near term. If anything, there is a risk the unemployment rate could
increase. In a crisis, a crippled financial sector is bad enough; but nothing is worse
than the true crisis costs to welfare when speaking about the risk of integration.
The environmental impact of a contagion-driven crisis poses another serious
welfare risk. While a crisis can reduce pollution and resource consumption through
reduced economic activity, a weakened economy also tends to lower environmental
priorities.
While collective regional policies have their merit, unilateral policies can benefit
both individual countries and the region. It may be true that some collective
regional policies are superior to unilateral national policies. But that does not
10 Inequality can also affect poverty by way of determining the growth-poverty elasticity. Added
by the well-known effect of growth on poverty, a triangular relation between growth, inequality,
and poverty is established [see (Bourguignon 2004)].11 OECD and International Labour Organization (ILO) 2012. Joint statement by ILO Director-
General Juan Somavia and OECD Secretary-General Angel Gurrıa on the occasion of the G20
Labour and Employment Ministers Meeting. Guadalajara, Mexico, 17 May.
140 I.J. Azis

mean unilateral policies cannot, in fact, do the job better. The East Asia Miracle of
the 1980s and early 1990s is testament to the value of unilateral liberalization. To
say that without integration something bad will happen is farfetched. To argue the
entire region will only benefit by joining an integration initiative or agreeing on
some regional agenda is equally erroneous. Even without the risks of integration
discussed earlier, this is the wrong way to think.
Countries commit to a regional agenda because it is to their national advantage.
It expands opportunities, and allows them to allocate their own resources more
efficiently. If they fail to see this and decide not to participate, nothing disastrous
will happen. This is of course very different from a global commons like climate
change.
If unilateral policies improve a country’s economic performance, it is not
difficult to imagine some positive spillover effects on the regional economy. In
trade and financial integration, for example, if countries adopt policies that are good
for themselves even without signing up for a regional initiative, their economic
growth could become more robust and stable, which by itself also helps the region.
Thus, national policies are key. But they are also important in maintaining the
integrity of those domestic institutions required for effective regional initiatives.
Even in today’s more globalized world, nations remain dominant, and democratic
deliberation is largely organized around them. Each country has the right to create
and protect its own regulations and institutions. For regional integration to work,
there must be sufficient national or domestic policy space to maintain the integrity
of domestic institutions.12 Policy space, when filled in with the right measures, can
advance the regional economy. The key principle is clarity and transparency—that
the unilateral policy and national deliberation are based on facts and evidence for
improving welfare. The cooperation agenda for regional integration can then focus
on the rules and monitoring that ensure more effective implementation, while
minimizing negative spillovers (as a safeguard). This approach can also improve
the quality of national deliberations, making them more effective in boosting
welfare.
9.3 Integration-Driven Capital Flows and Income Inequality
9.3.1 Liberalization and Capital Flows in Post-GFC
Financial sector liberalization (FSL) has been widely promoted as a way to better
allocate capital and widens opportunities for savers and investors. It also creates an
environment conducive to financial innovation. Some argue that FSL helps build
discipline among policy makers in securing macroeconomic stability.
This has been the predominant thinking until recently. One of its most
important—yet controversial—components is capital account liberalization
12A similar principle can also be applied to the concept of globalization; see Rodrik (2011).
9 Integration, Contagion, and Income Distribution 141

(KAL). Capital flows resulting from KAL are channeled through domestic
intermediaries—either by banks or firms—allowing greater competition and thus
more efficiency. Indeed, countries adopting KAL often see a sudden jump in
economic growth as they move away from financial repression. Yet, many of
them, developing and developed countries alike, subsequently face instability,
with some falling into financial crisis.13
Most analysts essentially defended KAL by citing the lack of preconditions for
liberalization to explain why crises emerge. They blamed institutional factors such
as corruption, weak enforcement, and limited understanding about how a
liberalized financial sector operates. Policy recommendations thus centered on
fixing those institutional factors, never questioning the virtue of KAL itself. Then
came the 2007/2008 shock in the US, followed by the Eurozone crisis. Institutional
factors in both economies were supposedly strong, well above those in many
emerging markets. Obviously, the early analytical findings went out the window.
Only recently have analysts and scholars admitted early preaching on FSL and
KAL was flawed [see, for example, CIEPR (2012)]. They now admit that the “First
Best” approach of financial liberalization—where frictionless outcomes are
emphasized—is faulty and should be replaced by a “Second-Best” approach in
which financial regulation is given far greater importance, and where capital
controls are no longer taboo. After decades of preaching the virtues of cross-
border capital flows, the IMF finally admitted that some restrictions on capital
flows can help protect an economy from financial turmoil. Central to the analysis is
the need to maintain financial stability and macroprudential policy (IMF 2012).
The post-crisis low interest rate policy in advanced economies led to massive
capital flows, most of which wound up in emerging markets, threatening their
financial stability.14 The resulting exchange rate pressure forced frequent market
intervention to maintain trade competitiveness. But the problem does not end here.
New financial vulnerability was created through bank-led inflows.
With additional funds flowing in from inexpensive sources (non-core or
non-deposits), banks were more willing to take risks. Without foreign exchange
market intervention, inflow-induced currency appreciation bolsters the balance-
sheet of borrowers. And if used to augment bank loans, they can stimulate the
economy to offset the fall in exports.15 The problem arises when deleveraging or a
13 In the 1990s alone, financial crisis struck Europe (1992/1993), Mexico/Latin America (1994),
Asia (1997), Eastern Europe and Russia (1998). The recent global financial crisis began in the US
and Europe. Crisis contagion has also become less regional and more global. Technology and
information enable financial spillovers by reducing structural distance.14Most analysis suggests the easy money policy in advanced economies was less effective than
originally thought. The policy not only failed to strengthen recovery in the US and other advanced
economies, but also provoked global monetary instability through capital flows, including those
led by “carry traders,” who exploit interest rate differentials across countries. See
Mckinnon (2012).15 The amplified effect of cross-border flows on the supply of credit due to the changing risk
behavior of banks is shown in Valentina and Shin (2012).
142 I.J. Azis
change in investor sentiment, for example, reverses the direction of capital flows.
Loans can be disrupted, and the economy suffers a credit crunch. This occurred
recently when European banks deleveraged by bringing back funds to strengthen
their capital position.16 On the other hand, a rising share in non-core liabilities can
also alter bank behavior toward more risk-taking—for example by investing in
securities and other risky financial assets. Indeed, data show this has already
happened in some countries. Either way, increased bank-led inflows creates greater
vulnerability. Only when recipient banks prudently manage and use new funds will
the overall outcome be favorable.
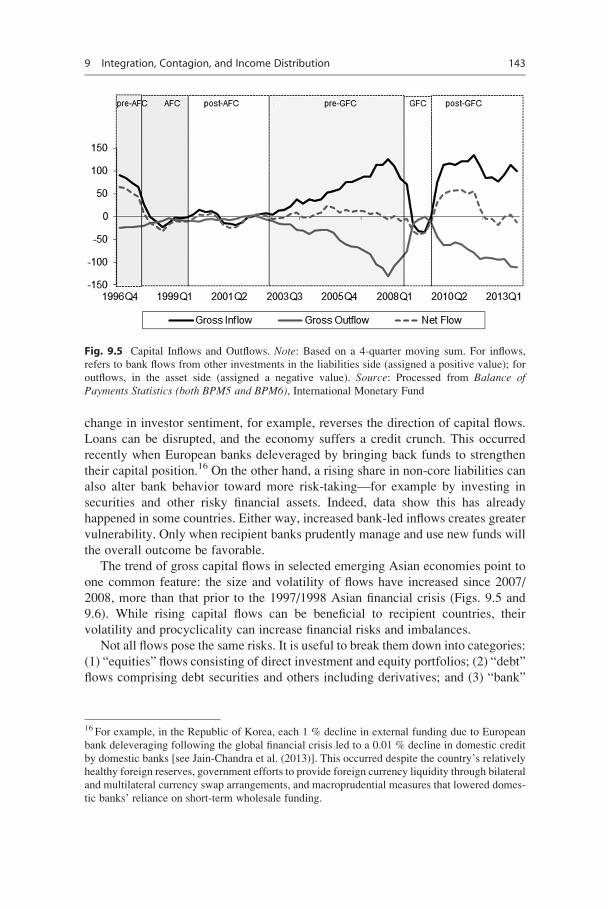
The trend of gross capital flows in selected emerging Asian economies point to
one common feature: the size and volatility of flows have increased since 2007/
2008, more than that prior to the 1997/1998 Asian financial crisis (Figs. 9.5 and
9.6). While rising capital flows can be beneficial to recipient countries, their
volatility and procyclicality can increase financial risks and imbalances.
Not all flows pose the same risks. It is useful to break them down into categories:
(1) “equities” flows consisting of direct investment and equity portfolios; (2) “debt”
flows comprising debt securities and others including derivatives; and (3) “bank”
Fig. 9.5 Capital Inflows and Outflows. Note: Based on a 4-quarter moving sum. For inflows,
refers to bank flows from other investments in the liabilities side (assigned a positive value); for
outflows, in the asset side (assigned a negative value). Source: Processed from Balance ofPayments Statistics (both BPM5 and BPM6), International Monetary Fund
16 For example, in the Republic of Korea, each 1 % decline in external funding due to European
bank deleveraging following the global financial crisis led to a 0.01 % decline in domestic credit
by domestic banks [see Jain-Chandra et al. (2013)]. This occurred despite the country’s relatively
healthy foreign reserves, government efforts to provide foreign currency liquidity through bilateral
and multilateral currency swap arrangements, and macroprudential measures that lowered domes-
tic banks’ reliance on short-term wholesale funding.
9 Integration, Contagion, and Income Distribution 143

flows.17 Inflows are equities-led, debt-led, and bank-led if the increase is mainly
through equities, debt, and banks, respectively.
To better understand how each fluctuates, inflows are classified as “surges” if
there is a sharp increase, and “stops” for a sharp decrease. For gross outflows, the
terms “flight” and “retrenchment” are used. While “flight” refers to investors
moving large amounts of capital abroad, “retrenchment” occurs when domestic
investors liquidate foreign investments. Based on a one-standard deviation of the
change in the mean capital flows as the limit (for example, in the case of inflows it is
shown by dash lines in Fig. 9.6) beyond which they are labeled according to the
above classifications, the following episodes are observed:
Surge Episodes
Equity-led: 2009Q4–2010Q1
Debt-led (excl. banking flows): 2002Q1–Q3; 2007Q2; 2007Q4
Bank-led: 1999Q1–Q3; 2004Q1; 2009Q3; 2010Q2; 2012Q4
Stop Episodes
Equity-led: 2000Q4; 2004Q4; 2006Q4–2007Q1; 2008Q1–Q3
Debt-led (excl. banking flows): 1997Q1–Q3; 2001Q1–Q3
Bank-led: 1996Q4; 1997Q4–1998Q2; 2008Q4–2009Q1; 2011Q3–2012Q1
Fig. 9.6 Growth of gross inflows. Source: Author’s construction based on the sources in Fig. 9.5
17 See Forbes and Warnock (2012). However, unlike their analysis, I distinguish “debt” from
“bank” because banks are more prone to deleveraging and procyclicality, thus having more direct
impact on the real sector.
144 I.J. Azis

Flight Episodes
Equity-led: 2007Q2–Q4
Debt-led (excl. banking flows): 1999Q2, 2005Q4; 2009Q4–2010Q2
Bank-led: 1999Q2–Q3; 2002Q4–2003Q2; 2004Q3; 2006Q1–Q2
Retrenchment Episodes
Debt-led (excl. banking flows): 1998Q1–Q2; 2008Q1–Q2; 2012Q2
Bank-led: 1996Q4–1997Q1; 1998Q3–Q4; 2002Q1–Q2; 2004Q4–2005Q2;
2008Q3–2009Q1; 2012Q3
Thus, the rise in capital flow volatility has not been uniform; debt and bank-led
flows occurring most frequently. This poses challenges for financial stability. Yet,
as long as ultra-easy monetary policy continues in advanced economies, capital
flows are unstoppable and the threat to financial vulnerability remains. How this
affects welfare, particularly when income inequality is measured, is examined next.
9.4 Financial Development and Income Inequality: A ModelFramework
9.4.1 Model Framework
The links between financial development and income inequality is depicted in
Fig. 9.7; the left part represents the dynamics in goods and factor markets (real
sector) including exports and imports, with the right side the workings of financial
markets. How the two interconnect determines the nature of the link between
financial sector development and income inequality.
The real sector establishes the income generation from output production (X),
with a portion covering the domestic market (D) and exports (E). Together with
imports (M), those sold in the domestic market generate the total supply of goods
and services (Q). In both allocations, the substitution is imperfect (not cost-less).18
The process that generates output production (X) follows a standard input-output
framework, where value added (VA) and intermediate inputs (INTM) jointly
determines the level of output production (X). Expanding production networks
and supply chains—where the location of production is different from the country
where the intermediate inputs (INTM) are produced—suggests the need to distin-
guish between imported intermediate inputs (FINTM) and domestically produced
intermediate inputs (DINTM). This distinction is important particularly for trade
18 In a standard computable general equilibrium (CGE) model, for example, the allocation between
the domestic market (D) and imports (M) follows Armington’s constant elasticity of substitution
(CES), while the allocation between domestic market (D) and exports (E) follows a constant
elasticity of transformation (CET).
9 Integration, Contagion, and Income Distribution 145
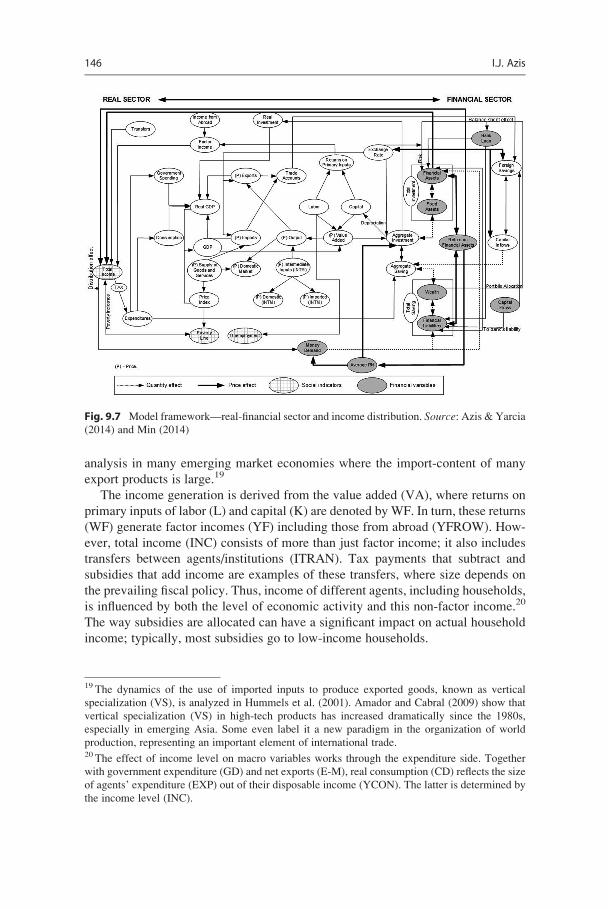
analysis in many emerging market economies where the import-content of many
export products is large.19
The income generation is derived from the value added (VA), where returns on
primary inputs of labor (L) and capital (K) are denoted by WF. In turn, these returns
(WF) generate factor incomes (YF) including those from abroad (YFROW). How-
ever, total income (INC) consists of more than just factor income; it also includes
transfers between agents/institutions (ITRAN). Tax payments that subtract and
subsidies that add income are examples of these transfers, where size depends on
the prevailing fiscal policy. Thus, income of different agents, including households,
is influenced by both the level of economic activity and this non-factor income.20
The way subsidies are allocated can have a significant impact on actual household
income; typically, most subsidies go to low-income households.
Fig. 9.7 Model framework—real-financial sector and income distribution. Source: Azis & Yarcia
(2014) and Min (2014)
19 The dynamics of the use of imported inputs to produce exported goods, known as vertical
specialization (VS), is analyzed in Hummels et al. (2001). Amador and Cabral (2009) show that
vertical specialization (VS) in high-tech products has increased dramatically since the 1980s,
especially in emerging Asia. Some even label it a new paradigm in the organization of world
production, representing an important element of international trade.20 The effect of income level on macro variables works through the expenditure side. Together
with government expenditure (GD) and net exports (E-M), real consumption (CD) reflects the size
of agents’ expenditure (EXP) out of their disposable income (YCON). The latter is determined by
the income level (INC).
146 I.J. Azis

Yet, these two sources are still incomplete. The actual income received by rich
and urban-based households holding financial assets can be well above income
accrued by those who do not hold financial assets. With financial sector liberal-
ization (FSL) and capital account liberalization (KAL), the former are far better
able to reap benefits from a growing financial sector. During the ‘bubble’ period
following capital inflows (FSAV), they benefit from the increased value of their
financial assets (FIN ASSETS) as well as the income stream generated from those
assets (RN), regardless of what is happening in the real economy. In many cases,
this portion is larger than that generated from factor income. To the extent the
financial sector often grows much faster than the real sector during a boom, the
impact on income distribution can be predicted—the rich earn far more than the
poor, and urban household income grows faster than rural income, both exacer-
bating income inequality.
After the global financial crisis, increased bank-led flows (see again Fig. 9.5) can
be charted beginning with capital flows (CFLOW) in the bottom right of Fig. 9.7.
Together with loans (BANKLOAN), these flows directly augment banks’ financial
liabilities (FIN LIABS).21 This alters the rate of return on financial assets (RN) and
financial returns received by asset holders (RN and INC are linked). Financial assets
(RN) also have a two-way relationship with the size and composition of different
agents’ assets. Fixed assets (FIXAS) will be used directly for real sector investment
(INVEST), such as in buildings, machinery, etc., while the rest—including financial
assets (FIN ASSETS)—may move indirectly via financial markets, as for example,
funds from equity issuance are used for business investment. Along with govern-
ment spending (GD), consumption expenditure (EXP or CD), exports (E), and
imports (M), this investment (ID) in real terms generates gross domestic product
(RGDP).22
Increased capital flows (CFLOW) [captured through foreign savings SAV(fr)]
also have macro-financial impacts: pressuring the currency via the exchange rate
(EXR) to appreciate. The resulting trade account (TA) may thus worsen due to
falling exports (E) and increased imports (M). In reality, however, almost all
emerging market economies with large capital inflows respond by imposing some
sort of capital controls—either directly (through taxes or levies for example) or
indirectly (sterilized market intervention). This explains why net-exports in some
countries continue to grow despite increased capital inflows. When net-exports
shrink, the growth of consumption (CD) and investment (ID) can also offset the
decline.
The resulting higher real gross domestic product (RGDP) fuels further financial
sector growth either from strong fundamentals or simply market expectations. This
21 Note that lending (BANKLOAN) is not only determined by the size of a bank’s available funds,
but also by changes in net worth and external finance premia of both borrowers and lenders; this
“credit channel” hypothesis was elaborated in Bernanke et al. (1996), Adrian and Shin (2009),
Stiglitz and Greenwald (2003), and Stiglitz (2001).22 Other financial variables can also affect aggregate economic activity by way of the money
market.
9 Integration, Contagion, and Income Distribution 147

further enhances rich household income along with savings (SAVING) or wealth
(WEALTH), providing them with an additional income stream from financial
returns.23 If, through the portfolio allocation, the increased wealth is reinvested in
financial instruments with lucrative returns, the financial assets and earnings of rich
households increase yet again. In this way the magnitude of the growth-inequality
nexus is amplified through this feedback cycle.24
The above framework clearly shows that in addition to standard factors like
technology, globalization, education, and domestic institutions, rising inequality
can be exacerbated by the non-inclusive nature of financial sector growth.
9.4.2 Model Verification
To verify the model framework, I use a financial general equilibrium model
(FCGE) for one emerging Asian economy, Indonesia.25 The model is the evolution
of FCGE developed by the author since late 1990s (Azis 1997), subsequently
applied to the dynamics of manufacturing sector in Azis (2000), and for impact
analysis of financial crisis on socio-economic conditions in Azis (2003). With
improved monetary block, the model was used to explain the disconnect between
financial and real sector in Azis (2004). In Azis (2008) the author used the model to
analyze debt sustainability by specifying debt maturity and debt re-profiling. More
detailed household income distribution and poverty module were added in Azis
(2009). Most parameters are calibrated on the actual data using the (non-linear)
model specifications, while others are econometrically estimated. The validity and
the predictive power of the model are tested by plotting actual data on some
exogenous variables.
The model version used in the current study is based on the most recent available
Financial Social Accounting Matrix (FSAM) and a more detailed specification of
capital flows. It incorporates a credit channel component that includes the financial
structure of lenders and borrowers in determining bank willingness to lend, and the
amplified effect due to currency appreciation. The channel connecting financial
23 Changes in the exchange rate also cause some valuation effects: the local currency value of any
assets denominated in foreign currencies will increase (decrease) when local currency appreciates
(depreciates).24 Aside from income inequality, poverty and unemployment (UEMPR) are two other social
indicators endogenously determined in the model. While unemployment is derived from the
difference between labor demand (L) and fixed labor supply, the aggregate variables in the real
sector (X, D, E, M, and Q) are all determined along with their respective prices (PX, PD, PE, PM,
and PQ). It is PQ that sets the overall price index (PINDEX). The poverty line (PL) can be derived
from this. When PL is matched with the endogenously determined household income, the poverty
level can be estimated.25 Indonesia is selected because like most emerging markets, its financial sector has been growing
rapidly since financial liberalization began in the 1980s, and income inequality has worsened.
Indonesia also became a primary destination for capital flows once advanced economies set ultra-
easy monetary policy.
148 I.J. Azis

flows and income distribution is specified in detail by dissecting the flows as they
appear on agents’ balance sheets based on the type of income generated.
Scrutinizing the role and detailed transmission within the financial sector allows
us to analyze the dynamics of income earned from returns on financial assets held
mostly by urban-based rich households.26
Given the shock from increased bank-led flows, two scenarios are constructed:
one where recipient banks increase risk by investing in financial assets, particularly
securities and equity markets; and the other where recipient banks spend the
additional funds more prudently, by using them to strengthen credit and safe assets.
In the first scenario (Figs. 9.8a, b, c), real GDP is only slightly higher than the
baseline. So are investment and consumption. Inflation and unemployment rates are
lower. However, the trade sector suffers: exports decrease and imports increase due
to currency appreciation. Looking more closely, appreciation derives from higher
interest rates, their level influenced by returns on financial assets. Because the
issuance of financial assets increases under this scenario, prices will fall and yields
rise, with interest rates also increasing. In the search for higher returns and yields,
banks actively invest in these new assets instead of issuing more credit. This
explains why the economy grows only slightly.
The effect on income distribution is far more obvious: it gets worse. Whether
measured by disparity between rich and poor, or in terms of the rural/urban gap,
inequality grows (Fig. 9.9a, b). Although the poverty line drops 1.2 % below the
baseline, incomes for all household categories fall, despite growing GDP. Two
factors are behind this: (1) wages fall due to lower prices, and (2) economic growth
is mostly driven by expanding financial sector-related activity. These tend to benefit
only urban-rich households whose depend far less on wages (factor income) than
the rural-based poor. With more access to financial markets, the urban-rich accrue
extra income from returns on the financial assets they hold. This is why increased
bank-led flows under the risky behavior scenario worsen income inequality. And as
expected, the largest deterioration is in financial income.
How does this compared with a scenario of prudent bank behavior? While real
GDP in both cases is higher than the baseline, the increase is larger when banks act
more prudently. There is higher growth in investment and consumption due to
lower interest rates, and higher exports due to nominal and real exchange rate
depreciation (see Fig. 9.8a, b). Unemployment rate is also much lower, though the
price index is higher (see Fig. 9.8c). Thus, the macroeconomic impact is better
when banks behave prudently.
Unlike the previous case, income in all household categories increases. More
importantly, all factor incomes are higher. As increased liquidity from bank-led
flows is not spent on financial assets, the urban rich do not receive extra income
26 The model version used in the analysis here follows Min (2014). Due to space constraint, the
detailed explanations of the model and simulation results are not shown here (they are available
upon request).
9 Integration, Contagion, and Income Distribution 149

-40000 -20000 0 20000 40000 60000 80000 100000 120000 140000 160000
RGDP
Net Exports
Investment
Consump�onNon-risky
Risky
-200 -100 0 100 200 300 400
Nominal Exchange Rate
Real Exchange Rate
Non-risky
Risky
-50 -40 -30 -20 -10 0 10 20
Interest Rate*100
Unemployment Rate
Price Index
Non-risky
Risky
a
b
c
Fig. 9.8 (a) Aggregate impact of increased bank-led flows. Source: Results of model simulations.
(b) Impact of increased bank-led flows on the exchange rate. Source: Results of model simulations.
(c) Impact of increased bank-led flows on prices, interest rates, and unemployment rate. Source:Results of model simulations
150 I.J. Azis

from these assets. As a result, overall income inequality between rich and poor, and
between rural and urban households, narrows (see Fig. 9.9a, b).
It is abundantly clear that the repercussions of increased bank-led flows depend
on how banks react. It is much better when banks act prudently and do not take on
increased risk. The problem is, there is no guarantee banks will behave that way.
Given the high frequency of financial crises worldwide, especially since the 1990s,
it implies that most financial institutions on the receiving end of capital inflows tend
to take on more risk. This all suggests policies need to adjust.
9.4.3 What’s Next
Despite the risks and potential damage capital flows can cause, no country can stop
them—especially when the spread of returns (interest rates) is large and push
-0.0002 0 0.0002 0.0004 0.0006 0.0008 0.001 0.0012
TotalIncome
FactorIncome
Non-Risky
Risky
-0.0002 0 0.0002 0.0004 0.0006 0.0008 0.001 0.0012
TotalIncome
FactorIncome
FinancialIncome
Non-Risky
Risky
a
b
Fig. 9.9 (a) Impact of increased bank-led flows on poor/rich income rati. Source: Results of
model simulations. (b) Impact of Increased Bank-Led Flows on Rural/Urban Income Ratio.
Source: Results of model simulations
9 Integration, Contagion, and Income Distribution 151

factors (slow growth in advanced economies) are substantial. What most countries
can do and have done is to refocus their policy on the asset and liability side of bank
balance sheet.27 When external shocks strike, as in the case of European bank
deleveraging during the Eurozone crisis, bank credit flows can be disrupted.
Theoretically, outflows can be matched by retrenchment—returning foreign assets
owned by domestic investors. The size of these assets, however, can only rise if
capital outflows are encouraged. On the preventive side, some sort of capital
controls can also help—in the form of direct quantitative controls such as imposing
a levy on bank-led flows. In the context of regional integration and cooperation, the
risk of integration-led contagion can be mitigated by complementing domestic
financial safety nets with collective safety nets regionally.28 The question is,
which policy works best?
Three policy options are considered: (1) promote direct investment abroad,
labeled “Encourage Outflows” (Fig. 9.10); (2) “Assign Levy” to non-core bank
liabilities; and (3) strengthen regional financial safety nets, “Reg Safety Nets.” The
logic of regional financial safety nets is to support domestic safety nets, as these are
far too inadequate given the potential damage caused by the unprecedented size and
volatility of capital flows. The rationale for assigning a levy is to restrain rather than
stop capital flows. Encouraging capital outflows helps maintain stability of net
flows. In times of crisis, when capital tends to flow out during the boom-and-bust
cycle, assets held abroad by domestic investors can act as a safeguard. They can
provide a foreign asset buffer when markets become volatile. Indeed, the size of
these ready-to-use foreign assets was important in some emerging market
economies during the global financial crisis; the Republic of Korea is one example
(Jain-Chandra et al. 2013).
I use the Analytic Network Process (ANP) to structure the model and quantify
the weight of each model element [see Saaty and Vargas (2005)] for a detailed
explanation about ANP). Achieving a balanced outcome of MACRO STABILITY,
FINANCIAL STABILITY and improved SOCIAL ISSUES, depicted at the top of
Fig. 9.10, is the strategic comparative goal. Each policy is weighted in terms of its
relevance and contribution to BENEFIT, OPPORTUNITY, COST, and RISK
(BOCR) that can be generated by increased bank-led flows. In the BENEFIT
cluster, two sets of components are considered: (1) strengthen LIQUIDITY (the
first box on the left of Fig. 9.10), through enhanced short-term securities and equity
markets, along with boosted financial income; and (2) allow investment, consump-
tion, financial income, and imported intermediate inputs to EXPAND (the second
box on the left of Fig. 9.10). Some beneficial impacts of increased bank-led flows,
such as improved CAPITAL MARKET, and enhanced RESILIENCE may emerge
27On the asset side, other than reducing loan-to-value ratio, efforts to contain excessive credit
expansion and other risky investments are also made. On the liability side, mitigating the increase
of non-core liabilities through bank-led flows is critical because they can heighten risky bank
behavior and increase leverage. See Azis and Shin (2013) and Forbes and Warnock (2012).28 For the status of Asia’s regional financial safety nets, see Azis (2012).
152 I.J. Azis

only in the long-run. Recipient countries can also improve overall WELFARE, after
a certain period, if they take advantage of the increased capital inflows. All these
long-term benefits are grouped in the OPPORTUNITY cluster. The components
connecting the GOAL and policies in Fig. 9.10 are most relevant and should be
considered in prioritizing policies. For example, given an increase in bank-led
flows, improvements in WELFARE can be fueled by a gradual increase in the
financial income originating in short-term securities and equity earnings.
On the downside of bank-led flows, the short- and long-term costs (COST and
RISK, respectively) are analyzed similarly, except that the priority ranking is based
GOAL
BENEFIT OPPORTUNITY COSTS RISKS
GOAL
LIQUIDITY
Short-termSecurity Financial INC
Encourage Outflows
Assign Levy
Reg Safety Nets
GOAL
EXPAND
ID CD
Encourage Outflows
Assign Levy
Reg Safety Nets
Financial INC FINTM
GOAL
CAPITAL MARKET
RN Short termSecurity
Encourage Outflows
Assign Levy
Reg Safety Nets
EQUITY
GOAL
RESILIENCE
HH Net Worth BANKF
Encourage Ouflows
Assign Levy
Reg Safety Nets
Property Price
M2/RESERVE
GOAL
WELFARE
FinancialINC UEMP
Encourage Outflows
Assign Levy
Reg Safety Nets
Poverty Line
Short-term Security
INC
Equity INC
GOAL
COMPETITIVENESS
Trade Account
EXR
Encourage Outflows
Assign Levy
Reg Safety Nets
Excess Saving
EXPORTIMPORT
FS
GOAL
INCOME DISTRIBUTION
POOR/RICH
Encourage Outflows
Assign Levy
Reg Safety Nets
RURAL/URBAN
FACTOR FINANCIAL
GOAL
VOLATILITY
EQUITY Short termSecurity
Encourage Outflows
Assign Levy
Reg Safety Nets
Non-HH INC
Fin FirmBank Non-Fin
FirmGov
GOAL
DEFLATION
PINDEX
Encourage Outflows
Assign Levy
Reg Safety Nets
RER
EQUITY Short-term Security
ASSET PRICE
GOAL
BANK’S VULNERABILITY
CARCREDIT
CRUNCH
Encourage Outflows
Assign Levy
Reg Safety Nets
WEALTH
MACRO STABILITY MICRO STABILITY SOCIAL ISSUE
BANKF
Fig. 9.10 Analytic network process (ANP) structure for policy options
9 Integration, Contagion, and Income Distribution 153

on the question: “which policy is the most costly or risky” when the following
components are considered: COMPETITIVENESS and INCOME DISTRIBU-
TION under the COST cluster, and VOLATILITY, DEFLATION, and BANK
VULNERABILITY under the RISK cluster. It is important to note that the refer-
ence for analyzing RISK is capital flow reversal—as in many crisis episodes with a
boom-and-bust cycle, the biggest risk in massive capital inflows is precisely their
reversal (procyclicality). However, one needs to distinguish this reversal from
outflows by domestic investors. While useful in times of crisis, which is why one
policy option is to encourage them, a flow reversal from investors pulling out will
generate detrimental capital “flight” (see again the distinction between capital
“flight” and “retrenchment” discussed earlier).
The policies at the bottom of the network in Fig. 9.10 are weighted with respect
to each component and sub-component listed above them. For example, under
BANK VULNERABILITY in the RISK cluster, where bank capital may deteriorate
during a flow reversal, there is a risk that a bank’s capital adequacy ratio (CAR) will
deteriorate. The relevant question then is: Which of the three policies will likely
create such a risk (most risky)?
All arrows under each component in Fig. 9.10 point in two directions, implying a
feedback effect for every influence from an element to the other elements below
it. Thus, the structure in each box under each cluster forms a network. Again, taking
the example of BANK VULNERABILITY in the RISK cluster, a typical question
to ask is: “Given a selected policy, which risk is least likely to be resolved by that
policy?” Applying pairwise-comparisons, priority rankings for each feedback was
made. The inputs used are a combination of the normalized quantitative data
derived from the FCGEmodel simulations and analytical perceptions. The rankings
based on the complex network structure are derived from the limiting super-matrix
(see Appendix).
Table 9.1 shows the results of priority rankings for the three policies under the
BOCR.29 Thus, while to “Encourage Outflows” ranks highest in terms of its
capacity to generate BENEFIT and OPPORTUNITY, the policy is also considered
most costly and risky. For example, compared with “Assign Levy” and “Reg Safety
Nets,” “Encourage Outflows” will do the least in avoiding decreased competitive-
ness caused by the appreciation of real exchange rate (RER). On the RISK side,
capital flow reversals may cause VOLATILITY in the EQUITY market. To
“Encourage Outflows” will obviously make things worse.
Having calculated the above priorities, the next step is to apply them to some
BOCR formula. Two types are used here: (1) the multiplicative approach (B�O)/
29 For example, under the BENEFIT scenario in Table 9.1, three eigen-vectors are shown
(“Ideals,” “Normals,” and “Raw”). While all three give the same ranking, i.e., encourage outflows
being most preferred, followed by assigning levies, and regional financial safety nets (hence the
ranking shown in the last column of Table 9.1), the normalized eigen-vector (0.4381; 0.4358; and
0.1261) under “Normal” with the sum equals unity is the most often used. All numbers under the
column “Benefit,” “Opportunity,” “Cost,” and “Risk” in Table 9.2 show the normalized eigen-
vector.
154 I.J. Azis

(C�R) and (2) the additive approach (bB + oO-cC-rR); for the rationale of both,
see Saaty and Vargas (2006).
Table 9.2 lists the results. The upper panel equally ranks BOCR, with the last
column shows the superiority of “Assign Levy.” The middle and lower panels
display the results of sensitivity analyses; the middle reflects a more subdued
option, where COST and RISK clusters are weighted more than BENEFIT and
OPPORTUNITY, with the reverse case shown in the bottom panel, representing a
‘buoyant’ scenario. In either case, the highest preference for “Assign Levy”
remains. Only the ranking of the other two policies is reversed when an additive
approach is used. This suggests the superiority of placing a levy on bank-led flows
is robust [see also Azis and Shin (2013)].
9.5 Summary
The global financial crisis and the eurozone crisis made many analysts question the
virtue of financial liberalization and integration. These qualms coincide with
dramatic changes in the global economy and economic thinking, particularly
about the role of capital flows. Adding to the mix is growing income inequality in
developed and developing countries alike. For a region where integration has been
intensifying, where massive capital inflows came in response to easy money and
low interest rates in advanced economies, and where income disparity is rising
despite rapid recovery and strong growth, Asia is studied by taking a more balanced
view of integration.
Table 9.1 ANP results for benefit (B), opportunity (O), cost (C), and risk (R)
Ideals Normals Raw Ranking
Benefit
1. Encourage Outflows 1 0.438129 0.858812 1
2. Assigning Levies 0.994591 0.435759 0.854167 2
3. Reg Safety Nets 0.287844 0.126113 0.247204 3
Opportunity
1. Encourage Outflows 1 0.477338 0.826065 1
2. Assigning Levies 0.712725 0.340211 0.588757 2
3. Reg Safety Nets 0.382225 0.182451 0.315742 3
Cost
1. Encourage Outflows 1 0.725513 1 1
2. Assigning Levies 0.08878 0.064411 0.08878 3
3. Reg Safety Nets 0.289555 0.210076 0.289555 2
Risk
1. Encourage Outflows 1 0.488161 0.983803 1
2. Assigning Levies 0.313358 0.152969 0.308283 3
3. Reg Safety Nets 0.735147 0.35887 0.72324 2
Source: Results of ANP
9 Integration, Contagion, and Income Distribution 155

Table
9.2
Overallresultsbased
onmultiplicativeandadditiveBOCR
ANP
Benefit
Opportunity
Cost
Risk
(B�O)/(C
�R)
Ranking
bB+oO�c
C�r
RRanking
b¼0.25
o¼0.25
c¼0.25
r¼0.25
Encourageoutflows
0.438129
0.477338
0.725513
0.488161
0.590499767
�0.07455
3
Assignlevy
0.435759
0.340211
0.064411
0.152969
15.04635304
0.1396
1
Reg
safety
nets
0.126113
0.182451
0.210076
0.35887
0.305205609
�0.0651
2
b¼0.25
o¼0.1
c¼0.35
r¼0.3
Encourageoutflows
0.438129
0.477338
0.725513
0.488161
0.590499767
�0.2431
3
Assignlevy
0.435759
0.340211
0.064411
0.152969
15.04635304
0.0745
1
Reg
safety
nets
0.126113
0.182451
0.210076
0.35887
0.305205609
�0.13141
2
b¼0.35
o¼0.3
c¼0.25
r¼0.1
Encourageoutflows
0.438129
0.477338
0.725513
0.488161
0.590499767
30.06635
2
Assignlevy
0.435759
0.340211
0.064411
0.152969
15.04635304
10.22318
1
Reg
safety
nets
0.126113
0.182451
0.210076
0.35887
0.305205609
20.010469
3
Source:
ResultsofBOCR,based
onANP
156 I.J. Azis
Unlike in Europe, the process of integration in Asia is more market-driven,
institution-light and bottom-up. Given the region’s huge diversity of development
level, the essence of Asian integration is to manage the diversity, not to seek for a
“United Asia”. To the extent greater integration poses risks—including financial
contagion—both benefits and costs should be gauged carefully. The ultimate goal
remains improved welfare. The market-driven process of integration needs to be
carefully managed to reap its benefits while minimizing potential costs. It is argued
that better and effective regional cooperation can indeed better manage integration
and its potential risks. Strengthening financial safety nets is one important example
of regional cooperation, given the uncertainty and volatility in financial markets.
On the seeming disconnect between financial sector growth and income
inequality, I delve into the interconnections between financial and real sectors by
simulating a general equilibrium model with financial module under a scenario of
increased bank-led flows as experienced by many emerging market economies.
When a large portion of the enhanced liquidity caused by capital inflows is
invested by banks in financial assets and other risky loans, the impact on overall
welfare is unfavourable. In particular, household income falls, most dramatically
on the rural-poor. The only rising income derives from returns on financial assets,
which is why the income gap between the rich and the poor widens, and the
disparity between rural and urban households worsens. As investing in financial
assets—as opposed to lending to firms—has a lower employment-generating
capacity, the drop in unemployment is smaller than when banks act prudently.
Indeed, prudent behavior is better from both macro-financial stability and income
distribution perspectives.
The policy analysis suggests that during the tranquil period capital outflows
should be encouraged to help stabilize net flows in times of market turmoil, at the
same time strengthening competitiveness as the exchange rate weakens. But after
taking into account the costs and the risks of such measure, imposing levy on bank-
led flows is preferable. The resulting stable financial market feeds into the real
economy, boosting factor income rather than returns on financial assets, suggesting
that it will also reduce inequality. Through some sensitivity tests, the result is found
to be robust. Clearly, taking one-sided approach in evaluating policy alternatives by
neglecting the potential costs and risks of the policies may produce a sub-optimal
result.
Appendix
The presence of feedback influences in a network model requires a large matrix—
known as supermatrix—that contains a set of sub-matrixes. The supermatrix
captures the influence of elements in a network on other elements in that network.
Denoting a cluster by Ch, h¼ 1, . . .. . .m, and assuming that it has nh elements
eh1, eh2, eh3 . . .. . .., ehmh, and laying out all the clusters and all the elements in each
cluster both vertically on the left and horizontally at the top, we have the following
supermatrix:
9 Integration, Contagion, and Income Distribution 157

Supermatrix of a Network
The typical entry of this supermatrix is
Entries in Supermatrix of a Network
Wij ¼
Wj1ð Þi1 W
j2ð Þi1 � � � W
jnjð Þi1
Wj1ð Þi2 W
j2ð Þi2 � � � W
jnjð Þi1�
��
���
���
Wj1ð Þini
Wj2ð Þini
� � � Wjnjð Þ
ini
26666666664
37777777775
The entries of sub-matrixes in Wij are the ratio scales derived from paired
comparisons performed on the elements within the clusters themselves according
to their influence on each element in another cluster (outer dependence) or elements
in their own cluster (inner dependence). Judgments are elicited from which ratio
scales are derived. The resulting unweighted supermatrix is then transformed into a
matrix where each column sums to unity to generate a stochastic supermatrix. The
derived weights are used to weight the elements of the corresponding column
blocks (cluster) of the supermatrix, resulting in a weighted supermatrix which is
also stochastic. The final ranking is derived from the limiting supermatrix, obtained
by raising the stochastic supermatrix to large powers to read off final priorities, in
which all matrix columns are identical. Each gives the relative priorities of the
158 I.J. Azis

elements from which the priorities of the elements in each cluster are normalized to
one (the powers of the supermatrix do not converge unless it is stochastic, ensuring
that its largest eigenvalue is one). Using the example of the EXPAND component
under the BENEFIT cluster in Fig. 9.10, the resulting limiting supermatrix is
Limiting super matrix
Alternatives Goal EXPAND
Encourage
Outflows
Assign
Levy
Reg
Safety
Nets EXPAND CD
FIN
INC FINTM ID
Alternatives Encourage
Outflows
0.18477 0.18477 0.18477 0.18477 0.18477 0.18477 0.18477 0.1848
Assign
Levy
0.23605 0.23605 0.23605 0.23605 0.23605 0.23605 0.23605 0.2361
Reg
Safety
Nets
0.07918 0.07918 0.07918 0.07918 0.07918 0.07918 0.07918 0.0792
Goal EXPAND 0 0 0 0 0 0 0 0
EXPAND CD 0.0745 0.0745 0.0745 0.0745 0.0745 0.0745 0.0745 0.0745
FIN INC 0.15758 0.15758 0.15758 0.15758 0.15758 0.15758 0.15758 0.1576
FINTM 0.13292 0.13292 0.13292 0.13292 0.13292 0.13292 0.13292 0.1329
ID 0.135 0.135 0.135 0.135 0.135 0.135 0.135 0.135
References
Adrian T, Shin HS (2009) Money, liquidity and monetary policy. Am Econ Rev 99(2):600–605
Alderson AS, Nielsen F (2002) Globalization and the great U-Turn: income inequality trends in
16 OECD countries. Am J Sociol 107:1244–1299
Amador J, Cabral S (2009) Vertical specialization across the world: a relative measure. North Am
J Econ Financ 20:267–280
Arestis P, Paliginis E (1995)Divergence and peripheral fordism in the EuropeanUnion.Rev SocEcon
53:261–283
Armstrong HW (1995) An appraisal of the evidence from cross-sectional analysis of the regional
growth process within the European Union. In: Armstrong HW, Vickerman RW (eds) Conver-
gence and divergence among European regions. Pion, London
Asian Development Bank (2012) Asian development bank outlook 2012: confronting rising
inequality in Asia. Manila
Azis IJ (1997) Impacts of Economic reform on rural-urban welfare: a general equilibrium
framework. Rev Urban Reg Develop Stud 9(1):1–19
Azis IJ (2000) The non-linear general equilibrium impact of the financial crisis and manufacturing
downfall. Develop Econ 38(4):518–546
Azis IJ (2003) Modeling the repercussions of financial shock on socio-economic indicators.
In: Ananta A (ed) The Indonesian crisis: a human development perspective. Institute of
Southeast Asian Studies, Singapore
Azis IJ (2004) Modeling the disconnect between financial policy and real sector using the
financial social accounting matrix as a data system: the case of Indonesia. In: Charles J
(ed) Banking disintermediation and its implication to monetary policy: a theoretical view
and country experiences bank. Indonesia, Jakarta
9 Integration, Contagion, and Income Distribution 159

Azis IJ (2007) Articulating the benefits and costs of regional financial arrangement in East Asia.
In: Simorangkir I (ed) Global imbalances and their impact on emerging market economies:
issues and challenges. Bank Indonesia, Jakarta
Azis IJ (2008) Fiscal policy and workouts from debt crises: the case of Indonesia’s domestic debt.
IPD Working Paper, Columbia University, New York, pp 1–25
Azis IJ (2009) Regional financial arrangement. In: Azis IJ (ed) Crisis, complexity and conflict.
Emerald, London
Azis IJ (2012) Asian regional financial safety nets? Don’t hold your breath. Pub Policy Rev 8(3):
321–340
Azis IJ, Shin HS (2013) How do global liquidity phases manifest themselves in Asia?
Asian Development Bank, Manila
Azis IJ, Yarcia D (2014) How capital flows affect economy-wide vulnerability and inequality:
flow-of-funds analysis of selected Asian economies. ADB Working Paper Series on Regional
Economic Integration, No 136
Backus DK, Kehoe JP, Kydland FE (1992) International real business cycles. J Polit Econ 100(4):
745–775
Bai Y, Jin Z (2005) Financial integration and international risk sharing. Working Paper, Depart-
ment of Economics, Arizona State University
Baysan T, Arvind P, Nihal P (2006) Preferential trading in South Asia. World Bank Policy
Research Working Paper Series, 3813. World Bank, Washington, DC
Beckfield J (2009) Remapping inequality in Europe: the net effect of regional integration on total
income inequality in the European Union. Int J Comp Sociol 50(5–6):486–509
Ben-David D (2001) Trade liberalization and income convergence: a comment. J Int Econ 55:
229–234
Bernanke BS, Gertler M, Gilchrist S (1996) The financial accelerator and the flight to quality.
Rev Econ Stat 78(1):1–15
Borensztein E, Loungani P (2011) Asian financial integration: trends and interruptions.
IMF Working Paper, No. 11/4, January, 2011
Bourguignon F (2004) The poverty-growth-inequality triangle. Paper Presented at the
Indian Council for Research on International Economic Relations, New Delhi
Brady D (2003) The politics of poverty: left political institutions, the welfare state and poverty.
Soc Forces 82(2):557–588
Cameron DR (1978) The expansion of the public economy: a comparative analysis. AmPolit Sci Rev
72:1243–1261
Canova F, Ravn MO (1996) International consumption risk sharing. Int Econ Rev 37(3)
CIEPR-Committee on International Economic Policy and Reform (2012) Banks and cross-border
capital flows: policy challenges and regulatory responses. Washington, DC
Cochrane JH (1991) A simple test of consumption insurance. J Polit Econ 99(5):957–976
Forbes KJ, Warnock F (2012) Capital flow waves: surges, stops, flight and retrenchment. J Int
Econ 88(2):235–251
French KR, Poterba JM (1991) Investor diversification and international equity markets.
American Economic Review Papers and Proceedings, vol 81, pp 222–226
Hummels D, Ishii J, Yi K-M (2001) The nature and growth of vertical specialization in world trade.
J Int Econ 54(1):75–96
International Monetary Fund (2012) The liberalization and management of capital flows: an
institutional view. International Monetary Fund, Washington, DC
Jain-Chandra S, Kim MJ, Park SH, Shin J (2013) The impact of Foreign Bank deleveraging on
Korea. IMF Working Paper, WP/13/101, Washington DC
Leonardi R (1995) Convergence, cohesion, and integration in the EuropeanUnion. St.Martin’s Press,
New York
Levine R (2001) International financial liberalization and economic growth. Rev Int Econ 9(4):
668–702
160 I.J. Azis

Machiko N, Thorbecke E (2010) The poor under globalization in Asia, Latin America, and Africa.
Oxford University Press, New York
Martin XS (1996) Regional cohesion: evidence and theories of regional growth and convergence.
Eur Econ Rev 40:1325–1352
Mckinnon R (2012) Zero interest rates in the United States provoke World Monetary instability
and constrict the US economy. SIEPR Policy Brief, Stanford University
Mendoza EG (1995) The terms of trade, the real exchange rate and economic fluctuations. Int Econ
Rev 36:101–137
Min HH (2014) The analysis of the link between capital flows and macroeconomic-financial-
spatial income distribution indicators: combining financial CGE and perception models. PhD
Dissertation in Regional Science. Cornell University
Obstfeld M (1994) Risk-taking, global diversification, and growth. Am Econ Rev 84: 1310–1329
Rodrik D (2011) The globalization paradox. Making it. 24 August
Saaty TL, Vargas L (2005) Theory and applications of the analytic network process: decision
making with benefits, opportunities, costs, and risks. RWS Publication, Pittsburgh, PA
Saaty TL, Vargas L (2006) Decision making with the analytic network process. Springer’s Inter-
national Series
Scharpf FW (1997) Economic integration, democracy, and the welfare state. J Eur Pub Policy 4:
18–36
Slaughter MJ (2001) Trade liberalization and per capita income convergence: a difference-in-
differences analysis. J Int Econ 55:203–228
Stiglitz JE (2001) Information and the change in the paradigm in economics. Prize Lecture,
Nobel Foundation, Stockholm
Stiglitz JE (2010) Risk and global economic architecture: why full financial integration may be
undesirable. NBER Working Paper Series. No 15718. NBER, Cambridge, MA)
Stiglitz JE, Greenwald BC (2003) Towards a new paradigm in monetary economics. Cambridge
University Press, Cambridge, MA
Stiglitz J, Amartya SenE, Fitoussi J-P (2010)Mis-measuring our lives: whyGDPdoesn’t add up/the
report by the commission on the measurement of economic performance and social progress.
The New Press, New York
Stolper W, Samuelson PA (1941) Protection and real wages. Rev Econ Stud 9(1):58–73
Valentina B, Shin HS (2012) Capital flows and the risk-taking channel of monetary policy.
BIS working papers, No 400, December
Venables AJ (2009) Economic integration in remote resource-rich regions. OxCarre Working
Papers No 022. Oxford Centre for the Analysis of Resource Rich Economies, Oxford
Western B (1997) Between class and market: postwar unionization in capitalist democracies.
Princeton University Press, Princeton, NJ
9 Integration, Contagion, and Income Distribution 161