Embed Size (px)
Citation preview


Educating Children and Youths for
Their Future, not Our Past
21st Century Challenges for
Education Policy and Practice
3
Educating youths for their futurenot our past
2018 Vietnam Sustainability Forum
Andreas SchleicherDirector for Education and Skills
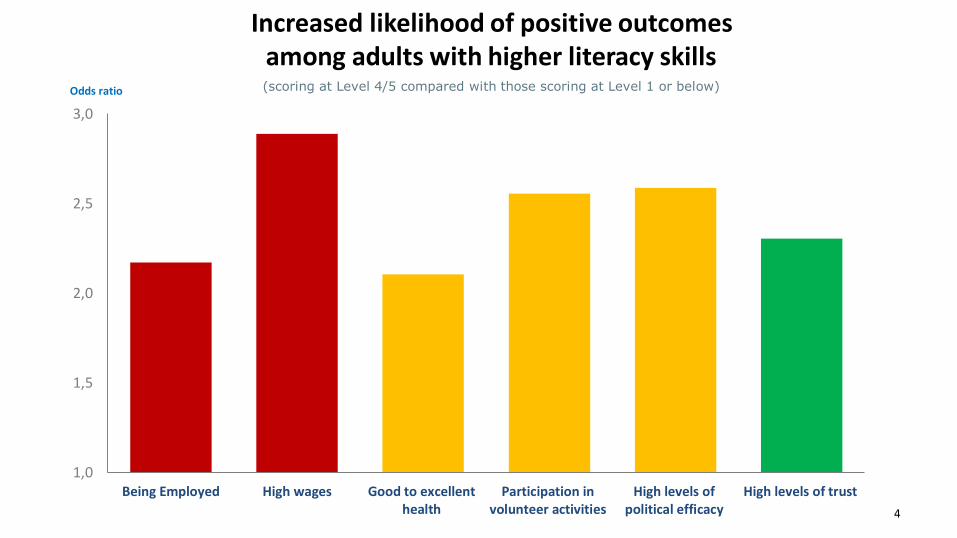
Increased likelihood of positive outcomes among adults with higher literacy skills
1,0
1,5
2,0
2,5
3,0
Being Employed High wages Good to excellenthealth
Participation involunteer activities
High levels ofpolitical efficacy
High levels of trust
4
(scoring at Level 4/5 compared with those scoring at Level 1 or below)Odds ratio
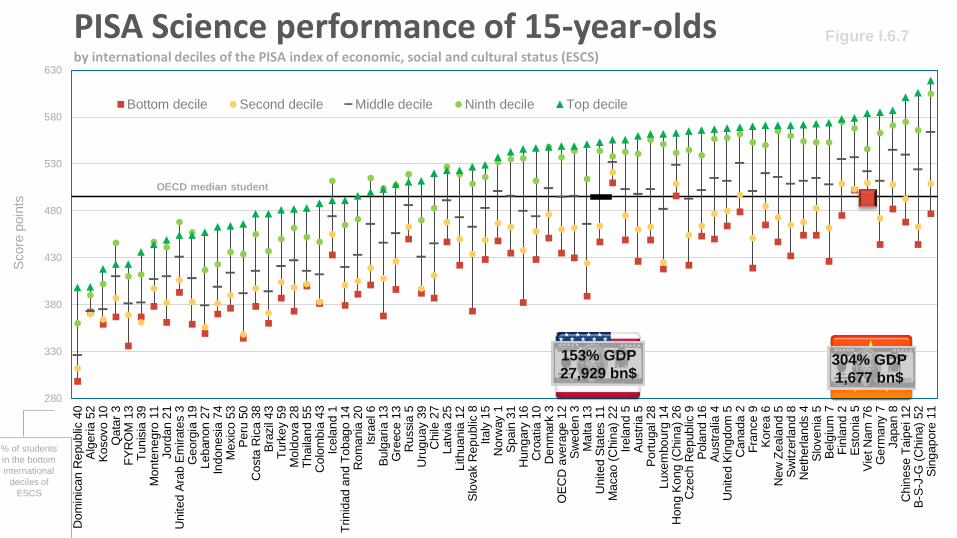
PISA Science performance of 15-year-oldsby international deciles of the PISA index of economic, social and cultural status (ESCS)
280
330
380
430
480
530
580
630D
om
inic
an R
epublic
40
Alg
eria 5
2K
osovo 1
0Q
ata
r 3
FY
RO
M 1
3T
unis
ia 3
9M
onte
negro
11
Jord
an 2
1U
nited A
rab E
mirate
s 3
Georg
ia 1
9Lebanon 2
7In
donesia
74
Mexic
o 5
3P
eru
50
Costa
Ric
a 3
8B
razil
43
Turk
ey 5
9M
old
ova 2
8T
haila
nd 5
5C
olo
mbia
43
Icela
nd 1
Trinid
ad a
nd T
obago 1
4R
om
ania
20
Isra
el 6
Bulg
aria 1
3G
reece 1
3R
ussia
5U
ruguay 3
9C
hile
27
Latv
ia 2
5Lithuania
12
Slo
vak R
epublic
8Italy
15
Norw
ay 1
Spain
31
Hungary
16
Cro
atia 1
0D
enm
ark
3O
EC
D a
vera
ge 1
2S
weden 3
Malta 1
3U
nited S
tate
s 1
1M
acao (
Chin
a)
22
Irela
nd 5
Austr
ia 5
Port
ugal 28
Luxem
bourg
14
Hong K
ong (
Chin
a)
26
Czech R
epublic
9P
ola
nd 1
6A
ustr
alia
4U
nited K
ingdom
5C
anada 2
Fra
nce 9
Kore
a 6
New
Zeala
nd 5
Sw
itzerland 8
Neth
erlands 4
Slo
venia
5B
elg
ium
7F
inla
nd 2
Esto
nia
5V
iet N
am
76
Germ
any 7
Japan 8
Chin
ese T
aip
ei 12
B-S
-J-G
(C
hin
a)
52
Sin
gapore
11
Score
poin
ts
Bottom decile Second decile Middle decile Ninth decile Top decile
Figure I.6.7
% of students
in the bottom
international
deciles of
ESCS
OECD median student
304% GDP
1,677 bn$
153% GDP
27,929 bn$
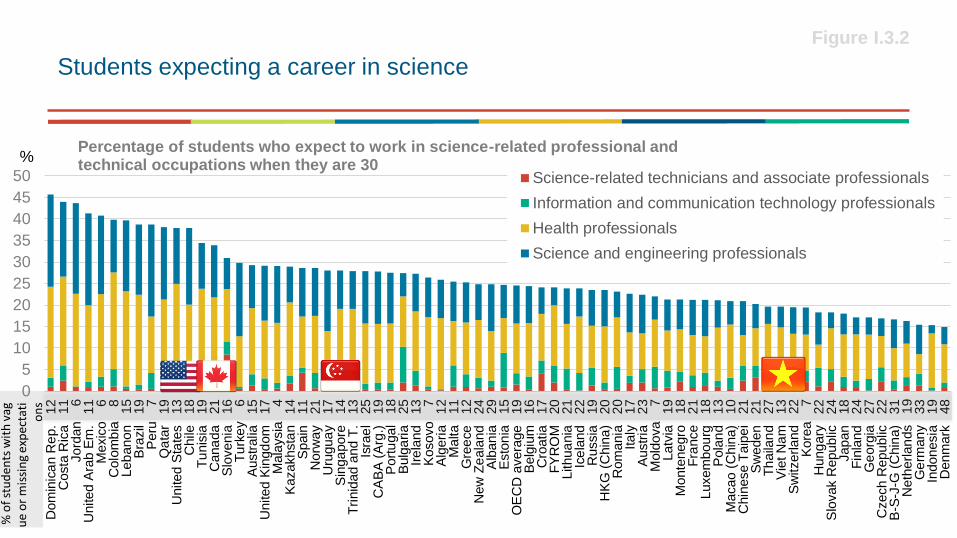
Students expecting a career in science
Figure I.3.2
0
5
10
15
20
25
30
35
40
45
50
Dom
inic
an R
ep. 12
Costa
Ric
a 1
1Jord
an
6
United A
rab E
m. 1
1M
exic
o 6
Colo
mb
ia 8
Leb
anon 1
5B
razil
19
Peru
7
Qa
tar
19
United S
tate
s 1
3C
hile
1
8T
unis
ia 1
9C
ana
da 2
1S
lovenia
1
6T
urk
ey
6
Austr
alia
1
5U
nited K
ingd
om
1
7M
ala
ysia
4
Kazakhsta
n 1
4S
pain
1
1N
orw
ay 2
1U
rugua
y
17
Sin
ga
pore
1
4T
rinid
ad
and
T. 13
Isra
el
25
CA
BA
(A
rg.)
1
9P
ort
ugal 18
Bulg
aria 2
5Ir
ela
nd
13
Kosovo 7
Alg
eri
a 1
2M
alta 1
1G
ree
ce
1
2N
ew
Ze
ala
nd
24
Alb
an
ia 2
9E
sto
nia
1
5O
EC
D a
vera
ge
1
9B
elg
ium
1
6C
roatia 1
7F
YR
OM
2
0Lithua
nia
2
1Ic
ela
nd
22
Russia
1
9H
KG
(C
hin
a)
20
Rom
ania
2
0Italy
1
7A
ustr
ia 2
3M
old
ova
7
Latv
ia 1
9M
onte
negro
1
8F
rance 2
1Luxem
bou
rg 1
8P
ola
nd 1
3M
acao (
Chin
a)
10
Chin
ese T
aip
ei
21
Sw
eden
2
1T
haila
nd 2
7V
iet N
am
1
3S
witzerland
22
Kore
a
7H
ung
ary
2
2S
lovak R
epublic
2
4Japan
1
8F
inla
nd
2
4G
eorg
ia 2
7C
zech R
epublic
2
2B
-S-J
-G (
Chin
a)
3
1N
eth
erlan
ds 1
9G
erm
an
y
33
Indonesia
1
9D
enm
ark
4
8
%Percentage of students who expect to work in science-related professional and technical occupations when they are 30
Science-related technicians and associate professionals
Information and communication technology professionals
Health professionals
Science and engineering professionals
% o
f st
ud
en
tsw
ith
vag
ue
or
mis
sin
gex
pec
tati
on
s
0
10
20
30
40
50
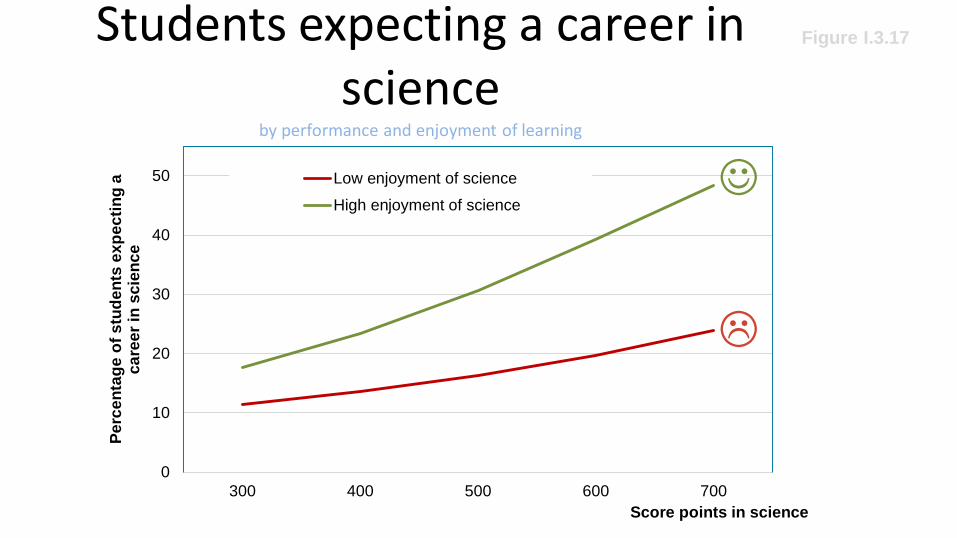
300 400 500 600 700
Pe
rce
nta
ge
of
stu
de
nts
ex
pe
cti
ng
a
ca
ree
r in
sc
ien
ce
Score points in science
Low enjoyment of science
High enjoyment of science
Students expecting a career in science
by performance and enjoyment of learning
Figure I.3.17
☺
Educating students for their future
When fast gets really fast, being slow to adapt makes countries really slow
9
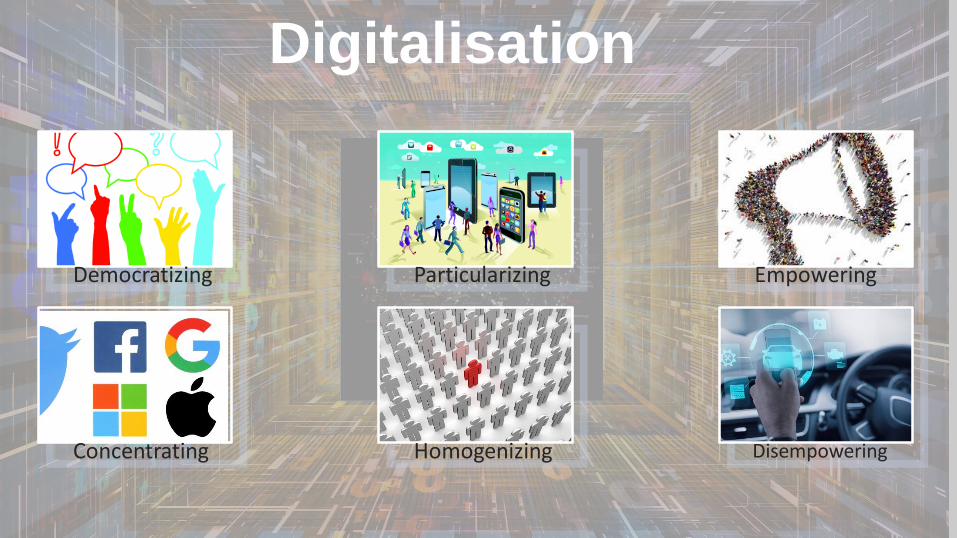
Digitalisation
Democratizing
Concentrating
Particularizing
Homogenizing
Empowering
Disempowering
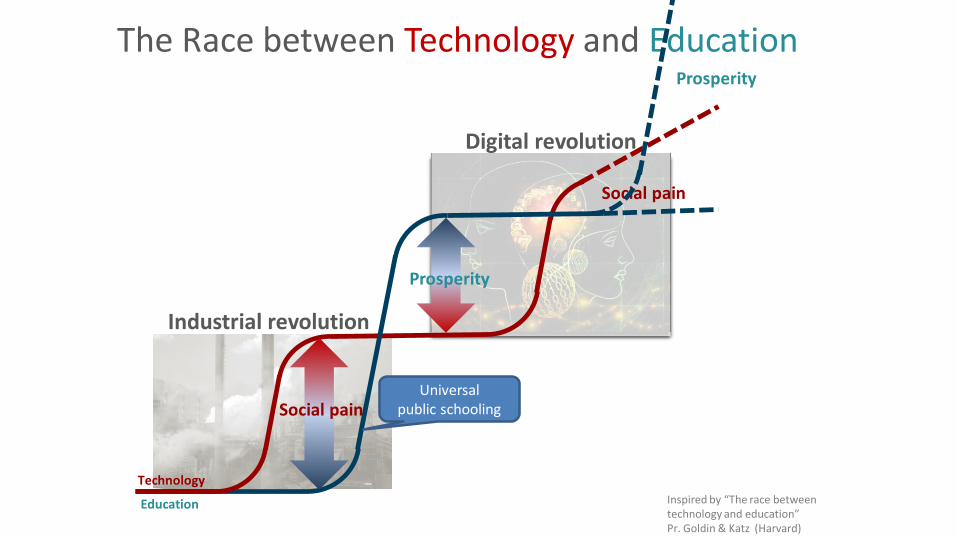
The Race between Technology and Education
Inspired by “The race between technology and education” Pr. Goldin & Katz (Harvard)
Industrial revolution
Digital revolution
Social pain
Universal public schooling
Technology
Education
Prosperity
Social pain
Prosperity

The kind of things that are easy to teach are
now easy to automate, digitize or outsource
35
40
45
50
55
60
65
70
1960 1970 1980 1990 2000 2006 2009
Routine manual
Nonroutine manual
Routine cognitive
Nonroutine analytic
Nonroutine interpersonal
Mean task input in percentiles of 1960 task distribution
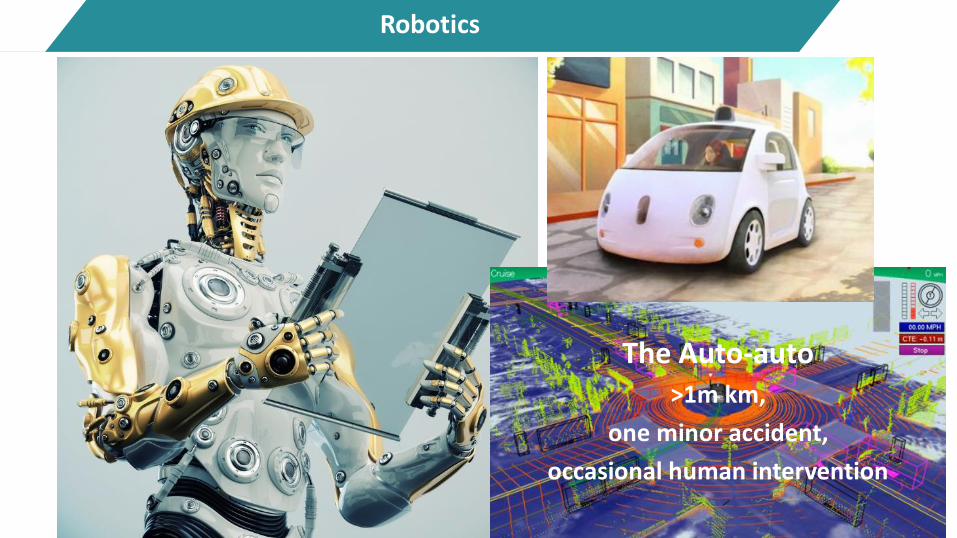
Robotics
The Auto-auto>1m km,
one minor accident,
occasional human intervention
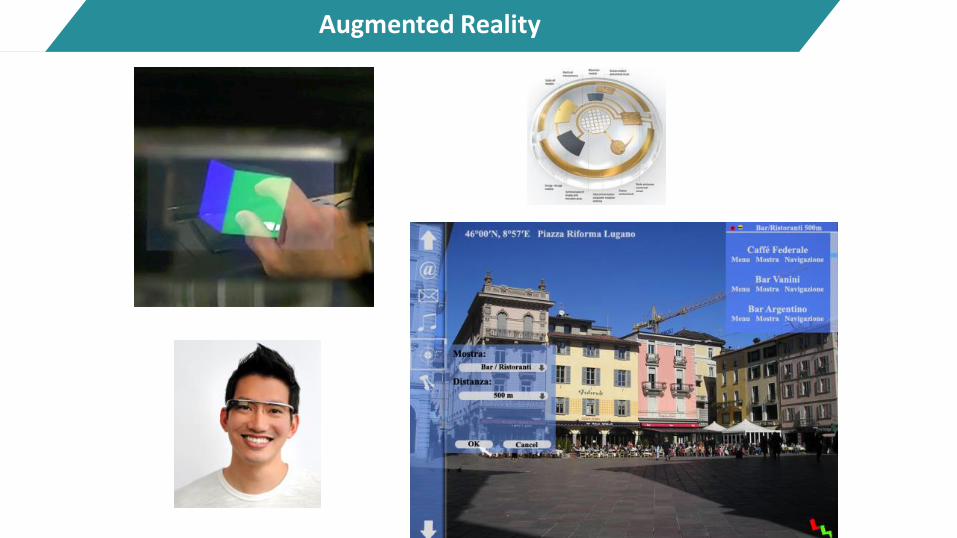
Augmented Reality
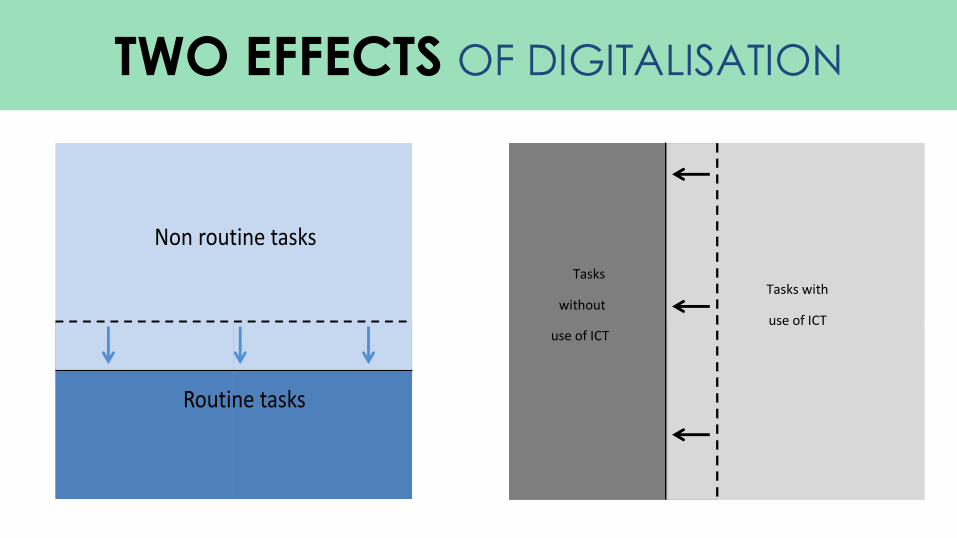
Tasks
without
use of ICT
Tasks with
use of ICT
Non routine tasks
Routine tasks
Non routine tasks
Routine tasks
Tasks
without
use of ICT
Tasks with
use of ICT
TWO EFFECTS OF DIGITALISATION
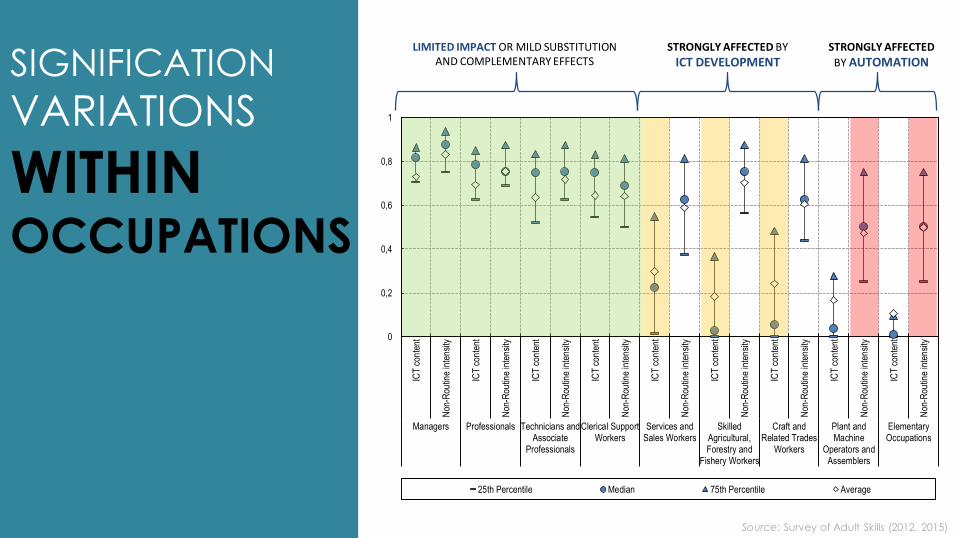
SIGNIFICATION
VARIATIONS
WITHIN OCCUPATIONS
0
0,2
0,4
0,6
0,8
1
ICT
con
tent
Non
-Rou
tine
inte
nsi
ty
ICT
con
tent
Non
-Rou
tine
inte
nsi
ty
ICT
con
tent
Non
-Rou
tine
inte
nsi
ty
ICT
con
tent
Non
-Rou
tine
inte
nsi
ty
ICT
con
tent
Non
-Rou
tine
inte
nsi
ty
ICT
con
tent
Non
-Rou
tine
inte
nsi
ty
ICT
con
tent
Non
-Rou
tine
inte
nsi
ty
ICT
con
tent
Non
-Rou
tine
inte
nsi
ty
ICT
con
tent
Non
-Rou
tine
inte
nsi
ty
Managers Professionals Technicians andAssociate
Professionals
Clerical SupportWorkers
Services andSales Workers
SkilledAgricultural,Forestry and
Fishery Workers
Craft andRelated Trades
Workers
Plant andMachine
Operators andAssemblers
ElementaryOccupations
25th Percentile Median 75th Percentile Average
LIMITED IMPACT OR MILD SUBSTITUTION AND COMPLEMENTARY EFFECTS
STRONGLY AFFECTED BY
ICT DEVELOPMENTSTRONGLY AFFECTED
BY AUTOMATION
Source: Survey of Adult Skills (2012, 2015)
Developing relevant skills
100 80 60 40 20 0 20 40
TurkeyGreece
ChileLithuania
IsraelUnited States
PolandRussian Federation
IrelandSlovak Republic
England (UK)Northern Ireland (UK)
JapanOECD average
SloveniaEstonia
DenmarkAustria
AustraliaCanada
New ZealandGermany
Czech RepublicNorway
Flanders (Belgium)Netherlands
SwedenFinland
KoreaSingapore
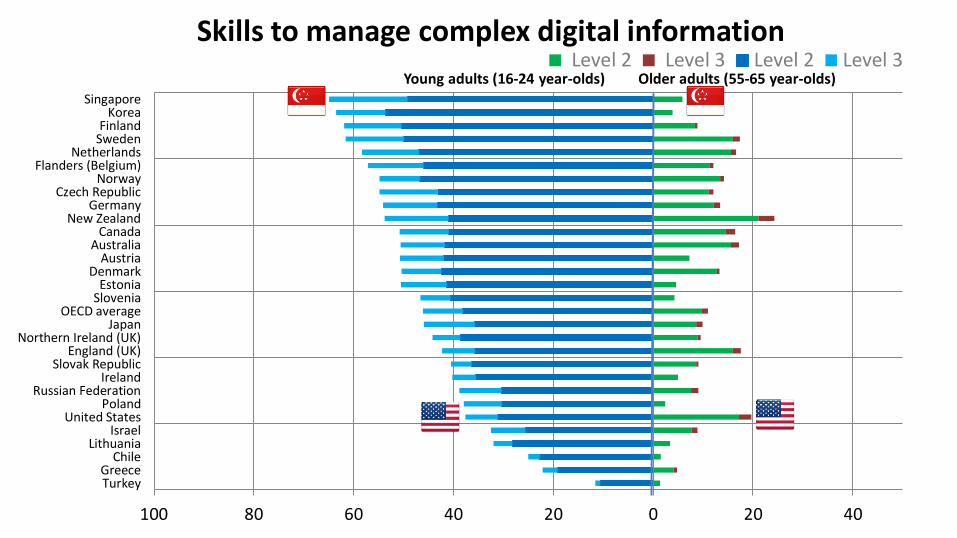
Level 2 Level 3 Level 2 Level 3Skills to manage complex digital information
Young adults (16-24 year-olds) Older adults (55-65 year-olds)

Some students learn at high levels

All students learn at high levels

Delivered wisdom
User-generated wisdom
Recognising both students and adults as resources for the co-creation of communities, for the design
of learning and for the success of students

Bureaucratic Look-up

Devolved Look-outward

0
10
20
30
40
50
60
70
80
90
100
Discu
ss indiv
idual
students
Share
reso
urc
es
Team
confe
rence
s
Colla
bora
te for
com
mon s
tandard
s
Team
teac
hin
g
Colla
bora
tive
PD
Join
t ac
tivi
ties
Cla
ssro
om
obse
rvations
Perc
enta
ge o
f te
ach
ers
Average
Professional collaboration
Percentage of lower secondary teachers who report doing the following activities at least once per month
Professional collaboration among teachers
Exchange and co-ordination
(OECD countries)
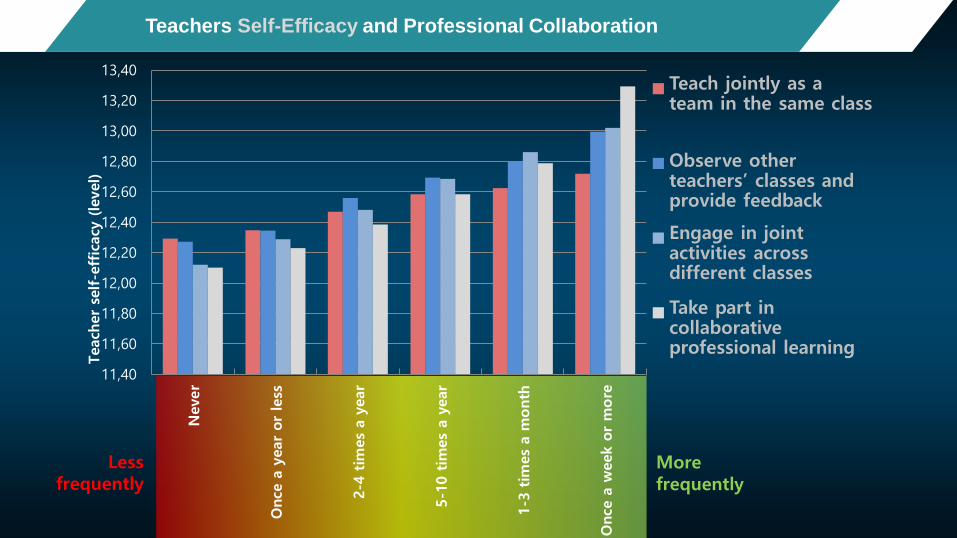
Teachers Self-Efficacy and Professional Collaboration
11,40
11,60
11,80
12,00
12,20
12,40
12,60
12,80
13,00
13,20
13,40
Never
Once
a y
ear
or
less
2-4
tim
es
a y
ear
5-1
0 t
imes
a y
ear
1-3
tim
es
a m
onth
Once a
week o
r m
ore
Teach
er
self-e
ffic
acy
(le
vel)
Teach jointly as a team in the same class
Observe other teachers’ classes and provide feedback
Engage in joint activities across different classes
Take part in collaborative professional learning
Less frequently
Morefrequently
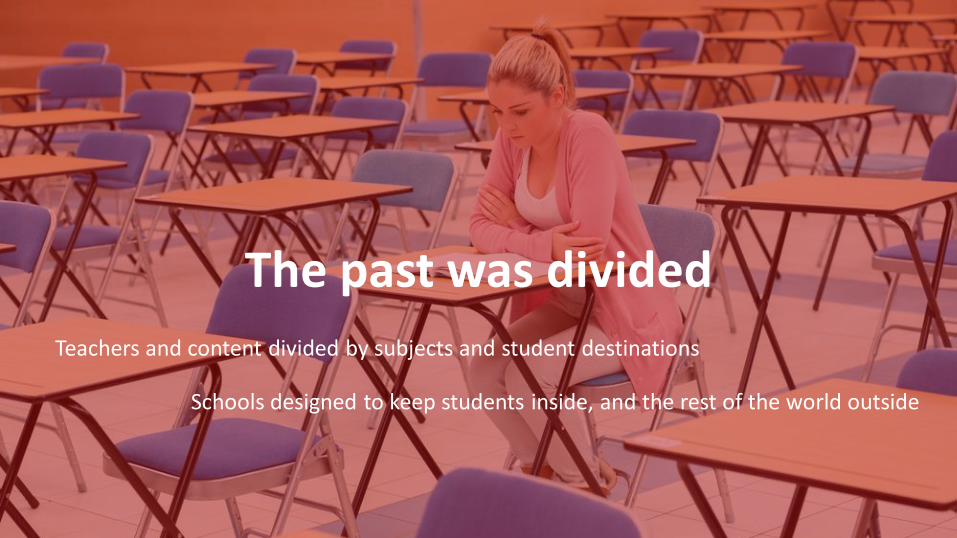
The past was divided
Teachers and content divided by subjects and student destinations
Schools designed to keep students inside, and the rest of the world outside

The future is integratedIntegrated: Emphasising integration of subjects, integration of
students and integration of learning contexts
Connected: with real-world contexts, and permeable to the rich resources in the community
Less subject-based, more project-based

Uniformity

Diversity
Embracing diversity with differentiated pedagogical practices
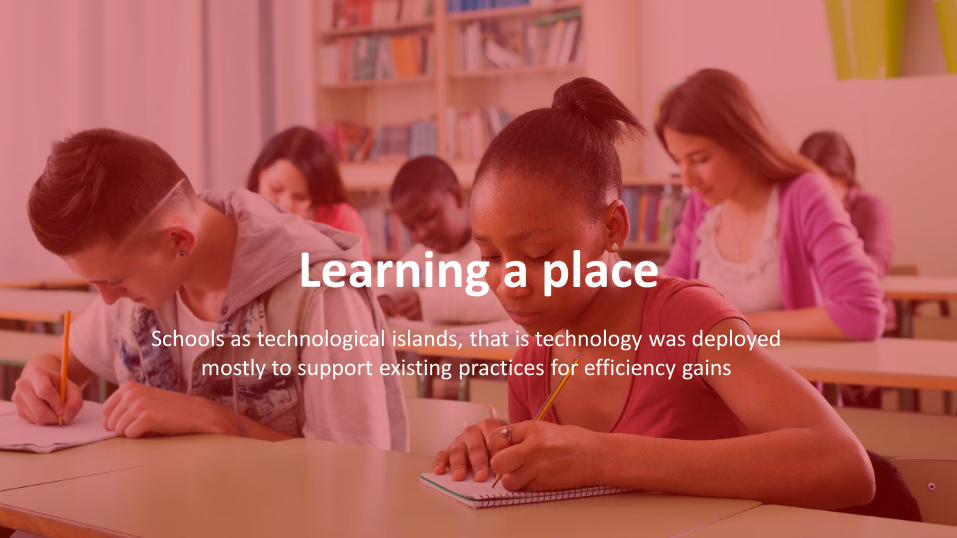
Learning a placeSchools as technological islands, that is technology was deployed
mostly to support existing practices for efficiency gains
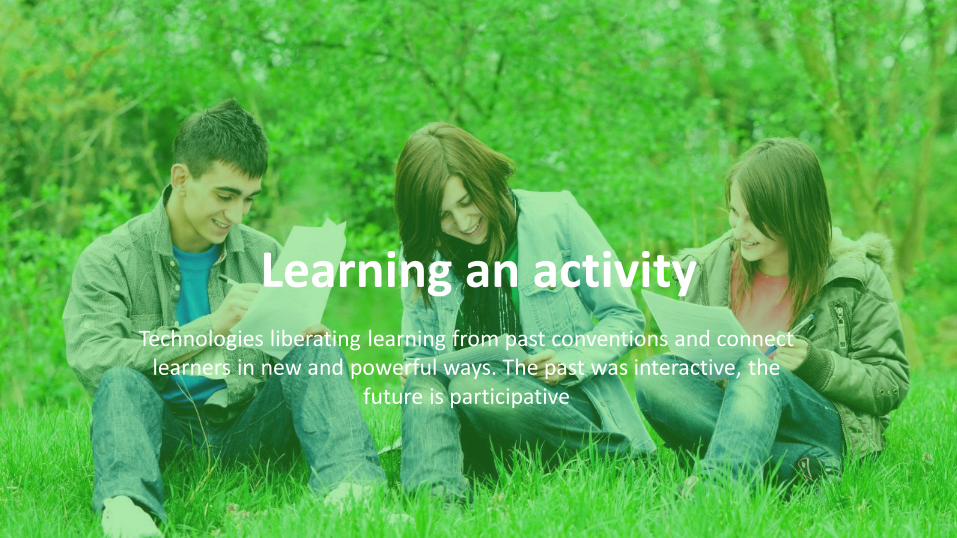
Learning an activityTechnologies liberating learning from past conventions and connect
learners in new and powerful ways. The past was interactive, the future is participative
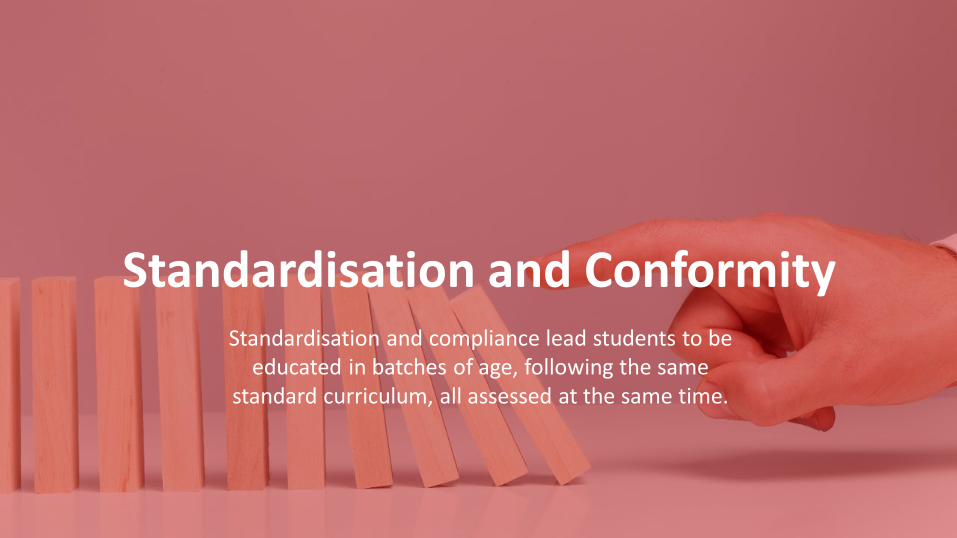
Standardisation and ConformityStandardisation and compliance lead students to be
educated in batches of age, following the same standard curriculum, all assessed at the same time.

Ingenious
Building instruction from student passions and capacities, helping students personalise their learning and
assessment in ways that foster engagement and talents.
%
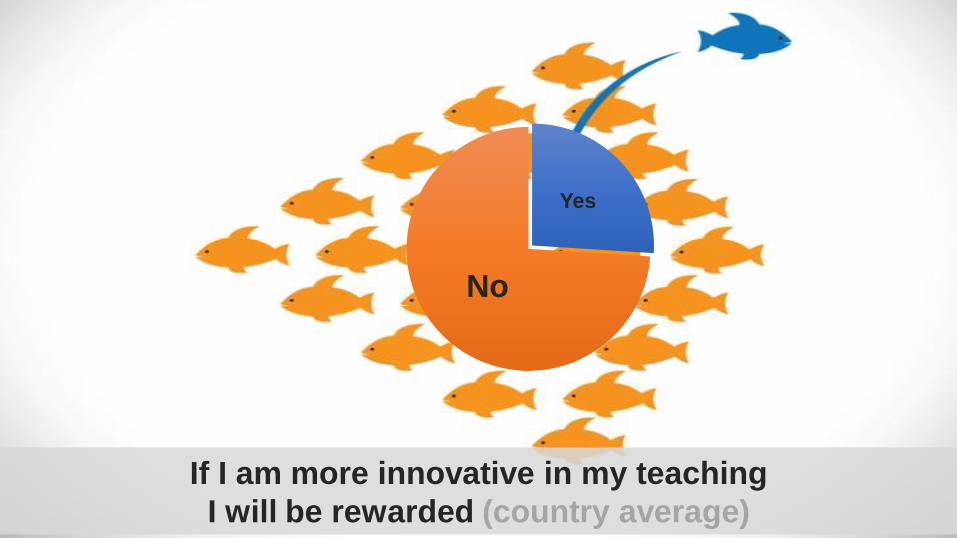
Yes
No
If I am more innovative in my teaching
I will be rewarded (country average)

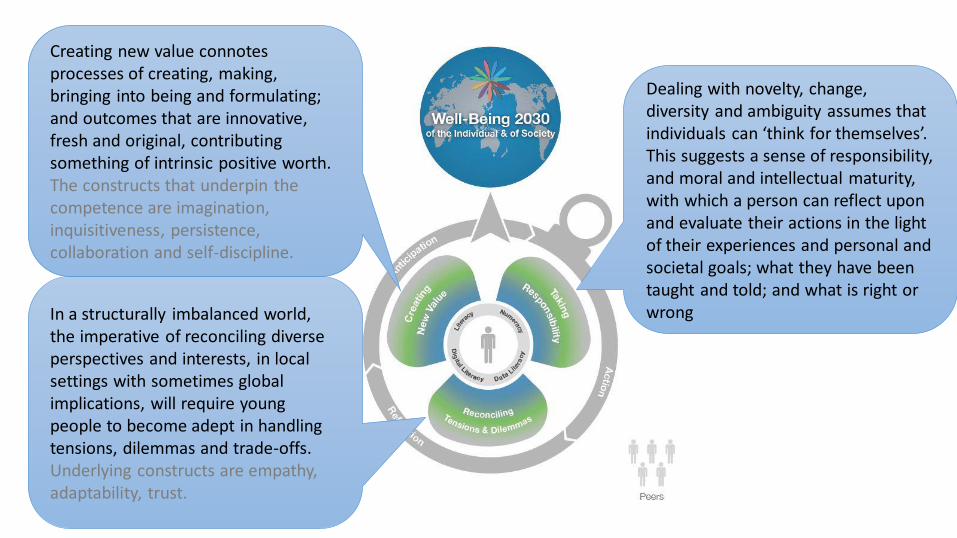
Creating new value connotes processes of creating, making, bringing into being and formulating; and outcomes that are innovative, fresh and original, contributing something of intrinsic positive worth. The constructs that underpin the competence are imagination, inquisitiveness, persistence, collaboration and self-discipline.
In a structurally imbalanced world, the imperative of reconciling diverse perspectives and interests, in local settings with sometimes global implications, will require young people to become adept in handling tensions, dilemmas and trade-offs. Underlying constructs are empathy, adaptability, trust.
Dealing with novelty, change, diversity and ambiguity assumes that individuals can ‘think for themselves’. This suggests a sense of responsibility, and moral and intellectual maturity, with which a person can reflect upon and evaluate their actions in the light of their experiences and personal and societal goals; what they have been taught and told; and what is right or wrong
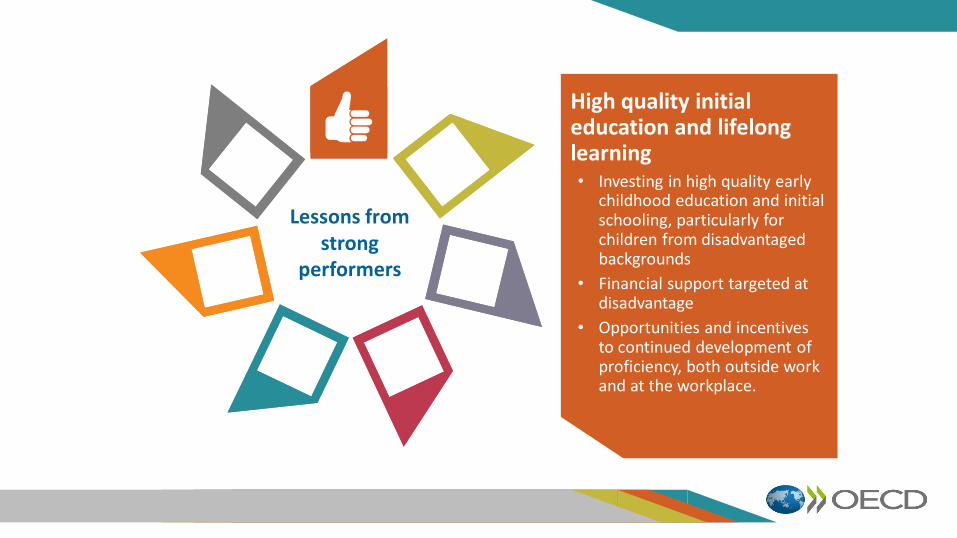
Lessons from strong
performers
High quality initial education and lifelong learning• Investing in high quality early
childhood education and initial schooling, particularly for children from disadvantaged backgrounds
• Financial support targeted at disadvantage
• Opportunities and incentives to continued development of proficiency, both outside work and at the workplace.
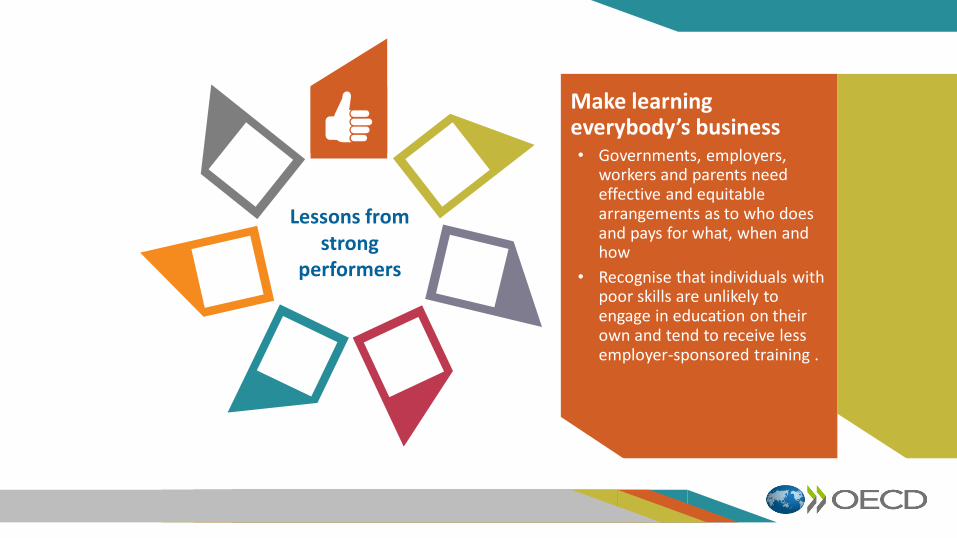
Lessons from strong
performers
Make learning everybody’s business• Governments, employers,
workers and parents need effective and equitable arrangements as to who does and pays for what, when and how
• Recognise that individuals with poor skills are unlikely to engage in education on their own and tend to receive less employer-sponsored training .
Lessons from strong
performers
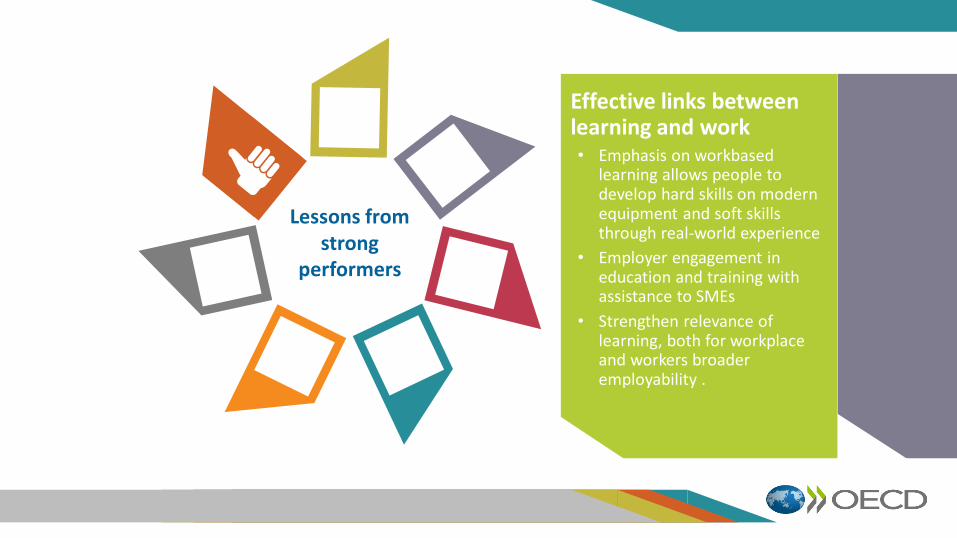
Effective links between learning and work• Emphasis on workbased
learning allows people to develop hard skills on modern equipment and soft skills through real-world experience
• Employer engagement in education and training with assistance to SMEs
• Strengthen relevance of learning, both for workplace and workers broader employability .
Lessons from strong
performers
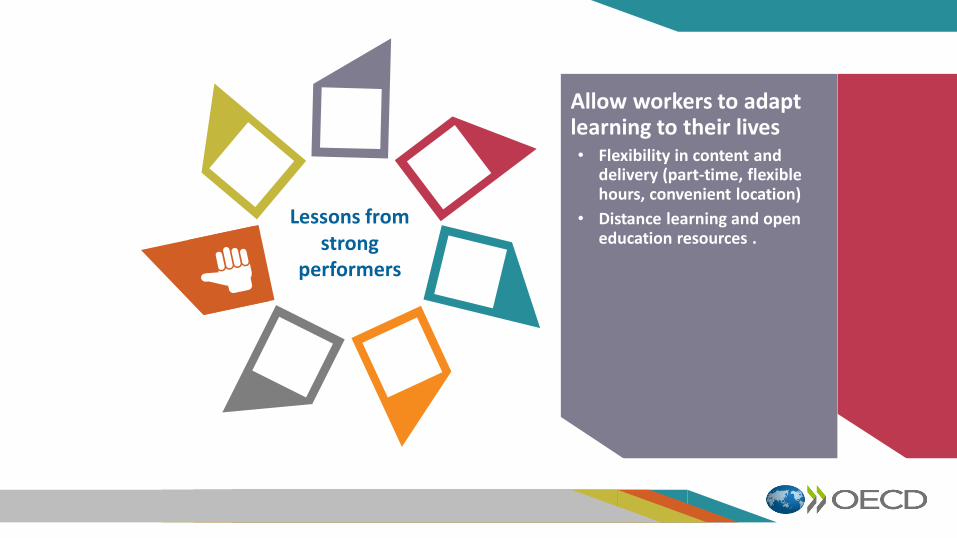
Allow workers to adapt learning to their lives• Flexibility in content and
delivery (part-time, flexible hours, convenient location)
• Distance learning and open education resources .
Lessons from strong
performers
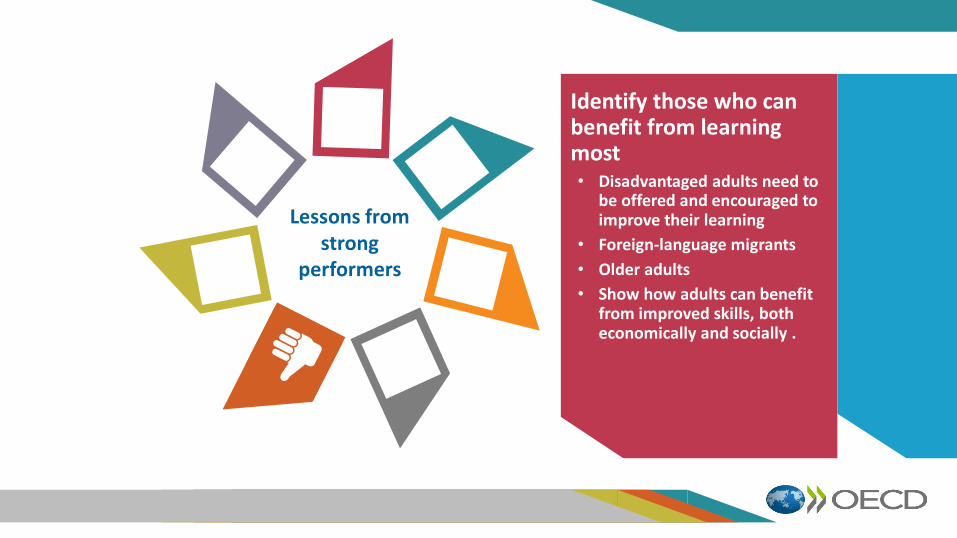
Identify those who can benefit from learning most• Disadvantaged adults need to
be offered and encouraged to improve their learning
• Foreign-language migrants
• Older adults
• Show how adults can benefit from improved skills, both economically and socially .
Lessons from strong
performers
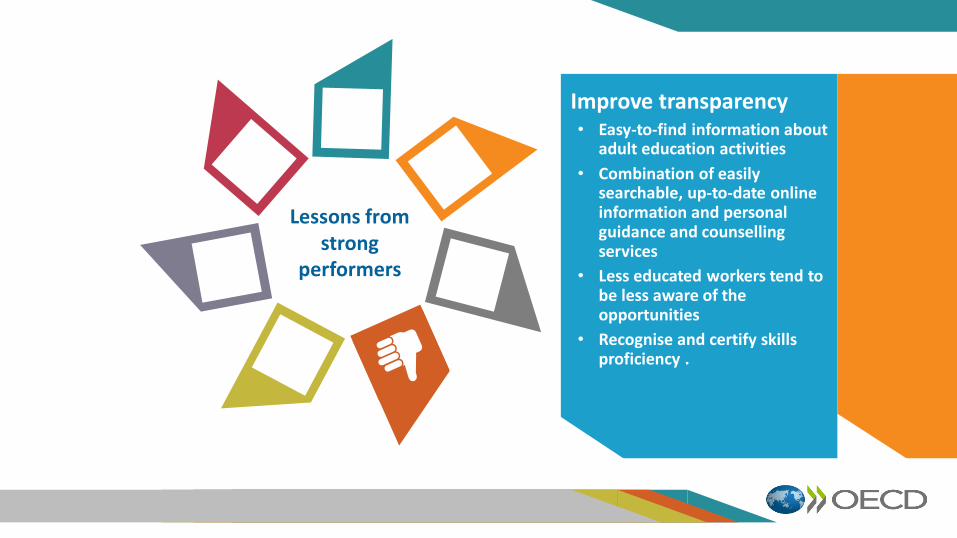
Improve transparency• Easy-to-find information about
adult education activities
• Combination of easily searchable, up-to-date online information and personal guidance and counselling services
• Less educated workers tend to be less aware of the opportunities
• Recognise and certify skills proficiency .
Lessons from strong
performers
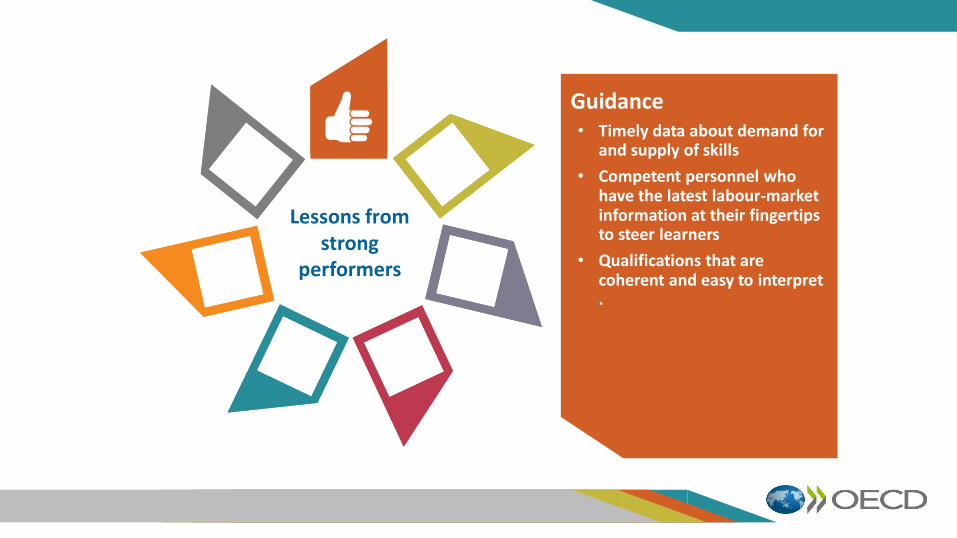
Guidance• Timely data about demand for
and supply of skills
• Competent personnel who have the latest labour-market information at their fingertips to steer learners
• Qualifications that are coherent and easy to interpret .
Lessons from strong
performers
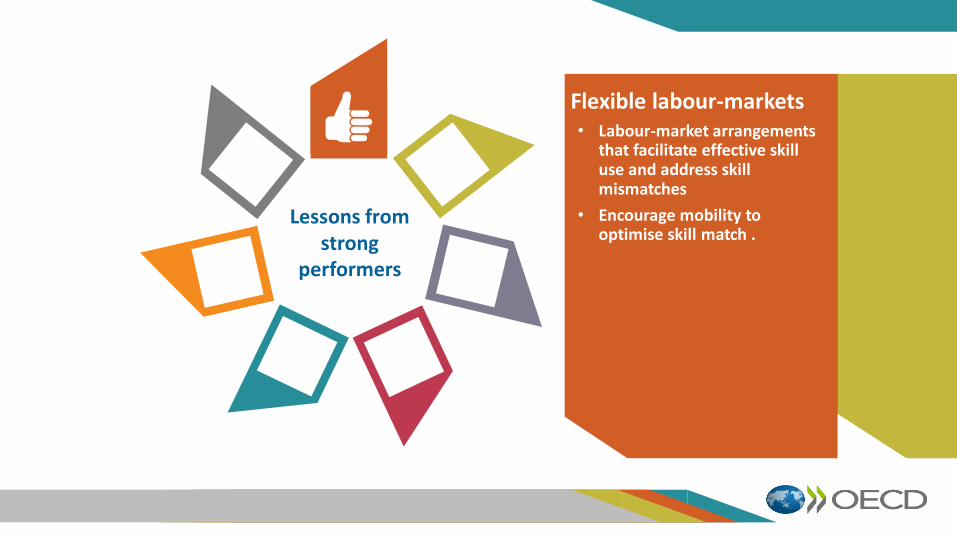
Flexible labour-markets• Labour-market arrangements
that facilitate effective skill use and address skill mismatches
• Encourage mobility to optimise skill match .
Lessons from strong
performers
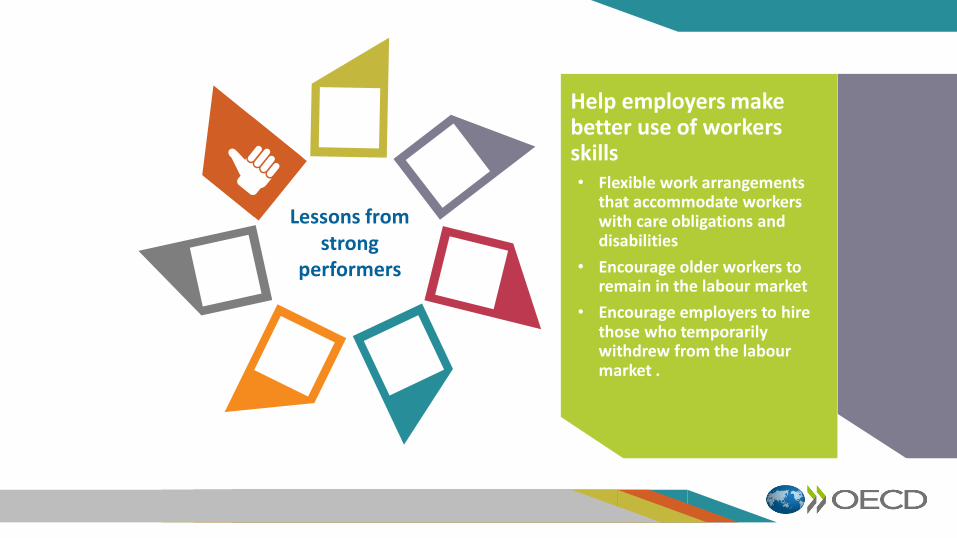
Help employers make better use of workers skills• Flexible work arrangements
that accommodate workers with care obligations and disabilities
• Encourage older workers to remain in the labour market
• Encourage employers to hire those who temporarily withdrew from the labour market .
Lessons from strong
performers
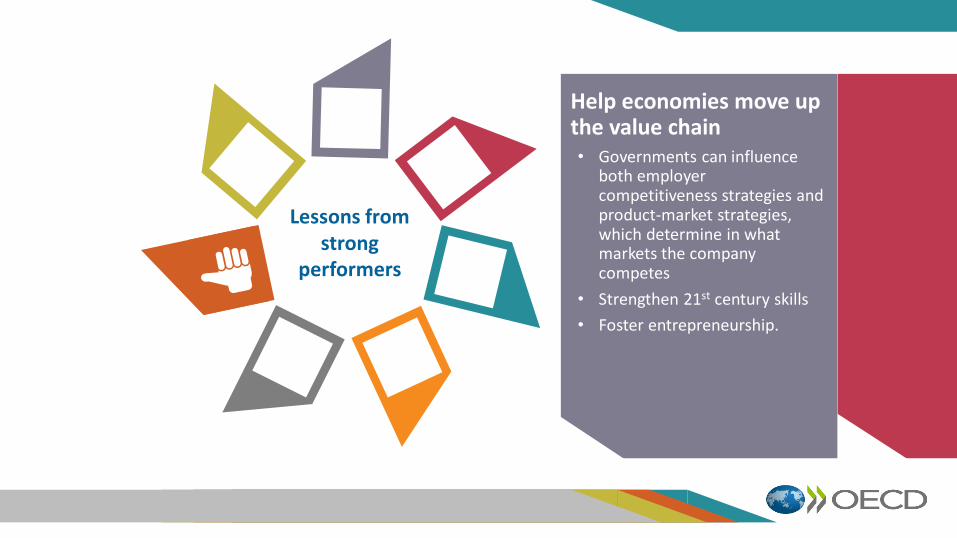
Help economies move up the value chain• Governments can influence
both employer competitiveness strategies and product-market strategies, which determine in what markets the company competes
• Strengthen 21st century skills
• Foster entrepreneurship.
47
47 Thank you
Find out more about our work at www.oecd.org– All publications
– The complete micro-level database
Email: [email protected]
Twitter: SchleicherEDU
and remember:
Without data, you are just another person with an opinion