Embed Size (px)
Citation preview
This information is provided to Members of Parliament in support of their parliamentary duties and is not intended
to address the specific circumstances of any particular individual. It should not be relied upon as being up to date;
the law or policies may have changed since it was last updated; and it should not be relied upon as legal or
professional advice or as a substitute for it. A suitably qualified professional should be consulted if specific advice
or information is required.
This information is provided subject to our general terms and conditions which are available online or may be
provided on request in hard copy. Authors are available to discuss the content of this briefing with Members and
their staff, but not with the general public.
Education spending in the UK
Standard Note: SN/SG/1078
Last updated: 10 December 2014
Author: Paul Bolton
Section Social & General Statistics
Spending in the current and future years Since 2010 no spending review or budget has set out detailed figures on total UK
education spending in the current year or plans for the future. Education spending covers
different Whitehall departments, central and local government spending and the devolved
administrations. This means it cannot be calculated from departmental plans which go up
to the end of the most recent spending review period (currently 2015-16). This note
therefore relies on outturn spending data which has no forward looking element. Some
relevant spending plans up to 2015-16 are summarised towards the end of this note.
Levels of public spending on education in the UK reached new record levels in real terms in
each year between 1996-97 and 2010-11. Spending as a proportion of GDP in 2009-10 and
2010-11 was at its highest since the mid-1970s. In 2011 UK public expenditure on education
as a proportion of GDP was above the level in most other EU countries and above the OECD
average.
This note looks at trends in public sector education expenditure in the UK. Some more detail
can be found in Public expenditure statistical analysis 2014 including a breakdown of total
expenditure by type of education and spending in total and per head in the different parts of
the UK. The annual report and accounts of the Department for Education and the
Department for Business, Innovation & Skills both include more technical detail of spending
in the most recent year and, in appendices, plans to the end of the current spending review
period. Chapter B of the OECD’s Education at a Glance 2014 compares education spending
across OECD and other countries.
The standard notes Changes to higher education funding and student support from 2012/13
and HE in England from 2012: Funding and finance look in detail at spending on higher
education in England. The Department for Education publishes a wide range of data and
analysis on school funding and expenditure in England under different headings. The most
useful can be found at: Statistics: local authority/school finance data, School and college
funding and finance, Section 251 documents and Making schools and colleges more
accountable and funding them fairly.
2
Contents
1 UK public expenditure on education since 1979 2
1.1 Education expenditure since 1979 3
1.2 Education and training since 1987 5
Expenditure by region and nation 7
1.3 Expenditure plans for 2014-15 and 2015-16 9
2 Long term trends in public expenditure 9
3 International comparisons 12
4 Reference tables 13
5 Appendix –Trends in education spending to 2011-12 v population change 15
1 UK public expenditure on education since 1979
A note on terms This section looks at two main series; total UK public expenditure on education and total
UK public spending on education and training. These have not been explicitly
distinguished in recent official statistics on public spending, but this note uses the former
descriptions where ‘education’ excludes the ‘education not elsewhere classified’ sub-
function1 and ‘education and training’ includes it. The definition of this sub-function has not
changed, but official statistics now use education to refer to what was known as education
and training in the past.
This note retains the distinction between the terms for two reasons. First the education
and training series only goes back to the late 1980s, while the education series goes back
much further, even with some breaks in the series the concept remains the same. Second
the education and training series is consistent over the period it is available for. The
spending data are regularly revised. These revisions can change the total figure, or move
items of expenditure from one sub-function to another. The detailed breakdown by sub-
function is only revised back five years. This presents a problem with consistency when
trying to compile long-term series based on sub-functions and the authors warn against
simply splicing one set of data with another pre and post-revision. The education and
training series in this note is therefore consistent for its entire length. The education series
is not and although revisions are generally quite small, readers should be careful when
drawing conclusions from this data, especially those based on small differences.
The spending data analysed here cover all stages of education from under fives to
postgraduate and adult education and the administrative costs of running the education
system. The figures include the costs of student support, including the subsidy element of
student loans which are not included in some public expenditure aggregates. 1 The Government uses the UN Classifications of the Functions of Government to classify spending by function
and sub-function.
3
1.1 Education expenditure since 1979
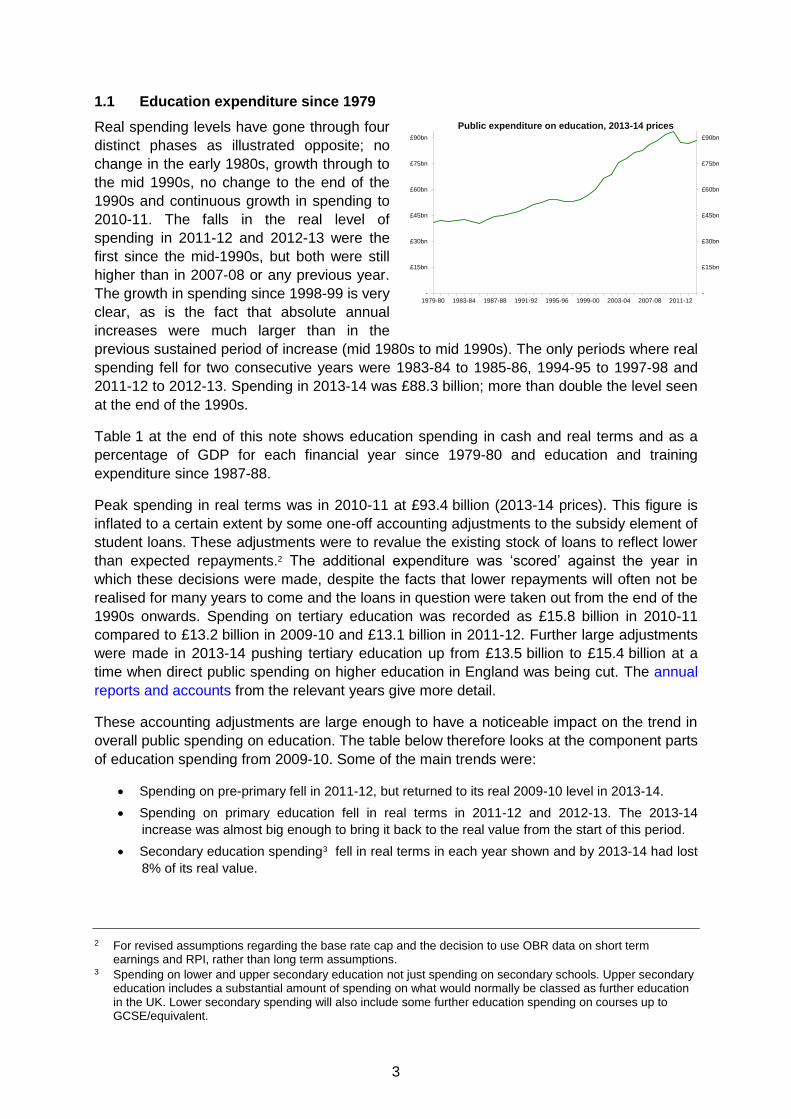
Real spending levels have gone through four
distinct phases as illustrated opposite; no
change in the early 1980s, growth through to
the mid 1990s, no change to the end of the
1990s and continuous growth in spending to
2010-11. The falls in the real level of
spending in 2011-12 and 2012-13 were the
first since the mid-1990s, but both were still
higher than in 2007-08 or any previous year.
The growth in spending since 1998-99 is very
clear, as is the fact that absolute annual
increases were much larger than in the
previous sustained period of increase (mid 1980s to mid 1990s). The only periods where real
spending fell for two consecutive years were 1983-84 to 1985-86, 1994-95 to 1997-98 and
2011-12 to 2012-13. Spending in 2013-14 was £88.3 billion; more than double the level seen
at the end of the 1990s.
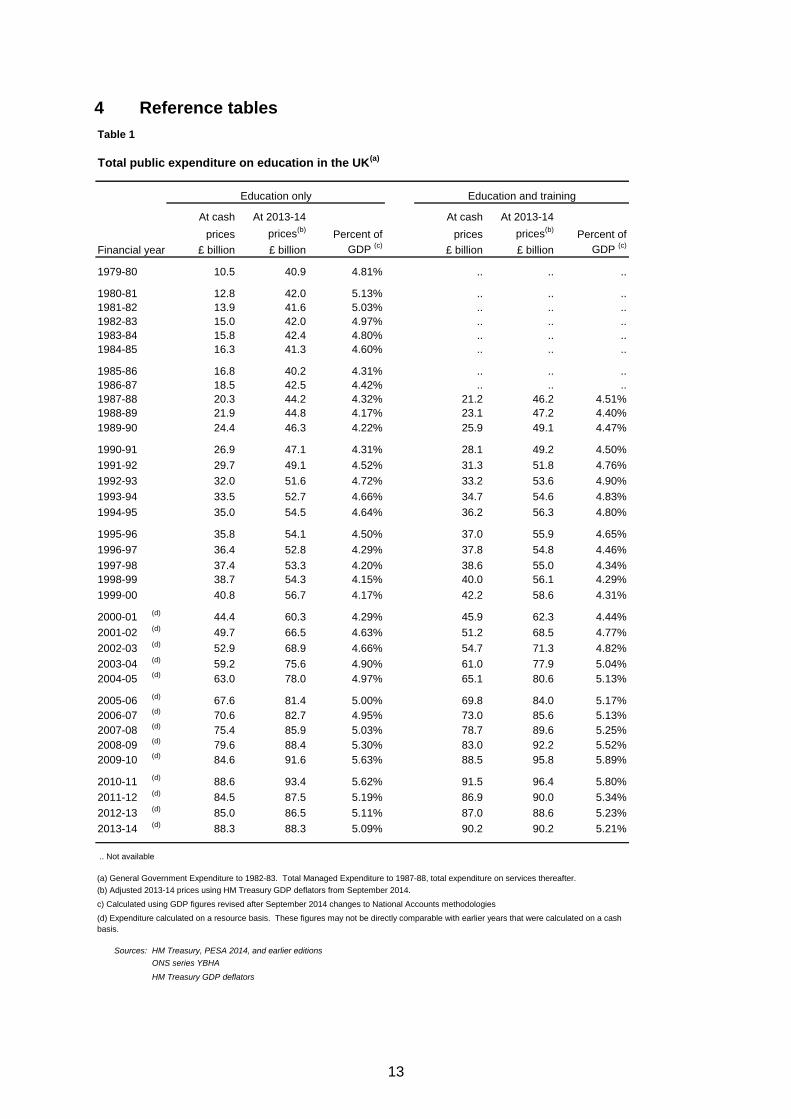
Table 1 at the end of this note shows education spending in cash and real terms and as a
percentage of GDP for each financial year since 1979-80 and education and training
expenditure since 1987-88.
Peak spending in real terms was in 2010-11 at £93.4 billion (2013-14 prices). This figure is
inflated to a certain extent by some one-off accounting adjustments to the subsidy element of
student loans. These adjustments were to revalue the existing stock of loans to reflect lower
than expected repayments.2 The additional expenditure was ‘scored’ against the year in
which these decisions were made, despite the facts that lower repayments will often not be
realised for many years to come and the loans in question were taken out from the end of the
1990s onwards. Spending on tertiary education was recorded as £15.8 billion in 2010-11
compared to £13.2 billion in 2009-10 and £13.1 billion in 2011-12. Further large adjustments
were made in 2013-14 pushing tertiary education up from £13.5 billion to £15.4 billion at a
time when direct public spending on higher education in England was being cut. The annual
reports and accounts from the relevant years give more detail.
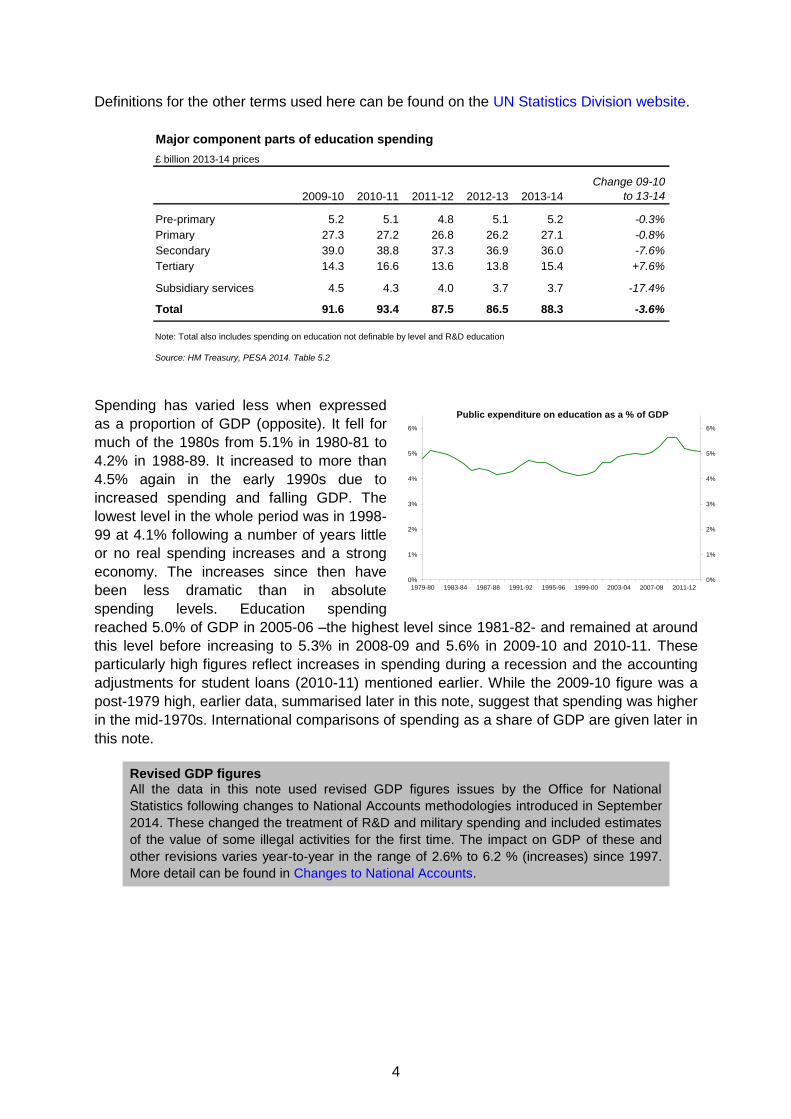
These accounting adjustments are large enough to have a noticeable impact on the trend in
overall public spending on education. The table below therefore looks at the component parts
of education spending from 2009-10. Some of the main trends were:
Spending on pre-primary fell in 2011-12, but returned to its real 2009-10 level in 2013-14.
Spending on primary education fell in real terms in 2011-12 and 2012-13. The 2013-14
increase was almost big enough to bring it back to the real value from the start of this period.
Secondary education spending3 fell in real terms in each year shown and by 2013-14 had lost
8% of its real value.
2 For revised assumptions regarding the base rate cap and the decision to use OBR data on short term
earnings and RPI, rather than long term assumptions. 3 Spending on lower and upper secondary education not just spending on secondary schools. Upper secondary
education includes a substantial amount of spending on what would normally be classed as further education in the UK. Lower secondary spending will also include some further education spending on courses up to GCSE/equivalent.
-
£15bn
£30bn
£45bn
£60bn
£75bn
£90bn
-
£15bn
£30bn
£45bn
£60bn
£75bn
£90bn
1979-80 1983-84 1987-88 1991-92 1995-96 1999-00 2003-04 2007-08 2011-12
Public expenditure on education, 2013-14 prices
4
Definitions for the other terms used here can be found on the UN Statistics Division website.
Spending has varied less when expressed
as a proportion of GDP (opposite). It fell for
much of the 1980s from 5.1% in 1980-81 to
4.2% in 1988-89. It increased to more than
4.5% again in the early 1990s due to
increased spending and falling GDP. The
lowest level in the whole period was in 1998-
99 at 4.1% following a number of years little
or no real spending increases and a strong
economy. The increases since then have
been less dramatic than in absolute
spending levels. Education spending
reached 5.0% of GDP in 2005-06 –the highest level since 1981-82- and remained at around
this level before increasing to 5.3% in 2008-09 and 5.6% in 2009-10 and 2010-11. These
particularly high figures reflect increases in spending during a recession and the accounting
adjustments for student loans (2010-11) mentioned earlier. While the 2009-10 figure was a
post-1979 high, earlier data, summarised later in this note, suggest that spending was higher
in the mid-1970s. International comparisons of spending as a share of GDP are given later in
this note.
Revised GDP figures All the data in this note used revised GDP figures issues by the Office for National
Statistics following changes to National Accounts methodologies introduced in September
2014. These changed the treatment of R&D and military spending and included estimates
of the value of some illegal activities for the first time. The impact on GDP of these and
other revisions varies year-to-year in the range of 2.6% to 6.2 % (increases) since 1997.
More detail can be found in Changes to National Accounts.
Major component parts of education spending
£ billion 2013-14 prices
2009-10 2010-11 2011-12 2012-13 2013-14
Change 09-10
to 13-14
Pre-primary 5.2 5.1 4.8 5.1 5.2 -0.3%
Primary 27.3 27.2 26.8 26.2 27.1 -0.8%
Secondary 39.0 38.8 37.3 36.9 36.0 -7.6%
Tertiary 14.3 16.6 13.6 13.8 15.4 +7.6%
Subsidiary services 4.5 4.3 4.0 3.7 3.7 -17.4%
Total 91.6 93.4 87.5 86.5 88.3 -3.6%
Note: Total also includes spending on education not definable by level and R&D education
Source: HM Treasury, PESA 2014. Table 5.2
0%
1%
2%
3%
4%
5%
6%
0%
1%
2%
3%
4%
5%
6%
1979-80 1983-84 1987-88 1991-92 1995-96 1999-00 2003-04 2007-08 2011-12
Public expenditure on education as a % of GDP
5
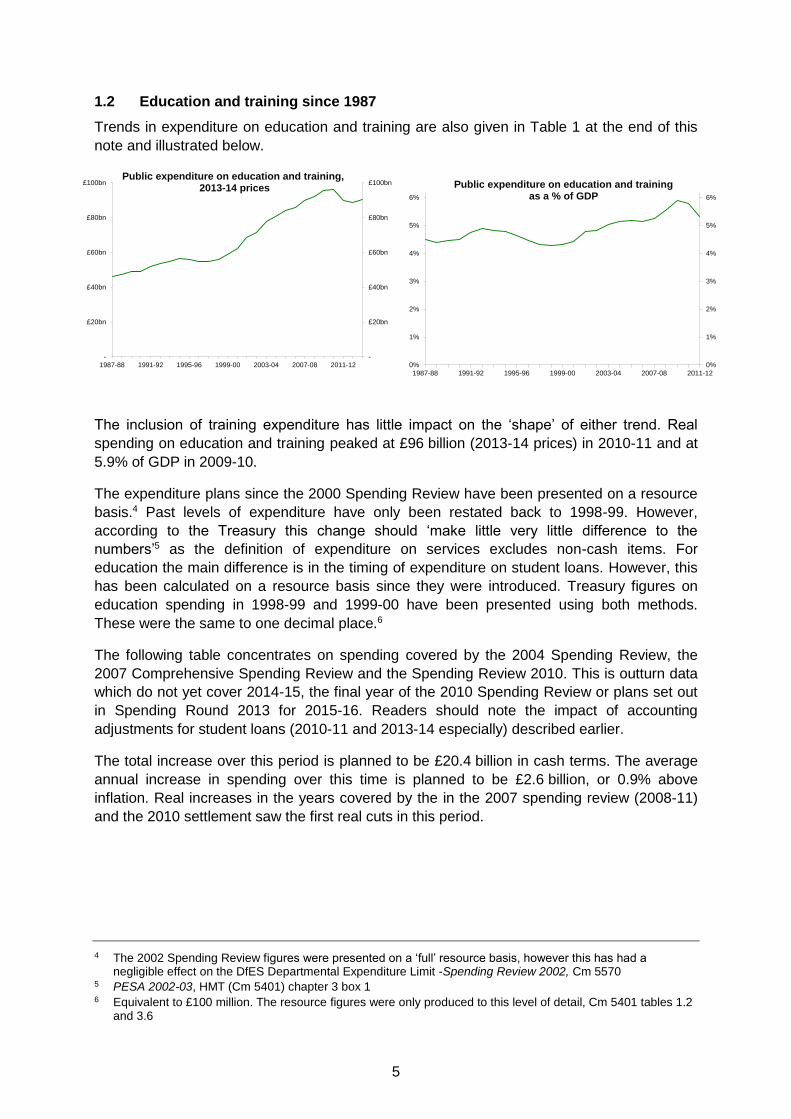
1.2 Education and training since 1987
Trends in expenditure on education and training are also given in Table 1 at the end of this
note and illustrated below.
The inclusion of training expenditure has little impact on the ‘shape’ of either trend. Real
spending on education and training peaked at £96 billion (2013-14 prices) in 2010-11 and at
5.9% of GDP in 2009-10.
The expenditure plans since the 2000 Spending Review have been presented on a resource
basis.4 Past levels of expenditure have only been restated back to 1998-99. However,
according to the Treasury this change should ‘make little very little difference to the
numbers’5 as the definition of expenditure on services excludes non-cash items. For
education the main difference is in the timing of expenditure on student loans. However, this
has been calculated on a resource basis since they were introduced. Treasury figures on
education spending in 1998-99 and 1999-00 have been presented using both methods.
These were the same to one decimal place.6
The following table concentrates on spending covered by the 2004 Spending Review, the
2007 Comprehensive Spending Review and the Spending Review 2010. This is outturn data
which do not yet cover 2014-15, the final year of the 2010 Spending Review or plans set out
in Spending Round 2013 for 2015-16. Readers should note the impact of accounting
adjustments for student loans (2010-11 and 2013-14 especially) described earlier.
The total increase over this period is planned to be £20.4 billion in cash terms. The average
annual increase in spending over this time is planned to be £2.6 billion, or 0.9% above
inflation. Real increases in the years covered by the in the 2007 spending review (2008-11)
and the 2010 settlement saw the first real cuts in this period.
4 The 2002 Spending Review figures were presented on a ‘full’ resource basis, however this has had a
negligible effect on the DfES Departmental Expenditure Limit -Spending Review 2002, Cm 5570 5 PESA 2002-03, HMT (Cm 5401) chapter 3 box 1 6 Equivalent to £100 million. The resource figures were only produced to this level of detail, Cm 5401 tables 1.2
and 3.6
-
£20bn
£40bn
£60bn
£80bn
£100bn
-
£20bn
£40bn
£60bn
£80bn
£100bn
1987-88 1991-92 1995-96 1999-00 2003-04 2007-08 2011-12
Public expenditure on education and training,2013-14 prices
0%
1%
2%
3%
4%
5%
6%
0%
1%
2%
3%
4%
5%
6%
1987-88 1991-92 1995-96 1999-00 2003-04 2007-08 2011-12
Public expenditure on education and trainingas a % of GDP
6
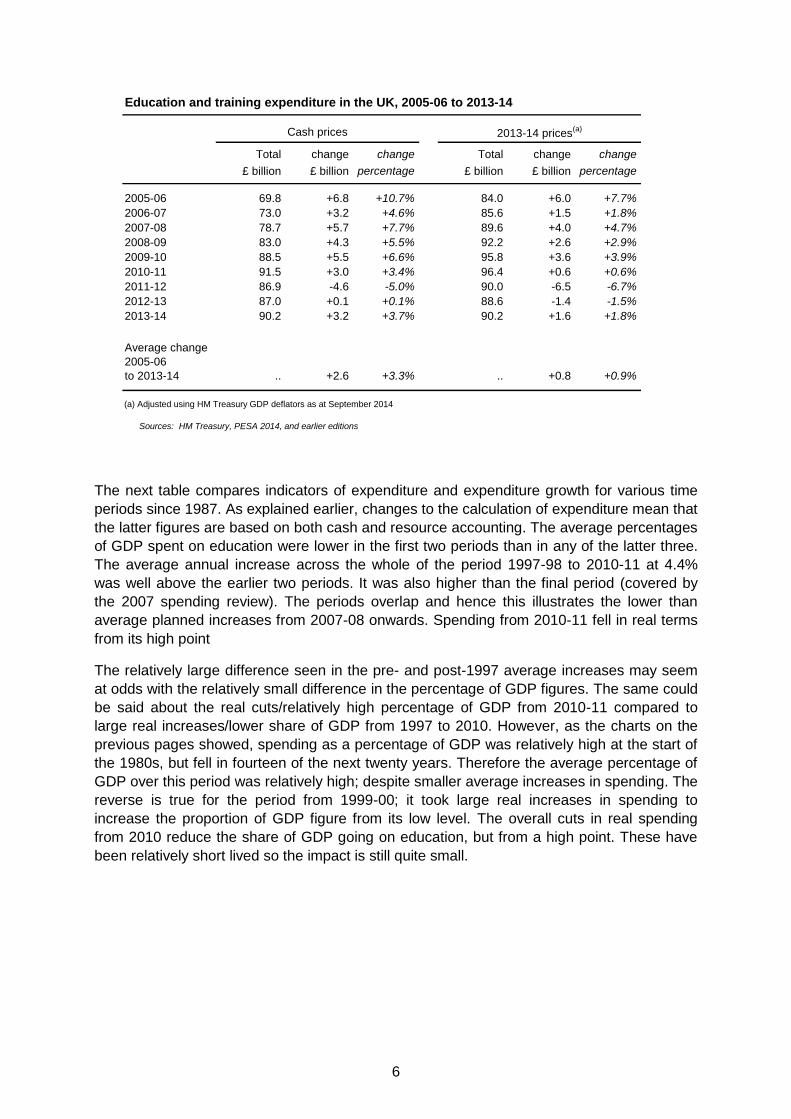
The next table compares indicators of expenditure and expenditure growth for various time
periods since 1987. As explained earlier, changes to the calculation of expenditure mean that
the latter figures are based on both cash and resource accounting. The average percentages
of GDP spent on education were lower in the first two periods than in any of the latter three.
The average annual increase across the whole of the period 1997-98 to 2010-11 at 4.4%
was well above the earlier two periods. It was also higher than the final period (covered by
the 2007 spending review). The periods overlap and hence this illustrates the lower than
average planned increases from 2007-08 onwards. Spending from 2010-11 fell in real terms
from its high point
The relatively large difference seen in the pre- and post-1997 average increases may seem
at odds with the relatively small difference in the percentage of GDP figures. The same could
be said about the real cuts/relatively high percentage of GDP from 2010-11 compared to
large real increases/lower share of GDP from 1997 to 2010. However, as the charts on the
previous pages showed, spending as a percentage of GDP was relatively high at the start of
the 1980s, but fell in fourteen of the next twenty years. Therefore the average percentage of
GDP over this period was relatively high; despite smaller average increases in spending. The
reverse is true for the period from 1999-00; it took large real increases in spending to
increase the proportion of GDP figure from its low level. The overall cuts in real spending
from 2010 reduce the share of GDP going on education, but from a high point. These have
been relatively short lived so the impact is still quite small.
Education and training expenditure in the UK, 2005-06 to 2013-14
Total change change Total change change
£ billion £ billion percentage £ billion £ billion percentage
2005-06 69.8 +6.8 +10.7% 84.0 +6.0 +7.7%
2006-07 73.0 +3.2 +4.6% 85.6 +1.5 +1.8%
2007-08 78.7 +5.7 +7.7% 89.6 +4.0 +4.7%
2008-09 83.0 +4.3 +5.5% 92.2 +2.6 +2.9%
2009-10 88.5 +5.5 +6.6% 95.8 +3.6 +3.9%
2010-11 91.5 +3.0 +3.4% 96.4 +0.6 +0.6%
2011-12 86.9 -4.6 -5.0% 90.0 -6.5 -6.7%
2012-13 87.0 +0.1 +0.1% 88.6 -1.4 -1.5%
2013-14 90.2 +3.2 +3.7% 90.2 +1.6 +1.8%
.. +2.6 +3.3% .. +0.8 +0.9%
(a) Adjusted using HM Treasury GDP deflators as at September 2014
Sources: HM Treasury, PESA 2014, and earlier editions
Cash prices 2013-14 prices(a)
Average change
2005-06
to 2013-14

7
The final table in this section breaks spending down into current and capital. This shows that
the proportionate cut in capital spending was much larger.
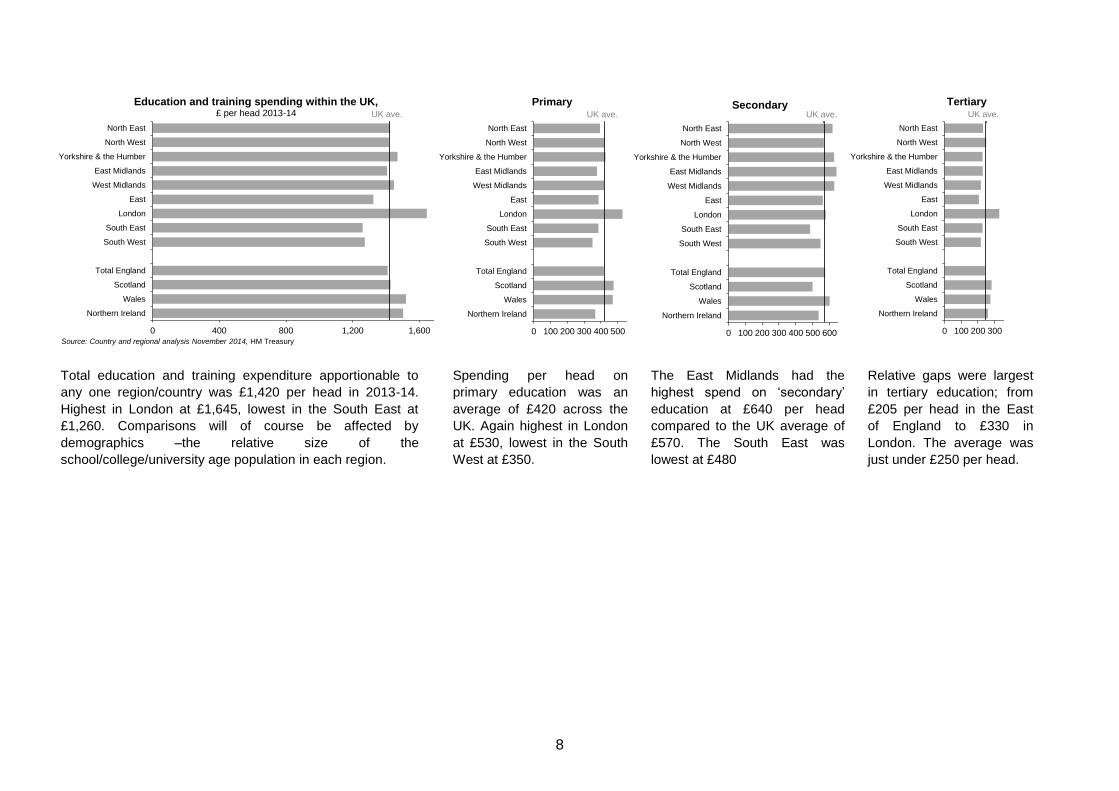
Expenditure by region and nation
The following charts look at education spending per head in the different parts of the UK. The
underlying data is from an annual exercise where departments and devolved administrations
assign spending to the regions and nations of the UK based on who it benefits/where it is
spent.
Current and capital spending on education and training
£ billion 2013-14 prices
2009-10 2010-11 2011-12 2012-13 2013-14
Change 09-10
to 13-14
Current 85.1 86.8 81.9 81.8 83.5 -1.9%
Capital 10.8 9.6 8.1 6.8 6.8 -37.3%
Total 95.8 96.4 90.0 88.6 90.2 -5.9%
Source: HM Treasury, PESA 2014. Table 5.4
Comparison of education and training expenditure in the UK in selected periods
percentage £ billion
1987-88 to 1996-97 51.9 4.64% 1.92% 0.96
1992-93 to 1996-97 55.1 4.72% 0.59% 0.32
1997-98 to 2010-11(b)
76.7 5.08% 4.41% 3.19
2007-08 to 2010-11 93.5 5.62% 2.49% 2.28
2010-11 to 2013-14 91.3 5.39% -2.20% -2.07
(a) Adjusted using HM Treasury GDP deflators as at September 2014
(b) Partly calculated on a resource basis
Sources: HM Treasury, PESA 2014, and earlier editions
ONS series YBHA
Average £ billion at
2013-14 prices(a)
Average percentage
of GDP
Average real annual
increase
8
Total education and training expenditure apportionable to
any one region/country was £1,420 per head in 2013-14.
Highest in London at £1,645, lowest in the South East at
£1,260. Comparisons will of course be affected by
demographics –the relative size of the
school/college/university age population in each region.
Spending per head on
primary education was an
average of £420 across the
UK. Again highest in London
at £530, lowest in the South
West at £350.
The East Midlands had the
highest spend on ‘secondary’
education at £640 per head
compared to the UK average of
£570. The South East was
lowest at £480
Relative gaps were largest
in tertiary education; from
£205 per head in the East
of England to £330 in
London. The average was
just under £250 per head.
UK ave.
0 400 800 1,200 1,600
North East
North West
Yorkshire & the Humber
East Midlands
West Midlands
East
London
South East
South West
Total England
Scotland
Wales
Northern Ireland
Education and training spending within the UK,£ per head 2013-14
Source: Country and regional analysis November 2014, HM Treasury
UK ave.
0 100 200 300 400 500 600 700 800 9001,0001,1001,2001,3001,4001,5001,6001,700
North East
North West
Yorkshire & the Humber
East Midlands
West Midlands
East
London
South East
South West
Total England
Scotland
Wales
Northern Ireland
PrimaryUK ave.
0 100 200 300 400 500 600 700 800 9001,0001,1001,2001,3001,4001,5001,6001,700
North East
North West
Yorkshire & the Humber
East Midlands
West Midlands
East
London
South East
South West
Total England
Scotland
Wales
Northern Ireland
SecondaryUK ave.
0 100 200 300 400 500 600 700 800 9001,0001,1001,2001,3001,4001,5001,6001,700
North East
North West
Yorkshire & the Humber
East Midlands
West Midlands
East
London
South East
South West
Total England
Scotland
Wales
Northern Ireland
Tertiary
9
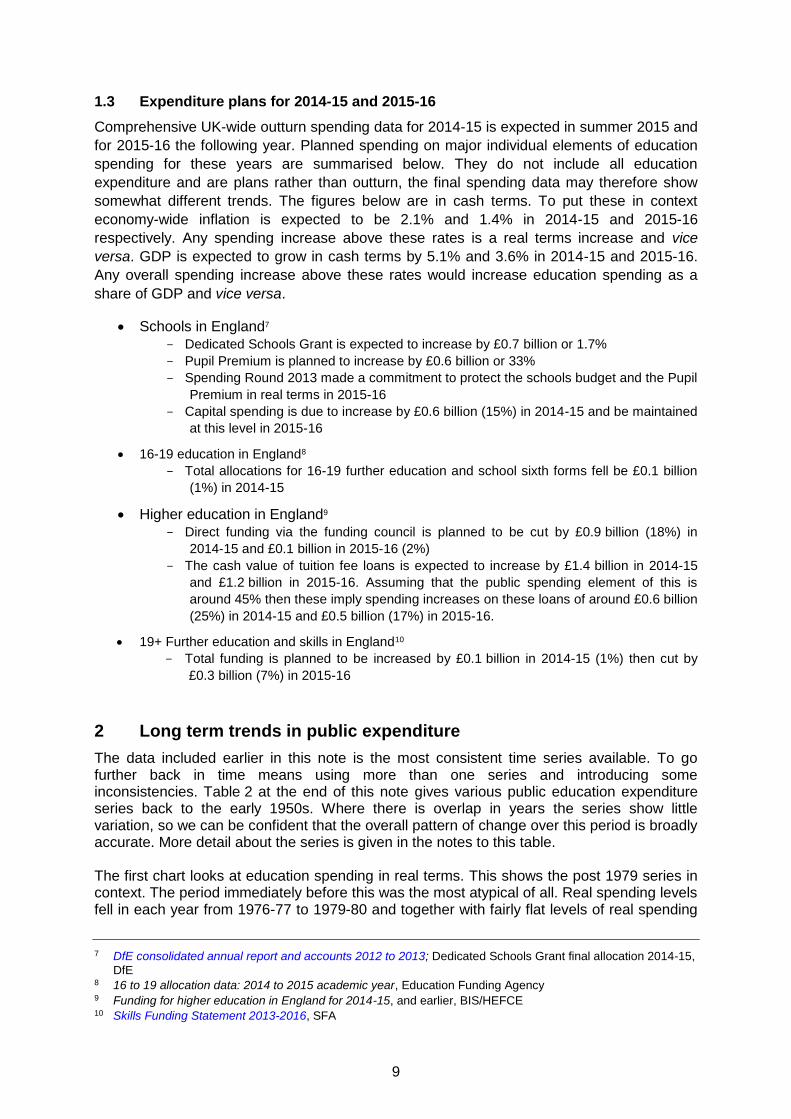
1.3 Expenditure plans for 2014-15 and 2015-16
Comprehensive UK-wide outturn spending data for 2014-15 is expected in summer 2015 and
for 2015-16 the following year. Planned spending on major individual elements of education
spending for these years are summarised below. They do not include all education
expenditure and are plans rather than outturn, the final spending data may therefore show
somewhat different trends. The figures below are in cash terms. To put these in context
economy-wide inflation is expected to be 2.1% and 1.4% in 2014-15 and 2015-16
respectively. Any spending increase above these rates is a real terms increase and vice
versa. GDP is expected to grow in cash terms by 5.1% and 3.6% in 2014-15 and 2015-16.
Any overall spending increase above these rates would increase education spending as a
share of GDP and vice versa.
Schools in England7
- Dedicated Schools Grant is expected to increase by £0.7 billion or 1.7%
- Pupil Premium is planned to increase by £0.6 billion or 33%
- Spending Round 2013 made a commitment to protect the schools budget and the Pupil
Premium in real terms in 2015-16
- Capital spending is due to increase by £0.6 billion (15%) in 2014-15 and be maintained
at this level in 2015-16
16-19 education in England8
- Total allocations for 16-19 further education and school sixth forms fell be £0.1 billion
(1%) in 2014-15
Higher education in England9
- Direct funding via the funding council is planned to be cut by £0.9 billion (18%) in
2014-15 and £0.1 billion in 2015-16 (2%)
- The cash value of tuition fee loans is expected to increase by £1.4 billion in 2014-15
and £1.2 billion in 2015-16. Assuming that the public spending element of this is
around 45% then these imply spending increases on these loans of around £0.6 billion
(25%) in 2014-15 and £0.5 billion (17%) in 2015-16.
19+ Further education and skills in England10
- Total funding is planned to be increased by £0.1 billion in 2014-15 (1%) then cut by
£0.3 billion (7%) in 2015-16
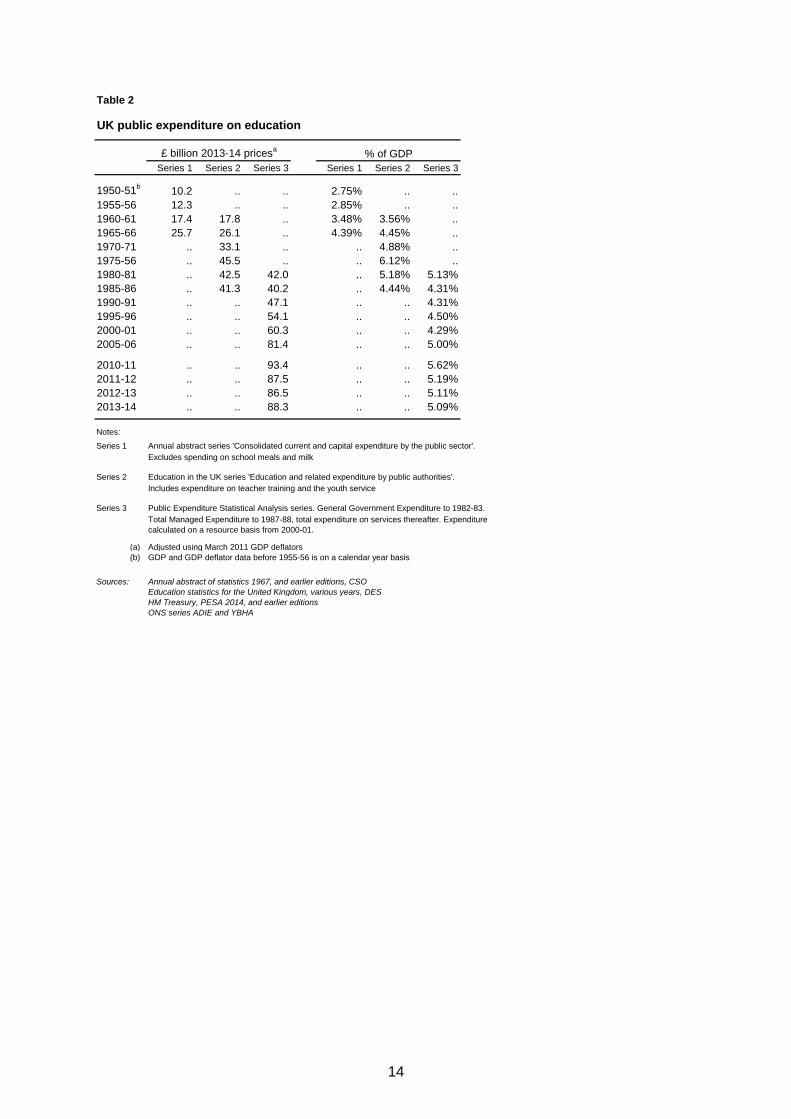
2 Long term trends in public expenditure
The data included earlier in this note is the most consistent time series available. To go further back in time means using more than one series and introducing some inconsistencies. Table 2 at the end of this note gives various public education expenditure series back to the early 1950s. Where there is overlap in years the series show little variation, so we can be confident that the overall pattern of change over this period is broadly accurate. More detail about the series is given in the notes to this table. The first chart looks at education spending in real terms. This shows the post 1979 series in context. The period immediately before this was the most atypical of all. Real spending levels fell in each year from 1976-77 to 1979-80 and together with fairly flat levels of real spending
7 DfE consolidated annual report and accounts 2012 to 2013; Dedicated Schools Grant final allocation 2014-15,
DfE 8 16 to 19 allocation data: 2014 to 2015 academic year, Education Funding Agency 9 Funding for higher education in England for 2014-15, and earlier, BIS/HEFCE 10 Skills Funding Statement 2013-2016, SFA
10
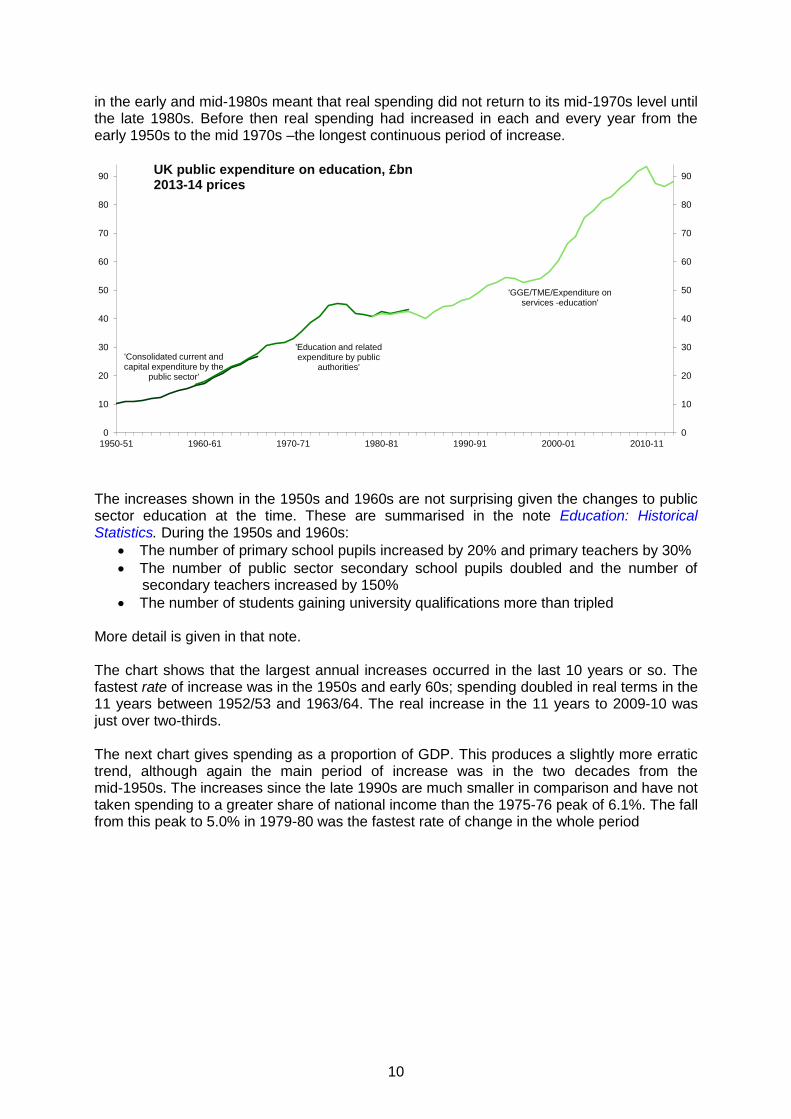
in the early and mid-1980s meant that real spending did not return to its mid-1970s level until the late 1980s. Before then real spending had increased in each and every year from the early 1950s to the mid 1970s –the longest continuous period of increase.
The increases shown in the 1950s and 1960s are not surprising given the changes to public sector education at the time. These are summarised in the note Education: Historical Statistics. During the 1950s and 1960s:
The number of primary school pupils increased by 20% and primary teachers by 30%
The number of public sector secondary school pupils doubled and the number of secondary teachers increased by 150%
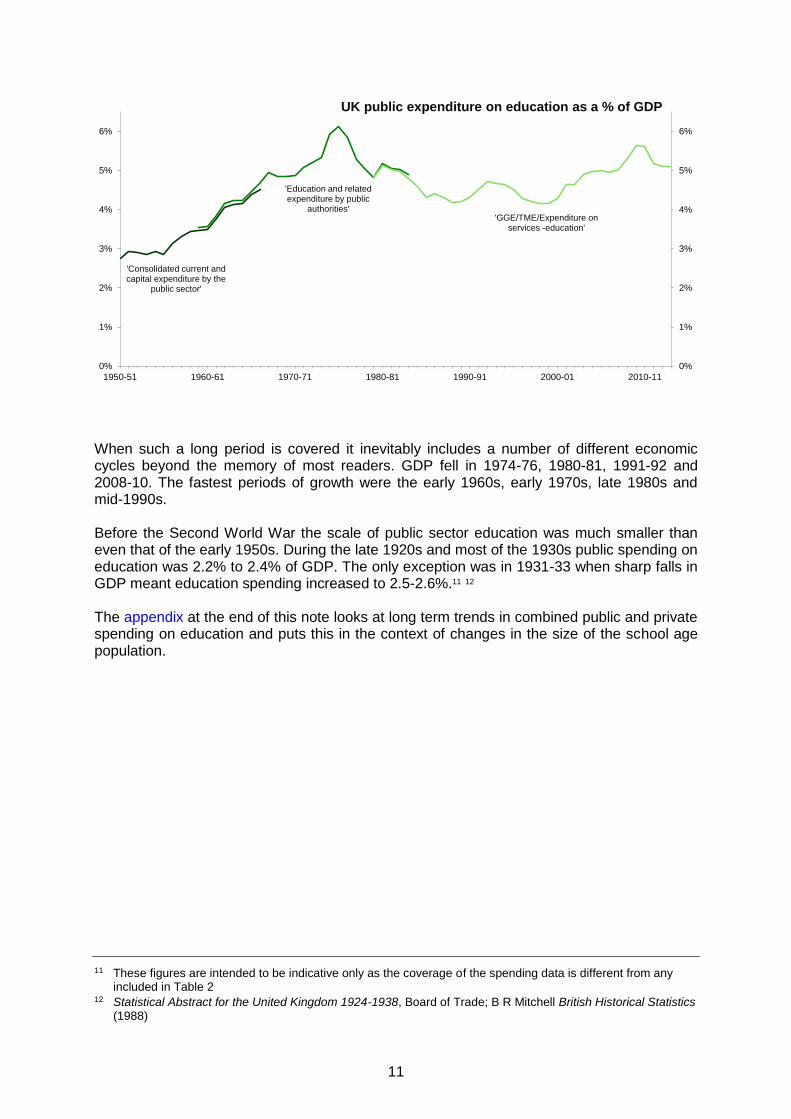
The number of students gaining university qualifications more than tripled More detail is given in that note. The chart shows that the largest annual increases occurred in the last 10 years or so. The fastest rate of increase was in the 1950s and early 60s; spending doubled in real terms in the 11 years between 1952/53 and 1963/64. The real increase in the 11 years to 2009-10 was just over two-thirds. The next chart gives spending as a proportion of GDP. This produces a slightly more erratic trend, although again the main period of increase was in the two decades from the mid-1950s. The increases since the late 1990s are much smaller in comparison and have not taken spending to a greater share of national income than the 1975-76 peak of 6.1%. The fall from this peak to 5.0% in 1979-80 was the fastest rate of change in the whole period
'Consolidated current and capital expenditure by the
public sector'
'Education and related expenditure by public
authorities'
'GGE/TME/Expenditure on services -education'
0
10
20
30
40
50
60
70
80
90
0
10
20
30
40
50
60
70
80
90
1950-51 1960-61 1970-71 1980-81 1990-91 2000-01 2010-11
UK public expenditure on education, £bn2013-14 prices
11
When such a long period is covered it inevitably includes a number of different economic cycles beyond the memory of most readers. GDP fell in 1974-76, 1980-81, 1991-92 and 2008-10. The fastest periods of growth were the early 1960s, early 1970s, late 1980s and mid-1990s. Before the Second World War the scale of public sector education was much smaller than even that of the early 1950s. During the late 1920s and most of the 1930s public spending on education was 2.2% to 2.4% of GDP. The only exception was in 1931-33 when sharp falls in GDP meant education spending increased to 2.5-2.6%.11 12 The appendix at the end of this note looks at long term trends in combined public and private spending on education and puts this in the context of changes in the size of the school age population.
11 These figures are intended to be indicative only as the coverage of the spending data is different from any
included in Table 2 12 Statistical Abstract for the United Kingdom 1924-1938, Board of Trade; B R Mitchell British Historical Statistics
(1988)
'Consolidated current and capital expenditure by the
public sector'
'Education and related expenditure by public
authorities''GGE/TME/Expenditure on
services -education'
0%
1%
2%
3%
4%
5%
6%
0%
1%
2%
3%
4%
5%
6%
1950-51 1960-61 1970-71 1980-81 1990-91 2000-01 2010-11
UK public expenditure on education as a % of GDP

12
3 International comparisons
The chart opposite illustrates differences in
education expenditure13 as a proportion of GDP
across the OECD. 2011 are the latest available
data. These figures cover public and private
spending and the public total is indicated in the
chart.
Overall spending on this measure in the UK
was 6.4%; above the OECD average of 6.2%,
above the figure for most other EU countries,
but below levels in the US, Canada and Korea.
Public spending in the UK at 5.6% was above
the OECD total (weighted average) of 4.8% and
below the levels in some other EU states which
had lower overall education spending. Private
education expenditure in the UK formed a
greater share of the total than in most other EU
states. Denmark, Iceland and Belgium had the
highest public expenditure on education
compared to GDP. Korea, Chile and the US
had the highest private rates which put them all
near the top on total spending.
13 Expenditure on institutions. This excludes some spending which directly benefits pupils/students such as
maintenance support
Slovak Republic
Italy
Czech Republic
Germany
Japan
Poland
Spain
Portugal
Estonia
Switzerland
Austria
Australia
Slovenia
France
Ireland
Mexico
Netherlands
Sweden
United Kingdom
Finland
Belgium
Canada
United States
Chile
Israel
New Zealand
Korea
Iceland
Denmark
0% 1% 2% 3% 4% 5% 6% 7% 8%
Expenditure on education institutions as a % of GDP, OECD nations 2011
Public Total
Source: OECD Education at a Glance 2014
13
4 Reference tables
Table 1
Total public expenditure on education in the UK(a)
Education only Education and training
At cash At 2013-14 At cash At 2013-14
prices prices(b)
Percent of prices prices(b)
Percent of
Financial year £ billion £ billion GDP (c)
£ billion £ billion GDP (c)
1979-80 10.5 40.9 4.81% .. .. ..
1980-81 12.8 42.0 5.13% .. .. ..
1981-82 13.9 41.6 5.03% .. .. ..
1982-83 15.0 42.0 4.97% .. .. ..
1983-84 15.8 42.4 4.80% .. .. ..
1984-85 16.3 41.3 4.60% .. .. ..
1985-86 16.8 40.2 4.31% .. .. ..
1986-87 18.5 42.5 4.42% .. .. ..
1987-88 20.3 44.2 4.32% 21.2 46.2 4.51%
1988-89 21.9 44.8 4.17% 23.1 47.2 4.40%
1989-90 24.4 46.3 4.22% 25.9 49.1 4.47%
1990-91 26.9 47.1 4.31% 28.1 49.2 4.50%
1991-92 29.7 49.1 4.52% 31.3 51.8 4.76%
1992-93 32.0 51.6 4.72% 33.2 53.6 4.90%
1993-94 33.5 52.7 4.66% 34.7 54.6 4.83%
1994-95 35.0 54.5 4.64% 36.2 56.3 4.80%
1995-96 35.8 54.1 4.50% 37.0 55.9 4.65%
1996-97 36.4 52.8 4.29% 37.8 54.8 4.46%
1997-98 37.4 53.3 4.20% 38.6 55.0 4.34%
1998-99 38.7 54.3 4.15% 40.0 56.1 4.29%
1999-00 40.8 56.7 4.17% 42.2 58.6 4.31%
2000-01(d)
44.4 60.3 4.29% 45.9 62.3 4.44%
2001-02(d)
49.7 66.5 4.63% 51.2 68.5 4.77%
2002-03(d)
52.9 68.9 4.66% 54.7 71.3 4.82%
2003-04(d)
59.2 75.6 4.90% 61.0 77.9 5.04%
2004-05(d)
63.0 78.0 4.97% 65.1 80.6 5.13%
2005-06(d)
67.6 81.4 5.00% 69.8 84.0 5.17%
2006-07(d)
70.6 82.7 4.95% 73.0 85.6 5.13%
2007-08(d)
75.4 85.9 5.03% 78.7 89.6 5.25%
2008-09(d)
79.6 88.4 5.30% 83.0 92.2 5.52%
2009-10(d)
84.6 91.6 5.63% 88.5 95.8 5.89%
2010-11(d)
88.6 93.4 5.62% 91.5 96.4 5.80%
2011-12(d)
84.5 87.5 5.19% 86.9 90.0 5.34%
2012-13(d)
85.0 86.5 5.11% 87.0 88.6 5.23%
2013-14(d)
88.3 88.3 5.09% 90.2 90.2 5.21%
.. Not available
(b) Adjusted 2013-14 prices using HM Treasury GDP deflators from September 2014.
c) Calculated using GDP figures revised after September 2014 changes to National Accounts methodologies
Sources: HM Treasury, PESA 2014, and earlier editions
ONS series YBHA
HM Treasury GDP deflators
(a) General Government Expenditure to 1982-83. Total Managed Expenditure to 1987-88, total expenditure on services thereafter.
(d) Expenditure calculated on a resource basis. These figures may not be directly comparable with earlier years that were calculated on a cash
basis.
14
Table 2
UK public expenditure on education
£ billion 2013-14 pricesa
% of GDP
Series 1 Series 2 Series 3 Series 1 Series 2 Series 3
1950-51b
10.2 .. .. 2.75% .. ..
1955-56 12.3 .. .. 2.85% .. ..
1960-61 17.4 17.8 .. 3.48% 3.56% ..
1965-66 25.7 26.1 .. 4.39% 4.45% ..
1970-71 .. 33.1 .. .. 4.88% ..
1975-56 .. 45.5 .. .. 6.12% ..
1980-81 .. 42.5 42.0 .. 5.18% 5.13%
1985-86 .. 41.3 40.2 .. 4.44% 4.31%
1990-91 .. .. 47.1 .. .. 4.31%
1995-96 .. .. 54.1 .. .. 4.50%
2000-01 .. .. 60.3 .. .. 4.29%
2005-06 .. .. 81.4 .. .. 5.00%
2010-11 .. .. 93.4 .. .. 5.62%
2011-12 .. .. 87.5 .. .. 5.19%
2012-13 .. .. 86.5 .. .. 5.11%
2013-14 .. .. 88.3 .. .. 5.09%
Notes:
Series 1 Annual abstract series 'Consolidated current and capital expenditure by the public sector'.
Excludes spending on school meals and milk
Series 2 Education in the UK series 'Education and related expenditure by public authorities'.
Includes expenditure on teacher training and the youth service
Series 3 Public Expenditure Statistical Analysis series. General Government Expenditure to 1982-83.
Total Managed Expenditure to 1987-88, total expenditure on services thereafter. Expenditure
calculated on a resource basis from 2000-01.
(a) Adjusted using March 2011 GDP deflators
(b) GDP and GDP deflator data before 1955-56 is on a calendar year basis
Sources: Annual abstract of statistics 1967, and earlier editions, CSO
Education statistics for the United Kingdom, various years, DES
HM Treasury, PESA 2014, and earlier editions
ONS series ADIE and YBHA
15
5 Appendix –Trends in education spending to 2011-12 v population change
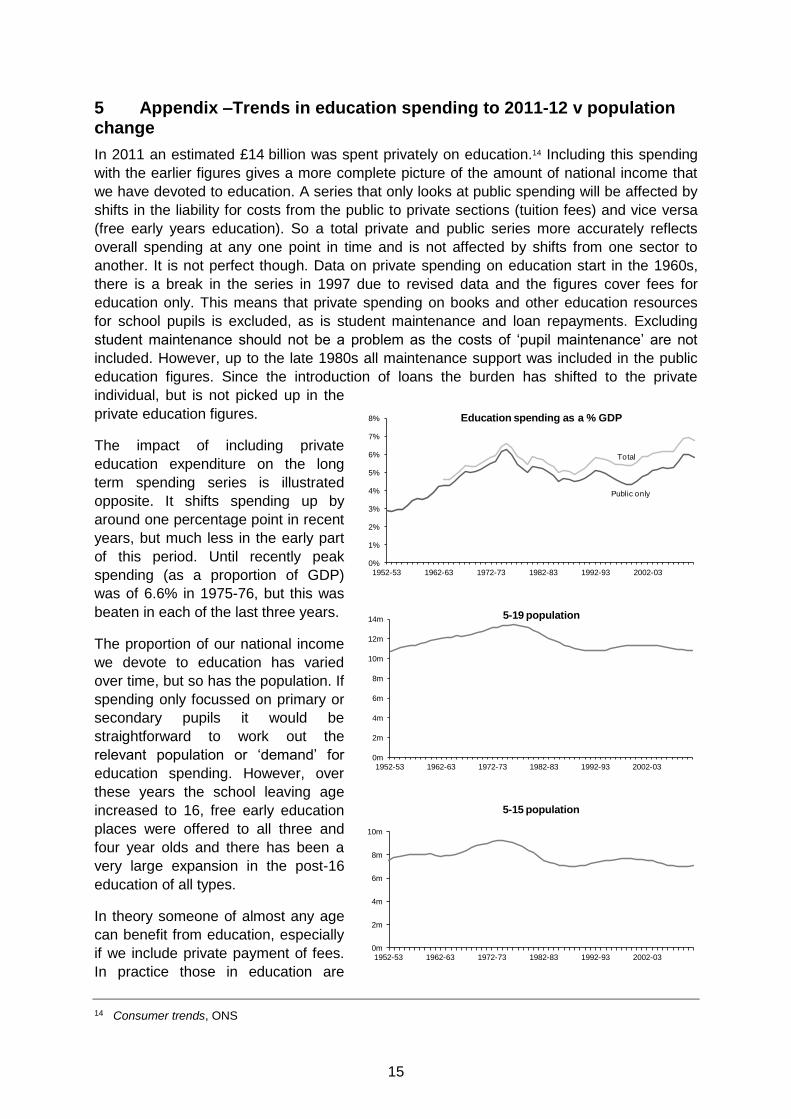
In 2011 an estimated £14 billion was spent privately on education.14 Including this spending
with the earlier figures gives a more complete picture of the amount of national income that
we have devoted to education. A series that only looks at public spending will be affected by
shifts in the liability for costs from the public to private sections (tuition fees) and vice versa
(free early years education). So a total private and public series more accurately reflects
overall spending at any one point in time and is not affected by shifts from one sector to
another. It is not perfect though. Data on private spending on education start in the 1960s,
there is a break in the series in 1997 due to revised data and the figures cover fees for
education only. This means that private spending on books and other education resources
for school pupils is excluded, as is student maintenance and loan repayments. Excluding
student maintenance should not be a problem as the costs of ‘pupil maintenance’ are not
included. However, up to the late 1980s all maintenance support was included in the public
education figures. Since the introduction of loans the burden has shifted to the private
individual, but is not picked up in the
private education figures.
The impact of including private
education expenditure on the long
term spending series is illustrated
opposite. It shifts spending up by
around one percentage point in recent
years, but much less in the early part
of this period. Until recently peak
spending (as a proportion of GDP)
was of 6.6% in 1975-76, but this was
beaten in each of the last three years.
The proportion of our national income
we devote to education has varied
over time, but so has the population. If
spending only focussed on primary or
secondary pupils it would be
straightforward to work out the
relevant population or ‘demand’ for
education spending. However, over
these years the school leaving age
increased to 16, free early education
places were offered to all three and
four year olds and there has been a
very large expansion in the post-16
education of all types.
In theory someone of almost any age
can benefit from education, especially
if we include private payment of fees.
In practice those in education are
14 Consumer trends, ONS
Total
Public only
0%
1%
2%
3%
4%
5%
6%
7%
8%
1952-53 1962-63 1972-73 1982-83 1992-93 2002-03
Education spending as a % GDP
0m
2m
4m
6m
8m
10m
12m
14m
1952-53 1962-63 1972-73 1982-83 1992-93 2002-03
5-19 population
0m
2m
4m
6m
8m
10m
1952-53 1962-63 1972-73 1982-83 1992-93 2002-03
5-15 population
16
concentrated in a much smaller age range. Population estimates back to the early 1950s are
grouped in five year bands. The charts above compare trends in two age ranges which are
meant to reflect the core group benefitting from education.
The shape of the trends is broadly similar, although the 5-15 age group is slightly more
volatile.15 The 5-19 age group is used below as a measure of the population group most likely
to benefit from education.
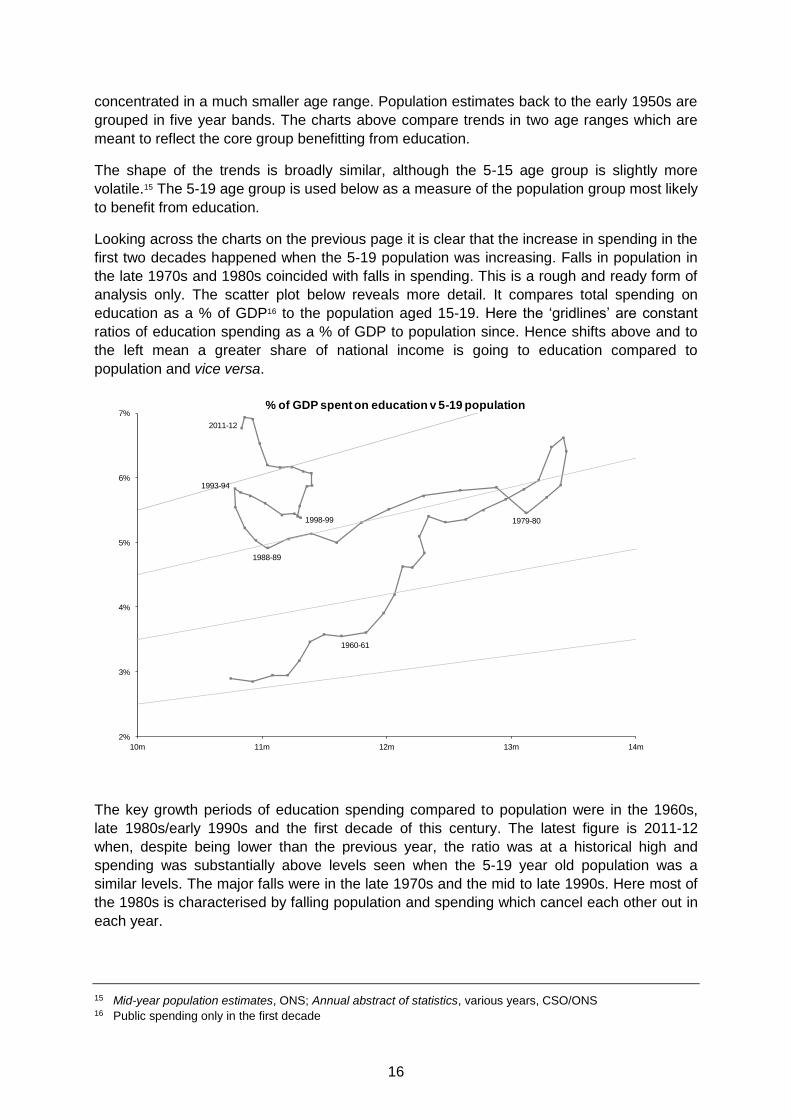
Looking across the charts on the previous page it is clear that the increase in spending in the
first two decades happened when the 5-19 population was increasing. Falls in population in
the late 1970s and 1980s coincided with falls in spending. This is a rough and ready form of
analysis only. The scatter plot below reveals more detail. It compares total spending on
education as a % of GDP16 to the population aged 15-19. Here the ‘gridlines’ are constant
ratios of education spending as a % of GDP to population since. Hence shifts above and to
the left mean a greater share of national income is going to education compared to
population and vice versa.
The key growth periods of education spending compared to population were in the 1960s,
late 1980s/early 1990s and the first decade of this century. The latest figure is 2011-12
when, despite being lower than the previous year, the ratio was at a historical high and
spending was substantially above levels seen when the 5-19 year old population was a
similar levels. The major falls were in the late 1970s and the mid to late 1990s. Here most of
the 1980s is characterised by falling population and spending which cancel each other out in
each year.
15 Mid-year population estimates, ONS; Annual abstract of statistics, various years, CSO/ONS 16 Public spending only in the first decade
1960-61
1979-80
1988-89
1993-94
1998-99
2011-12
2%
3%
4%
5%
6%
7%
10m 11m 12m 13m 14m
% of GDP spent on education v 5-19 population

17
The cuts in education spending relative to GDP and the
growing population of the mid/late 1990s was reversed in
the early part of this decade, but it took five years of large
spending increases just to get back to a virtually identical
position as in 1993-94.
The chronological order of this series can be difficult to
follow through all its loops over time. The charts opposite
give the same data, but highlight one decade at a time. If
time is cut up this way then it is clear that the 1950s and
1960s saw the share of national income devoted to
education increase at a faster rate than the (increasing
population). This continued into the first half of the 1970s,
but was reversed in the second half. During the 1980s the
population aged 5-19 fell consistently and education
spending as a % of GDP fell at a similar rate.
The early 1990s saw increases in education spending at a
time when GDP and population fell. Spending stagnated in
the second half of the decade as GDP and population grew
and the earlier ‘gains’ were lost. The last decade has seen
the smallest changes in population and some of the most
consistent increases in spending as a proportion of GDP.
This looks likely to continue to the end of this decade
Some unexpected patterns emerge after we ‘adjust’ long
term education spending for changes in the size of the
economy and population. Changes in the proportion of
national income we devote to education can only be
‘explained’ by demographic changes in the early 1970s and
most of the 1980s. During most of the rest of the last 60
years spending has not closely followed population. The
pattern shown in the chart has been more influenced by falls
in GDP. Education spending has continued to rise during
most recessions and hence spending as a proportion of
GDP has risen more rapidly. 2008-09 and 2009-10 saw two
of the largest single year jumps as spending increases were
coupled with falls in GDP and relatively little change in
population. Real levels of education spending have followed
different paths after recessions of the past, falling after the
mid-1970s, stagnated after the early 1980s and increasing
after the early 1990s.
2%
3%
4%
5%
6%
7%
10m 12m 14m
1950s
2%
3%
4%
5%
6%
7%
10m 12m 14m
1960s
2%
3%
4%
5%
6%
7%
10m 12m 14m
1970s
2%
3%
4%
5%
6%
7%
10m 12m 14m
1980s
2%
3%
4%
5%
6%
7%
10m 12m 14m
1990s
2%
3%
4%
5%
6%
7%
10m 12m 14m
2000s