Embed Size (px)
Citation preview

Paper ID #32681
Educational Technology Platforms and Shift in Pedagogical Approach toSupport Computing Integration Into Two Sophomore Civil and Environmen-talEngineering Courses
Dr. Sotiria Koloutsou-Vakakis, University of Illinois at Urbana-Champaign
Dr. Sotiria Koloutsou-Vakakis holds a Diploma degree in Civil-Surveying Engineering (National Tech-nical University of Athens, Greece), a M.A. in Geography (University of California, Los Angeles), andM.S. and Ph.D. degrees in Environmental Engineering (University of Illinois at Urbana-Champaign). Sheteaches undergraduate and graduate courses on Air Quality, Science and Environmental Policy, and En-gineering Risk and Uncertainty. Her recent research is about gaseous emissions of reactive nitrogen fromfertilized fields into the atmosphere and impacts on air quality and climate change.
Prof. Eleftheria Kontou, University of Illinois at Urbana-Champaign
Dr. Kontou joined the Department of Civil and Environmental Engineering of the University of Illinoisat Urbana-Champaign in October 2019. She received her PhD in Civil Engineering, focusing on trans-portation systems, from the University of Florida under the advisement of Dr. Yafeng Yin. She holdsa MSc from Virginia Tech in the same field. She graduated with a BSc in Civil Engineering from theNational Technical University of Athens. She was a postdoctoral research associate at the Transportationand Hydrogen Systems Center of the National Renewable Energy Laboratory and conducted research atthe Department of City and Regional Planning at the University of North Carolina at Chapel Hill beforebeginning her current faculty position at UIUC.
Prof. Christopher W. Tessum, University of Illinois at Urbana-Champaign
Dr. Christopher Tessum joined the CEE department as an Assistant Professor in January 2020. Hisresearch focuses on modeling air pollution and its health impacts, quantifying inequities in the distributionof those impacts, and proposing and testing solutions. He studies the relationships between emissions, thehuman activities that cause them, and the resulting health impacts, and he develops modeling capabilitiesto enable these types of analyses. Before joining UIUC, Dr. Tessum was a research scientist in theDepartment of Civil and Environmental Engineering at the University of Washington in Seattle and apostdoctoral researcher in the Department of Bioproducts and Biosystems Engineering at the Universityof Minnesota. He received a Ph.D. (2014) in Civil, Environmental and Geo- Engineering, and a B.M.E.in Mechanical Engineering (2006), from the University of Minnesota.
Prof. Lei Zhao, University of Illinois at Urbana-Champaign
Dr. Lei Zhao is currently an assistant professor in the Department of Civil and Environmental Engineeringand assistant professor affiliated with the National Center of Supercomputing Applications at the Univer-sity of Illinois at Urbana-Champaign. His research concerns the physical and engineering processes inthe Atmospheric Boundary Layer where most human activities and environmental systems are concen-trated, with a particular focus on built surfaces and urban environments. He combines theory, numericalmodeling, remote sensing and in situ observations, and cutting-edge machine learning methods to studyenvironmental fluid mechanics and land-atmosphere dynamics that relate to urban environments, micro-climatology and hydrology, climate change, climate impacts and adaptation. Dr. Zhao received his Ph.D.(2015) in atmospheric and environmental science from the School of the Environment at Yale University.Before joining at the University of Illinois at Urbana-Champaign, He was a postdoctoral research fellowat Princeton University. He obtained his B.S. degree (2009) in Physics and Atmospheric Physics fromNanjing University in China.
Hadi Meidani, University of Illinois at Urbana-Champaign
Dr. Hadi Meidani is an Assistant Professor in the Department of Civil and Environmental Engineering atthe University of Illinois at Urbana-Champaign. He earned his Ph.D. in Civil Engineering and his M.S. in
c©American Society for Engineering Education, 2021
Paper ID #32681
Electrical Engineering from the University of Southern California (USC) in 2012. Prior to joining UIUC,he was a postdoctoral research associate in the Department of Aerospace and Mechanical Engineeringat USC in 2012-2013 and in the Scientific Computing and Imaging Institute at the University of Utahin 2013-2014. He is the recipient of the NSF CAREER Award to study fast computational models forenergy-transportation systems. He is also the recipient of the student paper award in probabilistic methodsat the ASCE Engineering Mechanics Institute Conference in 2012. His research interests are uncertaintyquantification, scientific machine learning, and decision making under uncertainty.
c©American Society for Engineering Education, 2021
Educational technology platforms and shift in pedagogical approach to support computing integration into two sophomore Civil and Environmental
Engineering courses
Sotiria Koloutsou-Vakakis, Hadi Meidani, Eleftheria Kontou, Lei Zhao, Christopher W. Tessum Department of Civil and Environmental Engineering, University of Illinois at Urbana-
Champaign, 205 N. Mathews, Urbana, IL 61801, [email protected]
1. IntroductionCivil and Environmental Engineering share the common goal of serving humankind, in a broad range of ways that cover from safeguarding human health and well-being to facilitating economic activities and social interactions. Recent reports, by the American Society of Civil Engineers (ASCE) [1] and the National Academies of Science, Engineering and Medicine(NASEM) [2], converge in recognizing that Civil and Environmental Engineers require both formal education and mentored experiences, where education should provide breadth in the scientific and engineering fundamentals and strength in the students’ specific areas of expertise. Relevant to this paper, among many other objectives, breadth in the fundamentals is envisioned to include engineering economics, systems analysis, data science, and understanding of risk and uncertainty. In addition, skills such as for effective communication, collaborative work, negotiation and conflict resolution are deemed essential [2] while it is explicitly recognized the need for students to be in control of their own continuous education and improvement [1].
The ASCE Body of Knowledge Student Outcomes [1] (CEBOK) includes affective outcomes, which do not correspond to specific thematic areas that are covered in a typical college class. These outcomes correspond to attitudes which need to be cultivated and developed throughout college and beyond. It is interesting that computational thinking is not explicitly mentioned in the CEBOK outcomes. It is rather embedded under ‘mathematics’ and ‘experimental methods and data analysis’ and (one could argue) also ‘critical thinking and problem solving’. We argue that computational thinking differs from other foundational science and mathematics skills, not only because it is pervasive to everything engineers do, nowadays, but also because it keeps evolving fast. Thus, computational skill goes beyond coding in a certain programming language. It requires understanding that coding is one step in a process that involves understanding of a problem, development of alternative solutions, development of workflows, and implementation [3]. Complex skills are required to develop for achieving computing functionality, let alone proficiency. To achieve computing proficiency in the discipline, students need to continue using computing in the context of the discipline they study, beyond any introductory computing class they may be required to take in their (typically) first college year.
Student difficulty with computing is widely discussed in the literature [4-7] and it is also part of our own teaching experience. The lingering question is: how can we best teach computational thinking, when the practical difficulties and frustrations of learning coding in a specific language can blur the necessity of computational thinking, to such an extent that can keep many students in a prolonged computing aversion state? The functional programming approach [6], problem-solving learning, through use of games, visual representations and narratives [5, 7], all have been proposed in the literature. The purpose of such approaches is not only to improve student
understanding of the computational process, but also to keep students motivated, so that they stay engaged and persist. Studies have also shown that active learning is more effective than traditional lecturing with regard to student learning outcomes [8-10] in computing, as in all other subject areas. The flipped classroom model is recommended for increasing the interest and motivation of students, by providing practice opportunities, and for allowing immediate feedback [4]. In this paper, we focus on skills acquired through formal undergraduate college education and specifically on recent updates of two required undergraduate sophomore level courses offered in a Civil and Environmental Engineering department. These updates are part of a department-wide curriculum update and innovation effort, in response to the rapid changes in science, technology and societal needs. These rapid changes have brought to the forefront the urgent need not only to create technically competent engineers but also professional engineers who have developed the culture and skills necessary to adapt in this rapidly changing professional and socioeconomic global environment. The first course is an introductory course on system engineering and economics (SEE). The second course is an introduction to engineering risk, and uncertainty (ERU) through introductory probability and statistics. Both classes are offered in every Fall and Spring semester. Students take these courses following foundational courses, offered by other departments, including an introductory computer programming class offered by the Computer Science department, where they are taught MATLAB and Python. Following that course, our intention is to integrate computing with the substantive material of courses that student take subsequently in the CEE department. Integration of computing with the content matter of each class is important so that computing does not feel like an extraneous task irrelevant to CEE. The integration part is not trivial and as it has been mentioned by others [11] it takes some trial and error, because what works for one discipline or institution might not be exactly transferrable to another one. Computing needs be presented in terms of its underlying presence in almost everything in an engineer’s daily experience, in context, and as a tool that involves use of computers for solving problems and understanding natural and social systems’ behavior that it would be much more difficult or impossible for humans to solve alone [11]. The major updates of the two courses are within the scope of three important objectives of curriculum update and innovation: computing (computational thinking), communication, and experiential learning throughout the curriculum. Specifically, in this paper, we present a) our approach for integrating computing with the fundamentals content matter of the two courses and b) shifting of the teaching method to student-centered learning. We outline how we have restructured our materials and we present first assessment results following a semester of full implementation that includes both cognitive and affective outcomes. This first semester of full implementation of planned updates followed 2 semesters of intense preparatory work, during which we gradually adopted new learning online environments and developed materials appropriate for student-centered learning. This first semester of full implementation is used as our guide for continuing improvements in how we teach with the new materials and the new pedagogical method, and for improving our assessment methods, consistent with assessing both cognitive and affective learning outcomes.
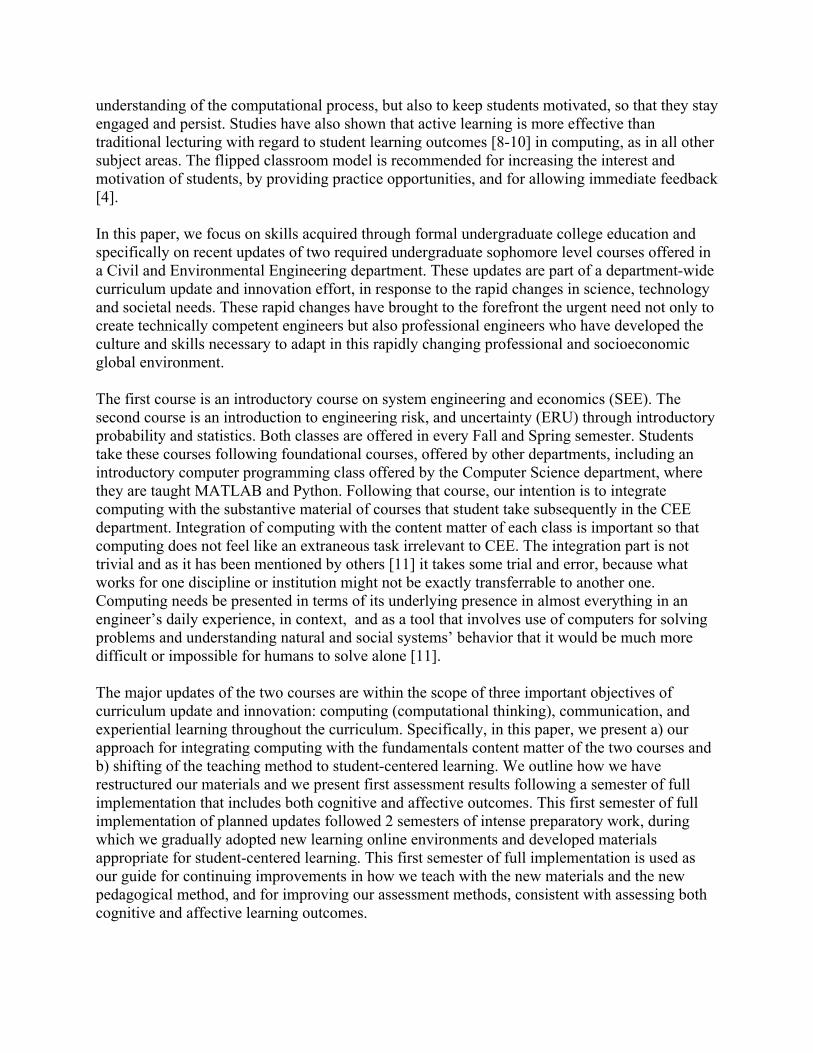
2. Technology assisted integration of computing and shift to student centered learning Python 3 [12] was chosen as the computational tool for the SEE and R [13] for the ERU course. Two programming language tools were chosen to communicate to the students that 1) computing literacy is more than the specific language used; 2) different tools are better suited for different applications; 3) different tools can work together, taking advantage of each tool’s strengths for a given application. Teaching of the computing language was integrated within the substantive material for each course, after a set of practice assignments, in the first 3 weeks of instruction, that happen in parallel with covering the substantive material of the courses. To relieve some of the stress accompanying learning of a programing language and all the frustration with dealing with all syntax errors, we developed step by step tutorials and coding examples for every class to accompany the rest of our teaching materials. Integrating computing to SEE and ERU courses was facilitated by the use of the PrairieLearn (PL) educational platform. PL is an online problem-driven learning system for creating homeworks and tests [14]. The system supports autograded randomized numerical problems, multiple choice questions and coding questions. The system also handles tasks such as graphical drawing, and symbolic algebra and can accommodate multimedia elements (videos). Beside supporting skill mastery, PL enables online exam taking, a feature that was in previous semesters used for asynchronous in person exam taking in specifically dedicated computer lab spaces [15] and which was modified for the pandemic circumstances to allow remote synchronous exam taking. Transition to PL for homeworks, in-class problem solving and exam taking is an intense effort that started in the Summer 2019 and is on-going, even though at present, the course databases are complete enough to support all types of assignments and assessments we had planned. Adoption of the student-centered learning pedagogical approach required a second intense development step, during which, for each class period, we prepared pre-lecture videos, their corresponding in-class worksheets and the accompanying coding tutorials. In Figure 1, we show example guidance provided to students on the first day of class and included in the syllabi. For economy of space, we show example for one of the two courses because the approaches followed are similar. Before class, students are required to watch one or two videos introducing the concepts for the upcoming class period. The videos have a duration between 5 and 13 minutes. Short simple quiz questions are provided with each video, to motivate students to watch the videos and to also check student understanding. Then in class, we use a student-centered approach, where after providing minimal overview of the key concepts and guidance, students are asked to work in teams on the example problems in the worksheet of the day. We target to have teams of 4 students but depending on class size teams in general have 3-5 students. The in-class worksheets include problems that promote content knowledge and questions that encourage student exploration of the concepts included in the learning outcomes of the day. Student teams submit their answers to the problems they solve on PL for grading, as a team submission. On PL, space is provided with every worksheet, where students can submit any remaining questions (muddiest points), which subsequently the teaching personnel review and provide written answers, after class and depending on the nature of questions a review at the beginning of the following class period.
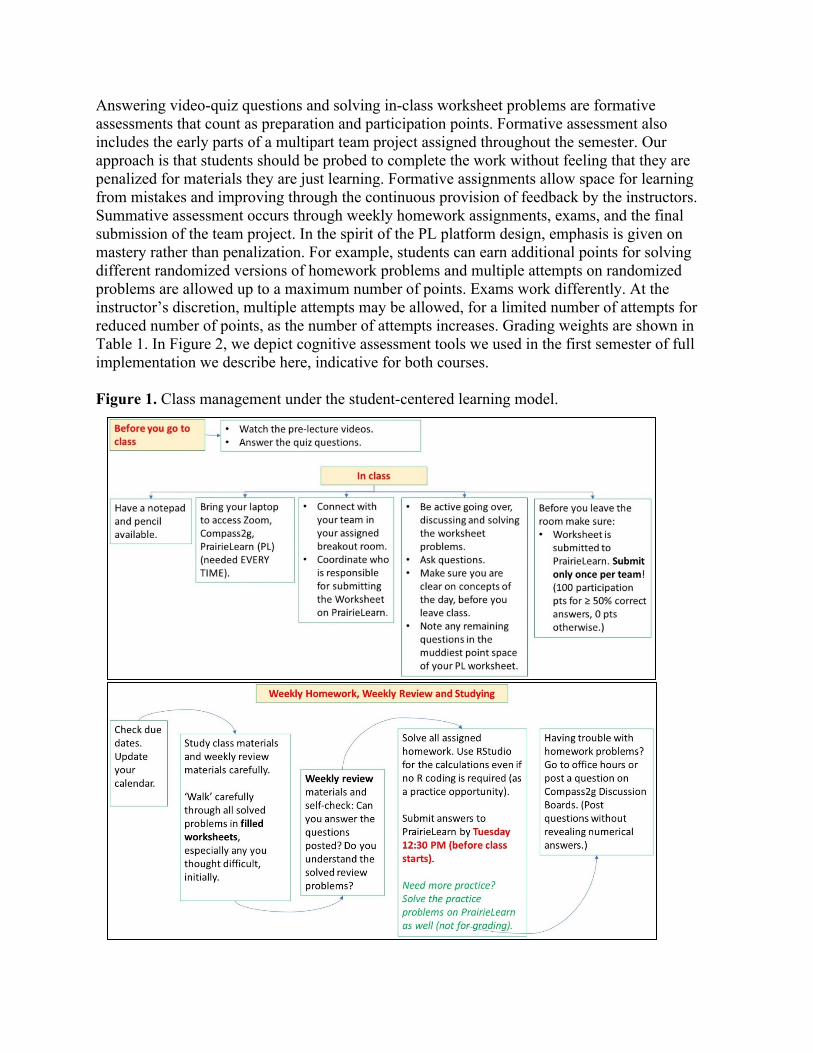
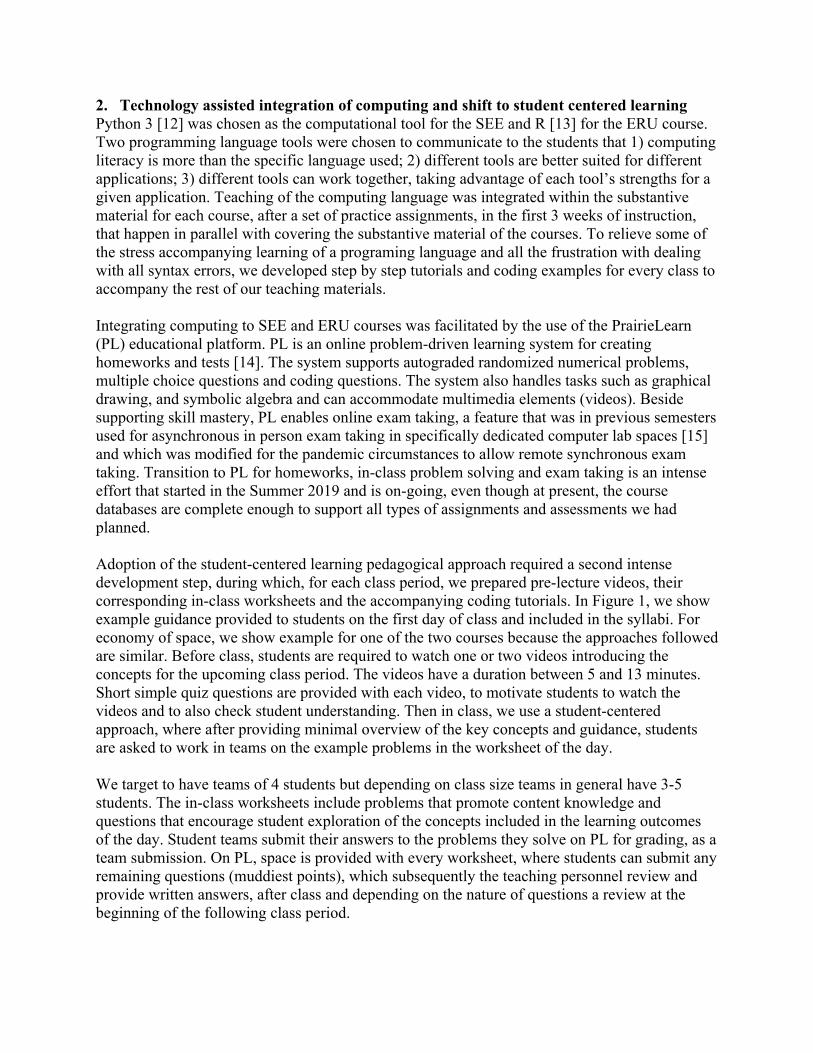
Answering video-quiz questions and solving in-class worksheet problems are formative assessments that count as preparation and participation points. Formative assessment also includes the early parts of a multipart team project assigned throughout the semester. Our approach is that students should be probed to complete the work without feeling that they are penalized for materials they are just learning. Formative assignments allow space for learning from mistakes and improving through the continuous provision of feedback by the instructors. Summative assessment occurs through weekly homework assignments, exams, and the final submission of the team project. In the spirit of the PL platform design, emphasis is given on mastery rather than penalization. For example, students can earn additional points for solving different randomized versions of homework problems and multiple attempts on randomized problems are allowed up to a maximum number of points. Exams work differently. At the instructor’s discretion, multiple attempts may be allowed, for a limited number of attempts for reduced number of points, as the number of attempts increases. Grading weights are shown in Table 1. In Figure 2, we depict cognitive assessment tools we used in the first semester of full implementation we describe here, indicative for both courses. Figure 1. Class management under the student-centered learning model.
Table 1. Grading weights.
SEE course ERU course Assignment type weight Assignment type weight Quizzes 2.5% Video quizzes 5% Participation (worksheets) 12.5% Participation (worksheets) 5% Weekly Homework 20% Weekly Homework 20% Exam 1, 2, 3 15%, 15%, 25% Short exams (4) 40% (10% each) Team project 10% Team Project 15% Final exam (comprehensive) 15%
Figure 2. Summary depiction of cognitive assessment tools.
2.1. Bloom’s taxonomy student outcomes and cognitive assessment tools Regarding student learning outcomes, we have followed the CEBOK [1] approach of adopting the original Bloom’s taxonomy. Tables 2 and 3 present a detailed description of specific cognitive outcomes and corresponding assessments, we used in the first semester of full implementation. Given these are introductory courses, most student outcomes lie at the lower levels of Bloom’s taxonomy, with the class projects reaching the upper levels. Table 4 presents affective student outcomes [16], according the CEBOK. Out of the seven outcomes in the CEBOK that are associated with the affective domain (sustainability, communication, teamwork and leadership, lifelong learning, professional attitudes; professional responsibilities, ethical responsibilities), we have included the ones that are emphasized in each of the two courses and for only the affective outcomes that correspond to the undergraduate pathway (i.e., receiving and responding).
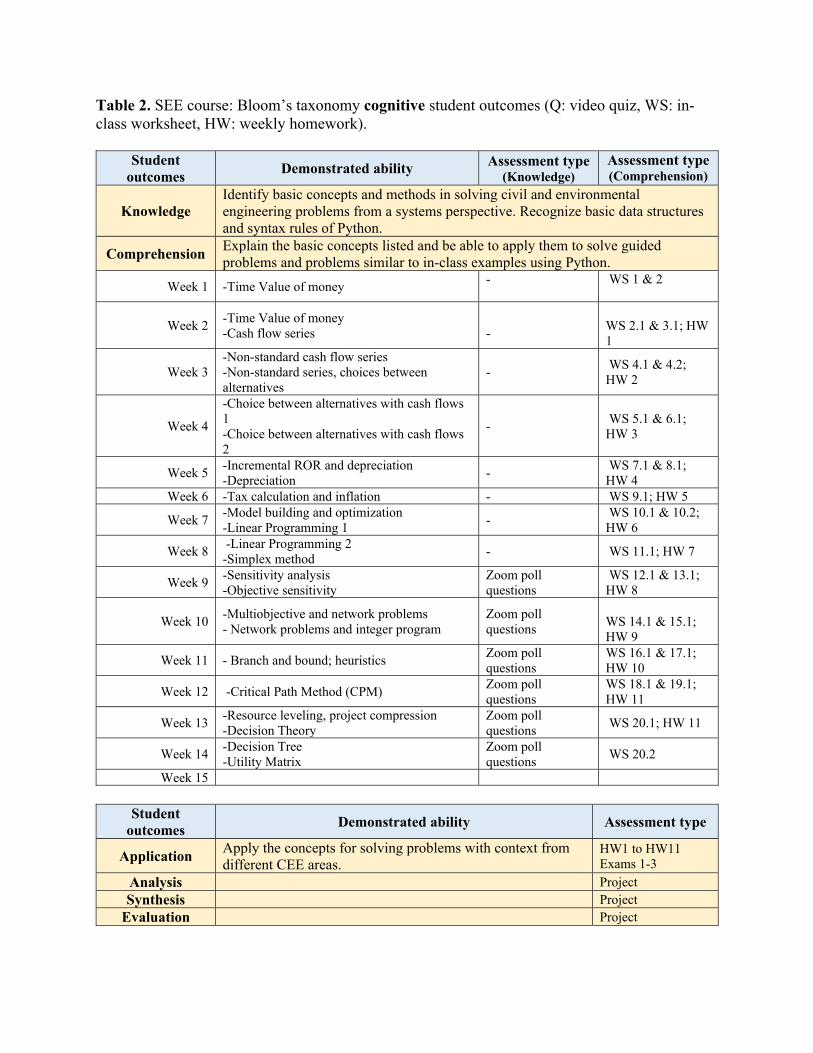
Table 2. SEE course: Bloom’s taxonomy cognitive student outcomes (Q: video quiz, WS: in-class worksheet, HW: weekly homework).
Student outcomes
Demonstrated ability Assessment type (Knowledge)
Assessment type (Comprehension)
Knowledge Identify basic concepts and methods in solving civil and environmental engineering problems from a systems perspective. Recognize basic data structures and syntax rules of Python.
Comprehension Explain the basic concepts listed and be able to apply them to solve guided problems and problems similar to in-class examples using Python.
Week 1 -Time Value of money -
WS 1 & 2
Week 2 -Time Value of money -Cash flow series
-
WS 2.1 & 3.1; HW 1
Week 3 -Non-standard cash flow series -Non-standard series, choices between alternatives
- WS 4.1 & 4.2; HW 2
Week 4
-Choice between alternatives with cash flows 1 -Choice between alternatives with cash flows 2
- WS 5.1 & 6.1; HW 3
Week 5 -Incremental ROR and depreciation -Depreciation
- WS 7.1 & 8.1; HW 4
Week 6 -Tax calculation and inflation - WS 9.1; HW 5
Week 7 -Model building and optimization -Linear Programming 1
- WS 10.1 & 10.2; HW 6
Week 8 -Linear Programming 2 -Simplex method
- WS 11.1; HW 7
Week 9 -Sensitivity analysis -Objective sensitivity
Zoom poll questions
WS 12.1 & 13.1; HW 8
Week 10 -Multiobjective and network problems - Network problems and integer program
Zoom poll questions
WS 14.1 & 15.1; HW 9
Week 11 - Branch and bound; heuristics Zoom poll questions
WS 16.1 & 17.1; HW 10
Week 12 -Critical Path Method (CPM) Zoom poll questions
WS 18.1 & 19.1; HW 11
Week 13 -Resource leveling, project compression -Decision Theory
Zoom poll questions
WS 20.1; HW 11
Week 14 -Decision Tree -Utility Matrix
Zoom poll questions
WS 20.2
Week 15
Student outcomes
Demonstrated ability Assessment type
Application Apply the concepts for solving problems with context from different CEE areas.
HW1 to HW11 Exams 1-3
Analysis Project Synthesis Project
Evaluation Project
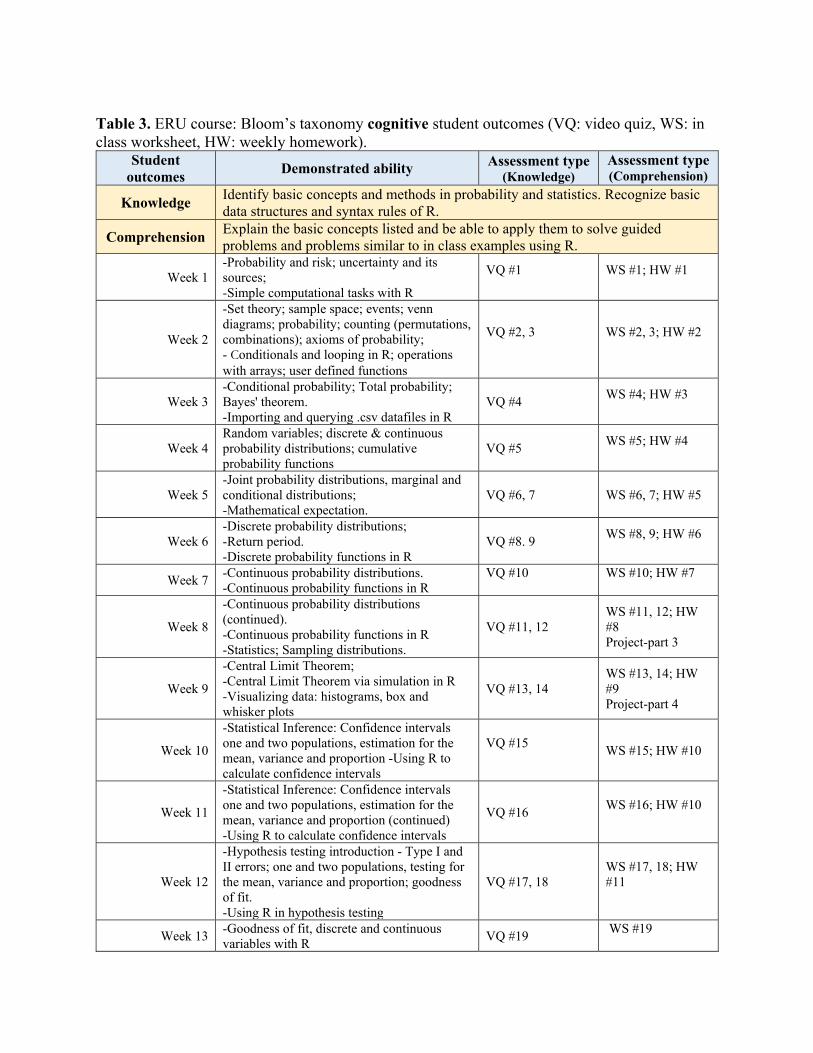
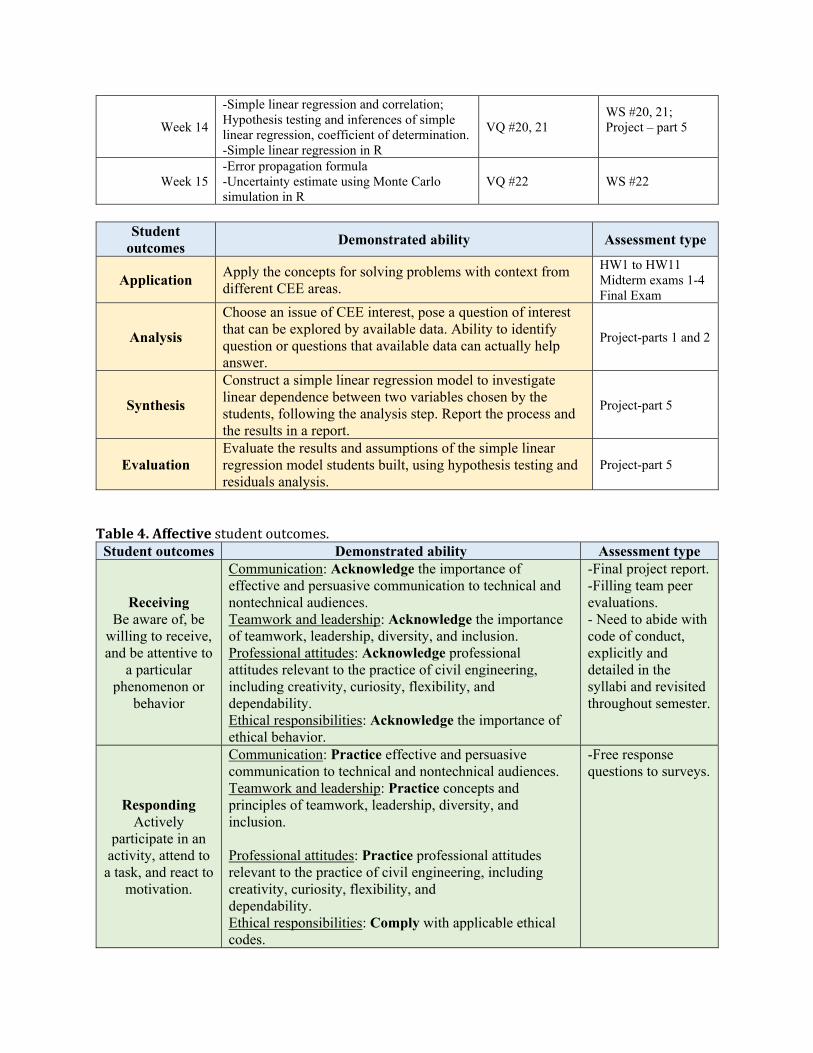
Table 3. ERU course: Bloom’s taxonomy cognitive student outcomes (VQ: video quiz, WS: in class worksheet, HW: weekly homework).
Student outcomes
Demonstrated ability Assessment type (Knowledge)
Assessment type (Comprehension)
Knowledge Identify basic concepts and methods in probability and statistics. Recognize basic data structures and syntax rules of R.
Comprehension Explain the basic concepts listed and be able to apply them to solve guided problems and problems similar to in class examples using R.
Week 1 -Probability and risk; uncertainty and its sources; -Simple computational tasks with R
VQ #1
WS #1; HW #1
Week 2
-Set theory; sample space; events; venn diagrams; probability; counting (permutations, combinations); axioms of probability; - Conditionals and looping in R; operations with arrays; user defined functions
VQ #2, 3
WS #2, 3; HW #2
Week 3 -Conditional probability; Total probability; Bayes' theorem. -Importing and querying .csv datafiles in R
VQ #4 WS #4; HW #3
Week 4 Random variables; discrete & continuous probability distributions; cumulative probability functions
VQ #5 WS #5; HW #4
Week 5 -Joint probability distributions, marginal and conditional distributions; -Mathematical expectation.
VQ #6, 7 WS #6, 7; HW #5
Week 6 -Discrete probability distributions; -Return period. -Discrete probability functions in R
VQ #8. 9 WS #8, 9; HW #6
Week 7 -Continuous probability distributions. -Continuous probability functions in R
VQ #10
WS #10; HW #7
Week 8
-Continuous probability distributions (continued). -Continuous probability functions in R -Statistics; Sampling distributions.
VQ #11, 12 WS #11, 12; HW #8 Project-part 3
Week 9
-Central Limit Theorem; -Central Limit Theorem via simulation in R -Visualizing data: histograms, box and whisker plots
VQ #13, 14 WS #13, 14; HW #9 Project-part 4
Week 10
-Statistical Inference: Confidence intervals one and two populations, estimation for the mean, variance and proportion -Using R to calculate confidence intervals
VQ #15
WS #15; HW #10
Week 11
-Statistical Inference: Confidence intervals one and two populations, estimation for the mean, variance and proportion (continued) -Using R to calculate confidence intervals
VQ #16 WS #16; HW #10
Week 12
-Hypothesis testing introduction - Type I and II errors; one and two populations, testing for the mean, variance and proportion; goodness of fit. -Using R in hypothesis testing
VQ #17, 18 WS #17, 18; HW #11
Week 13 -Goodness of fit, discrete and continuous variables with R
VQ #19 WS #19
Week 14
-Simple linear regression and correlation; Hypothesis testing and inferences of simple linear regression, coefficient of determination. -Simple linear regression in R
VQ #20, 21 WS #20, 21; Project – part 5
Week 15 -Error propagation formula -Uncertainty estimate using Monte Carlo simulation in R
VQ #22 WS #22
Student
outcomes Demonstrated ability Assessment type
Application Apply the concepts for solving problems with context from different CEE areas.
HW1 to HW11 Midterm exams 1-4 Final Exam
Analysis
Choose an issue of CEE interest, pose a question of interest that can be explored by available data. Ability to identify question or questions that available data can actually help answer.
Project-parts 1 and 2
Synthesis
Construct a simple linear regression model to investigate linear dependence between two variables chosen by the students, following the analysis step. Report the process and the results in a report.
Project-part 5
Evaluation Evaluate the results and assumptions of the simple linear regression model students built, using hypothesis testing and residuals analysis.
Project-part 5
Table4. Affective student outcomes.
Student outcomes Demonstrated ability Assessment type
Receiving Be aware of, be
willing to receive, and be attentive to
a particular phenomenon or
behavior
Communication: Acknowledge the importance of effective and persuasive communication to technical and nontechnical audiences. Teamwork and leadership: Acknowledge the importance of teamwork, leadership, diversity, and inclusion. Professional attitudes: Acknowledge professional attitudes relevant to the practice of civil engineering, including creativity, curiosity, flexibility, and dependability. Ethical responsibilities: Acknowledge the importance of ethical behavior.
-Final project report. -Filling team peer evaluations. - Need to abide with code of conduct, explicitly and detailed in the syllabi and revisited throughout semester.
Responding Actively
participate in an activity, attend to a task, and react to
motivation.
Communication: Practice effective and persuasive communication to technical and nontechnical audiences. Teamwork and leadership: Practice concepts and principles of teamwork, leadership, diversity, and inclusion. Professional attitudes: Practice professional attitudes relevant to the practice of civil engineering, including creativity, curiosity, flexibility, and dependability. Ethical responsibilities: Comply with applicable ethical codes.
-Free response questions to surveys.
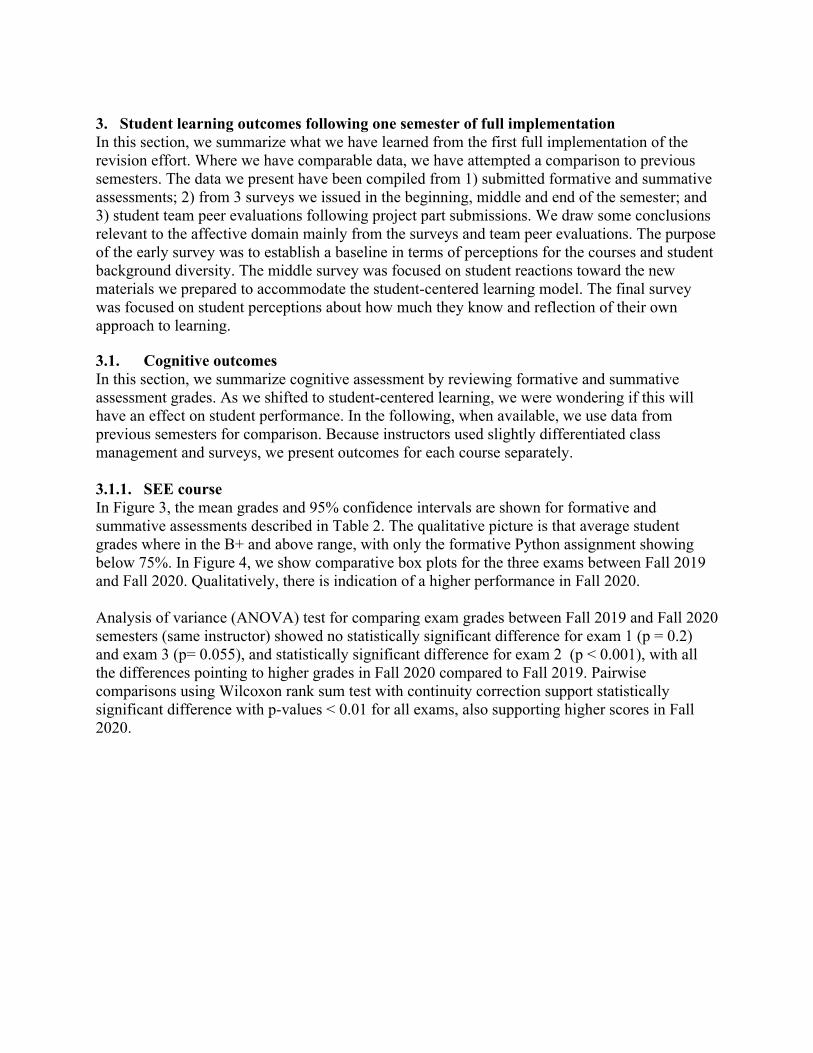
3. Student learning outcomes following one semester of full implementation In this section, we summarize what we have learned from the first full implementation of the revision effort. Where we have comparable data, we have attempted a comparison to previous semesters. The data we present have been compiled from 1) submitted formative and summative assessments; 2) from 3 surveys we issued in the beginning, middle and end of the semester; and 3) student team peer evaluations following project part submissions. We draw some conclusions relevant to the affective domain mainly from the surveys and team peer evaluations. The purpose of the early survey was to establish a baseline in terms of perceptions for the courses and student background diversity. The middle survey was focused on student reactions toward the new materials we prepared to accommodate the student-centered learning model. The final survey was focused on student perceptions about how much they know and reflection of their own approach to learning. 3.1. Cognitive outcomes In this section, we summarize cognitive assessment by reviewing formative and summative assessment grades. As we shifted to student-centered learning, we were wondering if this will have an effect on student performance. In the following, when available, we use data from previous semesters for comparison. Because instructors used slightly differentiated class management and surveys, we present outcomes for each course separately. 3.1.1. SEE course In Figure 3, the mean grades and 95% confidence intervals are shown for formative and summative assessments described in Table 2. The qualitative picture is that average student grades where in the B+ and above range, with only the formative Python assignment showing below 75%. In Figure 4, we show comparative box plots for the three exams between Fall 2019 and Fall 2020. Qualitatively, there is indication of a higher performance in Fall 2020. Analysis of variance (ANOVA) test for comparing exam grades between Fall 2019 and Fall 2020 semesters (same instructor) showed no statistically significant difference for exam 1 (p = 0.2) and exam 3 (p= 0.055), and statistically significant difference for exam 2 (p < 0.001), with all the differences pointing to higher grades in Fall 2020 compared to Fall 2019. Pairwise comparisons using Wilcoxon rank sum test with continuity correction support statistically significant difference with p-values < 0.01 for all exams, also supporting higher scores in Fall 2020.
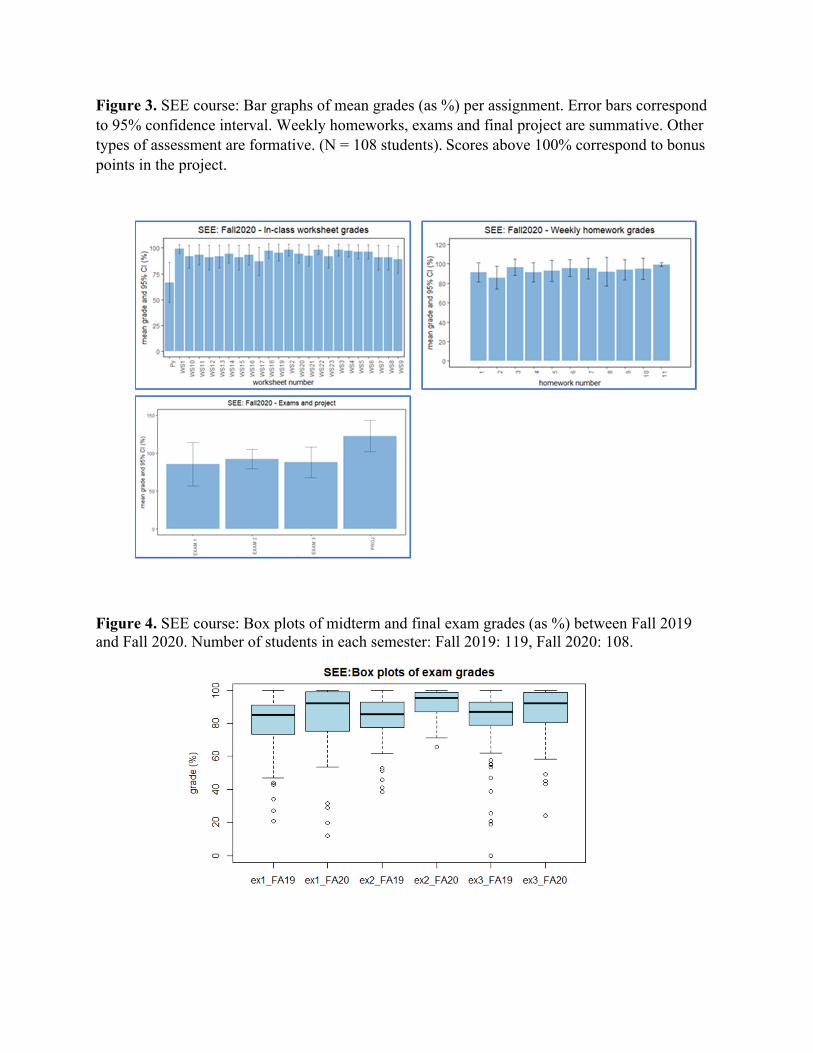
Figure 3. SEE course: Bar graphs of mean grades (as %) per assignment. Error bars correspond to 95% confidence interval. Weekly homeworks, exams and final project are summative. Other types of assessment are formative. (N = 108 students). Scores above 100% correspond to bonus points in the project.
Figure 4. SEE course: Box plots of midterm and final exam grades (as %) between Fall 2019 and Fall 2020. Number of students in each semester: Fall 2019: 119, Fall 2020: 108.
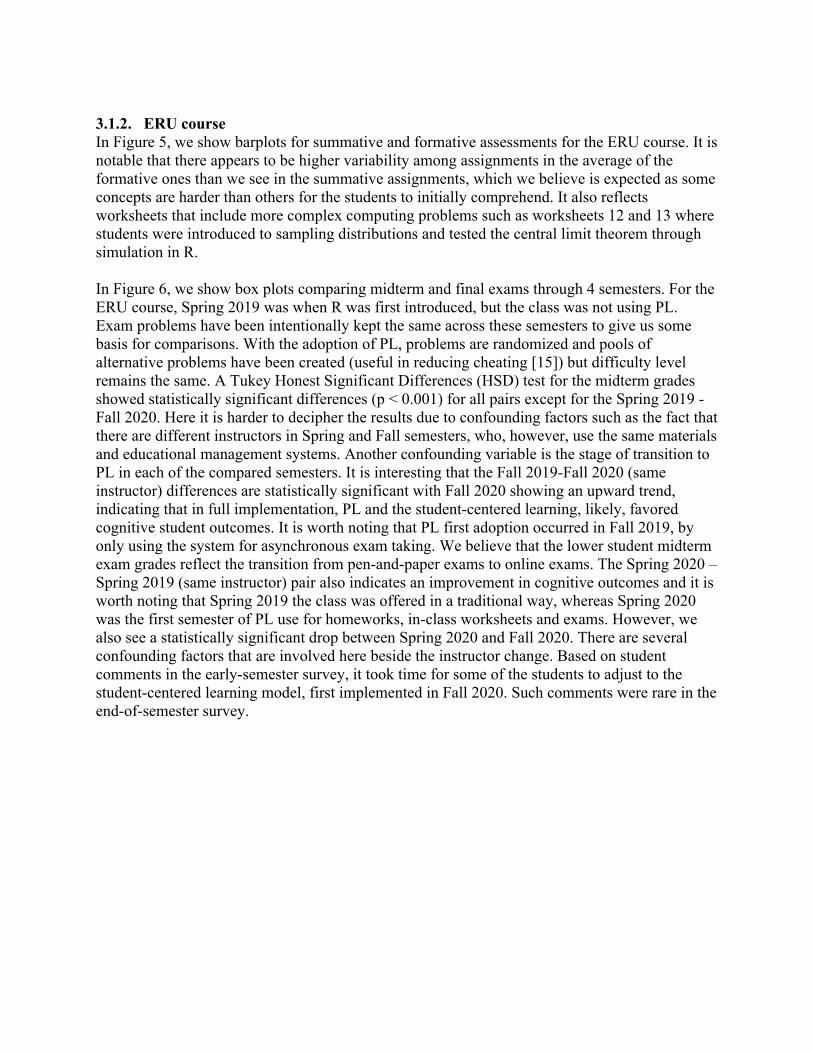
3.1.2. ERU course In Figure 5, we show barplots for summative and formative assessments for the ERU course. It is notable that there appears to be higher variability among assignments in the average of the formative ones than we see in the summative assignments, which we believe is expected as some concepts are harder than others for the students to initially comprehend. It also reflects worksheets that include more complex computing problems such as worksheets 12 and 13 where students were introduced to sampling distributions and tested the central limit theorem through simulation in R. In Figure 6, we show box plots comparing midterm and final exams through 4 semesters. For the ERU course, Spring 2019 was when R was first introduced, but the class was not using PL. Exam problems have been intentionally kept the same across these semesters to give us some basis for comparisons. With the adoption of PL, problems are randomized and pools of alternative problems have been created (useful in reducing cheating [15]) but difficulty level remains the same. A Tukey Honest Significant Differences (HSD) test for the midterm grades showed statistically significant differences (p < 0.001) for all pairs except for the Spring 2019 - Fall 2020. Here it is harder to decipher the results due to confounding factors such as the fact that there are different instructors in Spring and Fall semesters, who, however, use the same materials and educational management systems. Another confounding variable is the stage of transition to PL in each of the compared semesters. It is interesting that the Fall 2019-Fall 2020 (same instructor) differences are statistically significant with Fall 2020 showing an upward trend, indicating that in full implementation, PL and the student-centered learning, likely, favored cognitive student outcomes. It is worth noting that PL first adoption occurred in Fall 2019, by only using the system for asynchronous exam taking. We believe that the lower student midterm exam grades reflect the transition from pen-and-paper exams to online exams. The Spring 2020 – Spring 2019 (same instructor) pair also indicates an improvement in cognitive outcomes and it is worth noting that Spring 2019 the class was offered in a traditional way, whereas Spring 2020 was the first semester of PL use for homeworks, in-class worksheets and exams. However, we also see a statistically significant drop between Spring 2020 and Fall 2020. There are several confounding factors that are involved here beside the instructor change. Based on student comments in the early-semester survey, it took time for some of the students to adjust to the student-centered learning model, first implemented in Fall 2020. Such comments were rare in the end-of-semester survey.
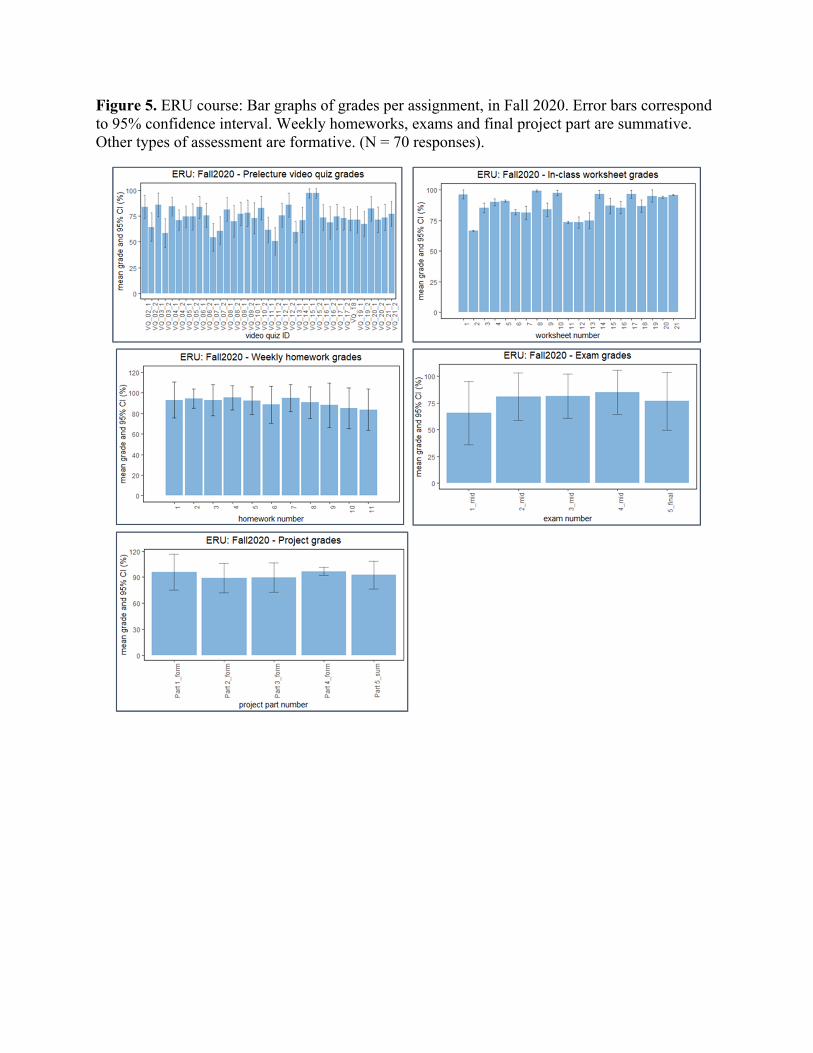
Figure 5. ERU course: Bar graphs of grades per assignment, in Fall 2020. Error bars correspond to 95% confidence interval. Weekly homeworks, exams and final project part are summative. Other types of assessment are formative. (N = 70 responses).
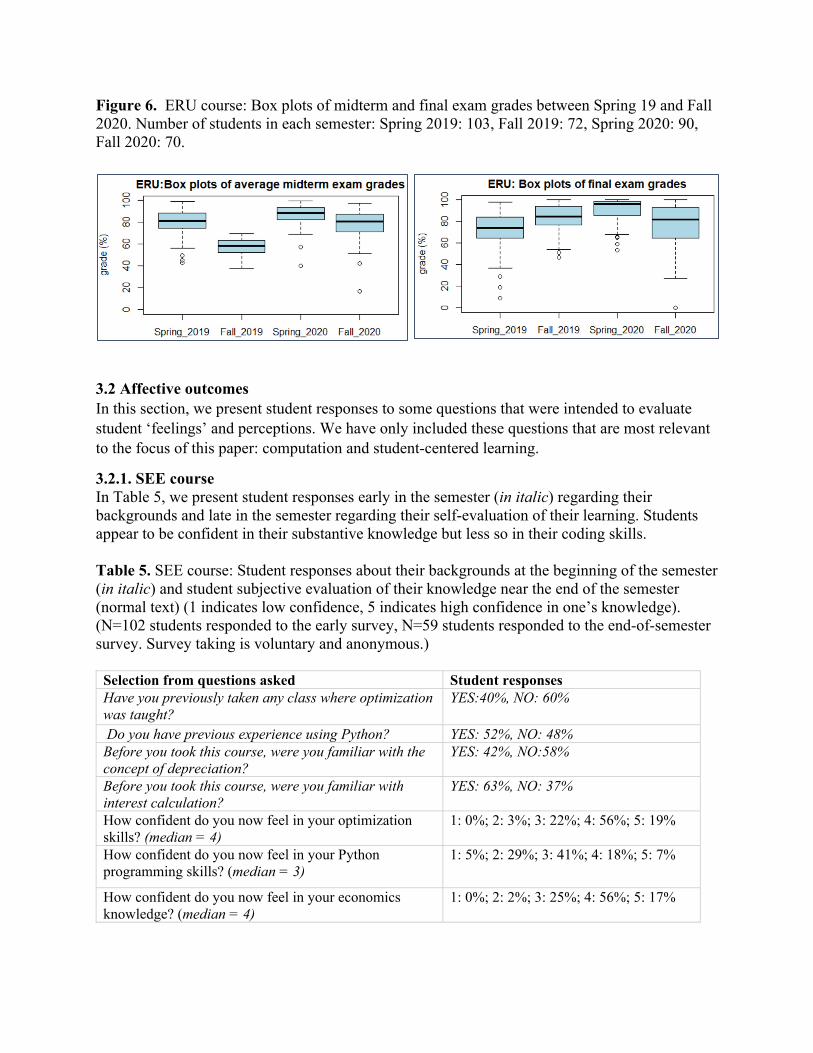
Figure 6. ERU course: Box plots of midterm and final exam grades between Spring 19 and Fall 2020. Number of students in each semester: Spring 2019: 103, Fall 2019: 72, Spring 2020: 90, Fall 2020: 70.
3.2 Affective outcomes In this section, we present student responses to some questions that were intended to evaluate student ‘feelings’ and perceptions. We have only included these questions that are most relevant to the focus of this paper: computation and student-centered learning.
3.2.1. SEE course In Table 5, we present student responses early in the semester (in italic) regarding their backgrounds and late in the semester regarding their self-evaluation of their learning. Students appear to be confident in their substantive knowledge but less so in their coding skills. Table 5. SEE course: Student responses about their backgrounds at the beginning of the semester (in italic) and student subjective evaluation of their knowledge near the end of the semester (normal text) (1 indicates low confidence, 5 indicates high confidence in one’s knowledge). (N=102 students responded to the early survey, N=59 students responded to the end-of-semester survey. Survey taking is voluntary and anonymous.)
Selection from questions asked Student responses Have you previously taken any class where optimization was taught?
YES:40%, NO: 60%
Do you have previous experience using Python? YES: 52%, NO: 48% Before you took this course, were you familiar with the concept of depreciation?
YES: 42%, NO:58%
Before you took this course, were you familiar with interest calculation?
YES: 63%, NO: 37%
How confident do you now feel in your optimization skills? (median = 4)
1: 0%; 2: 3%; 3: 22%; 4: 56%; 5: 19%
How confident do you now feel in your Python programming skills? (median = 3)
1: 5%; 2: 29%; 3: 41%; 4: 18%; 5: 7%
How confident do you now feel in your economics knowledge? (median = 4)
1: 0%; 2: 2%; 3: 25%; 4: 56%; 5: 17%
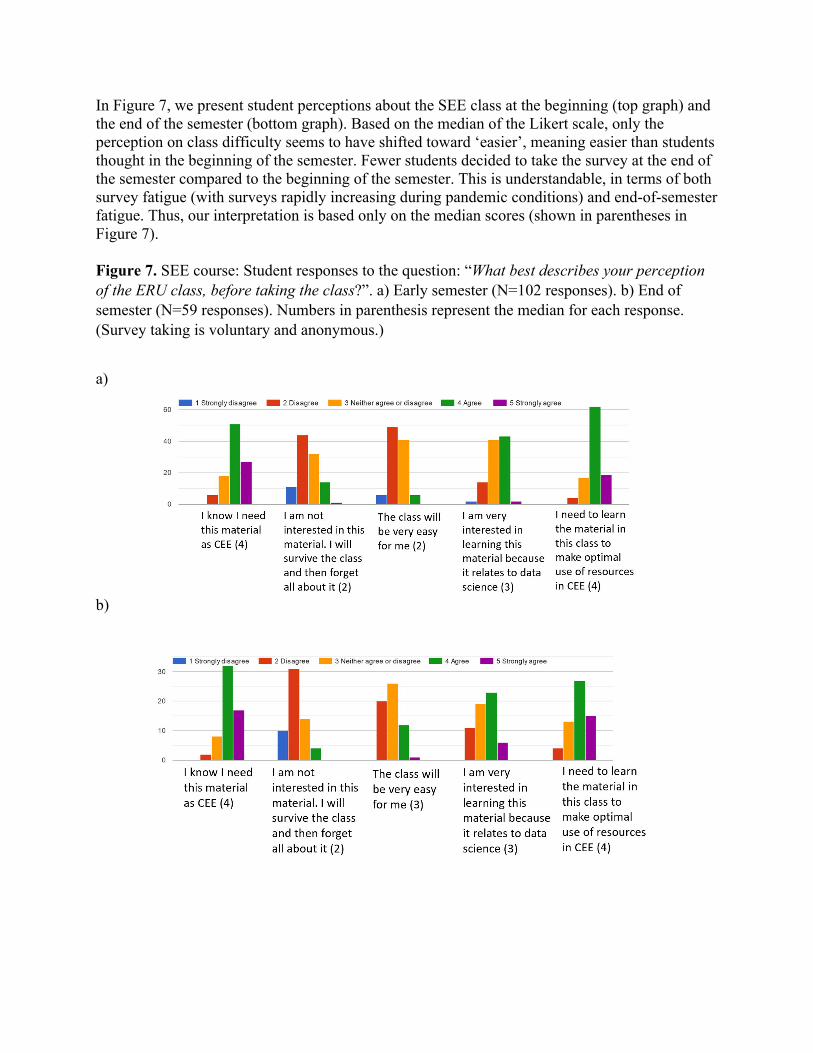
In Figure 7, we present student perceptions about the SEE class at the beginning (top graph) and the end of the semester (bottom graph). Based on the median of the Likert scale, only the perception on class difficulty seems to have shifted toward ‘easier’, meaning easier than students thought in the beginning of the semester. Fewer students decided to take the survey at the end of the semester compared to the beginning of the semester. This is understandable, in terms of both survey fatigue (with surveys rapidly increasing during pandemic conditions) and end-of-semester fatigue. Thus, our interpretation is based only on the median scores (shown in parentheses in Figure 7). Figure 7. SEE course: Student responses to the question: “What best describes your perception of the ERU class, before taking the class?”. a) Early semester (N=102 responses). b) End of semester (N=59 responses). Numbers in parenthesis represent the median for each response. (Survey taking is voluntary and anonymous.)
a)
b)
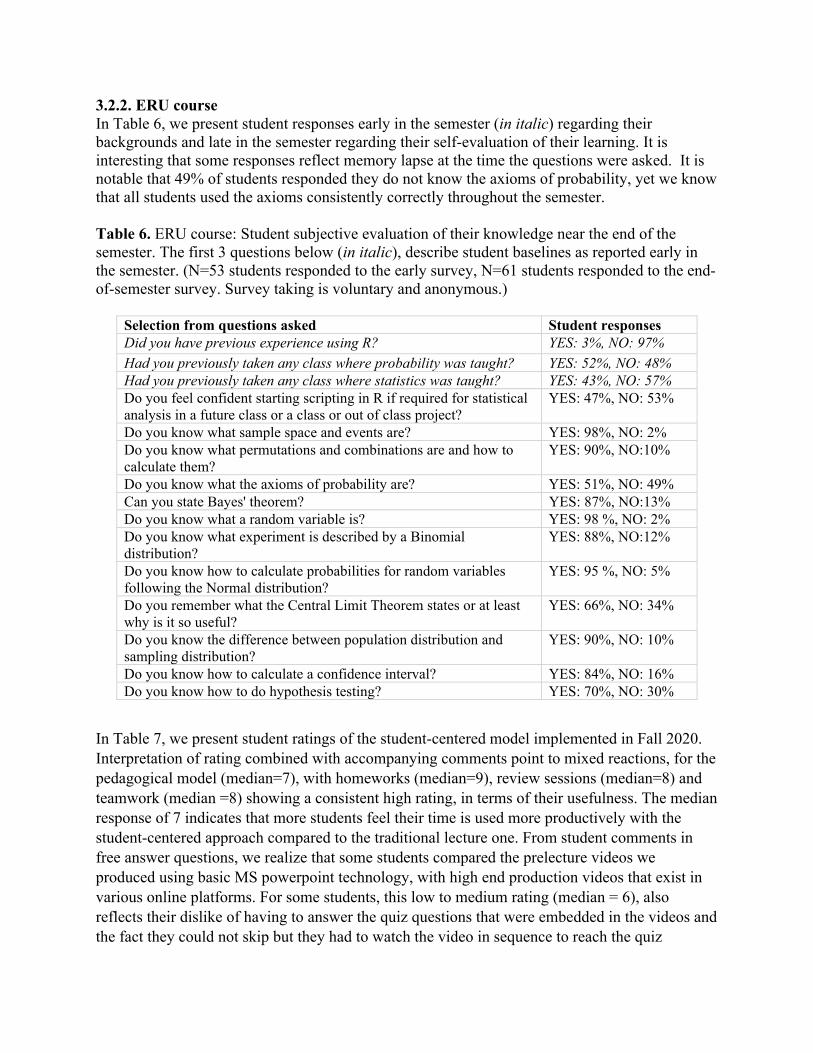
3.2.2. ERU course In Table 6, we present student responses early in the semester (in italic) regarding their backgrounds and late in the semester regarding their self-evaluation of their learning. It is interesting that some responses reflect memory lapse at the time the questions were asked. It is notable that 49% of students responded they do not know the axioms of probability, yet we know that all students used the axioms consistently correctly throughout the semester. Table 6. ERU course: Student subjective evaluation of their knowledge near the end of the semester. The first 3 questions below (in italic), describe student baselines as reported early in the semester. (N=53 students responded to the early survey, N=61 students responded to the end-of-semester survey. Survey taking is voluntary and anonymous.)
Selection from questions asked Student responses Did you have previous experience using R? YES: 3%, NO: 97%
Had you previously taken any class where probability was taught? YES: 52%, NO: 48% Had you previously taken any class where statistics was taught? YES: 43%, NO: 57% Do you feel confident starting scripting in R if required for statistical analysis in a future class or a class or out of class project?
YES: 47%, NO: 53%
Do you know what sample space and events are? YES: 98%, NO: 2% Do you know what permutations and combinations are and how to calculate them?
YES: 90%, NO:10%
Do you know what the axioms of probability are? YES: 51%, NO: 49% Can you state Bayes' theorem? YES: 87%, NO:13% Do you know what a random variable is? YES: 98 %, NO: 2% Do you know what experiment is described by a Binomial distribution?
YES: 88%, NO:12%
Do you know how to calculate probabilities for random variables following the Normal distribution?
YES: 95 %, NO: 5%
Do you remember what the Central Limit Theorem states or at least why is it so useful?
YES: 66%, NO: 34%
Do you know the difference between population distribution and sampling distribution?
YES: 90%, NO: 10%
Do you know how to calculate a confidence interval? YES: 84%, NO: 16% Do you know how to do hypothesis testing? YES: 70%, NO: 30%
In Table 7, we present student ratings of the student-centered model implemented in Fall 2020. Interpretation of rating combined with accompanying comments point to mixed reactions, for the pedagogical model (median=7), with homeworks (median=9), review sessions (median=8) and teamwork (median =8) showing a consistent high rating, in terms of their usefulness. The median response of 7 indicates that more students feel their time is used more productively with the student-centered approach compared to the traditional lecture one. From student comments in free answer questions, we realize that some students compared the prelecture videos we produced using basic MS powerpoint technology, with high end production videos that exist in various online platforms. For some students, this low to medium rating (median = 6), also reflects their dislike of having to answer the quiz questions that were embedded in the videos and the fact they could not skip but they had to watch the video in sequence to reach the quiz
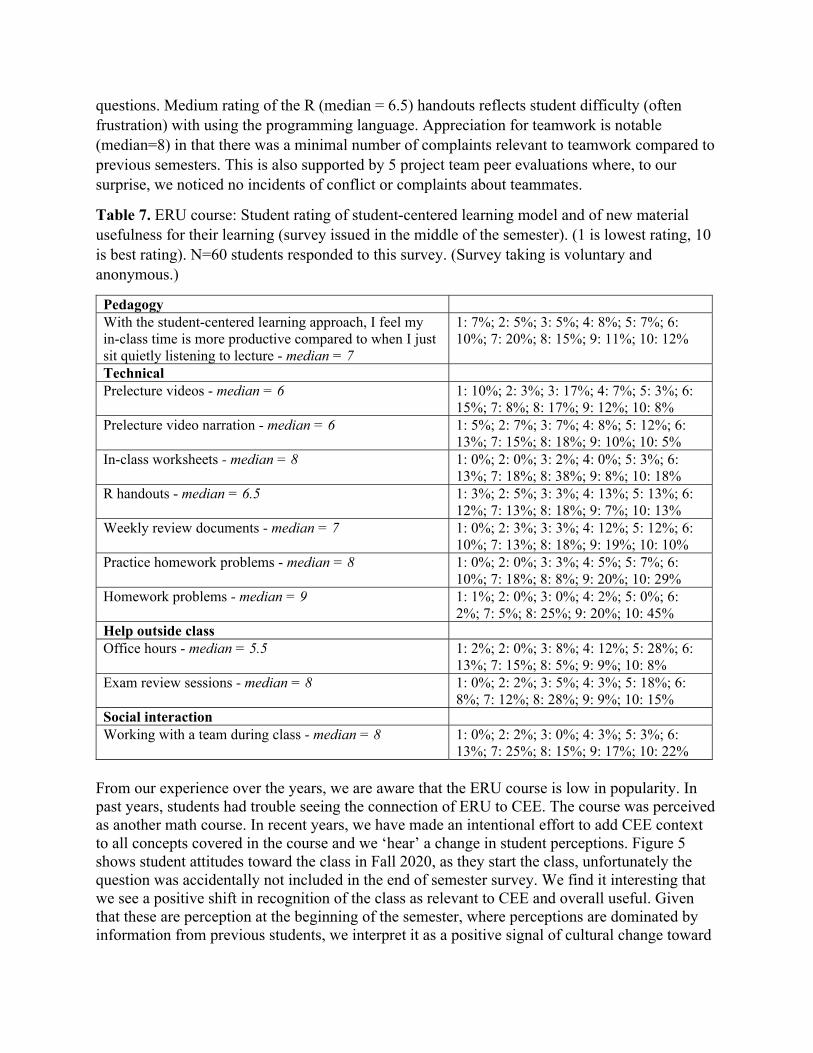
questions. Medium rating of the R (median = 6.5) handouts reflects student difficulty (often frustration) with using the programming language. Appreciation for teamwork is notable (median=8) in that there was a minimal number of complaints relevant to teamwork compared to previous semesters. This is also supported by 5 project team peer evaluations where, to our surprise, we noticed no incidents of conflict or complaints about teammates.
Table 7. ERU course: Student rating of student-centered learning model and of new material usefulness for their learning (survey issued in the middle of the semester). (1 is lowest rating, 10 is best rating). N=60 students responded to this survey. (Survey taking is voluntary and anonymous.)
Pedagogy With the student-centered learning approach, I feel my in-class time is more productive compared to when I just sit quietly listening to lecture - median = 7
1: 7%; 2: 5%; 3: 5%; 4: 8%; 5: 7%; 6: 10%; 7: 20%; 8: 15%; 9: 11%; 10: 12%
Technical Prelecture videos - median = 6 1: 10%; 2: 3%; 3: 17%; 4: 7%; 5: 3%; 6:
15%; 7: 8%; 8: 17%; 9: 12%; 10: 8% Prelecture video narration - median = 6 1: 5%; 2: 7%; 3: 7%; 4: 8%; 5: 12%; 6:
13%; 7: 15%; 8: 18%; 9: 10%; 10: 5% In-class worksheets - median = 8
1: 0%; 2: 0%; 3: 2%; 4: 0%; 5: 3%; 6: 13%; 7: 18%; 8: 38%; 9: 8%; 10: 18%
R handouts - median = 6.5
1: 3%; 2: 5%; 3: 3%; 4: 13%; 5: 13%; 6: 12%; 7: 13%; 8: 18%; 9: 7%; 10: 13%
Weekly review documents - median = 7
1: 0%; 2: 3%; 3: 3%; 4: 12%; 5: 12%; 6: 10%; 7: 13%; 8: 18%; 9: 19%; 10: 10%
Practice homework problems - median = 8
1: 0%; 2: 0%; 3: 3%; 4: 5%; 5: 7%; 6: 10%; 7: 18%; 8: 8%; 9: 20%; 10: 29%
Homework problems - median = 9 1: 1%; 2: 0%; 3: 0%; 4: 2%; 5: 0%; 6: 2%; 7: 5%; 8: 25%; 9: 20%; 10: 45%
Help outside class Office hours - median = 5.5
1: 2%; 2: 0%; 3: 8%; 4: 12%; 5: 28%; 6: 13%; 7: 15%; 8: 5%; 9: 9%; 10: 8%
Exam review sessions - median = 8 1: 0%; 2: 2%; 3: 5%; 4: 3%; 5: 18%; 6: 8%; 7: 12%; 8: 28%; 9: 9%; 10: 15%
Social interaction Working with a team during class - median = 8
1: 0%; 2: 2%; 3: 0%; 4: 3%; 5: 3%; 6: 13%; 7: 25%; 8: 15%; 9: 17%; 10: 22%
From our experience over the years, we are aware that the ERU course is low in popularity. In past years, students had trouble seeing the connection of ERU to CEE. The course was perceived as another math course. In recent years, we have made an intentional effort to add CEE context to all concepts covered in the course and we ‘hear’ a change in student perceptions. Figure 5 shows student attitudes toward the class in Fall 2020, as they start the class, unfortunately the question was accidentally not included in the end of semester survey. We find it interesting that we see a positive shift in recognition of the class as relevant to CEE and overall useful. Given that these are perception at the beginning of the semester, where perceptions are dominated by information from previous students, we interpret it as a positive signal of cultural change toward
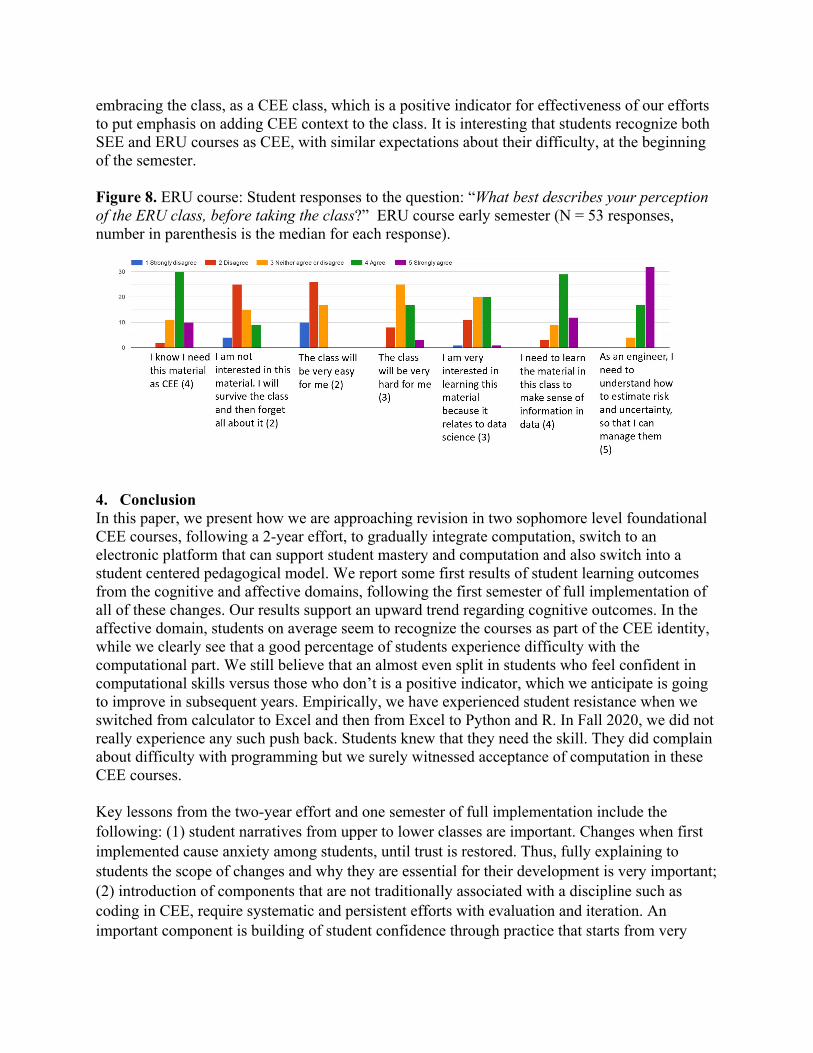
embracing the class, as a CEE class, which is a positive indicator for effectiveness of our efforts to put emphasis on adding CEE context to the class. It is interesting that students recognize both SEE and ERU courses as CEE, with similar expectations about their difficulty, at the beginning of the semester. Figure 8. ERU course: Student responses to the question: “What best describes your perception of the ERU class, before taking the class?” ERU course early semester (N = 53 responses, number in parenthesis is the median for each response).
4. Conclusion In this paper, we present how we are approaching revision in two sophomore level foundational CEE courses, following a 2-year effort, to gradually integrate computation, switch to an electronic platform that can support student mastery and computation and also switch into a student centered pedagogical model. We report some first results of student learning outcomes from the cognitive and affective domains, following the first semester of full implementation of all of these changes. Our results support an upward trend regarding cognitive outcomes. In the affective domain, students on average seem to recognize the courses as part of the CEE identity, while we clearly see that a good percentage of students experience difficulty with the computational part. We still believe that an almost even split in students who feel confident in computational skills versus those who don’t is a positive indicator, which we anticipate is going to improve in subsequent years. Empirically, we have experienced student resistance when we switched from calculator to Excel and then from Excel to Python and R. In Fall 2020, we did not really experience any such push back. Students knew that they need the skill. They did complain about difficulty with programming but we surely witnessed acceptance of computation in these CEE courses. Key lessons from the two-year effort and one semester of full implementation include the following: (1) student narratives from upper to lower classes are important. Changes when first implemented cause anxiety among students, until trust is restored. Thus, fully explaining to students the scope of changes and why they are essential for their development is very important; (2) introduction of components that are not traditionally associated with a discipline such as coding in CEE, require systematic and persistent efforts with evaluation and iteration. An important component is building of student confidence through practice that starts from very
simple exercises to gradually more complex applications; (3) the introduction of online platforms has many advantages for supporting student mastery and practice of coding skills. However, consideration of student questions suggests that for some students, use of multiple platforms (to which we need to include platforms students use for teamwork) can be confusing and tiresome. Therefore, adoption of such platforms requires careful course design, so that the interfaces are user friendly and intuitive. These key lessons provide directions for our continuing efforts as updates and innovation gradually propagate to upper level courses, a process already underway, with notable example the creation of a data science certificate designed for undergraduate CEE students.
Acknowledgments This effort was supported by a Strategic Instructional Innovations Program (SIIP) grant of the Grainger College of Engineering and by the Civil and Environmental Engineering Department, at the University of Illinois at Urbana - Champaign. We thank Craig Zilles and Chris Schmitz for mentoring us on the effective use of new educational technologies. References [1] ASCE, "Civil Engineering Body of Knowledge Preparing the Future Civil Engineer, 3rd
edition," Civil Engineering Body of Knowledge 3 Task Committee, 2019. [2] E. NASEM: National Academies of Sciences, and Medicine, Environmental Engineering
for the 21st Century: Addressing Grand Challenges. Washington DC: The National Academies Press 2019.
[3] G. Wilson, J. Bryan, K. Cranston, J. Kitzes, L. Nederbragt, and T. K. Teal, "Good enough practices in scientific computing," PLoS Comput Biol, vol. 13, no. 6, p. e1005510, Jun 2017.
[4] H. Y. Durak, Modeling Different Variables in Learning Basic Concepts of Programming in Flipped Classrooms. Journal of Educational Computing Research: SAGE, 2020.
[5] Y. S. Wong, M. Y. M. Hayati, W. H. Tan, and L. C. Yap, "A Game-Based Learning Assessment Framework for Learning Ubiquitous Computational Thinking," in The Impact of the 4th Industrial Revolution on Engineering Education(Advances in Intelligent Systems and Computing, 2020, pp. 607-615.
[6] D. Topalli and N. E. Cagiltay, "Improving programming skills in engineering education through problem-based game projects with Scratch," Computers & Education, vol. 120, p. 10, 2018.
[7] T.-C. Hsu, S.-C. Chang, and Y.-T. Hung, "How to learn and how to teach computational thinking: Suggestions based on a review of the literature," Computers & Education, vol. 126, pp. 296-310, 2018.
[8] S. Freeman et al., "Active learning increases student performance in science, engineering, and mathematics," Proc Natl Acad Sci U S A, vol. 111, no. 23, pp. 8410-5, Jun 10 2014.
[9] M. C. English and A. Kitsantas, "Supporting Student Self-Regulated Learning in Problem- and Project-Based Learning," Interdisciplinary Journal of Problem-Based Learning, vol. 7, no. 2, 2013.
[10] A. Karabulut-Ilgu, N. Jaramillo Cherrez, and C. T. Jahren, "A systematic review of research on the flipped learning method in engineering education," British Journal of Educational Technology, vol. 49, no. 3, p. 13, 2018.
[11] P. B. Henderson, "Ubiquitous Computational Thinking," Computer, vol. 42 no. 10, p. 3 2009.
[12] G. Van Rossum and F. L. Drake, "Python 3 Reference Manual," 2009. Scotts Valley, CA: CreateSpace
[13] R_Core_Team, "R: A language and environment for statistical computing," 2014. R Foundation for Statistical Computing, Vienna, Austria. URL http://www.R-project.org/
[14] M. West, G. L. Herman, and C. Zilles, "PrairieLearn: Mastery-based online problem solving with adaptive scoring and recommendations driven by machine learning," ASEE Annual Conference and Exposition, Conference Proceedings, 122nd ASEE Annual Conference and Exposition: Making Value for Society (122nd ASEE Annual Conference and Exposition: Making Value for...). , 2015.
[15] B. Chen, M. West, and C. Zilles, "How much randomization is needed to deter collaborative cheating on asynchronous exams?," presented at the Proceedings of the Fifth Annual ACM Conference on Learning at Scale, 2018.
[16] D. R. Krathwohl, B. S. Bloom, and B. B. Masia, Taxonomy of educational objectives, the classification of educational goals. Handbook II: Affective domain. New York: David McKay Co., Inc., 1964.