Embed Size (px)
DESCRIPTION
EE150a – Genomic Signal and Information Processing On DNA Microarrays Technology October 12, 2004. Recall the information flow in cells. Replication of DNA {A,C,G,T} to {A, C, G,T} Transcription of DNA to mRNA {A,C,G,T} to {A, C, G,U} Translation of mRNA to proteins - PowerPoint PPT Presentation
Citation preview
EE150a – Genomic Signal and Information Processing
On DNA Microarrays Technology
October 12, 2004

Recall the information flow in cells
• Replication of DNA
– {A,C,G,T} to {A, C, G,T}
• Transcription of DNA to mRNA
– {A,C,G,T} to {A, C, G,U}
• Translation of mRNA to proteins
– {A,C,G,U} to {20 amino-acids}
• Interrupt the information flow
and measure gene expression
levels!
http://www-stat.stanford.edu/~susan/courses/s166/central.gif
Gene Microarrays• A medium for matching known and unknown sequences of
nucleotides based on hybridization (base-pairing: A-T, C-G)
• Applications
– identification of a sequence (gene or gene mutation)
– determination of expression level (abundance) of genes
– verification of computationally determined genes
• Enables massively parallel gene expression studies
• Two types of molecules take part in the experiments:
– probes, orderly arranged on an array
– targets, the unknown samples to be detected
Microarray Technologies• Oligonucleotide arrays (Affymetrix GeneChips)
– probes are photo-etched on a chip (20-80 nucleotides)
– dye-labeled mRNA is hybridized to the chip
– laser scanning is used to detect gene expression levels (i.e., amount of mRNA)
• cDNA arrays
– complementary DNA (cDNA) sequences “spotted” on arrays (500-1000 nucleotides)
– dye-labeled mRNA is hybridized to the chip (2 types!)
– laser scanning is used to detect gene expression levels
• There are various hybrids of the two technologies above
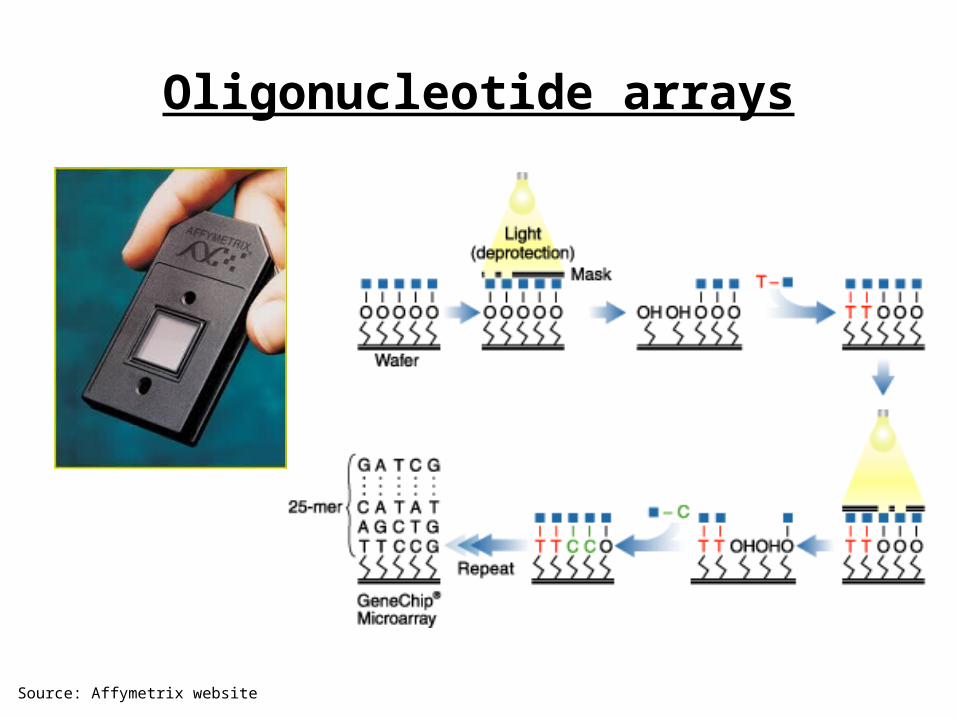
Oligonucleotide arrays
Source: Affymetrix website
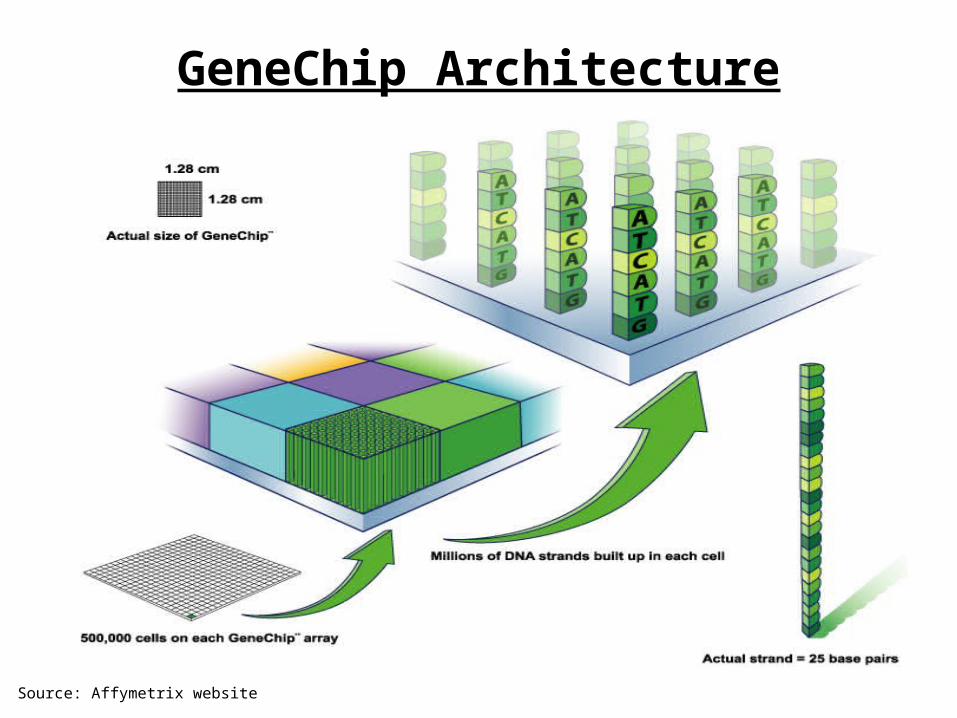
GeneChip Architecture
Source: Affymetrix website
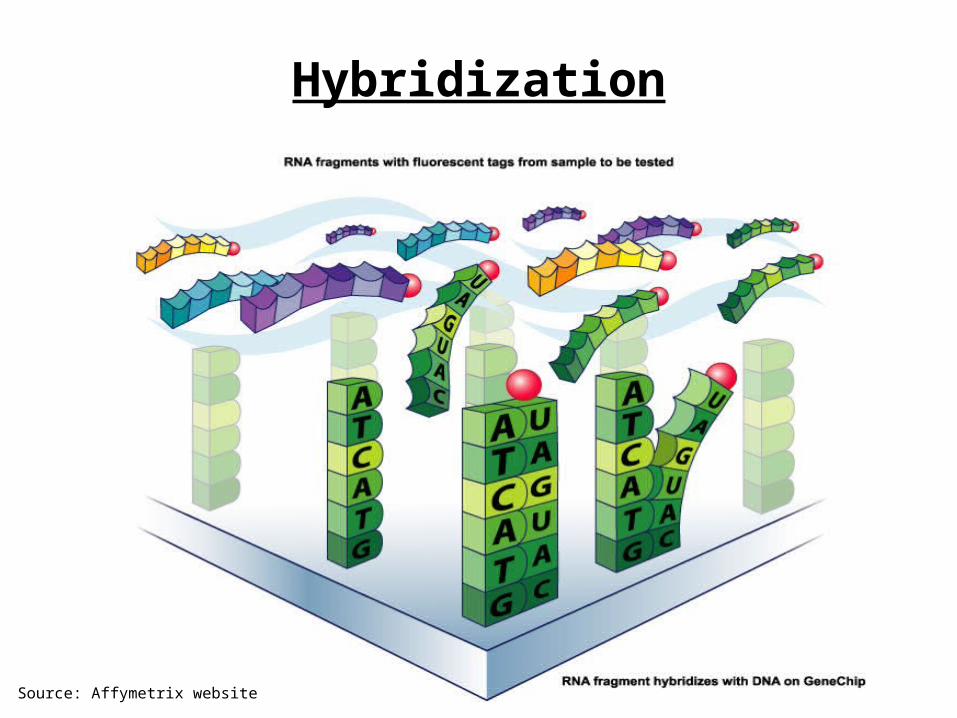
Hybridization
Source: Affymetrix website
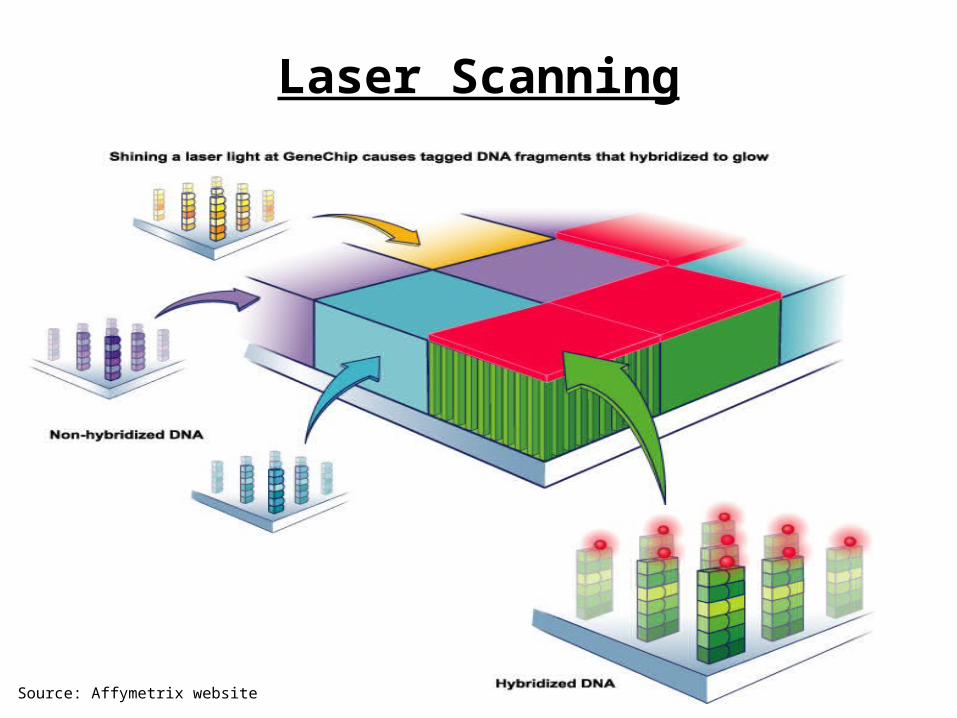
Laser Scanning
Source: Affymetrix website
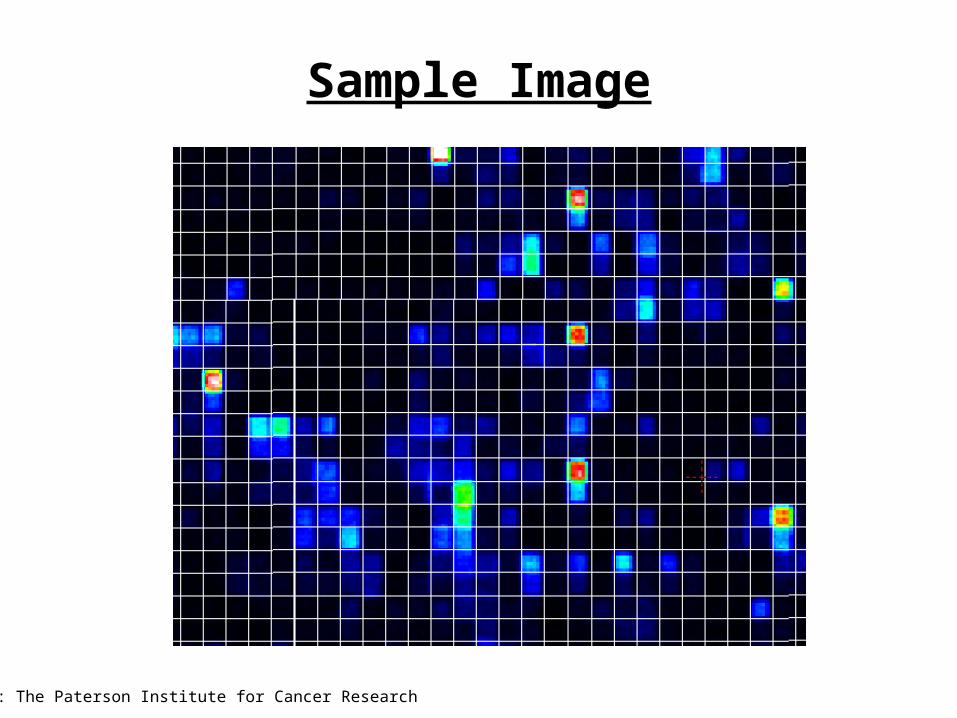
Sample Image
Source: The Paterson Institute for Cancer Research
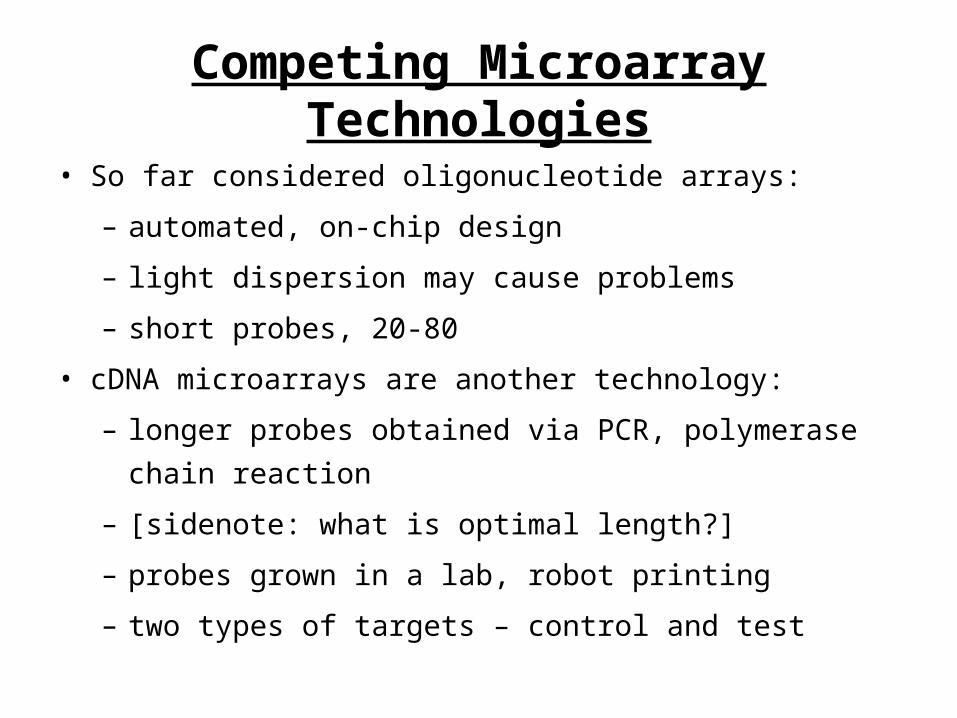
Competing Microarray Technologies
• So far considered oligonucleotide arrays:
– automated, on-chip design
– light dispersion may cause problems
– short probes, 20-80
• cDNA microarrays are another technology:
– longer probes obtained via PCR, polymerase chain reaction
– [sidenote: what is optimal length?]
– probes grown in a lab, robot printing
– two types of targets – control and test
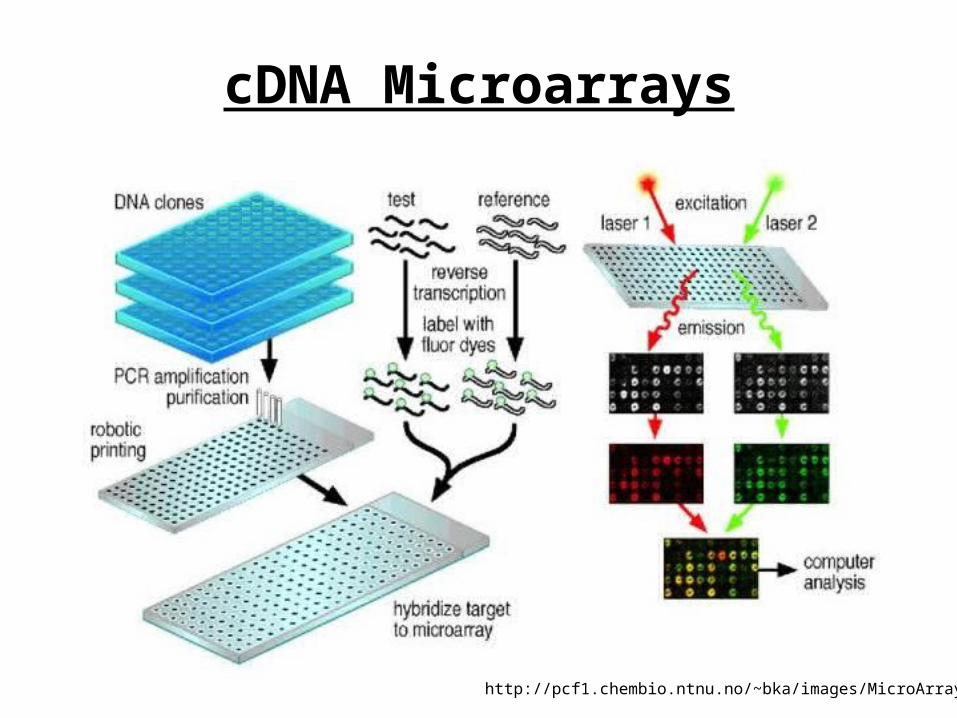
http://pcf1.chembio.ntnu.no/~bka/images/MicroArrays.jpg
cDNA Microarrays
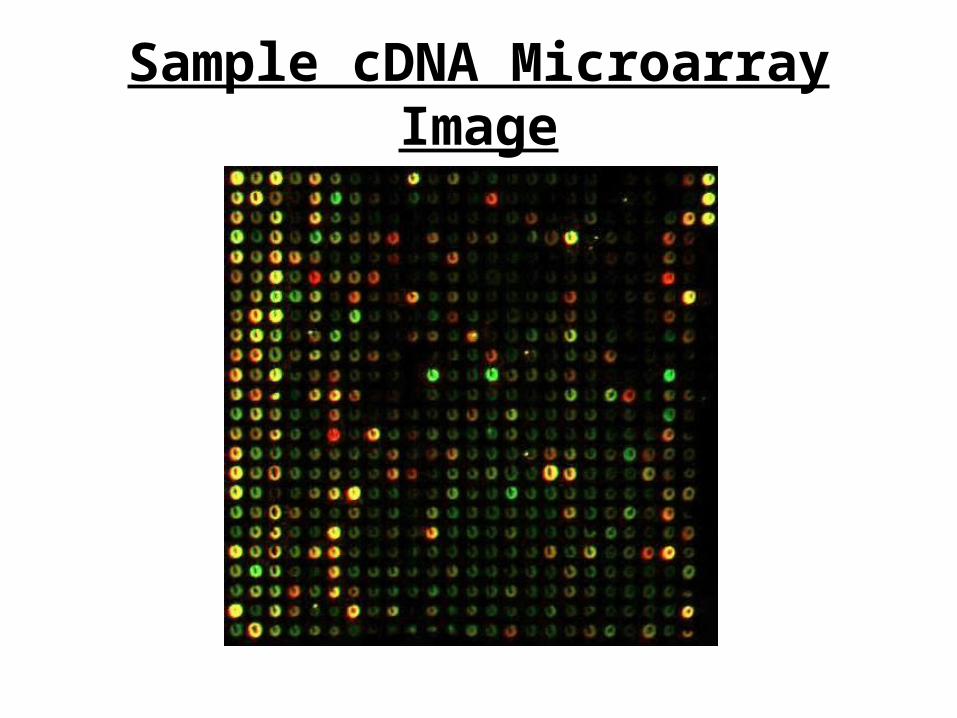
Sample cDNA Microarray Image
Some Design Issues
• Photo-etching based design: unwanted light exposure
– border minimization
– the probes are 20-80 long
• Hybridization: binding of a target to its perfect complement
• However, when a probe differs from a target by a small
number of bases, it still may bind
• This non-specific binding (cross-hybridization) is a source of
measurement noise
• In special cases (e.g., arrays for gene detection), designer has a
lot of control over the landscape of the probes on the array
Dealing with Measurement Noise
• Recent models of microarray noise
– measurements reveal signal-dependent noise (i.e., shot-noise)
as the major component
– additional Gaussian-like noise due to sample preparation,
image scanning, etc.
• Image processing assumes image background noise
– attempts to subtract it
– sets up thresholds
• Lack of models of processes on microarrays
Probabilistic DNA Microarray Model
• Consider an m£m DNA microarray, with m2 unique types of
nucleotide probes
• A total of N molecules of n different types of cDNA targets
with concentrations c1,…,cn,
is applied to the microarray
• Measurement is taken after the system reached chemical
equilibrium
• Our goal: from the scanned image, estimate the concentrations
DNA Microarray Model Cont’d
• Each target may hybridize to only one type of probe
• There are k non-specific bindings
• Model diffusion of unbound molecules by random walk;
distribution of unbound molecules uniform on the array
– justified by reported experimental results
• Assume known probabilities of hybridization and cross-
hybridization
– Theoretically: from melting temperature
– Experimentally: measurements (e.g., from control target
samples)
Markov Chain Model
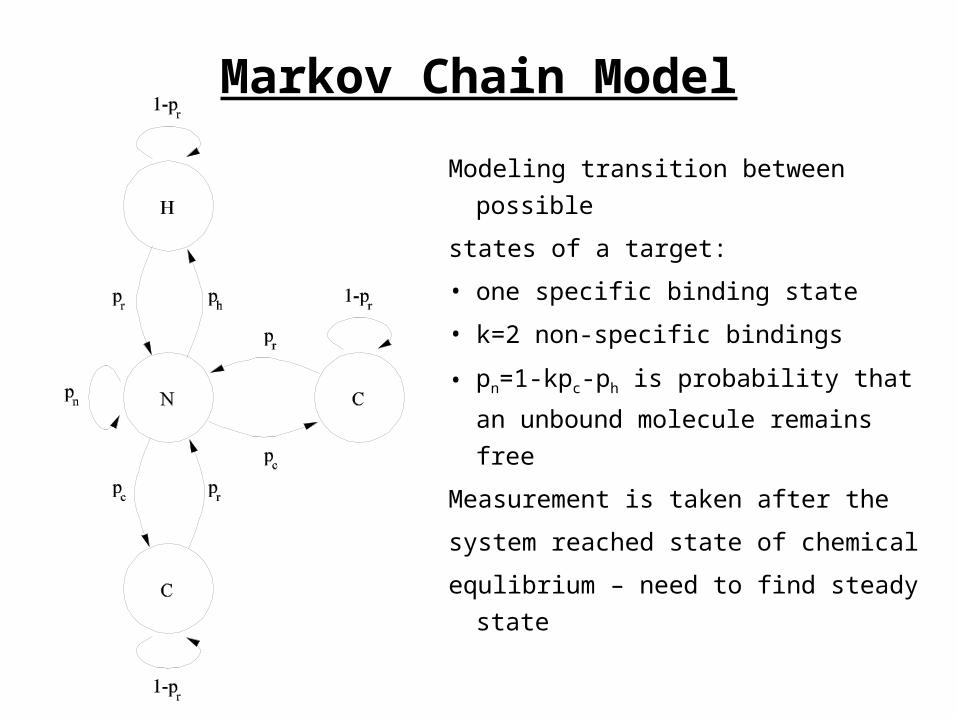
Modeling transition between possible
states of a target:
• one specific binding state
• k=2 non-specific bindings
• pn=1-kpc-ph is probability that an
unbound molecule remains free
Measurement is taken after the
system reached state of chemical
equlibrium – need to find steady state
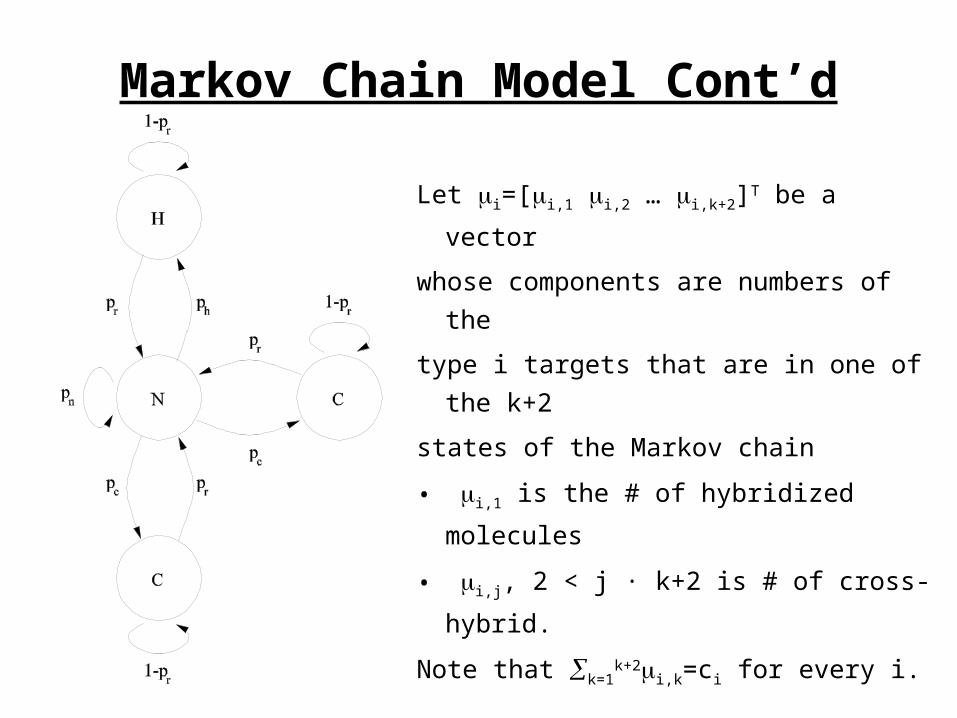
Markov Chain Model Cont’d
Let i=[i,1 i,2 … i,k+2]T be a vector
whose components are numbers of the
type i targets that are in one of the k+2
states of the Markov chain
• i,1 is the # of hybridized molecules
• i,j, 2 < j · k+2 is # of cross-hybrid.
Note that k=1k+2i,k=ci for every i.

Stationary State of the Markov Chain
• In equilibrium, we want to find i such that
where the transition matrix Pi is given by
• Clearly, in the stationary state we have
• Finally, ratio i/ci gives stationary state probabilities
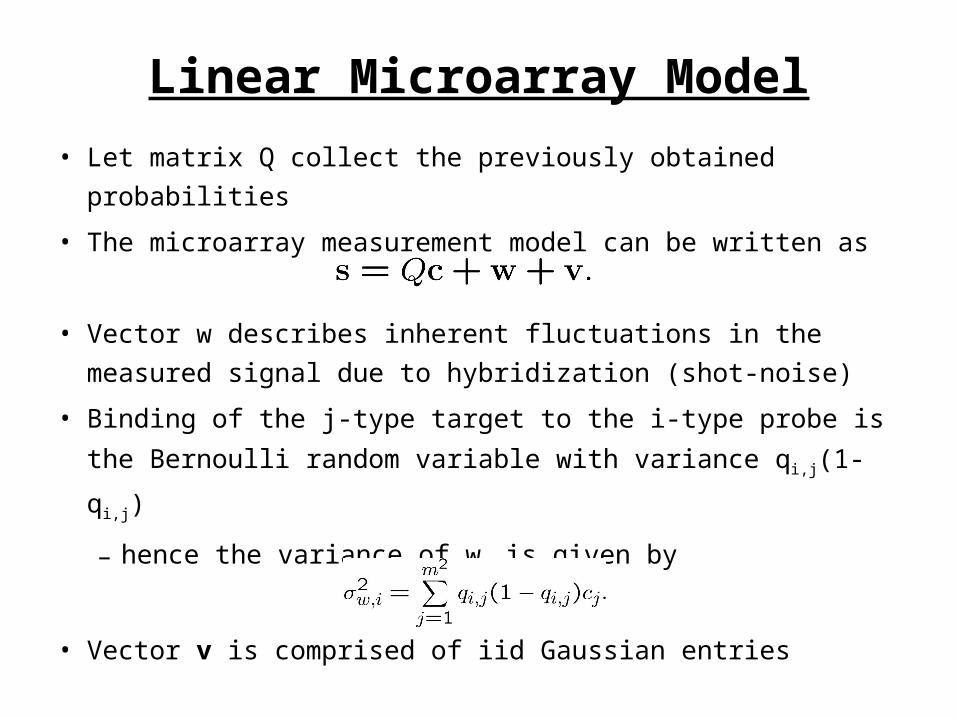
Linear Microarray Model
• Let matrix Q collect the previously obtained probabilities
• The microarray measurement model can be written as
• Vector w describes inherent fluctuations in the measured
signal due to hybridization (shot-noise)
• Binding of the j-type target to the i-type probe is the Bernoulli
random variable with variance qi,j(1-qi,j)
– hence the variance of wi is given by
• Vector v is comprised of iid Gaussian entries
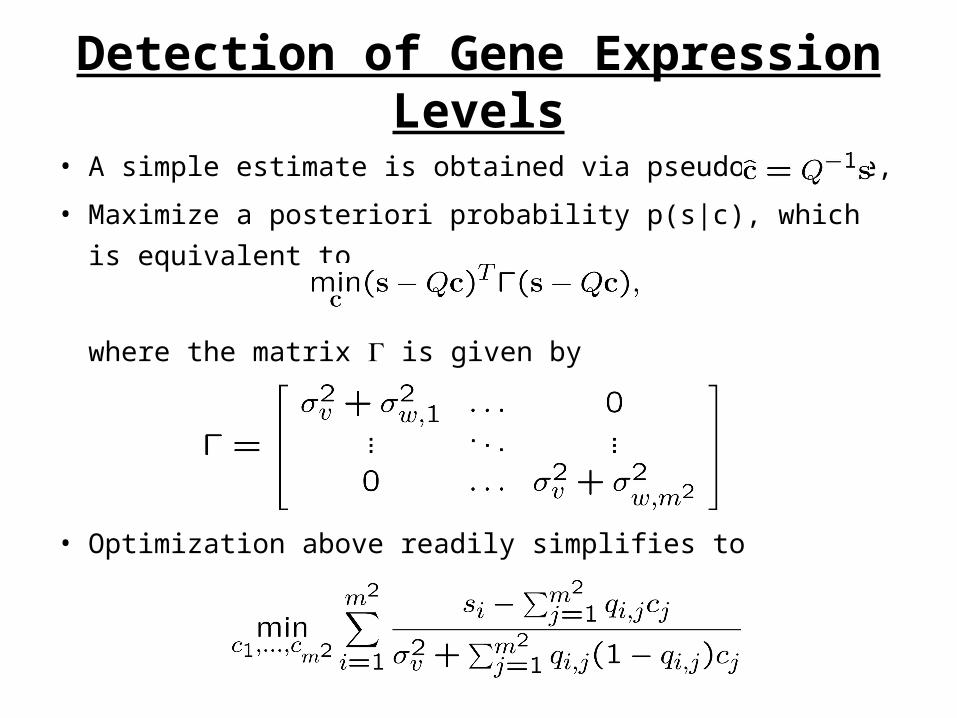
Detection of Gene Expression Levels
• A simple estimate is obtained via pseudo-inverse,
• Maximize a posteriori probability p(s|c), which is equivalent to
where the matrix is given by
• Optimization above readily simplifies to
Simulation Results
• Consider an 8£8 array (m=8)
• Apply n=6 types of targets
• Concentrations: [1e5 2e5 2e5 2e5 1e5 2e5] (N=1e6)
• Assume the following probabilities:
– hybridization – 0.8
– cross-hybridization – 0.1
– release – 0.02
• Let k=3 (number of non-specific bindings)
• Free molecules perform random walk on the array
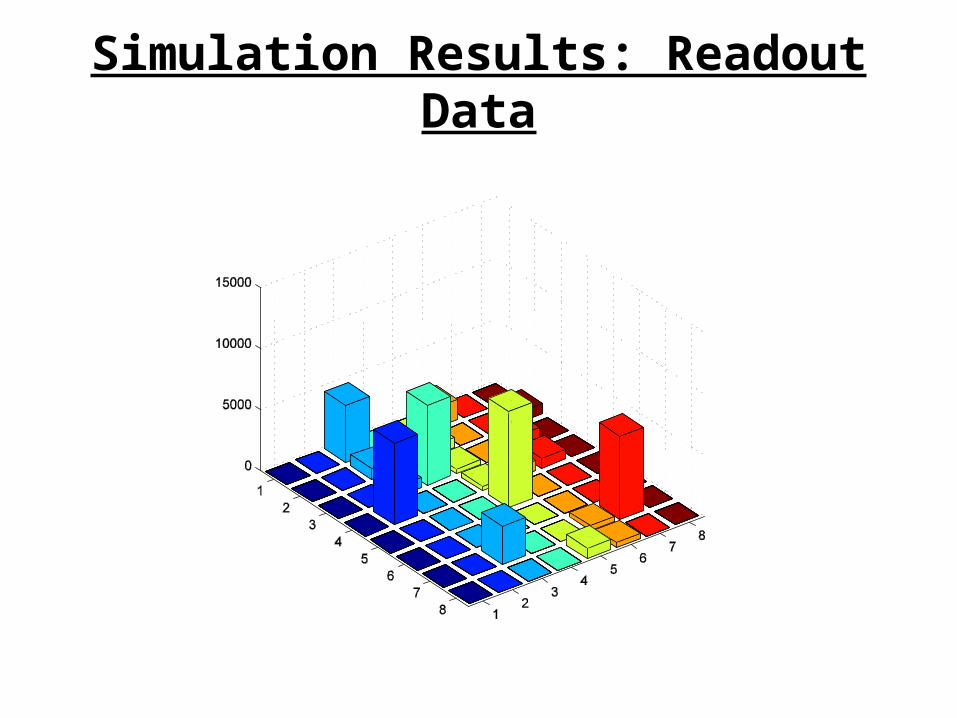
Simulation Results: Readout Data
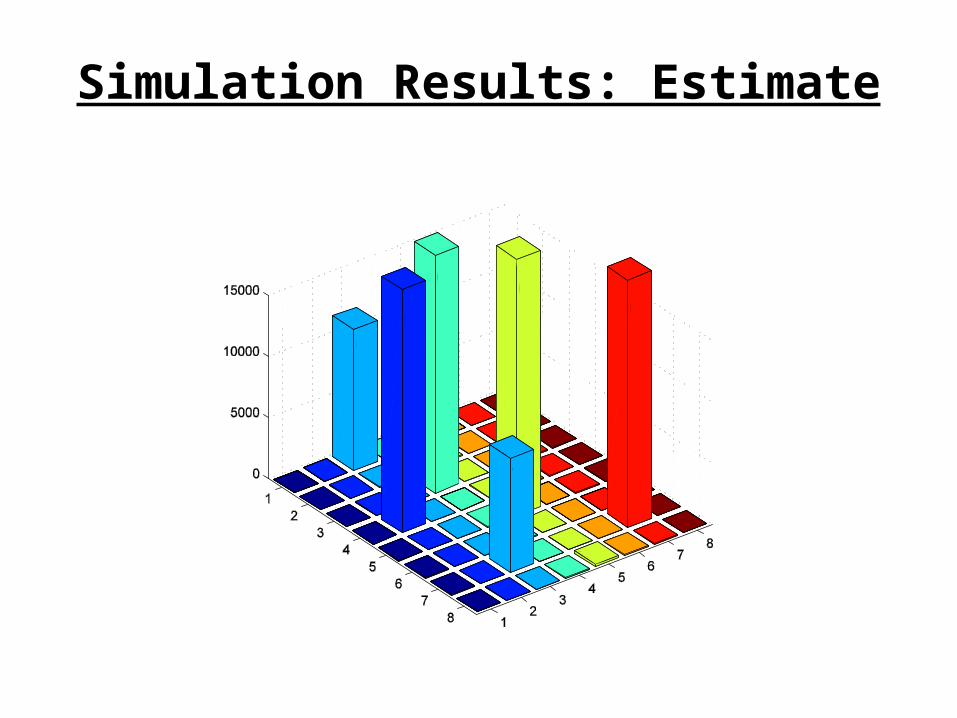
Simulation Results: Estimate
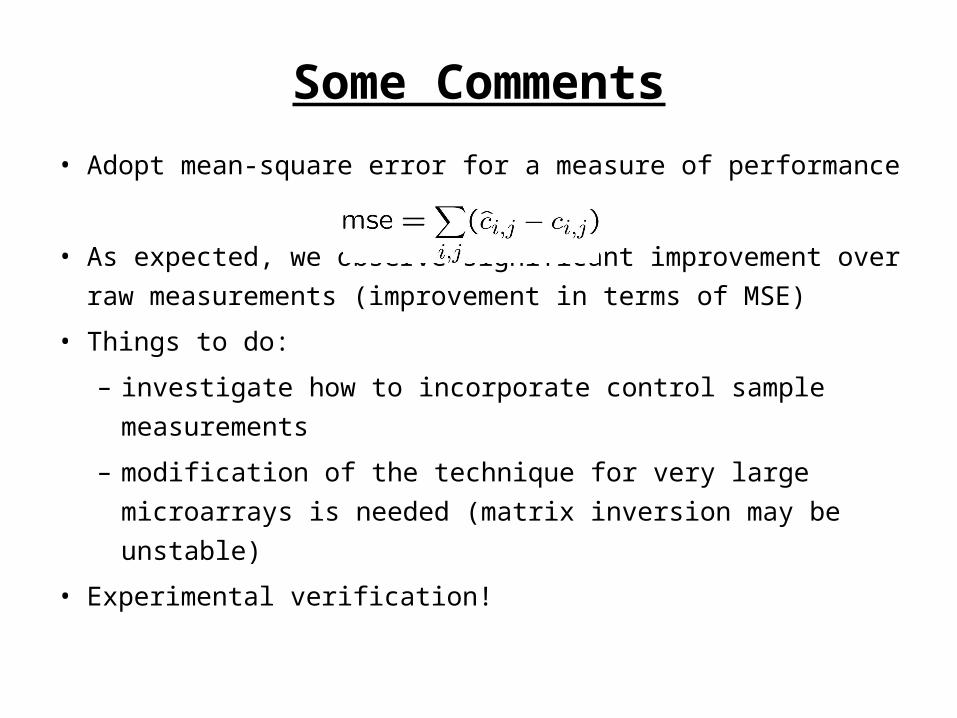
Some Comments
• Adopt mean-square error for a measure of performance
• As expected, we observe significant improvement over raw
measurements (improvement in terms of MSE)
• Things to do:
– investigate how to incorporate control sample
measurements
– modification of the technique for very large microarrays is
needed (matrix inversion may be unstable)
• Experimental verification!
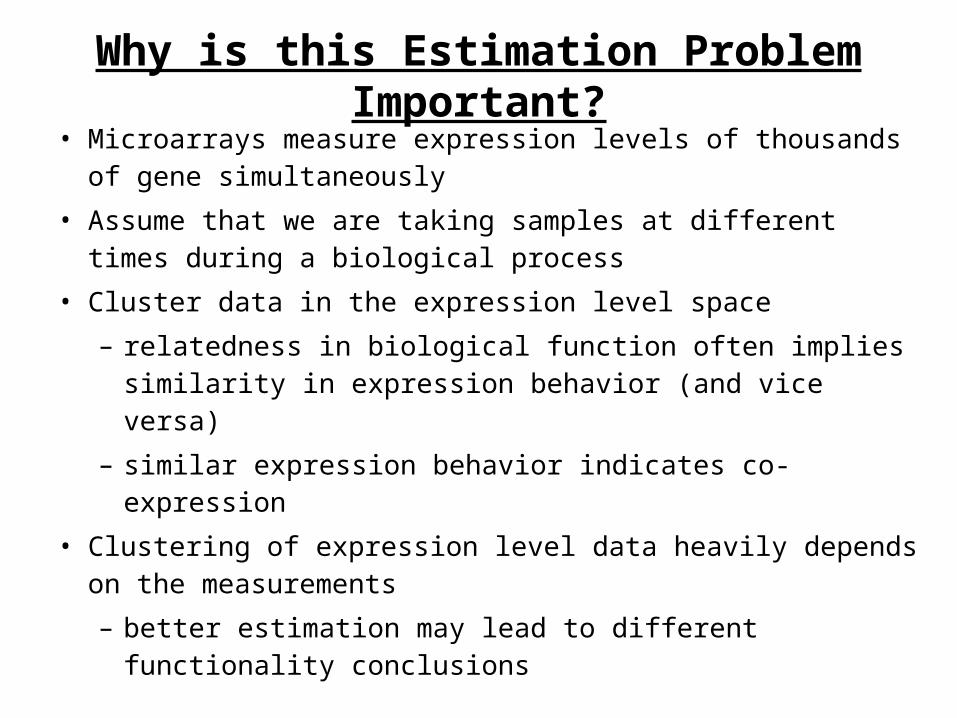
Why is this Estimation Problem Important?
• Microarrays measure expression levels of thousands of gene simultaneously
• Assume that we are taking samples at different times during a biological process
• Cluster data in the expression level space
– relatedness in biological function often implies similarity in expression behavior (and vice versa)
– similar expression behavior indicates co-expression
• Clustering of expression level data heavily depends on the measurements
– better estimation may lead to different functionality conclusions
Summary
• Microarray technologies are becoming of great importance for
medicine and biology
– understanding how the cell functions, effects on organism
– towards diagnostics, personalized medicine
• Plenty of interesting problems
– combinatorial design techniques
– statistical analysis of the data
– signal processing / estimation