Embed Size (px)
Citation preview

FINAL REPORT
205(J) Contract # 5-029-250-2
EEL RIVER WATER QUALITY MONITORING PROJECT
Submitted To: The CALIFORNIA STATE WATER QUALITY CONTROLBOARD
Joanne Cox, Contract Manager
Submitted By: The HUMBOLDT COUNTY RESOURCE CONSERVATION DISTRICT
Gary L. Friedrichsen, Project Director
May 15, 1998
Humboldt County Resource Conservation DistrictP.O. Box 397 Fields Landing, Ca. 95537
(707) 444-9708 FAX (707) 269-2630working with
USDA Natural Resources Conservation Service
EEL RVER WATER QUALITY MONITORING PROJECT (1996-97)HUMBOLDT COUNTY RESOURCE CONSERVATION DISTRICTSTATE WATER RESOURCES CONTROL BOARD, 205 (J)CONTRACT #5-029-250-2 PG. 2
Draft Final ReportEel River Water Quality Monitoring Project
Table of Contents:
Table of Contents----------------------------------------------------------------- 2Abstract----------------------------------------------------------------------------- 3Summary of Tasks CompletedTask 1: Project Management and Administration
Sub-task 1.1 Administration---------------------------------------------- 4Sub-task 1.2 Quarterly progress reports-------------------------------- 4Sub-task 1.3 Sub-contract administration------------------------------ 4
Task 2: Public participationSub-task 2.1 Technical Advisory Committee-------------------------- 5Sub-task 2.2 Public meetings--------------------------------------------- 7
Task 3: Data Quality and SubmissionSub-task 3.1 Quality Assurance Plan------------------------------------ 8Sub-task 3.2 Data submission--------------------------------------------- 8
Task 4: Water Quality AssessmentSub-task 4.1 Site selection------------------------------------------------- 9Sub-task 4.2 Water temperature monitoring--------------------------- 9Sub-task 4.3 Aquatic invertebrate monitoring------------------------- 28Sub-task 4.4 Education portion------------------------------------------- 41
Task 5: Restoration Recommendations----------------------------------------- 42MWAT Tables for sections of the mainstem and sub-basins--------- 45Sedimentation and temperature--------------------------------------------- 59Priority ranking scheme------------------------------------------------------ 60Anticipated preventative and corrective activities---------------------- 61Future assessment and monitoring----------------------------------------- 62
Task 6: Implementation, Institutional, and Financial PlanSub-task 6.1 Implementation Plan---------------------------------------- 63Sub-task 6.2 Implementation Checklist--------------------------------- 66
Bibliography------------------------------------------------------------------------ 67List of Appendices (no pagination):
A. Quality Assurance Plan with protocolsB. Macro-invertebrate bio-assessmentC. Temperature site locations (Latitude and Longitude) and file names for raw (hd) and cleaned text (ht) downloads (1996-97).D. Sample data from EVRB, Dobbyns Creek, NF.E. Sample field data form.F. Agenda for April, 1996 workshop with Eel River teachers.
EEL RVER WATER QUALITY MONITORING PROJECT (1996-97)HUMBOLDT COUNTY RESOURCE CONSERVATION DISTRICTSTATE WATER RESOURCES CONTROL BOARD, 205 (J)CONTRACT #5-029-250-2 PG. 3
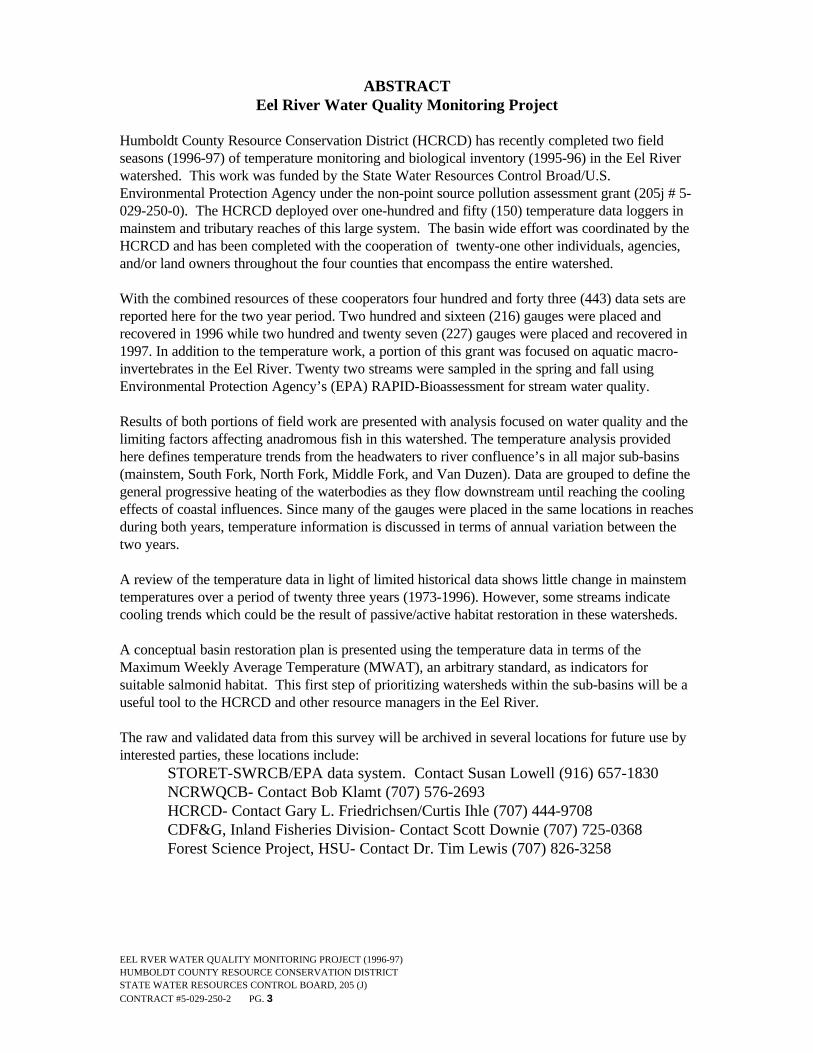
ABSTRACTEel River Water Quality Monitoring Project
Humboldt County Resource Conservation District (HCRCD) has recently completed two fieldseasons (1996-97) of temperature monitoring and biological inventory (1995-96) in the Eel Riverwatershed. This work was funded by the State Water Resources Control Broad/U.S.Environmental Protection Agency under the non-point source pollution assessment grant (205j # 5-029-250-0). The HCRCD deployed over one-hundred and fifty (150) temperature data loggers inmainstem and tributary reaches of this large system. The basin wide effort was coordinated by theHCRCD and has been completed with the cooperation of twenty-one other individuals, agencies,and/or land owners throughout the four counties that encompass the entire watershed.
With the combined resources of these cooperators four hundred and forty three (443) data sets arereported here for the two year period. Two hundred and sixteen (216) gauges were placed andrecovered in 1996 while two hundred and twenty seven (227) gauges were placed and recovered in1997. In addition to the temperature work, a portion of this grant was focused on aquatic macro-invertebrates in the Eel River. Twenty two streams were sampled in the spring and fall usingEnvironmental Protection Agency’s (EPA) RAPID-Bioassessment for stream water quality.
Results of both portions of field work are presented with analysis focused on water quality and thelimiting factors affecting anadromous fish in this watershed. The temperature analysis providedhere defines temperature trends from the headwaters to river confluence’s in all major sub-basins(mainstem, South Fork, North Fork, Middle Fork, and Van Duzen). Data are grouped to define thegeneral progressive heating of the waterbodies as they flow downstream until reaching the coolingeffects of coastal influences. Since many of the gauges were placed in the same locations in reachesduring both years, temperature information is discussed in terms of annual variation between thetwo years.
A review of the temperature data in light of limited historical data shows little change in mainstemtemperatures over a period of twenty three years (1973-1996). However, some streams indicatecooling trends which could be the result of passive/active habitat restoration in these watersheds.
A conceptual basin restoration plan is presented using the temperature data in terms of theMaximum Weekly Average Temperature (MWAT), an arbitrary standard, as indicators forsuitable salmonid habitat. This first step of prioritizing watersheds within the sub-basins will be auseful tool to the HCRCD and other resource managers in the Eel River.
The raw and validated data from this survey will be archived in several locations for future use byinterested parties, these locations include:
STORET-SWRCB/EPA data system. Contact Susan Lowell (916) 657-1830NCRWQCB- Contact Bob Klamt (707) 576-2693HCRCD- Contact Gary L. Friedrichsen/Curtis Ihle (707) 444-9708CDF&G, Inland Fisheries Division- Contact Scott Downie (707) 725-0368Forest Science Project, HSU- Contact Dr. Tim Lewis (707) 826-3258
EEL RVER WATER QUALITY MONITORING PROJECT (1996-97)HUMBOLDT COUNTY RESOURCE CONSERVATION DISTRICTSTATE WATER RESOURCES CONTROL BOARD, 205 (J)CONTRACT #5-029-250-2 PG. 4
SUMMARY OF COMPLETED TASKS FOR EEL RIVER BASINWATER QUALITY PROJECT
HUMBOLDT COUNTY RESOURCE CONSERVATION DISTRICT (HCRCD)
Task 1: Project Management and Administration
Sub-task 1.1 Administration
With the receipt of this Final Report the HCRCD has completed all administrationrequirements as set forth in the contract. All quarterly reporting, billing, sub-contractor coordination has been carried out within contract deadlines and budget.Sub-contractor work (see Sub-task 1.3) has been monitored, reviewed, and found tobe satisfactory with sub-contracts that detailed this effort. For technical oversight, theHCRCD relied on Natural Resource Conservation Service (NRCS) staff, the QualityControl Officer James Komar, NRCS and his replacement, Jim Hoplain of theCalifornia Department of Fish and Game (CDF&G).
Sub-task 1.2 Quarterly Progress Reports
In all, a total of ten1 progress reports were submitted during the course of this study(July 1, 1995- April 30, 1998). These quarterly progress reports detailed sub-contractor activities and project accomplishments on a task by task basis. Thisinformation is resubmitted here in summary form.
Sub-task 1.3 Sub-contract Administration
HCRCD procurement policies were adhered to throughout the project period. Allsub-contractors were solicited in an open competitive manner consistent with County,State, and Federal procurement regulations including CFR 40 Part 31: Procurement.
One sub-contract was let to Mr. Gary L. Friedrichsen. He, in turn, contracted withthree other sub-contractors to assist him in the fulfillment of contractualresponsibilities. These individuals were; Diane Higgins, a local curriculum consultant,Darrell Martin, a computer programmer, and John Lee, a professional aquaticentomologist. They assisted Mr. Friedrichsen with field work, classroom activities,construction of a data analysis program, and report writing. (See Tasks 4.2, 4.3, and7.1). Sub-contract Administration of this grant will conclude with the final payment ofthe 10% retention funds held by the SWRCB.
1 This project was extended beyond the original deadline of December 31, 1996 in order to accomplish two complete temperature fieldseasons. This was deemed necessary in that State funds had been held up due to budgetary complications and 1995 data would not be ableto capture the rise in temperatures from early spring nor the low flow maximum that was of most interest to all cooperators.

EEL RVER WATER QUALITY MONITORING PROJECT (1996-97)HUMBOLDT COUNTY RESOURCE CONSERVATION DISTRICTSTATE WATER RESOURCES CONTROL BOARD, 205 (J)CONTRACT #5-029-250-2 PG. 5
Task 2. Public Participation
Sub-Task 2.1 Technical Advisory Committee
One of the most successful aspects of this large undertaking has been the support andinvolvement of the technical advisory committee (TAC). This group of individualscooperated on a tremendous undertaking and set the stage for continued work on thisbasin-wide effort.
COOPERATORS/TAC MEMBERS:
Janet Blake and Joanne Cox Scott Downie, Ruth Goodfield, Jen TerwilligerSWQCB, Div. of Water Quality CDF&G, Inland Fisheries Div.901 P St. Sacramento, Ca. 95814 610 9th St. Fortuna, Ca. 95540(916)657-0659 (707) 725-0368
Bill Winchester Jim HoplainNCRWQCB CDF&G, Inland Fisheries Div.5550 Skylane Blvd. P.O. Box 944209Santa Rosa, Ca. 95403 Sacramento, Ca. 94244(707) 576-2682 (916) 653-7584
Tim Lewis/ Krieter/ Conroy/Butcher Patrick HigginsForest Science Project Fisheries ConsultantHumboldt State University 791 8th St. Suite NArcata, Ca. 95521 Arcata, Ca. 95521(707) 826-8299 (707) 822-9428
Tom Schott David FullerNRCS, Mendocino RCD BLM405 Orchard Ave. 1695 Heindon Rd.Ukiah, Ca. 95482 Arcata, Ca. 95521(707) 468-9223 (707) 825-2315
Ron Jones, Ranger Chris HeppeHum. St. Redwoods Park EPAP.O. Box 100 1695 Heindon Rd.Weott, Ca. 95571 Arcata, Ca. 95521(707) 964-2409 (707) 825-2311
Brett Harvey, Fish Biol. Lisa Mizuno, BiologistRedwood Sc. Lab. USFS USFS, Mad River Ranger Dist.1700 Bayview Rd. P.O. Box 300Arcata, Ca. 95521 Bridgeville, Ca. 95526(707) 825-2926 (707) 574-6233
EEL RVER WATER QUALITY MONITORING PROJECT (1996-97)HUMBOLDT COUNTY RESOURCE CONSERVATION DISTRICTSTATE WATER RESOURCES CONTROL BOARD, 205 (J)CONTRACT #5-029-250-2 PG. 6
Brooks Smith, Dist. Ranger Gene RayMendocino Nat. Forest Round Valley TribeCovelo, Ca. RD 95428 P.O. Box 862, Covelo, Ca. 95428(707) 983-6118 (707) 983-8341
Dennis Slota Doug McLelland, Res. CoordMendo. Water Agency Parnum PavingCourt House Bldg. P.O. Box 807Ukiah, Ca. 95482 Ukiah, Ca. 95482(707) 463-4589 (707) 485-7626
Henry Alden/Greg Moody Tom Daugherty/Malcolm PiousPacific Lumber Co. Louisiana Pacific Co.P.O Box 37 P.O. Box 340Scotia, Ca. 95565 Calpella Ca. 95418(707) 764-4408 (707) 485-8731
John Ambrose/David Hines Weldon Jones/Scott HarrisGeorgia Pacific Co. CDF&G, Inland Fisheries Div.90 W. Redwood Ave. 26A Monroe St.Fort Bragg, Ca. 95437 Willits, Ca. 95490(707) 961-3147 (707) 459-2238
Dennis Halligan Steve HornerNat. Res. Mgt., Inc. Barnum Timber1334 3rd St. 1610 Highland Ave.Eureka Ca. 95501 Eureka Ca. 95501(707) 442-1735 (707) 498-4230
Evan Engber Thomas DunklinBio-engineering Associates Humboldt State UniversityP.O. Box 1355 1215 UnionLaytonville, Ca. 95454 Arcata, Ca. 95521(707) 984-8333 (707) 822-2172
Jim Craig Jessie NoellUSF&W, Arcata Salmon Forever1125 16th St. P.O. Box 3014Arcata, Ca. 95521 McKinleyville, Ca. 95519(707) 822-7201 (707) 839-7444
PARTICIPATING SCHOOLS
Ferndale High Fortuna High Bridgeville SchoolDavid Sopjes Pam Halstead John Blakely3703 Grizzly Bluff Rd. 1515 McFarland 2526 May St.Ferndale Ca. 95536 Eureka, Ca. 95501 Fortuna, Ca. 95540(707) 786-9749 (707) 445-2465 (707) 725-2929
EEL RVER WATER QUALITY MONITORING PROJECT (1996-97)HUMBOLDT COUNTY RESOURCE CONSERVATION DISTRICTSTATE WATER RESOURCES CONTROL BOARD, 205 (J)CONTRACT #5-029-250-2 PG. 7
Hoaglin-Zenia School Osprey Alternative South Fork HighRobin Dreschler Edward Cotter Jenny RevotskieStar Rt. 1 Box 54 P.O. Box 1494 6831 Ave. of the GiantsZenia, Ca. 95595 Redway, Ca. 95560 Miranda, Ca. 95553(707) 923-9670 (707) 923-3035 (707) 943-3144
Laytonville High Leggett High Leggett MiddleBruce Potter Collin Miller Luann TalbotP.O. Box 325 P.O. Box 186 P.O. Box 186Laytonville, Ca. 95454 Leggett, Ca. 95585 Leggett, Ca. 95585(707) 459-3528 (707) 468-8220 (707) 468-8220
Round Valley High Round Valley Elem. CuddybackRick Martinez Nancy Scholl Thomas McMahonP.O. Box 421 P.O. Box 421 P.O. Box 7Covelo, Ca. 95428 Covelo, Ca. 95428 Carlotta, Ca. 95528(707) 983-6655 (707) 983-6568 707) 768-3372
Willits High Willits Elem.Don McCallister Joe BenoitP.O. Box 775 67 Northbrook WayWillits, Ca. 95490 Willits, Ca. 95490(707) 459-2583 (707) 459-6758
The TAC met prior to each field season to discuss and agree upon placementprotocols, quality assurance guidelines, field data forms, stream identification forgauge placement, and data management. In addition, contact was maintained withmost TAC members throughout the course of the program. This helped to remedysome of the confusion that is unavoidable in under- takings of this nature.
Teachers from 85% of our cooperating schools attended a weekend workshop in thespring of 1996. This event provided the opportunity for sub-contractors and teachersto discuss the project materials, goals, schedule classroom opportunities, and set inmotion the networking between schools that continues at this time.
Sub-task 2.2 Public Meetings
The HCRCD holds monthly noticed meetings open to the public. This project hasbeen listed on most agendas since contract inception. Public comment wasconsistently solicited at these meetings. All schools participating in this program areState/County funded public schools. Parent volunteers and other interestedlandowners were welcome to join the classes during field work (aquatic invertebratemonitoring and temperature probe placement/retrieval).

EEL RVER WATER QUALITY MONITORING PROJECT (1996-97)HUMBOLDT COUNTY RESOURCE CONSERVATION DISTRICTSTATE WATER RESOURCES CONTROL BOARD, 205 (J)CONTRACT #5-029-250-2 PG. 8
Task 3. Data Quality and Submission
Sub-task 3.1 Quality Assurance Plan
The Quality Assurance Plan was approved and in place throughout the course of thiscontract with James Komar or Jim Hoplain as the Quality Assurance Officers.This Plan details:
(1) Project Description and Purpose(2) Problem/Background(3) Project Organization and Responsibilities(4) Quality Assurance (QA) Objectives(5) Sampling Procedures(6) Calibration of Instruments, Procedures and Frequencies(7) Retrieval and Storage of Data(8) Analytical Procedures(9) Destination and Use of Data(10) Quality Control(11) Assessment and Response Actions(12) QA Reporting
Sub-task product: Quality Assurance Plan, July 6, 1995 revised April 19, 1996(See Appendix A). Review of QA/QC tests will be submitted in the Final Report.
EPA RAPID Bioassessment Protocol: This method of bioassessment (Plafkin et al.1989) uses aquatic organisms to evaluate the relative condition of an aquatic habitat.It is based on samples of benthic macroinvertebrates that possess the followingattributes: 1) They are the most common animal in the habitat. 2) They are relativelyimmobile as immatures. 3) They have long life cycles so that temporal perturbationsshould be detectable. 4) Taxonomic keys for generic level determinations are availablefor all but a few difficult families. 5) The large number of taxa found offer a widerange of responses to disturbance. A multi-metric approach is employed where themetric values based on benthic macroinvertebrate assemblage in a benthic sample arecalculated and compared to assess habitat. (See Task 4.3 this report and AppendixB).
Sub-task 3.2 Data Submission
All temperature data collected during the past two field seasons have been forwardedto the Storage and Retrieval (STORET) Data Control Unit with copies to the ContractManager and North Coast Regional Water Quality Control Board (NCRWQCB)Senior Land and Water Use Analyst. In addition to the raw data, the NCRWQCBstaff will receive the complete analysis of temperature information which includes acumulative distribution curve, maximum, minimum, and average temperature profilesof all stream placements. Included in the task product is a Graphic InformationSystem (GIS) map showing site placement throughout the Eel River basin. This mapwill be hard copied and available on electronic file. The placements, indicated by acolored symbol, represent temperature ranges of the rolling seven day maximum
EEL RVER WATER QUALITY MONITORING PROJECT (1996-97)HUMBOLDT COUNTY RESOURCE CONSERVATION DISTRICTSTATE WATER RESOURCES CONTROL BOARD, 205 (J)CONTRACT #5-029-250-2 PG. 9
weekly average temperature (MWAT), the highest average temperature recordedduring that week.
During the course of the monitoring twelve data loggers were lost or stolen. Inaddition to these twelve, several sets of data from other cooperators have beendiscarded as being too incomplete or questionably accurate. Air temperatures takenduring these two years will be available but are not reported here as placementprotocols are just being defined.
The report for the aquatic invertebrate RAPID Bioassessment has been submitted tothe Contract Manager and is included here as Appendix B.
Task Products: QAP and STORET Data Submission

EEL RVER WATER QUALITY MONITORING PROJECT (1996-97)HUMBOLDT COUNTY RESOURCE CONSERVATION DISTRICTSTATE WATER RESOURCES CONTROL BOARD, 205 (J)CONTRACT #5-029-250-2 PG. 10
Task 4. Water Quality Assessment
Sub-task 4.1 Site Selection
Initial site selection took place in summer 1995. Twenty-two streams were selectedfor aquatic invertebrate monitoring by CDF&G. This list was then discussed andagreed upon by the TAC at their first meeting. The streams selected and monitored arereviewed in Sub-task 4.3 below.
Temperature monitoring sites were originally suggested by representatives fromCDF&G (Scott Downie and Weldon Jones). This list of sites was derived fromknowledge of historic anadromous fish presence and/or the site’s representationalquality for the sub-basin. This list formed the basis for discussion at the January 1996TAC meeting where additional tributaries and main stem locations were added bycooperators. At the May 1997 TAC meeting stream sites were again discussed. Somesites were deleted due to low summer flows that de-watered and others were added asindustry and research personnel refocused their survey plans.
In all, 443 (216 in 1996 and 227 in 1997) deployments are reported below. Thecombined list for 1996 and 1997 placements is found in Appendix C. This spreadsheet identifies site number used by Forest Science Project (FSP) 2, STORET stationID, MWAT, stream name (by basin) , two letter code used in file name for Eel RiverVersion Bio-index (EVB), Eel River basin, Calwater number, text file name, elevationof site, field technician (Surveyor), Latitude and Longitude, device ID number andUSGS quad where site is located.
Sub-task 4.2 Water Temperature Monitoring
For this project, 175 Hobo-Temp.™ temperature gauges were purchased from theOnset Corporation. These gauges were obtained through the cooperation of theEureka County Schools Purchasing Department. Since the HCRCD was working withstudents in Humboldt, Mendocino, and Trinity Counties for much of the temperaturecollection, Onset agreed to sell the data loggers at a substantial discount (50%). Thisenabled a much broader distribution of gauges in this large basin.
In addition to the HCRCD hardware (Hobo-Temps w/ submersible cases), severalcooperators joined in this study and provided the HCRCD with the results of theirindividual efforts. Additional temperature data were received from the followingsources3 :
Pacific Lumber Company- SCOPAC, Scotia, CA.Georgia-Pacific Corp., Fort Bragg, CA.Louisiana-Pacific Corp., Big Lagoon, CA.
2 Use of FSP site numbers does not infer their acceptance of the subjective terminology used to denote stream temperature (i.e. very cold,cold, moderate, etc. used in Task 5.3 See Appendix C for the sites covered by these cooperators. It should be noted that some of the data derived from the above sources didnot receive the Quality Assurance/Quality Control (QA/QC) process required of the HCRCD probes. However, all cooperators did performtheir own QA/QC on their data loggers and all cooperators used similar devices made by Onset Corporation. This information should beviewed as opportunistic in that it vastly improves the baseline information available for the Eel River.

EEL RVER WATER QUALITY MONITORING PROJECT (1996-97)HUMBOLDT COUNTY RESOURCE CONSERVATION DISTRICTSTATE WATER RESOURCES CONTROL BOARD, 205 (J)CONTRACT #5-029-250-2 PG. 11
Barnum Timber, Arcata, CA.Parnum Paving Corp., Ukiah, CA.Natural Resource Management Corp., Eureka, CA.Mendocino Water Agency, Ukiah, CA.USFS-Six Rivers National Forest, Mad River Ranger District, Mad River, CA.USFS-Mendocino National Forest, Covelo Ranger District, Covelo, CA.USFS-Mendocino National Forest, Upper Lake District, Upper Lake, CA.USFS-Redwood Sciences Laboratory, Arcata, CA.Humboldt State University, Masters work, Arcata, CA.California Department of Fish and Game, Inland Fisheries Div., Fortuna, CA.California Department of Fish and Game, Inland Fisheries Div., Yountville, CA.Salmon Forever, McKinleyville, CA.
A map showing site placement in the Eel River Basin has been constructed by Joe Krieterof the Forest Science Project (FSP). These data are available electronically for ArcInfo™
and ArcView software users, displays both 1996 and 1997 station placements. Sites arereferenced with Forest Science Project Id codes. These codes are then cross referenced toHCRCD filing codes (e.g. FSP# 1533 = HTDC1433.961= Dutch Charlie Creek, SouthFork Eel River at an elevation of 1433 feet in 1996). (See Task 5 below for moreinformation).
Task Product: All usable data recorded during this study will be available in the followinglocations:
STORET-SWRCB/EPA data system. Contact Susan Lowell (916) 657-1830NCRWQCB- Contact Bob Klamt (707) 576-2693HCRCD- Contact Gary L. Friedrichsen (707) 444-9708CDF&G, Inland Fisheries Division- Contact Scott Downie (707) 725-0368Forest Science Project, HSU- Contact Dr. Tim Lewis (707) 826-3258
Data, both raw and verified/validated, have been archived and maintained at the HCRCDin Microsoft Excel 6.0. Data analysis has been completed and includes minimum-maximum-mean, cumulative distribution of temperatures with regard to time, andassociation of selected reference stream temperatures in relation to some historical datafor the same streams (see below). Sample copies of each form of analysis is provided (seeAppendix D) however, the bulk of information available should be referencedelectronically.
EEL RVER WATER QUALITY MONITORING PROJECT (1996-97)HUMBOLDT COUNTY RESOURCE CONSERVATION DISTRICTSTATE WATER RESOURCES CONTROL BOARD, 205 (J)CONTRACT #5-029-250-2 PG. 12
Background:
The Eel River is the largest basin draining the coastal mountains of northern California. Thiswatershed with a total of 3,684 square miles has four major sub-basins that include the South ForkEel (689 sq.mi.), the North Fork Eel (283 sq.mi.), the Middle Fork Eel (753 sq.mi.), and the VanDuzen River (428 sq.mi.). The Eel River ranges in elevation from 7,581 feet on Solomon Peak inTrinity County to sea level at the mouth near Ferndale in Humboldt County. The River isapproximately 120 miles in length along the main channel (Trush 1992).
“The Eel River typically flows big and small, all in the same year. It’s Mediterranean climate andpoor aquifer (except in isolated alluvial valleys) produce high runoff in the winter and greatlyreduced runoff otherwise. At Scotia, the minimum daily flow was 10 cubic feet per second (cfs) inAugust, 1924; maximum discharge was 752,000 cfs on December 23, 1964.”(ibid.). “Over half ofthe mainstem and major tributary channels can be considered thermally lethal during some portionof the summer. This was probably true before significant human impact, yet huge salmonpopulations flourished.” (ibid.).
Interpretation of Temperature Findings From This Study:
This 205(j) study’s goal was to determine the temperature regime of the Eel River, including manyof its tributaries, and to compare results of temperature findings from the 1973 study by Kubicek(1977). The earlier study deployed 30 automated temperature sensing devices throughout the EelRiver basin and also included numerous temperature assessments using hand held thermometers.Methods of site selection(see Sub-task 4.1) and protocols (Appendix A, Sec. 5.0) for probeplacement are described elsewhere in this report.
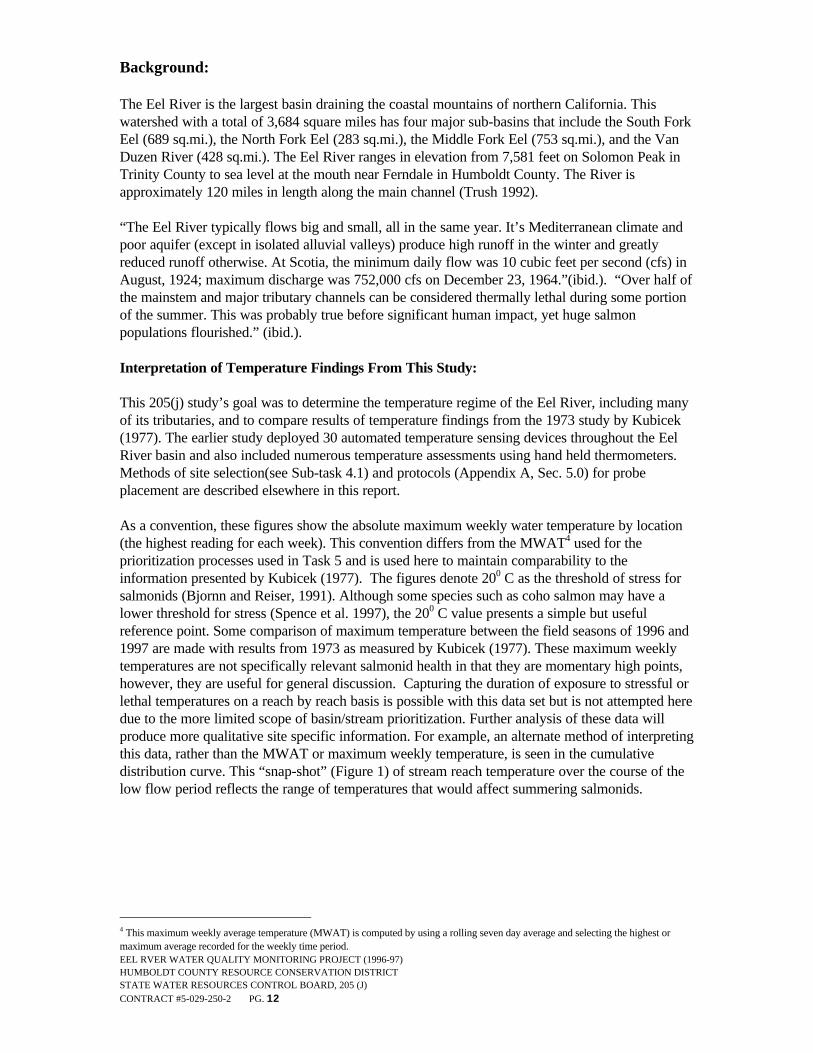
As a convention, these figures show the absolute maximum weekly water temperature by location(the highest reading for each week). This convention differs from the MWAT4 used for theprioritization processes used in Task 5 and is used here to maintain comparability to theinformation presented by Kubicek (1977). The figures denote 200 C as the threshold of stress forsalmonids (Bjornn and Reiser, 1991). Although some species such as coho salmon may have alower threshold for stress (Spence et al. 1997), the 200 C value presents a simple but usefulreference point. Some comparison of maximum temperature between the field seasons of 1996 and1997 are made with results from 1973 as measured by Kubicek (1977). These maximum weeklytemperatures are not specifically relevant salmonid health in that they are momentary high points,however, they are useful for general discussion. Capturing the duration of exposure to stressful orlethal temperatures on a reach by reach basis is possible with this data set but is not attempted heredue to the more limited scope of basin/stream prioritization. Further analysis of these data willproduce more qualitative site specific information. For example, an alternate method of interpretingthis data, rather than the MWAT or maximum weekly temperature, is seen in the cumulativedistribution curve. This “snap-shot” (Figure 1) of stream reach temperature over the course of thelow flow period reflects the range of temperatures that would affect summering salmonids.
4 This maximum weekly average temperature (MWAT) is computed by using a rolling seven day average and selecting the highest ormaximum average recorded for the weekly time period.
EEL RVER WATER QUALITY MONITORING PROJECT (1996-97)HUMBOLDT COUNTY RESOURCE CONSERVATION DISTRICTSTATE WATER RESOURCES CONTROL BOARD, 205 (J)CONTRACT #5-029-250-2 PG. 13
LITTLE LARABEE CREEKVDR, 1997@840' ELEV.
0
50
100
150
200
250
30 26 22 18 14 10 6
Temperature (degrees Celcius)
Fre
qu
ency
of
Ob
serv
atio
ns
per
Tem
per
atu
re C
lass
0
10
20
30
40
50
60
70
80
90
100
Per
cen
t P
rob
abili
ty o
f E
xcee
dan
ce f
or
Giv
en
Tem
per
atu
res
Exceedance Probabilities for Temperature Thresholds:
Percentage of Time Greater Than 20 C: 0Total Hours Recorded: 2574.3
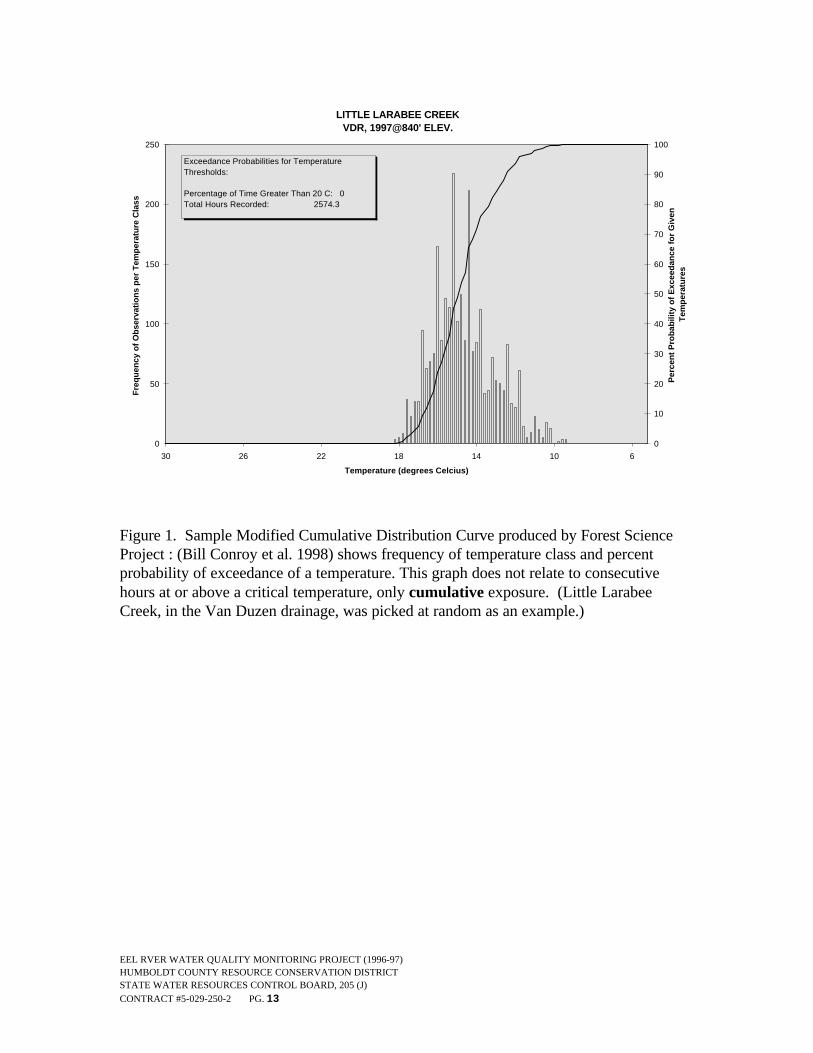
Figure 1. Sample Modified Cumulative Distribution Curve produced by Forest ScienceProject : (Bill Conroy et al. 1998) shows frequency of temperature class and percentprobability of exceedance of a temperature. This graph does not relate to consecutivehours at or above a critical temperature, only cumulative exposure. (Little LarabeeCreek, in the Van Duzen drainage, was picked at random as an example.)

EEL RVER WATER QUALITY MONITORING PROJECT (1996-97)HUMBOLDT COUNTY RESOURCE CONSERVATION DISTRICTSTATE WATER RESOURCES CONTROL BOARD, 205 (J)CONTRACT #5-029-250-2 PG. 14
Figure 2. Stream network of Eel River drainage.
EEL RVER WATER QUALITY MONITORING PROJECT (1996-97)HUMBOLDT COUNTY RESOURCE CONSERVATION DISTRICTSTATE WATER RESOURCES CONTROL BOARD, 205 (J)CONTRACT #5-029-250-2 PG. 15
The following is a general characterization of the Eel River, by reach, with maps that showgeneral locations discussed in the text and appropriate figures to illustrate apparenttemperature trends by sub-basin. Distances are indicated by river mile (RM) from theestuary up stream (e.g. Van Duzen River occurs at RM 13.7) .
Upper Eel River above Lake Pillsbury and Mainstem Eel River from Scott Dam(RM 168.5) to Outlet Creek (RM 126): By the time the headwaters of the Eel Riverhave reached Lake Pillsbury, they have already warmed substantially (Figure 4), reaching amaximum of over 260 C. Water releases at Scott Dam come from low in the water columnof Lake Pillsbury. Consequently, flows at the dam, through the Monkey Rock area anddownstream as far as Van Arsdale Dam remain under the stressful threshold in most years.Warmer releases from Scott Dam do occur in some years when the reservoir is beingdrawn down. Downstream of Van Arsdale Dam above Tomki Creek, the Eel River warmssubstantially to 270 C which is above the incipient lethal temperature for salmon andsteelhead (Brett, 1952; Coutant, 1970).5
5 Graphs of weekly maximum temperature use a convention where locations to the left in the legend are upstream and those to the right aredownstream.

EEL RVER WATER QUALITY MONITORING PROJECT (1996-97)HUMBOLDT COUNTY RESOURCE CONSERVATION DISTRICTSTATE WATER RESOURCES CONTROL BOARD, 205 (J)CONTRACT #5-029-250-2 PG. 16
Figure 3. Upper Eel River, Lake Pillsbury to Dos Rios (Lake and Mendocino Counties).

EEL RVER WATER QUALITY MONITORING PROJECT (1996-97)HUMBOLDT COUNTY RESOURCE CONSERVATION DISTRICTSTATE WATER RESOURCES CONTROL BOARD, 205 (J)CONTRACT #5-029-250-2 PG. 17
Figure 4. Eel River maximum weekly stream temperatures for 1996 from above LakePillsbury to just upstream of Tomki Creek.
Mainstem Eel River from above Outlet Creek to Dyerville (RM 40.6): One of thewarmest reaches of the Eel River is just above Outlet Creek (RM 126) at Highway 162 (Figure 7)where temperatures reached 310 C in 1996 and 290 C in 1997. The Eel River cools somewhatbetween Outlet Creek and the Middle Fork Eel, although Outlet Creek had little cooling influenceas it joined the Eel at 290 C in 1996. Kubicek (1977) ascribed the drop in temperature to someaddition of ground water in this reach. The water temperature of the mainstem Eel River moderatesonly slightly at the Middle Fork Eel (RM 119.3) and then warms again as it flows northward. In1996, the temperature at Nashmead (RM ~94), downstream from the North Fork, was 310 C whileEel Rock (RM.52) further downstream was 28.70 C. The temperature of the Eel River moderatesas it approaches Dyerville (maximum 270 C) where cooling influences of summer fog take effect.
Mainstem Eel River from Dyerville to the Estuary: The Eel River comes into equilibriumwith cooler coastal temperatures as it flows downstream from Dyerville (Figure 8). The maximumwater temperature was 240C at the mouth of the Van Duzen River (RM 13.7) in 1996 and a degreeless (230 C) at Fortuna.(RM 10) These temperatures are still well above the threshold for salmonidstress. The Eel River estuary at Cock Robin Island (RM 0.3) also benefits from heat exchange withthe cold Pacific Ocean due to tidal flux and the maximum temperature here was only 170 C.

EEL RVER WATER QUALITY MONITORING PROJECT (1996-97)HUMBOLDT COUNTY RESOURCE CONSERVATION DISTRICTSTATE WATER RESOURCES CONTROL BOARD, 205 (J)CONTRACT #5-029-250-2 PG. 18
Figure 5. Stream route of Eel River mainstem, Outlet Creek to Dyerville (Mendocino andHumboldt Counties).
EEL RVER WATER QUALITY MONITORING PROJECT (1996-97)HUMBOLDT COUNTY RESOURCE CONSERVATION DISTRICTSTATE WATER RESOURCES CONTROL BOARD, 205 (J)CONTRACT #5-029-250-2 PG. 19
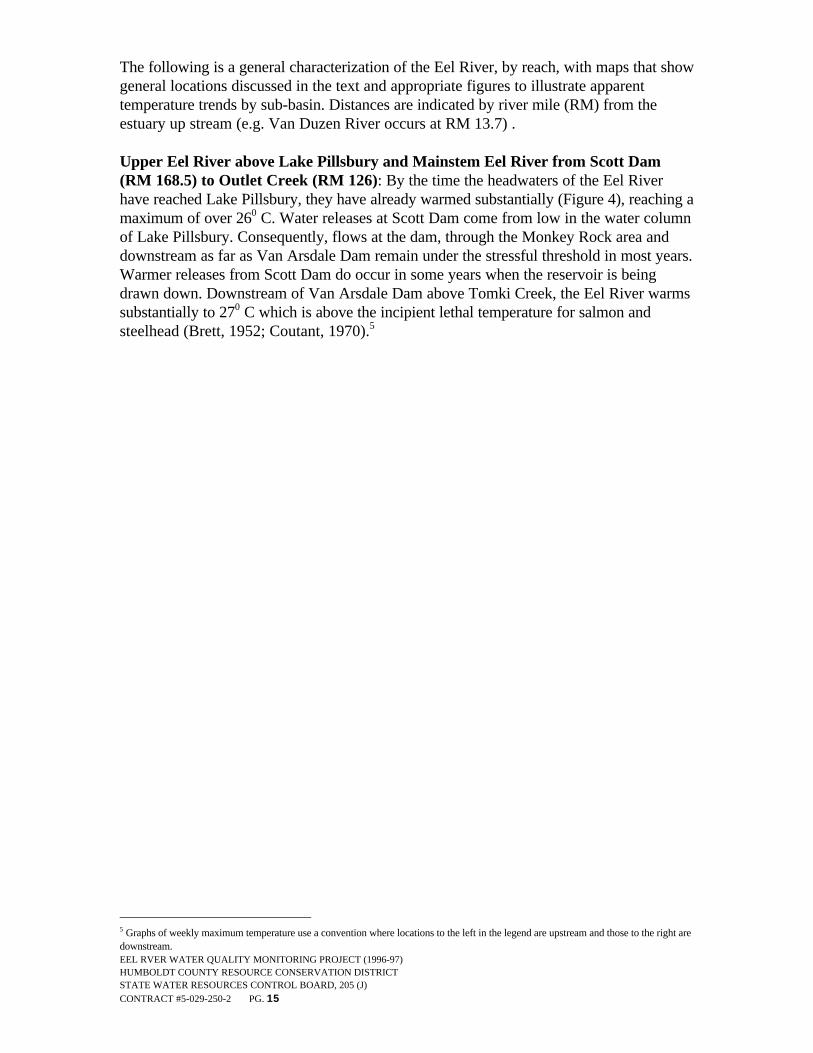
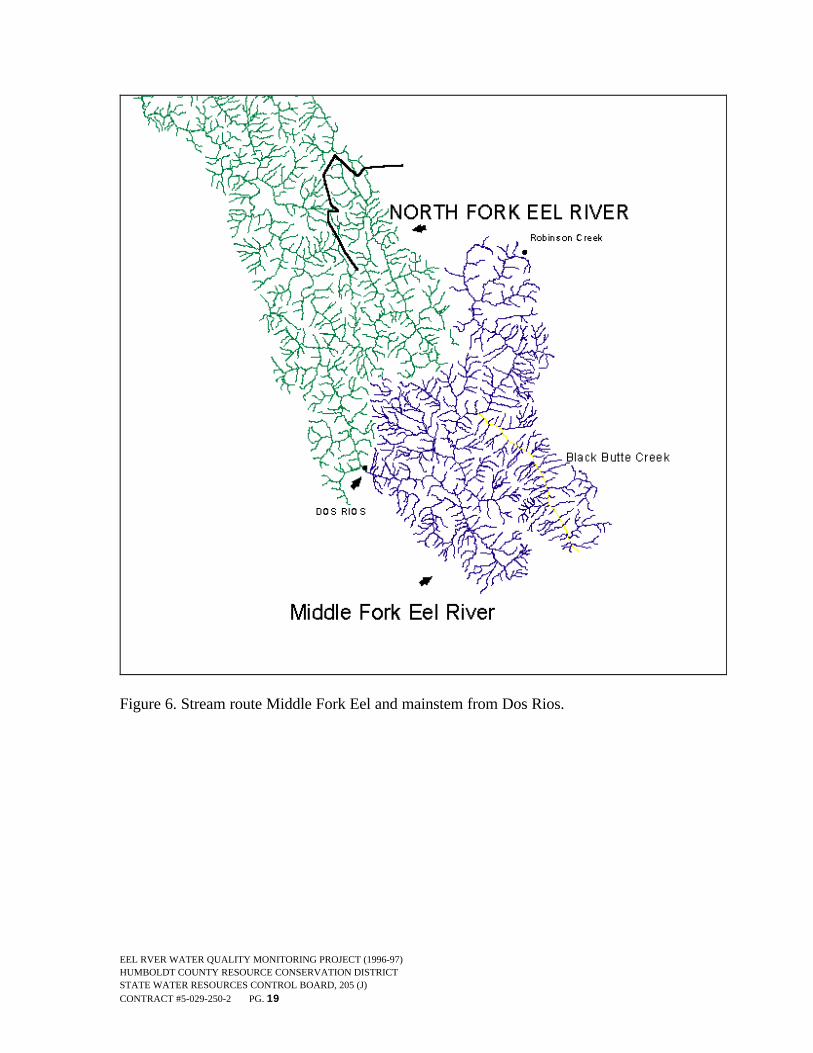
Figure 6. Stream route Middle Fork Eel and mainstem from Dos Rios.

EEL RVER WATER QUALITY MONITORING PROJECT (1996-97)HUMBOLDT COUNTY RESOURCE CONSERVATION DISTRICTSTATE WATER RESOURCES CONTROL BOARD, 205 (J)CONTRACT #5-029-250-2 PG. 20
Figure 7. Mainstem Eel River maximum weekly water temperatures from above OutletCreek at Highway 162 downstream to Dyerville
Figure 8. Mainstem Eel River maximum weekly water temperatures from Dyerville toCock Robin Island in the Eel River estuary 1996.

EEL RVER WATER QUALITY MONITORING PROJECT (1996-97)HUMBOLDT COUNTY RESOURCE CONSERVATION DISTRICTSTATE WATER RESOURCES CONTROL BOARD, 205 (J)CONTRACT #5-029-250-2 PG. 21
Van Duzen River: Maximum weekly water temperatures at all locations on the VanDuzen River exceeded stressful levels for salmonids during 1996 (Figure 9). The LittleVan Duzen River attained a maximum water temperature of 290 C, while the Van Duzenreached 280C at Dinsmore and 270 C at Root Creek in 1996. These temperatures are allacutely stressful or lethal for salmonids (Brett, 1952; Coutant, 1970). The watertemperature of the Van Duzen River shows similar moderating trends as it flowsdownstream from Root Creek into the influence of the coastal climate. The maximumweekly water temperature immediately above Highway 101 was 250 C in 1996.
Figure 9. Van Duzen River maximum weekly water temperatures at four locations including theLittle Van Duzen in 1996

EEL RVER WATER QUALITY MONITORING PROJECT (1996-97)HUMBOLDT COUNTY RESOURCE CONSERVATION DISTRICTSTATE WATER RESOURCES CONTROL BOARD, 205 (J)CONTRACT #5-029-250-2 PG. 22
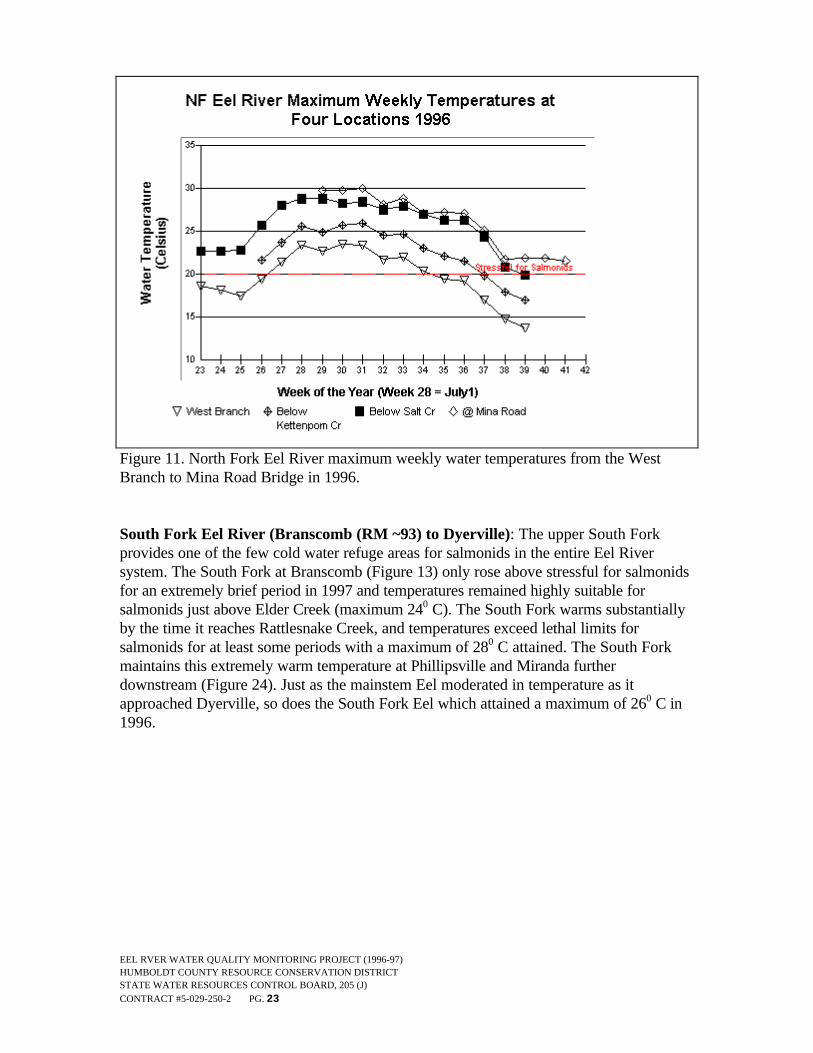
Middle Fork and North Fork Eel River: Both the Middle Fork Eel River (Figure 10)and the North Fork (Figure 11) show similar temperature patterns, with coolertemperatures at higher elevations near headwaters and lethal temperatures for salmonidsjust above their confluence with the mainstem Eel River. The Middle Fork at RobinsonCreek in the Yolla Bolla Wilderness had a maximum weekly water temperature of 230 Cduring summer 1996. While this temperature exceeds the range of stress for salmonids,apparently, there are pools that stratify which allow refuge for the fish in this reach. Alllower Middle Fork reaches were above lethal limits for salmonids with temperatures risingfrom 280C above the Black Butte River to 290C at Thatcher Creek and finally to 310C atDos Rios. The West Branch of the NF Eel attained a maximum of 240C during 1996, butthe North Fork Eel warmed rapidly as it descended. Below Kettenpom Creek the riverreached 260C, while further downstream at Salt Creek, temperatures rose above lethallevels for salmonids (290C). The North Fork Eel at the Mina Road Bridge exceeded 300C.for the maximum weekly temperature.
Figure 10. Middle Fork Eel River maximum weekly water temperatures from RobinsonCreek to Dos Rios 1996.
EEL RVER WATER QUALITY MONITORING PROJECT (1996-97)HUMBOLDT COUNTY RESOURCE CONSERVATION DISTRICTSTATE WATER RESOURCES CONTROL BOARD, 205 (J)CONTRACT #5-029-250-2 PG. 23
Figure 11. North Fork Eel River maximum weekly water temperatures from the WestBranch to Mina Road Bridge in 1996.
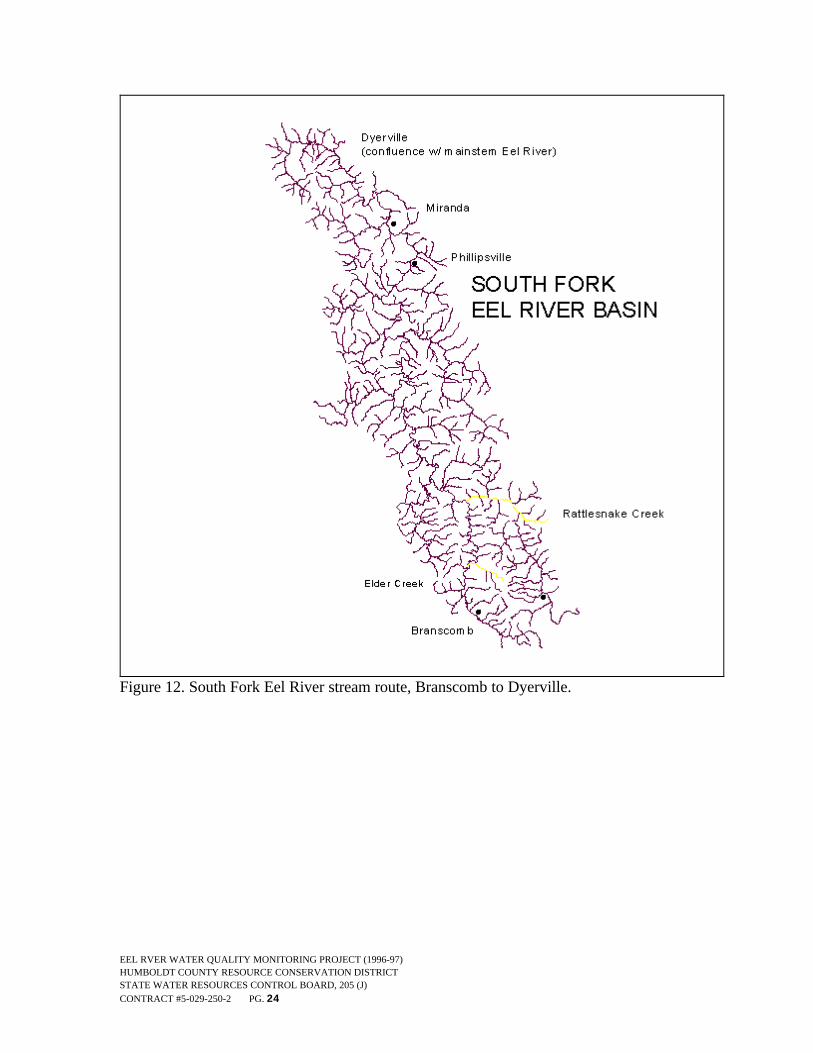
South Fork Eel River (Branscomb (RM ~93) to Dyerville): The upper South Forkprovides one of the few cold water refuge areas for salmonids in the entire Eel Riversystem. The South Fork at Branscomb (Figure 13) only rose above stressful for salmonidsfor an extremely brief period in 1997 and temperatures remained highly suitable forsalmonids just above Elder Creek (maximum 240 C). The South Fork warms substantiallyby the time it reaches Rattlesnake Creek, and temperatures exceed lethal limits forsalmonids for at least some periods with a maximum of 280 C attained. The South Forkmaintains this extremely warm temperature at Phillipsville and Miranda furtherdownstream (Figure 24). Just as the mainstem Eel moderated in temperature as itapproached Dyerville, so does the South Fork Eel which attained a maximum of 260 C in1996.
EEL RVER WATER QUALITY MONITORING PROJECT (1996-97)HUMBOLDT COUNTY RESOURCE CONSERVATION DISTRICTSTATE WATER RESOURCES CONTROL BOARD, 205 (J)CONTRACT #5-029-250-2 PG. 24
Figure 12. South Fork Eel River stream route, Branscomb to Dyerville.

EEL RVER WATER QUALITY MONITORING PROJECT (1996-97)HUMBOLDT COUNTY RESOURCE CONSERVATION DISTRICTSTATE WATER RESOURCES CONTROL BOARD, 205 (J)CONTRACT #5-029-250-2 PG. 25
Figure 13. South Fork Eel River maximum weekly water temperature from Branscomb toabove Rattlesnake Creek in 1997.
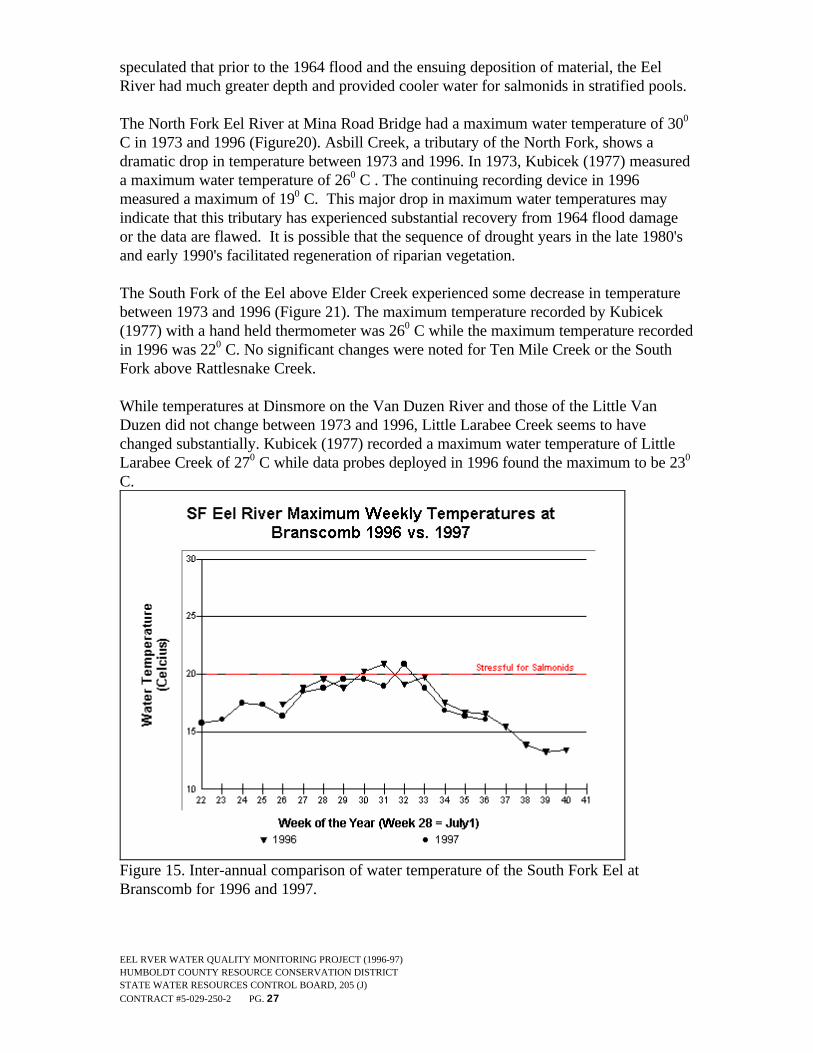
Inter-Annual Variation in Water Temperatures: The temperature regimes at all siteswere fairly similar for the 1996 and 1997 placements, however there was some variationbetween sites. The South Fork Eel River at Branscomb showed a typical pattern ofcomparison between years (Figure 15) with an identical maxima in both years (210 C). Thetemperature range was almost identical with timing of peaks driven by variability betweenwarm spells in the respective years. The Van Duzen River at Root Creek had a differenttrend (Figure 16) with the 1997 water temperatures ranking consistently warmer thanthose in 1996. However, the variation between maxima was not significant between yearsas a temperature of 270 C attained in both years. The maximum weekly watertemperatures for 1996 and 1997 for the mainstem Eel River at Eel Rock show exactly thereverse of the Van Duzen. At Eel Rock, temperatures were consistently higher in 1996,with a maximum temperature of 290 C and 280 C in 1997 (Figure 17).

EEL RVER WATER QUALITY MONITORING PROJECT (1996-97)HUMBOLDT COUNTY RESOURCE CONSERVATION DISTRICTSTATE WATER RESOURCES CONTROL BOARD, 205 (J)CONTRACT #5-029-250-2 PG. 26
Figure 14. South Fork Eel River maximum weekly water temperatures from aboveRattlesnake Creek to Dyerville in 1997.
Comparisons of 1973 and 1996: The data for this report were collected using affordableand easy to use automated temperature recording devices. While Kubicek (1977) did havea number of recording thermographs (30), many of his temperature observations werederived from use of a hand-held thermometer. Maximum temperatures were sometimesestimated or extrapolated from nearby sites. Despite the limited accuracy of these baselinedata, it is worthwhile to use Kubicek's (1977) data collected in the 1973 field season tocompare with data recently collected to see if there are dramatic changes in the Eel River'stemperature regime. (For this comparison, all sites represented were duplicated as close aspossible.)
The upper Eel River from above Lake Pillsbury to Tomki Creek (RM 153) did not showsignificant variation between maximum temperatures recorded by Kubicek (1977) in 1973and those collected in the 1996 field season (Figure 18). The maximum water temperaturefor Tomki Creek (27.5 C) was down less than two degrees C. This drop could beascribed to inter-annual variation. Significant lengths of Tomki Creek have been re-vegetated in an attempt prevent gully and bank erosion in this drainage. Unfortunately,there are not sufficient recent data to gauge whether these projects have helped todecreased temperatures in Tomki Creek.
The maximum water temperatures for all locations on the mainstem Eel River fromHighway 162, above Outlet Creek, to Dyerville were almost identical between 1973 and1996 (Figure 19). The Eel River may have been historically warm in this reach. It is
EEL RVER WATER QUALITY MONITORING PROJECT (1996-97)HUMBOLDT COUNTY RESOURCE CONSERVATION DISTRICTSTATE WATER RESOURCES CONTROL BOARD, 205 (J)CONTRACT #5-029-250-2 PG. 27
speculated that prior to the 1964 flood and the ensuing deposition of material, the EelRiver had much greater depth and provided cooler water for salmonids in stratified pools.
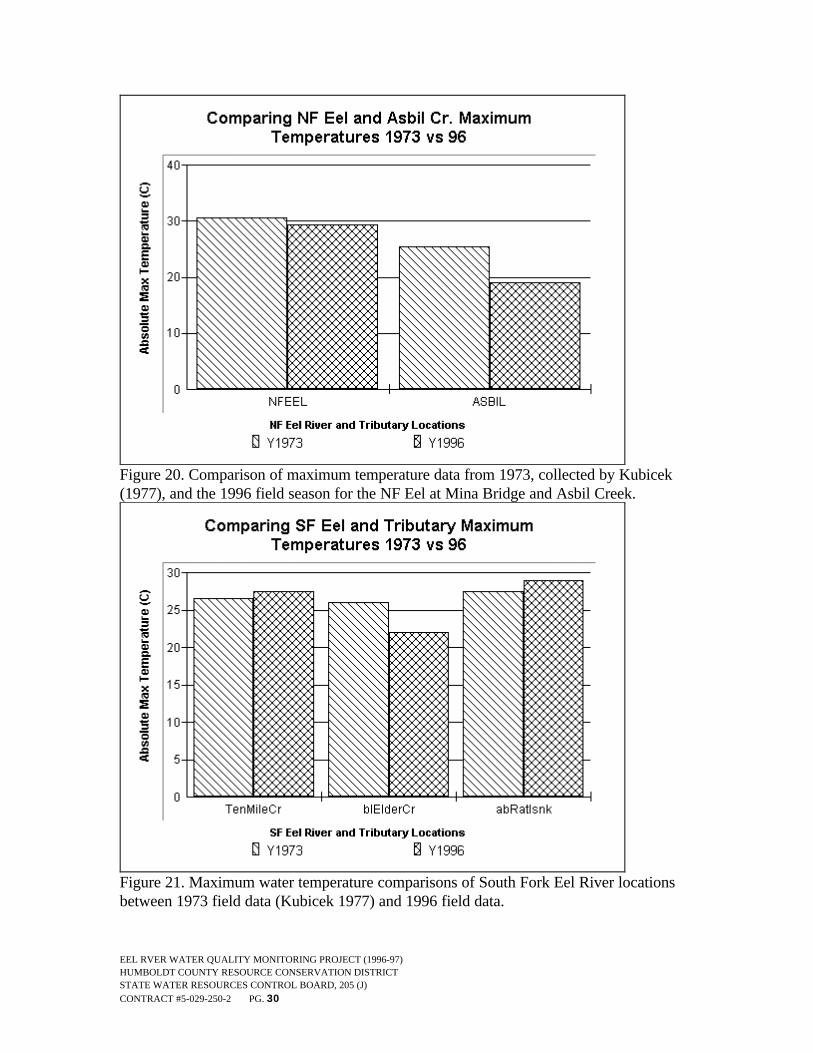
The North Fork Eel River at Mina Road Bridge had a maximum water temperature of 300
C in 1973 and 1996 (Figure20). Asbill Creek, a tributary of the North Fork, shows adramatic drop in temperature between 1973 and 1996. In 1973, Kubicek (1977) measureda maximum water temperature of 260 C . The continuing recording device in 1996measured a maximum of 190 C. This major drop in maximum water temperatures mayindicate that this tributary has experienced substantial recovery from 1964 flood damageor the data are flawed. It is possible that the sequence of drought years in the late 1980'sand early 1990's facilitated regeneration of riparian vegetation.
The South Fork of the Eel above Elder Creek experienced some decrease in temperaturebetween 1973 and 1996 (Figure 21). The maximum temperature recorded by Kubicek(1977) with a hand held thermometer was 260 C while the maximum temperature recordedin 1996 was 220 C. No significant changes were noted for Ten Mile Creek or the SouthFork above Rattlesnake Creek.
While temperatures at Dinsmore on the Van Duzen River and those of the Little VanDuzen did not change between 1973 and 1996, Little Larabee Creek seems to havechanged substantially. Kubicek (1977) recorded a maximum water temperature of LittleLarabee Creek of 270 C while data probes deployed in 1996 found the maximum to be 230
C.
Figure 15. Inter-annual comparison of water temperature of the South Fork Eel atBranscomb for 1996 and 1997.

EEL RVER WATER QUALITY MONITORING PROJECT (1996-97)HUMBOLDT COUNTY RESOURCE CONSERVATION DISTRICTSTATE WATER RESOURCES CONTROL BOARD, 205 (J)CONTRACT #5-029-250-2 PG. 28
Figure 16. Inter-annual comparison of water temperatures on the Van Duzen River atRoot Creek for 1996 and 1997.
Figure 17. Inter-annual variation in water temperature of the mainstem Eel River at EelRock for 1996 and 1997.

EEL RVER WATER QUALITY MONITORING PROJECT (1996-97)HUMBOLDT COUNTY RESOURCE CONSERVATION DISTRICTSTATE WATER RESOURCES CONTROL BOARD, 205 (J)CONTRACT #5-029-250-2 PG. 29
Figure 18. Comparison of maximum water temperatures from 1973, collected by Kubicek(1977), and data collected in 1996 for main Eel River locations from above Lake Pillsburyto Tomki Creek.
Figure 19. Comparison of maximum temperature data from Kubicek (1977) from 1973and 1996 at five locations on the mainstem Eel River.
EEL RVER WATER QUALITY MONITORING PROJECT (1996-97)HUMBOLDT COUNTY RESOURCE CONSERVATION DISTRICTSTATE WATER RESOURCES CONTROL BOARD, 205 (J)CONTRACT #5-029-250-2 PG. 30
Figure 20. Comparison of maximum temperature data from 1973, collected by Kubicek(1977), and the 1996 field season for the NF Eel at Mina Bridge and Asbil Creek.
Figure 21. Maximum water temperature comparisons of South Fork Eel River locationsbetween 1973 field data (Kubicek 1977) and 1996 field data.

EEL RVER WATER QUALITY MONITORING PROJECT (1996-97)HUMBOLDT COUNTY RESOURCE CONSERVATION DISTRICTSTATE WATER RESOURCES CONTROL BOARD, 205 (J)CONTRACT #5-029-250-2 PG. 31
Figure 22. Temperature comparisons of the Van Duzen River at Dinsmore, the Little VanDuzen (S.F.) and Little Larabee Creek between 1973 field data (Kubicek 1977) and 1996field data.
Sub-task 4.3 Aquatic Invertebrate Monitoring
Twenty-two Eel River tributaries were sampled for aquatic invertebrates in spring and fall1996 as part of this study. These streams were selected by CDF&G Eel BasinCoordinator Scott Downie. The selection criteria was intended to satisfy two needs; arandom cross section of stream health and proximity to a cooperating school. Full analysisof the samples by the principal investigator, John Lee, can be reviewed in Appendix B.Five different metrics were used to gauge stream health: the Simpson Index, modifiedHilsenhoff Index, EPT Index, Percent Dominant Taxa and the Richness Index. Lee notedthat the Hilsenhoff Index may need further modification for use in northern California.Below is a brief summary of what the aquatic macro-invertebrate samples revealed aboutthe health of Eel River tributaries. In addition to analysis done by Lee, the ten mostabundant species by site were arrayed in bar graphs and assigned color values associatedwith tolerance. Community structure can be indicative of whether an aquatic ecosystem isstressed. Metrics, values based on benthic macroinvertebrate assemblage in the sample,explained below are based on Plafkin et al. (1989). Ranges suggested are based on impactcompared with “theoretically undisturbed conditions.” Determining whether a metric valueindicates an impaired stream habitat is an iterative process (Fore et al. 1996), particularlywithout a reference stream for comparison. As more work is performed with the RapidBioassessment Protocol on Northern California streams and more data are gathered metricvalues should have greater precision in assessing relative impact.

EEL RVER WATER QUALITY MONITORING PROJECT (1996-97)HUMBOLDT COUNTY RESOURCE CONSERVATION DISTRICTSTATE WATER RESOURCES CONTROL BOARD, 205 (J)CONTRACT #5-029-250-2 PG. 32
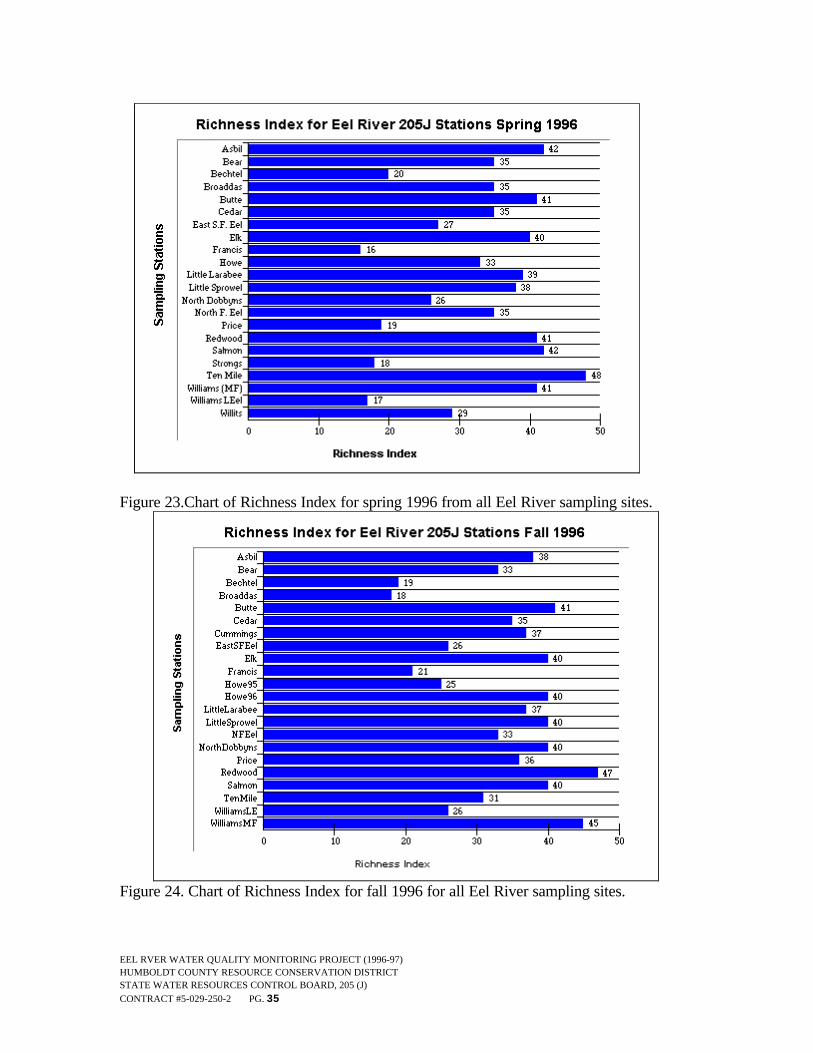
Richness Index: The Richness at each site per season is simply the total number of taxa.The diversity of aquatic insects decreases as water quality deteriorates due toanthropogenic causes (e.g. warming, point and non-point pollution etc., etc.) . Graphsrepresenting scores for all sites in spring (Figure 1) and fall (Figure 2) 1996 show a widerange of scores that can be interpreted as follows (Plafkin et al. 1989):
>40 = Low Impact25-39 = Moderate Impact<25 = High Impacts
EPT Index: The EPT Index is the number of species at a given location of the ordersEphemeroptera, Plectoptera, and Trichoptera. These are commonly known as mayflies,stoneflies and caddisflies. The species of aquatic invertebrates within these ordersgenerally have higher water quality requirements than Diptera (true flies), Coleoptera(beetles) or other orders. Spring 1996 EPT scores for all locations appear in Figure 3 andfall 1996 results in Figure 4. EPT score rankings indicate the following levels of streamimpacts: >25 = Low Impact
15-25 = Moderate Impact<15 = High Impact
Percent Dominant Taxa: This index is calculated by dividing the number animals in themost abundant taxa by the total number of organisms in the entire sample. Collectionsdominated by one taxon represent a very disturbed ecosystem (Fore et al. 1996). Scoresfor this parameter in spring 1996 (Figure 5) and fall 1996 (Figure 6) show that somestreams sampled have high impact levels. Scores can be interpreted as follows:
<20% = Low Impact20-30% = Slight Impact30-40% = Moderate Impact>40% = High Impact
Simpson Diversity Index: This metric is calculated using the diversity of taxa present andalso the evenness of the community. A community of aquatic invertebrates in a fairlystable and healthy environment will have many species that are fairly even in abundance,which can be said to exhibit evenness. Simpson scores for spring 1996 samples (Figure 7)have a far wider range than those for fall 1996 samples (Figure 8). Simpson DiversityIndex scores can be interpreted as follows:
>0.9 = Low Impact0.8-0.9 = Moderate Impact<0.8 = High Impact
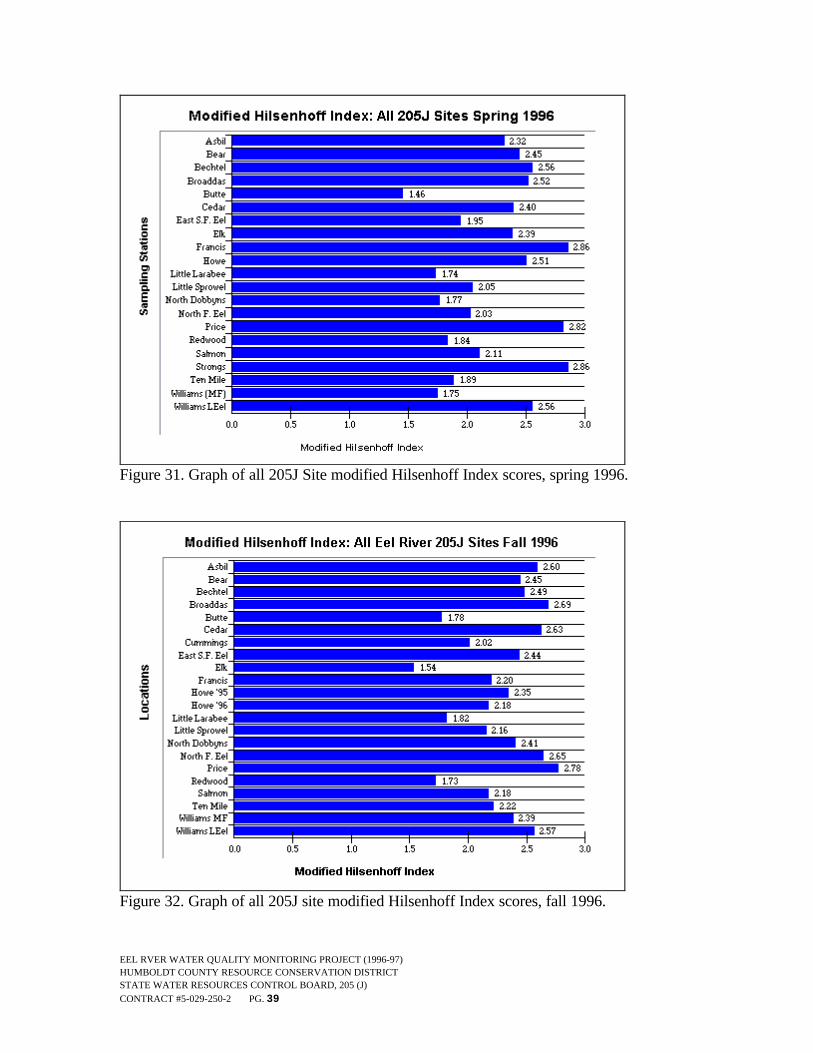
Modified Hilsenhoff Index: This index is calculated by assigning tolerance values (t-value) forall taxa present, multiplying the number of organisms present in each taxa by the t-value, addingall scores and then dividing by the total number of insects in the sample (EPA, 1997). Tolerancevalues reflect an insects ability to withstand organic pollution, such as dairy waste on a 0 to 10ranking system (Hilsenhoff, 1982). Insects that can only survive in high quality water having lowtolerance scores (0-5) and higher tolerance having higher scores (6-10). These values assigned todifferent species may need further refinement for northern California streams to make this metric

EEL RVER WATER QUALITY MONITORING PROJECT (1996-97)HUMBOLDT COUNTY RESOURCE CONSERVATION DISTRICTSTATE WATER RESOURCES CONTROL BOARD, 205 (J)CONTRACT #5-029-250-2 PG. 33
more useful (see Appendix B). Scores for the modified Hilsenhoff Index (0-3 rating) by site can befound in Figure 9 (spring, 1996) and Figure 10 (fall, 1996). Values can be interpreted as follows:
_ <2 = Low Impact_ 2.0-2.5 = Moderate Impacts
>2.5 = High Impacts

EEL RVER WATER QUALITY MONITORING PROJECT (1996-97)HUMBOLDT COUNTY RESOURCE CONSERVATION DISTRICTSTATE WATER RESOURCES CONTROL BOARD, 205 (J)CONTRACT #5-029-250-2 PG. 34
EEL RVER WATER QUALITY MONITORING PROJECT (1996-97)HUMBOLDT COUNTY RESOURCE CONSERVATION DISTRICTSTATE WATER RESOURCES CONTROL BOARD, 205 (J)CONTRACT #5-029-250-2 PG. 35
Figure 23.Chart of Richness Index for spring 1996 from all Eel River sampling sites.
Figure 24. Chart of Richness Index for fall 1996 for all Eel River sampling sites.

EEL RVER WATER QUALITY MONITORING PROJECT (1996-97)HUMBOLDT COUNTY RESOURCE CONSERVATION DISTRICTSTATE WATER RESOURCES CONTROL BOARD, 205 (J)CONTRACT #5-029-250-2 PG. 36
Figure 25. Emphmeroptera/Plecoptera/Trichoptera (EPT) Index for all Eel 205J samplingsites for spring 1996.
Figure 26. Emphmeroptera/Plecoptera/Trichoptera (EPT) Index for all Eel 205J samplingsites for fall 1996.

EEL RVER WATER QUALITY MONITORING PROJECT (1996-97)HUMBOLDT COUNTY RESOURCE CONSERVATION DISTRICTSTATE WATER RESOURCES CONTROL BOARD, 205 (J)CONTRACT #5-029-250-2 PG. 37
Figure 27. Chart of Percent Dominant Taxa for all Eel River sampling sites, spring 1996.
Figure 28. Chart of Percent Dominant Taxa for all Eel River sampling sites, fall 1996.

EEL RVER WATER QUALITY MONITORING PROJECT (1996-97)HUMBOLDT COUNTY RESOURCE CONSERVATION DISTRICTSTATE WATER RESOURCES CONTROL BOARD, 205 (J)CONTRACT #5-029-250-2 PG. 38
Figure 29. Spring 1996 Simpson Diversity Index scores for all 205J sites.
Figure 30. Fall 1996 Simpson Diversity Index scores for all 205J sites.
EEL RVER WATER QUALITY MONITORING PROJECT (1996-97)HUMBOLDT COUNTY RESOURCE CONSERVATION DISTRICTSTATE WATER RESOURCES CONTROL BOARD, 205 (J)CONTRACT #5-029-250-2 PG. 39
Figure 31. Graph of all 205J Site modified Hilsenhoff Index scores, spring 1996.
Figure 32. Graph of all 205J site modified Hilsenhoff Index scores, fall 1996.
EEL RVER WATER QUALITY MONITORING PROJECT (1996-97)HUMBOLDT COUNTY RESOURCE CONSERVATION DISTRICTSTATE WATER RESOURCES CONTROL BOARD, 205 (J)CONTRACT #5-029-250-2 PG. 40
Community Structure with Tolerance Values: Graphs showing the ten most abundantaquatic invertebrate species by location were generated for all locations. Tolerance valuesfrom the California Department of Fish and Game Aquatic Invertebrate Laboratory(CDF&G. 1996) were assigned colors for use in this analysis:
• 0-3 = Light Impacts (Green)• 4-6 = Moderate Water Quality (Yellow)• 7-10 = Degraded Water Quality (Red)
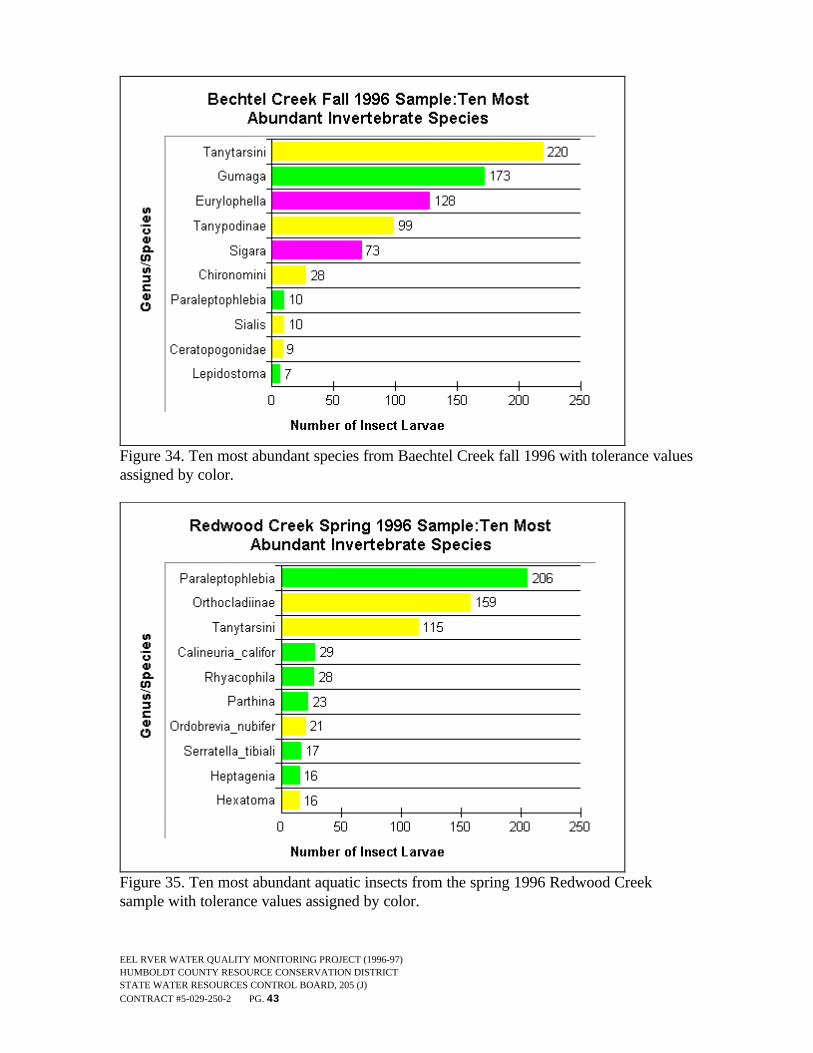
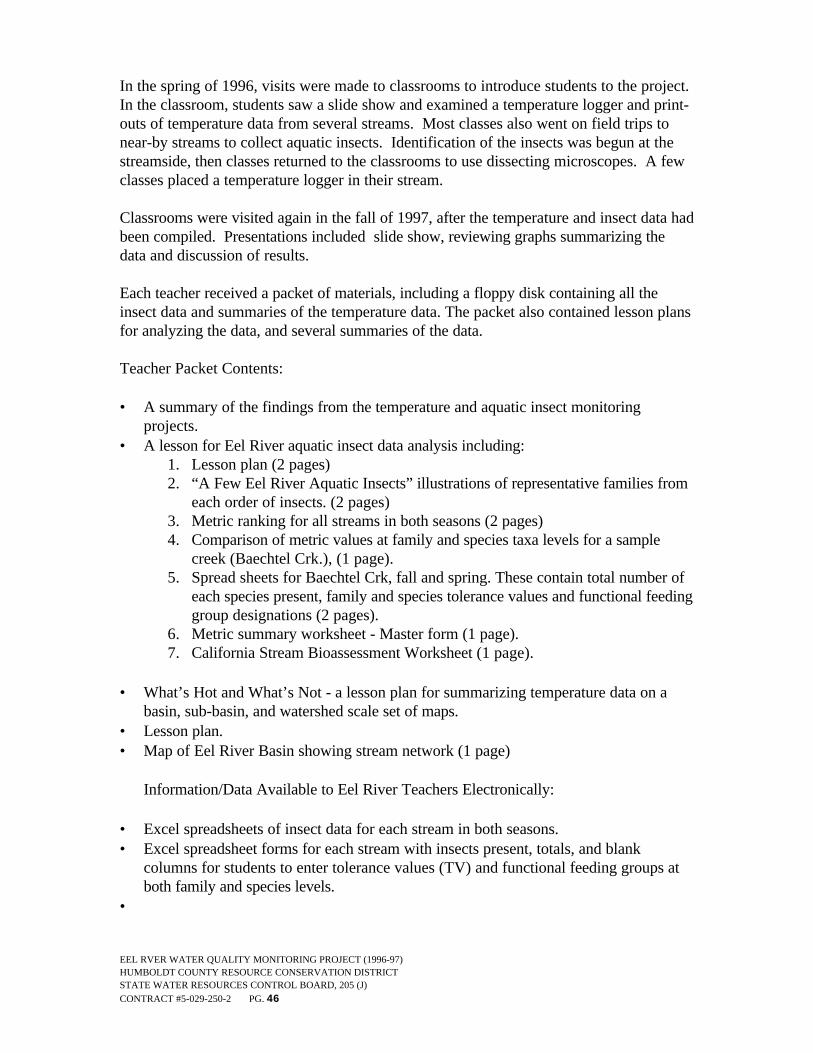
The Redwood Creek, S.F., RM 30, chart of the ten most abundant species for fall 1996(Figure 36) shows a community with fairly good evenness as evidenced by the shape ofthe bar graph, reflecting a stream with perennial cold water and low sediment transport.This contrasts with both spring and fall samples from Price Creek, RM 14.7, (Figures 37& 38) and the spring sample from Baechtel Creek, RM 148 (Figure 11), an urban streamin Willits. From this sampling effort, Price Creek appears to have problems related to highsediment supply and transport.
The color codes, above, also give an indication of the number of pollution intolerantspecies present at each location. Redwood Creek had a majority of pollution intoleranttaxa in the spring sample and retained four high water quality indicator species in the fallsample. The lack of more pronounced evenness in the Redwood Creek spring sample maybe the result of sampling slightly late, after emergence of some species (Figure 35). WhilePrice Creek reflects extreme disturbance with regard to evenness and species diversity, itstill had five intolerant species in spring 1996 in low numbers (Figure37). This mightreflect the fact that Price Creek has cold water temperatures due to its proximity to theocean. Baechtel Creek in fall 1996 had two species, the mayfly Eurylophella sp. anddragonfly Sigara sp., which are both very tolerant of poor quality water. Both thesespecies occurred only in this severely impacted urban stream.
EEL RVER WATER QUALITY MONITORING PROJECT (1996-97)HUMBOLDT COUNTY RESOURCE CONSERVATION DISTRICTSTATE WATER RESOURCES CONTROL BOARD, 205 (J)CONTRACT #5-029-250-2 PG. 41
Summary of Findings: When all metric analysis methods are taken together, the least impactedstreams surveyed were Butte, Redwood, Salmon, Williams (MF Eel) and Little Larabee Creeks.No control stream was available for this study and Lee (Appendix A) noted that several aquaticinsect species associated with high water quality from other northern California streams weregenerally lacking or in low abundance. He asserted that Redwood, Little Larabee and Butte Creekshad a higher level of representation of those taxa associated with cooler water temperatures insummer.
Urban streams clearly had the most consistently low ranking scores among virtually all systems ofanalysis. Francis Creek (Ferndale), Strongs Creek (Fortuna) and Baechtel, Willits, and BroaddusCreeks (Willits) all scored consistently in impaired ranges. May et al. (1996) studied 22 PugetSound creeks and found that cumulative watershed effects from urbanization can negatively impactaquatic invertebrates. Problems included increased storm flows, reduced summer flows, loss ofchannel complexity and loss of aquatic species diversity. Non-point source contributions ofpollutants from paved areas and stream-side residences can also contribute to water qualitydegradation.
Lee (Attachment B) noted that Baechtel Creek in fall had some organisms more characteristic ofponds than streams. When extensive areas are paved, runoff occurs quickly during winter storms,leaving little opportunity to re-charge ground water. Extremely low flows in Baechtel Creek in fallprobably reflect less water storage in the flood plain due to urbanization. Both Strongs Creek andWillits Creek had so little surface flow in fall 1996 that neither could be sampled. Low speciesdiversity in these urban streams, including Baechtel Creek, (Figure 33) in spring 1996 may haveresulted from high run-off in winter, flushing aquatic invertebrates downstream. Francis Creekexperienced extensive flood damage in December 1995 that deposited large quantities of sedimentin the channel. This is probably linked to very low insect diversity in spring 1996.
Some streams were known to have low water temperatures but also showed substantial componentsof pollution tolerant taxa and low community diversity. Williams Creek (Salt River, RM 0.8),Price and Howe Creeks were rated in high impact categories, possibly the result of high sedimentcontributions that disturbed the aquatic community. These tributaries are proximate to FrancisCreek in the lower Eel basin and also experienced a flood event in December 1995 with associatedhigh sediment transport. Price Creek still had a low diversity of organisms (evenness) whensamples were collected in fall (Figure 34).
Several streams with high summer temperatures, such as the North Fork Eel and East Branch SFEel and Ten Mile Creek, had declining scores from spring to fall, possibly as a result of high watertemperature. Lee (Appendix A) noted that the most abundant taxa in the former two streams wereadapted to warm water and were grazers. Grazing aquatic invertebrates thrive in streams that lackcanopy and provide abundant algae growth. Tolerance values for aquatic invertebrates werederived on the ability of organisms to survive nutrient enrichment from dairy waste (Hilsenhoff,1982). The temperature problems in the Eel River may need a re-determination of species tolerancelevels as some species that have a low tolerance for organic pollution have a high tolerance forelevated water temperatures. The baseline collection provided by this study will help the CaliforniaDepartment of Fish and Game Aquatic Bio-Assessment Laboratory and other experts to ascribemore accurate thermal tolerance ratings in future studies.

EEL RVER WATER QUALITY MONITORING PROJECT (1996-97)HUMBOLDT COUNTY RESOURCE CONSERVATION DISTRICTSTATE WATER RESOURCES CONTROL BOARD, 205 (J)CONTRACT #5-029-250-2 PG. 42
The graphs below use the following color code:
0-3 = Light Impacts (green)4-6 = Moderate Water Quality (yellow)7-10 = Degraded Water Quality (red)
Figure 33. The ten most abundant species in Baechtel Creek, an urban stream in Willits,from the spring 1996 sample, with tolerance values assigned by color.
EEL RVER WATER QUALITY MONITORING PROJECT (1996-97)HUMBOLDT COUNTY RESOURCE CONSERVATION DISTRICTSTATE WATER RESOURCES CONTROL BOARD, 205 (J)CONTRACT #5-029-250-2 PG. 43
Figure 34. Ten most abundant species from Baechtel Creek fall 1996 with tolerance valuesassigned by color.
Figure 35. Ten most abundant aquatic insects from the spring 1996 Redwood Creeksample with tolerance values assigned by color.

EEL RVER WATER QUALITY MONITORING PROJECT (1996-97)HUMBOLDT COUNTY RESOURCE CONSERVATION DISTRICTSTATE WATER RESOURCES CONTROL BOARD, 205 (J)CONTRACT #5-029-250-2 PG. 44
Figure 36. Ten most abundant species found in fall 1996 Redwood Creek samples withtolerance values assigned by color.
Figure 37. Graph showing ten most abundant species of aquatic invertebrates in PriceCreek from spring 1996 with tolerance codes in color.

EEL RVER WATER QUALITY MONITORING PROJECT (1996-97)HUMBOLDT COUNTY RESOURCE CONSERVATION DISTRICTSTATE WATER RESOURCES CONTROL BOARD, 205 (J)CONTRACT #5-029-250-2 PG. 45
Figure 38. Ten most abundant species of aquatic invertebrates in Price Creek during fall1996 with tolerance codes in color.
Sub-task 4.4 Education
Although not specifically required by the SWRCB contract, the HCRCD recognized thevalue of education to help expand the community awareness of water quality issues in thisarea and, to that end, the HCRCD chose to commit a level of time and effort. Educationof the Eel River community is a very important factor in integrating awareness of presentwater quality conditions with the processes necessary to bring about a positive change inthe drainage over time.
The public participation and education within this grant was enhanced through outreach toschools within the Eel River Basin. Public school teachers were contacted by telephone atthe beginning of the project, and those who expressed an interest were invited to attend aone-day workshop. (See list of participating teachers above, Task 2)
Ten educators attended the workshop, which was held in April, 1996. Gary Friedrichsen,Patrick Higgins, Diane Higgins and John Lee conducted the training. Teachers saw a slideshow about the Eel River, learned the purpose and procedures for the Eel River WaterQuality Monitoring Project, learned to use the Hobo-Temp data loggers, practicedcollecting aquatic insects, and were introduced to computer programs for handling thetemperature and insect data from this project.
EEL RVER WATER QUALITY MONITORING PROJECT (1996-97)HUMBOLDT COUNTY RESOURCE CONSERVATION DISTRICTSTATE WATER RESOURCES CONTROL BOARD, 205 (J)CONTRACT #5-029-250-2 PG. 46
In the spring of 1996, visits were made to classrooms to introduce students to the project.In the classroom, students saw a slide show and examined a temperature logger and print-outs of temperature data from several streams. Most classes also went on field trips tonear-by streams to collect aquatic insects. Identification of the insects was begun at thestreamside, then classes returned to the classrooms to use dissecting microscopes. A fewclasses placed a temperature logger in their stream.
Classrooms were visited again in the fall of 1997, after the temperature and insect data hadbeen compiled. Presentations included slide show, reviewing graphs summarizing thedata and discussion of results.
Each teacher received a packet of materials, including a floppy disk containing all theinsect data and summaries of the temperature data. The packet also contained lesson plansfor analyzing the data, and several summaries of the data.
Teacher Packet Contents:
• A summary of the findings from the temperature and aquatic insect monitoringprojects.
• A lesson for Eel River aquatic insect data analysis including:1. Lesson plan (2 pages)2. “A Few Eel River Aquatic Insects” illustrations of representative families from
each order of insects. (2 pages)3. Metric ranking for all streams in both seasons (2 pages)4. Comparison of metric values at family and species taxa levels for a sample
creek (Baechtel Crk.), (1 page).5. Spread sheets for Baechtel Crk, fall and spring. These contain total number of
each species present, family and species tolerance values and functional feedinggroup designations (2 pages).
6. Metric summary worksheet - Master form (1 page).7. California Stream Bioassessment Worksheet (1 page).
• What’s Hot and What’s Not - a lesson plan for summarizing temperature data on a
basin, sub-basin, and watershed scale set of maps.• Lesson plan.• Map of Eel River Basin showing stream network (1 page)
Information/Data Available to Eel River Teachers Electronically: • Excel spreadsheets of insect data for each stream in both seasons.• Excel spreadsheet forms for each stream with insects present, totals, and blank
columns for students to enter tolerance values (TV) and functional feeding groups atboth family and species levels.
•
EEL RVER WATER QUALITY MONITORING PROJECT (1996-97)HUMBOLDT COUNTY RESOURCE CONSERVATION DISTRICTSTATE WATER RESOURCES CONTROL BOARD, 205 (J)CONTRACT #5-029-250-2 PG. 47
All files listed above under What in this Packet? Text files are in Microsoft Word 6.01format.
This network of cooperating schools will continue to receive support from the HCRCD asfunds are secured. All parties involved thus far have enjoyed the work together and lookforward to it’s continuance.
EEL RVER WATER QUALITY MONITORING PROJECT (1996-97)HUMBOLDT COUNTY RESOURCE CONSERVATION DISTRICTSTATE WATER RESOURCES CONTROL BOARD, 205 (J)CONTRACT #5-029-250-2 PG. 48
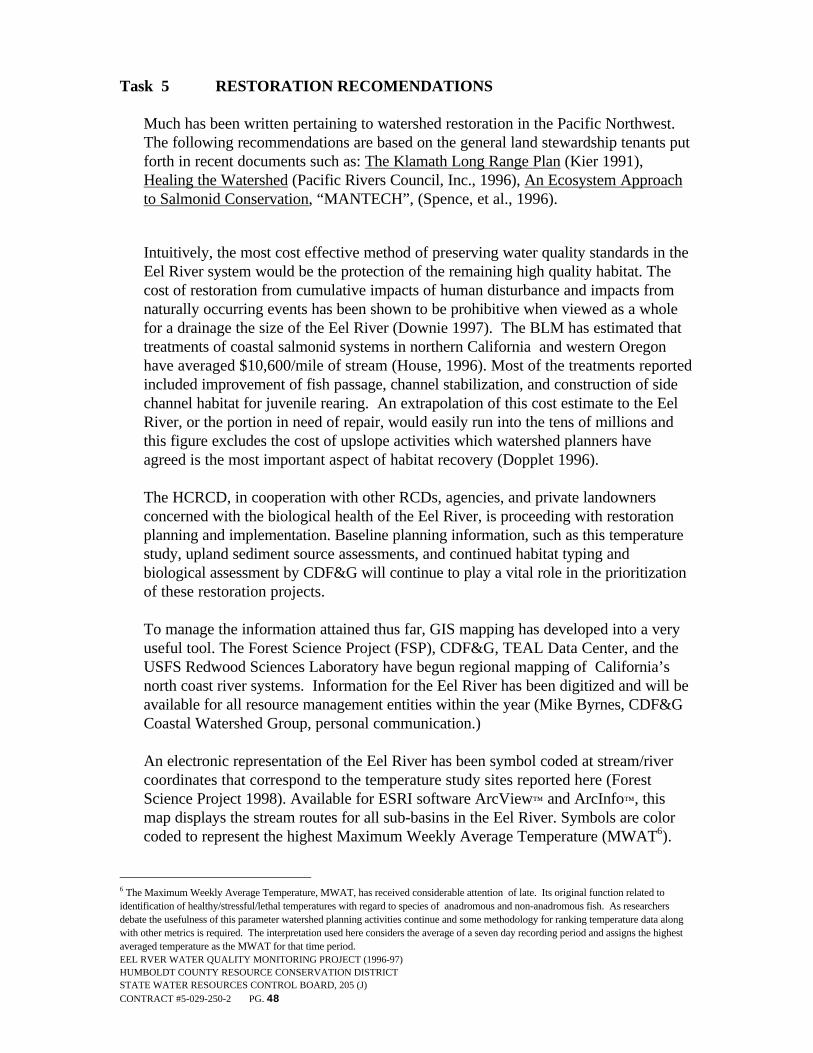
Task 5 RESTORATION RECOMENDATIONS Much has been written pertaining to watershed restoration in the Pacific Northwest.
The following recommendations are based on the general land stewardship tenants putforth in recent documents such as: The Klamath Long Range Plan (Kier 1991),Healing the Watershed (Pacific Rivers Council, Inc., 1996), An Ecosystem Approachto Salmonid Conservation, “MANTECH”, (Spence, et al., 1996).
Intuitively, the most cost effective method of preserving water quality standards in theEel River system would be the protection of the remaining high quality habitat. Thecost of restoration from cumulative impacts of human disturbance and impacts fromnaturally occurring events has been shown to be prohibitive when viewed as a wholefor a drainage the size of the Eel River (Downie 1997). The BLM has estimated thattreatments of coastal salmonid systems in northern California and western Oregonhave averaged $10,600/mile of stream (House, 1996). Most of the treatments reportedincluded improvement of fish passage, channel stabilization, and construction of sidechannel habitat for juvenile rearing. An extrapolation of this cost estimate to the EelRiver, or the portion in need of repair, would easily run into the tens of millions andthis figure excludes the cost of upslope activities which watershed planners haveagreed is the most important aspect of habitat recovery (Dopplet 1996).
The HCRCD, in cooperation with other RCDs, agencies, and private landowners
concerned with the biological health of the Eel River, is proceeding with restorationplanning and implementation. Baseline planning information, such as this temperaturestudy, upland sediment source assessments, and continued habitat typing andbiological assessment by CDF&G will continue to play a vital role in the prioritizationof these restoration projects.
To manage the information attained thus far, GIS mapping has developed into a very
useful tool. The Forest Science Project (FSP), CDF&G, TEAL Data Center, and theUSFS Redwood Sciences Laboratory have begun regional mapping of California’snorth coast river systems. Information for the Eel River has been digitized and will beavailable for all resource management entities within the year (Mike Byrnes, CDF&GCoastal Watershed Group, personal communication.)
An electronic representation of the Eel River has been symbol coded at stream/river
coordinates that correspond to the temperature study sites reported here (ForestScience Project 1998). Available for ESRI software ArcView™ and ArcInfo™, thismap displays the stream routes for all sub-basins in the Eel River. Symbols are colorcoded to represent the highest Maximum Weekly Average Temperature (MWAT6).
6 The Maximum Weekly Average Temperature, MWAT, has received considerable attention of late. Its original function related toidentification of healthy/stressful/lethal temperatures with regard to species of anadromous and non-anadromous fish. As researchersdebate the usefulness of this parameter watershed planning activities continue and some methodology for ranking temperature data alongwith other metrics is required. The interpretation used here considers the average of a seven day recording period and assigns the highestaveraged temperature as the MWAT for that time period.
EEL RVER WATER QUALITY MONITORING PROJECT (1996-97)HUMBOLDT COUNTY RESOURCE CONSERVATION DISTRICTSTATE WATER RESOURCES CONTROL BOARD, 205 (J)CONTRACT #5-029-250-2 PG. 49
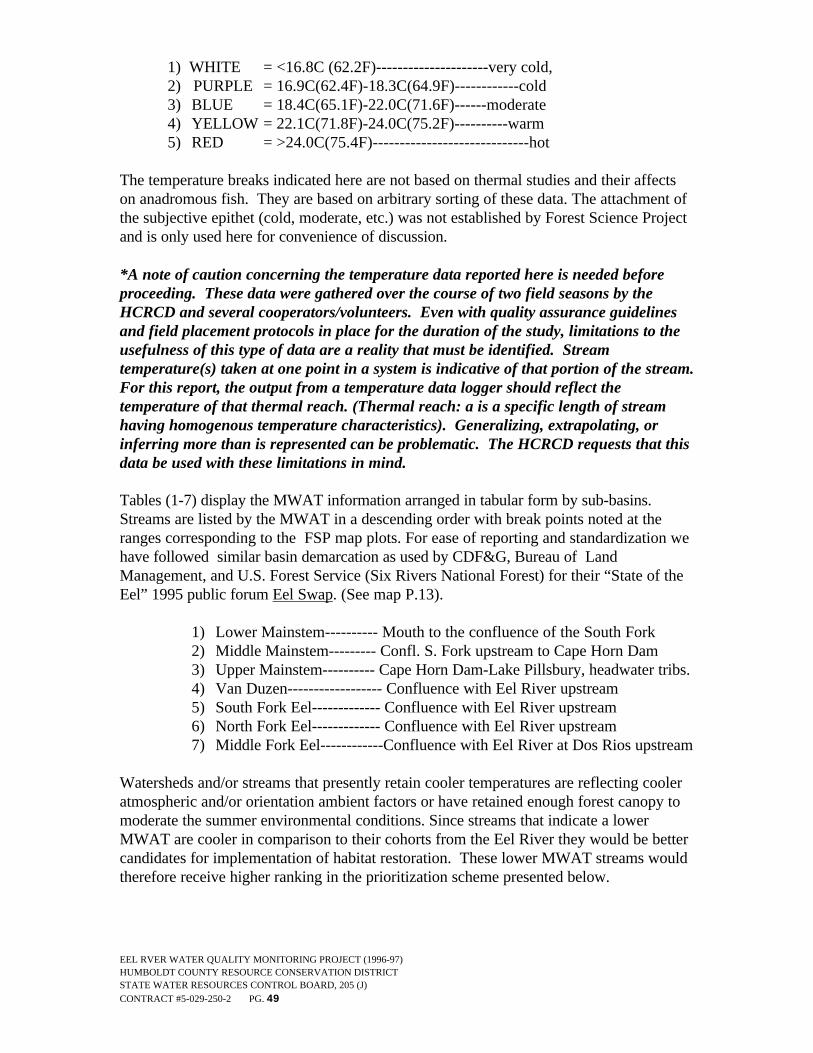
1) WHITE = <16.8C (62.2F)---------------------very cold,2) PURPLE = 16.9C(62.4F)-18.3C(64.9F)------------cold3) BLUE = 18.4C(65.1F)-22.0C(71.6F)------moderate4) YELLOW = 22.1C(71.8F)-24.0C(75.2F)----------warm5) RED = >24.0C(75.4F)-----------------------------hot
The temperature breaks indicated here are not based on thermal studies and their affectson anadromous fish. They are based on arbitrary sorting of these data. The attachment ofthe subjective epithet (cold, moderate, etc.) was not established by Forest Science Projectand is only used here for convenience of discussion.
*A note of caution concerning the temperature data reported here is needed beforeproceeding. These data were gathered over the course of two field seasons by theHCRCD and several cooperators/volunteers. Even with quality assurance guidelinesand field placement protocols in place for the duration of the study, limitations to theusefulness of this type of data are a reality that must be identified. Streamtemperature(s) taken at one point in a system is indicative of that portion of the stream.For this report, the output from a temperature data logger should reflect thetemperature of that thermal reach. (Thermal reach: a is a specific length of streamhaving homogenous temperature characteristics). Generalizing, extrapolating, orinferring more than is represented can be problematic. The HCRCD requests that thisdata be used with these limitations in mind.
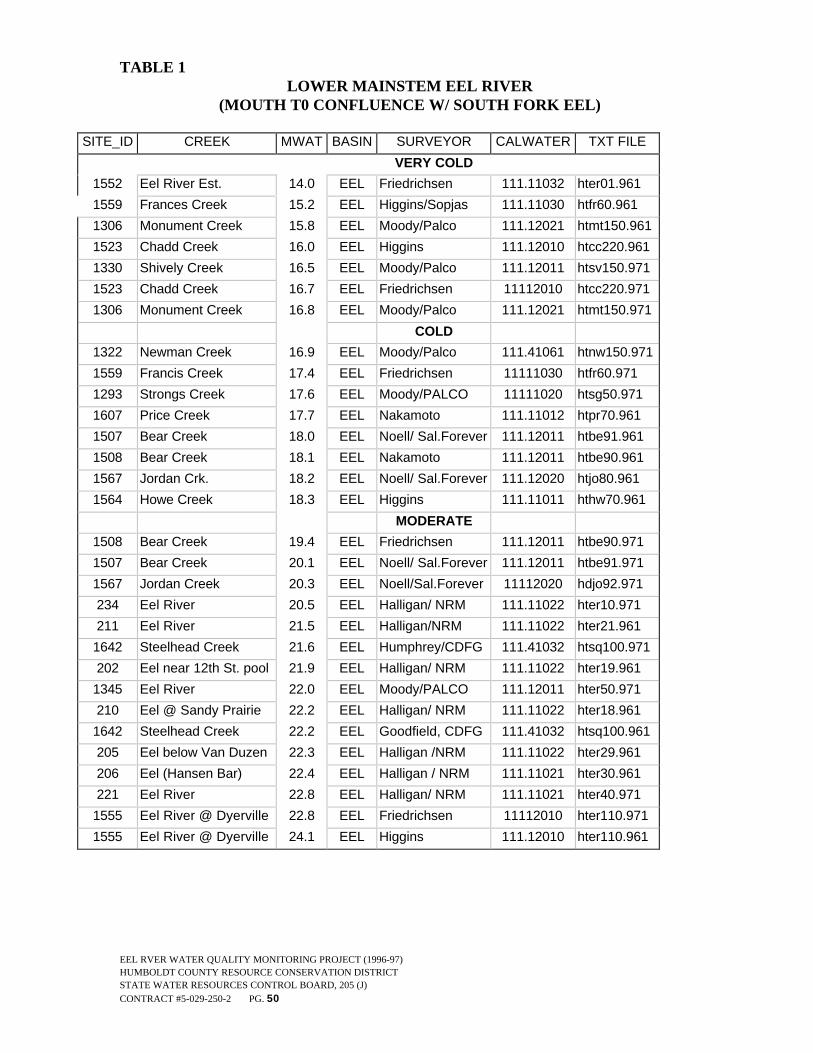
Tables (1-7) display the MWAT information arranged in tabular form by sub-basins.Streams are listed by the MWAT in a descending order with break points noted at theranges corresponding to the FSP map plots. For ease of reporting and standardization wehave followed similar basin demarcation as used by CDF&G, Bureau of LandManagement, and U.S. Forest Service (Six Rivers National Forest) for their “State of theEel” 1995 public forum Eel Swap. (See map P.13).
1) Lower Mainstem---------- Mouth to the confluence of the South Fork2) Middle Mainstem--------- Confl. S. Fork upstream to Cape Horn Dam3) Upper Mainstem---------- Cape Horn Dam-Lake Pillsbury, headwater tribs.4) Van Duzen------------------ Confluence with Eel River upstream5) South Fork Eel------------- Confluence with Eel River upstream6) North Fork Eel------------- Confluence with Eel River upstream7) Middle Fork Eel------------Confluence with Eel River at Dos Rios upstream
Watersheds and/or streams that presently retain cooler temperatures are reflecting cooleratmospheric and/or orientation ambient factors or have retained enough forest canopy tomoderate the summer environmental conditions. Since streams that indicate a lowerMWAT are cooler in comparison to their cohorts from the Eel River they would be bettercandidates for implementation of habitat restoration. These lower MWAT streams wouldtherefore receive higher ranking in the prioritization scheme presented below.
EEL RVER WATER QUALITY MONITORING PROJECT (1996-97)HUMBOLDT COUNTY RESOURCE CONSERVATION DISTRICTSTATE WATER RESOURCES CONTROL BOARD, 205 (J)CONTRACT #5-029-250-2 PG. 50
TABLE 1LOWER MAINSTEM EEL RIVER
(MOUTH T0 CONFLUENCE W/ SOUTH FORK EEL)
SITE_ID CREEK MWAT BASIN SURVEYOR CALWATER TXT FILE
VERY COLD
1552 Eel River Est. 14.0 EEL Friedrichsen 111.11032 hter01.961
1559 Frances Creek 15.2 EEL Higgins/Sopjas 111.11030 htfr60.961
1306 Monument Creek 15.8 EEL Moody/Palco 111.12021 htmt150.961
1523 Chadd Creek 16.0 EEL Higgins 111.12010 htcc220.961
1330 Shively Creek 16.5 EEL Moody/Palco 111.12011 htsv150.971
1523 Chadd Creek 16.7 EEL Friedrichsen 11112010 htcc220.971
1306 Monument Creek 16.8 EEL Moody/Palco 111.12021 htmt150.971
COLD
1322 Newman Creek 16.9 EEL Moody/Palco 111.41061 htnw150.971
1559 Francis Creek 17.4 EEL Friedrichsen 11111030 htfr60.971
1293 Strongs Creek 17.6 EEL Moody/PALCO 11111020 htsg50.971
1607 Price Creek 17.7 EEL Nakamoto 111.11012 htpr70.961
1507 Bear Creek 18.0 EEL Noell/ Sal.Forever 111.12011 htbe91.961
1508 Bear Creek 18.1 EEL Nakamoto 111.12011 htbe90.961
1567 Jordan Crk. 18.2 EEL Noell/ Sal.Forever 111.12020 htjo80.961
1564 Howe Creek 18.3 EEL Higgins 111.11011 hthw70.961
MODERATE
1508 Bear Creek 19.4 EEL Friedrichsen 111.12011 htbe90.971
1507 Bear Creek 20.1 EEL Noell/ Sal.Forever 111.12011 htbe91.971
1567 Jordan Creek 20.3 EEL Noell/Sal.Forever 11112020 hdjo92.971
234 Eel River 20.5 EEL Halligan/ NRM 111.11022 hter10.971
211 Eel River 21.5 EEL Halligan/NRM 111.11022 hter21.961
1642 Steelhead Creek 21.6 EEL Humphrey/CDFG 111.41032 htsq100.971
202 Eel near 12th St. pool 21.9 EEL Halligan/ NRM 111.11022 hter19.961
1345 Eel River 22.0 EEL Moody/PALCO 111.12011 hter50.971
210 Eel @ Sandy Prairie 22.2 EEL Halligan/ NRM 111.11022 hter18.961
1642 Steelhead Creek 22.2 EEL Goodfield, CDFG 111.41032 htsq100.961
205 Eel below Van Duzen 22.3 EEL Halligan /NRM 111.11022 hter29.961
206 Eel (Hansen Bar) 22.4 EEL Halligan / NRM 111.11021 hter30.961
221 Eel River 22.8 EEL Halligan/ NRM 111.11021 hter40.971
1555 Eel River @ Dyerville 22.8 EEL Friedrichsen 11112010 hter110.971
1555 Eel River @ Dyerville 24.1 EEL Higgins 111.12010 hter110.961

EEL RVER WATER QUALITY MONITORING PROJECT (1996-97)HUMBOLDT COUNTY RESOURCE CONSERVATION DISTRICTSTATE WATER RESOURCES CONTROL BOARD, 205 (J)CONTRACT #5-029-250-2 PG. 51
TABLE 2MIDDLE MAINSTEM EEL RIVER
(SOUTH FORK TO DOS RIOS)
SITE_ID CREEK MWAT BASIN SURVEYOR CALWATER TXT FILE
VERY COLD
1299 Scott Creek 14.4 EEL Moody/Palco 111.13030 htsx350.961
COLD
1640 Sonoma Creek 17.1 EEL Goodfield/CDFG 111.41051 htsn160.971
1640 Sonoma Creek 17.5 EEL Goodfield/CDFG 111.41051 htsn160.961
MODERATE
1571 Larabee Crk. 18.8 EEL Friedrichsen 11113010 htla1120.971
1571 Larabee Crk. 18.8 EEL Friedrichsen 111.13010 htla1120.961
WARM
1595 Dobbyns, North 21.6 EEL Friedrichsen 11141020 htdn420.971
1202 Larabee Creek 21.8 EEL Moody/Palco 11113030 htla150.971
1595 Dobbyns, North 22.3 EEL Friedrichsen 111.41020 htdn420.961
1509 Burger Creek 22.9 EEL Friedrichsen 11142010 htbg850.971
1346 Eel (abv. S. Fork) 23.0 EEL Moody/Palco 111.41061 hter111.971
1437 Dobbyns Creek 23.1 EEL Friedrichsen 111.41022 htdo550.971
1202 Larabee Creek 23.3 EEL Moody/Palco 111.13030 htla150.961
1509 Burger Creek 23.6 EEL Higgins 111.42010 htbg850.961
1527 Chamise Creek 23.8 EEL Goodfield/CDFG 111.42052 htcm870.971
HOT
1527 Chamise Crk. 24.6 EEL Goodfield/CDFG 111.42052 htcm870.961
1554 Eel @ Eel Rock 24.9 EEL Friedrichsen 11141051 hter160.971
236 Eel River 25.5 EEL Halligan/ NRM 111.41032 hter200.971
235 Eel River 25.5 EEL Halligan/ NRM 111.41032 hter202.971
1550 Eel River bel. MF 26.0 EEL Slota/MWA 111.42011 hter880.971
1554 Eel @ Eel Rock 26.2 EEL Friedrichsen 111.41051 hter160.961
1550 Eel dnstrm of MF 26.6 EEL Slota/MWA 111.42011 hter880.961

EEL RVER WATER QUALITY MONITORING PROJECT (1996-97)HUMBOLDT COUNTY RESOURCE CONSERVATION DISTRICTSTATE WATER RESOURCES CONTROL BOARD, 205 (J)CONTRACT #5-029-250-2 PG. 52
TABLE 3UPPER MAINSTEM EEL RIVER
(ABOVE DOS RIOS)
SITE_ID CREEK MWAT BASIN SURVEYOR CALWATER TXT FILE
VERY COLD
1626 Ryan Creek 16.5 EEL Friedrichsen 11161020 htry1350.971
1651 Welsh Creek 16.7 EEL Brun/USFS 111.63081 htwe1870.961
COLD
1627 Ryan Creek 16.9 EEL Harris/CDFG 111.61020 htry1340.961
1626 Ryan Creek 17.0 EEL Friedrichsen 111.61020 htry1350.961
1651 Welsh Creek 17.2 EEL Harris/CDFG 111.63081 htwe1870.971
1652 Willets Creek 18.3 EEL Friedrichsen 111.61014 htwi1500.971
MODERATE
1547 Eel @ Monkey Rock 18.7 EEL Brun/USFS 111.63093 hter1910.961
1548 Eel abv.Van Arsdale 18.8 EEL Brun/USFS 111.63094 hter1470.961
1546 Eel@ Cable X Scott Dam 19.0 EEL Brun/USFS 111.63074 hter1720.961
1631 Soda Creek 19.2 EEL Scott Harris/CDFG 111.63081 htsd1810.971
1631 Soda Creek 19.5 EEL Brun/USFS 111.63081 htsd1810.961
1517 Broaddus Creek 19.6 EEL Friedrichsen 111.61015 htbr1330.961
1515 Bucknell Creek 19.8 EEL Harris/CDFG 111.63091 htbn1560.971
1605 Panther Creek 19.9 EEL Harris/CDFG 111.63081 htpa1870.971
1521 Benmore Creek 20.2 EEL Brun/USFS 111.63092 htbx1680.961
1574 Long Valley Creek 20.3 EEL Friedrichsen 11161030 htlv1100.971
1519 Baechtel Creek 20.4 EEL Friedrichsen 111.61015 htbt1330.961
1521 Benmore Creek 20.6 EEL Harris/CDFG 111.63092 htbx1680.971
1605 Panther Creek 20.6 EEL Brun/USFS 111.63081 htpa1870.961
1649 Tomki Creek 20.7 EEL Schott/Mullins 111.62042 htto1860.961
1455 Eel River @ BloodyRock
20.7 EEL Harris/CDFG 111.63034 hter2470.971
1515 Bucknel Creek 20.8 EEL Brun/USFS 111.63091 htbn1560.961
1652 Willits Creek 21.0 EEL Friedrichsen 111.61014 htwi1500.961
1619 Rice Crk (upper) 21.2 EEL Brun/USFS 111.63071 htri2030.961
1603 Outlet Creek(Middle) 21.3 EEL Friedrichsen 111.61022 htou1200.971
1548 Eel abv Van Arsdale 21.5 EEL Mullin/CDFG 111.63094 hter1470.971
1529 Corbin Creek 21.5 EEL Brun/USFS 111.63011 htco2660.961
1546 Eel@ Cable X Scott Dam 22.0 EEL Harris/CDFG 111.63074 hter1720.971
WARM
1414 Outlet Creek (Lower) 22.2 EEL Friedrichsen 111.61034 htou1001.971
1618 Rice Crk (lower) 22.3 EEL Brun/ Mullins 111.63072 htri1960.961
1603 Outlet (Middle) 22.6 EEL Higgins 111.61022 htou1200.961
1544 Eel@Inlet Lake Pillsbury 22.6 EEL Brun / Mullins 111.63040 hter1840.961
1529 Corbin Creek 22.6 EEL Harris/CDFG 111.63011 htco2660.971

EEL RVER WATER QUALITY MONITORING PROJECT (1996-97)HUMBOLDT COUNTY RESOURCE CONSERVATION DISTRICTSTATE WATER RESOURCES CONTROL BOARD, 205 (J)CONTRACT #5-029-250-2 PG. 53
EEL RVER WATER QUALITY MONITORING PROJECT (1996-97)HUMBOLDT COUNTY RESOURCE CONSERVATION DISTRICTSTATE WATER RESOURCES CONTROL BOARD, 205 (J)CONTRACT #5-029-250-2 PG. 54
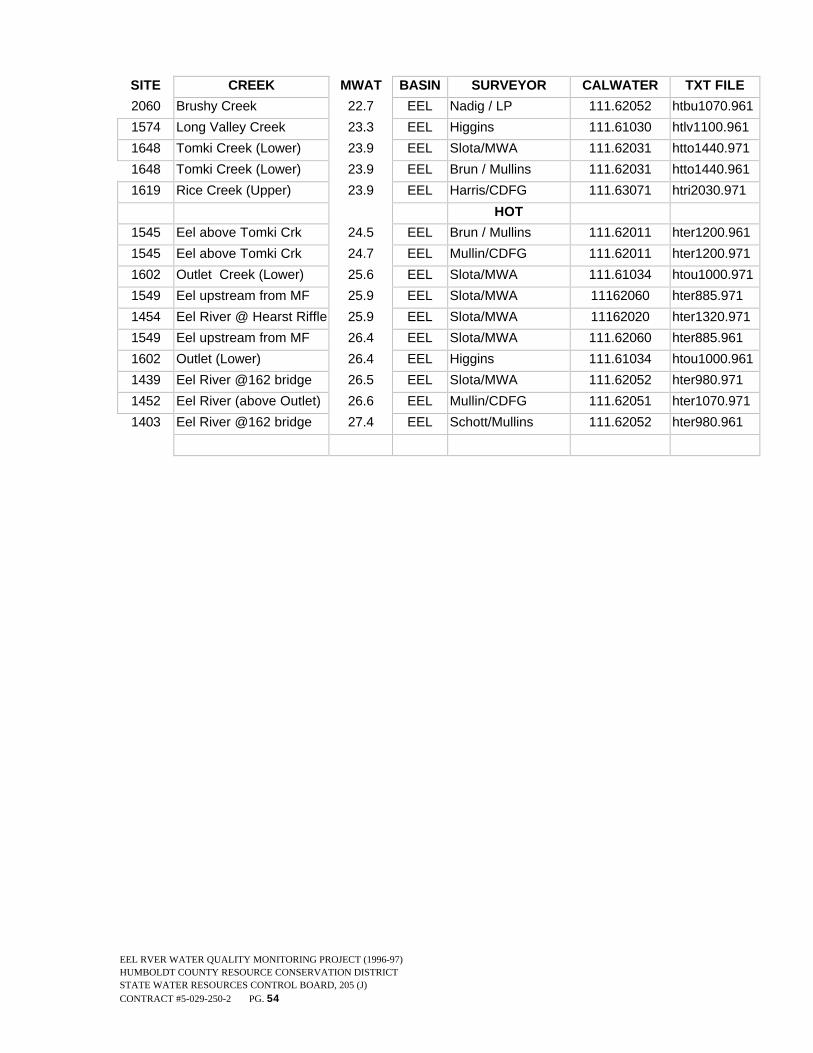
SITE CREEK MWAT BASIN SURVEYOR CALWATER TXT FILE
2060 Brushy Creek 22.7 EEL Nadig / LP 111.62052 htbu1070.961
1574 Long Valley Creek 23.3 EEL Higgins 111.61030 htlv1100.961
1648 Tomki Creek (Lower) 23.9 EEL Slota/MWA 111.62031 htto1440.971
1648 Tomki Creek (Lower) 23.9 EEL Brun / Mullins 111.62031 htto1440.961
1619 Rice Creek (Upper) 23.9 EEL Harris/CDFG 111.63071 htri2030.971
HOT
1545 Eel above Tomki Crk 24.5 EEL Brun / Mullins 111.62011 hter1200.961
1545 Eel above Tomki Crk 24.7 EEL Mullin/CDFG 111.62011 hter1200.971
1602 Outlet Creek (Lower) 25.6 EEL Slota/MWA 111.61034 htou1000.971
1549 Eel upstream from MF 25.9 EEL Slota/MWA 11162060 hter885.971
1454 Eel River @ Hearst Riffle 25.9 EEL Slota/MWA 11162020 hter1320.971
1549 Eel upstream from MF 26.4 EEL Slota/MWA 111.62060 hter885.961
1602 Outlet (Lower) 26.4 EEL Higgins 111.61034 htou1000.961
1439 Eel River @162 bridge 26.5 EEL Slota/MWA 111.62052 hter980.971
1452 Eel River (above Outlet) 26.6 EEL Mullin/CDFG 111.62051 hter1070.971
1403 Eel River @162 bridge 27.4 EEL Schott/Mullins 111.62052 hter980.961
EEL RVER WATER QUALITY MONITORING PROJECT (1996-97)HUMBOLDT COUNTY RESOURCE CONSERVATION DISTRICTSTATE WATER RESOURCES CONTROL BOARD, 205 (J)CONTRACT #5-029-250-2 PG. 55
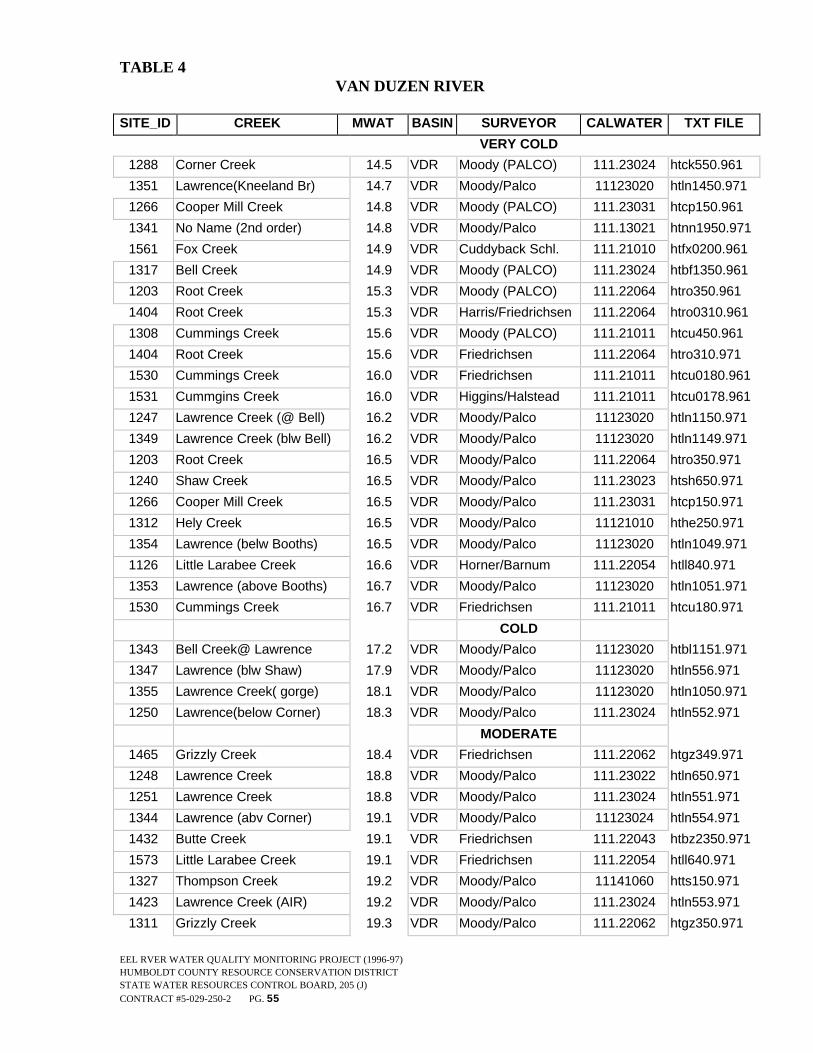
TABLE 4VAN DUZEN RIVER
SITE_ID CREEK MWAT BASIN SURVEYOR CALWATER TXT FILE
VERY COLD
1288 Corner Creek 14.5 VDR Moody (PALCO) 111.23024 htck550.961
1351 Lawrence(Kneeland Br) 14.7 VDR Moody/Palco 11123020 htln1450.971
1266 Cooper Mill Creek 14.8 VDR Moody (PALCO) 111.23031 htcp150.961
1341 No Name (2nd order) 14.8 VDR Moody/Palco 111.13021 htnn1950.971
1561 Fox Creek 14.9 VDR Cuddyback Schl. 111.21010 htfx0200.961
1317 Bell Creek 14.9 VDR Moody (PALCO) 111.23024 htbf1350.961
1203 Root Creek 15.3 VDR Moody (PALCO) 111.22064 htro350.961
1404 Root Creek 15.3 VDR Harris/Friedrichsen 111.22064 htro0310.961
1308 Cummings Creek 15.6 VDR Moody (PALCO) 111.21011 htcu450.961
1404 Root Creek 15.6 VDR Friedrichsen 111.22064 htro310.971
1530 Cummings Creek 16.0 VDR Friedrichsen 111.21011 htcu0180.961
1531 Cummgins Creek 16.0 VDR Higgins/Halstead 111.21011 htcu0178.961
1247 Lawrence Creek (@ Bell) 16.2 VDR Moody/Palco 11123020 htln1150.971
1349 Lawrence Creek (blw Bell) 16.2 VDR Moody/Palco 11123020 htln1149.971
1203 Root Creek 16.5 VDR Moody/Palco 111.22064 htro350.971
1240 Shaw Creek 16.5 VDR Moody/Palco 111.23023 htsh650.971
1266 Cooper Mill Creek 16.5 VDR Moody/Palco 111.23031 htcp150.971
1312 Hely Creek 16.5 VDR Moody/Palco 11121010 hthe250.971
1354 Lawrence (belw Booths) 16.5 VDR Moody/Palco 11123020 htln1049.971
1126 Little Larabee Creek 16.6 VDR Horner/Barnum 111.22054 htll840.971
1353 Lawrence (above Booths) 16.7 VDR Moody/Palco 11123020 htln1051.971
1530 Cummings Creek 16.7 VDR Friedrichsen 111.21011 htcu180.971
COLD
1343 Bell Creek@ Lawrence 17.2 VDR Moody/Palco 11123020 htbl1151.971
1347 Lawrence (blw Shaw) 17.9 VDR Moody/Palco 11123020 htln556.971
1355 Lawrence Creek( gorge) 18.1 VDR Moody/Palco 11123020 htln1050.971
1250 Lawrence(below Corner) 18.3 VDR Moody/Palco 111.23024 htln552.971
MODERATE
1465 Grizzly Creek 18.4 VDR Friedrichsen 111.22062 htgz349.971
1248 Lawrence Creek 18.8 VDR Moody/Palco 111.23022 htln650.971
1251 Lawrence Creek 18.8 VDR Moody/Palco 111.23024 htln551.971
1344 Lawrence (abv Corner) 19.1 VDR Moody/Palco 11123024 htln554.971
1432 Butte Creek 19.1 VDR Friedrichsen 111.22043 htbz2350.971
1573 Little Larabee Creek 19.1 VDR Friedrichsen 111.22054 htll640.971
1327 Thompson Creek 19.2 VDR Moody/Palco 11141060 htts150.971
1423 Lawrence Creek (AIR) 19.2 VDR Moody/Palco 111.23024 htln553.971
1311 Grizzly Creek 19.3 VDR Moody/Palco 111.22062 htgz350.971

EEL RVER WATER QUALITY MONITORING PROJECT (1996-97)HUMBOLDT COUNTY RESOURCE CONSERVATION DISTRICTSTATE WATER RESOURCES CONTROL BOARD, 205 (J)CONTRACT #5-029-250-2 PG. 56
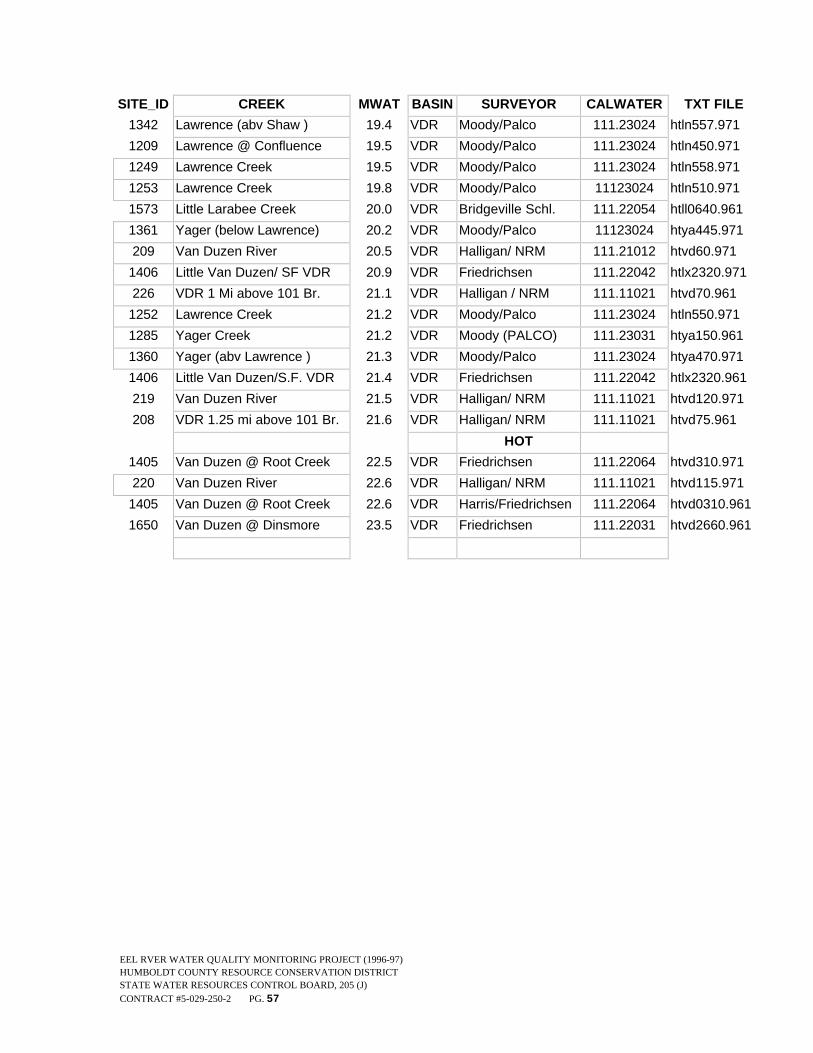
EEL RVER WATER QUALITY MONITORING PROJECT (1996-97)HUMBOLDT COUNTY RESOURCE CONSERVATION DISTRICTSTATE WATER RESOURCES CONTROL BOARD, 205 (J)CONTRACT #5-029-250-2 PG. 57
SITE_ID CREEK MWAT BASIN SURVEYOR CALWATER TXT FILE
1342 Lawrence (abv Shaw ) 19.4 VDR Moody/Palco 111.23024 htln557.971
1209 Lawrence @ Confluence 19.5 VDR Moody/Palco 111.23024 htln450.971
1249 Lawrence Creek 19.5 VDR Moody/Palco 111.23024 htln558.971
1253 Lawrence Creek 19.8 VDR Moody/Palco 11123024 htln510.971
1573 Little Larabee Creek 20.0 VDR Bridgeville Schl. 111.22054 htll0640.961
1361 Yager (below Lawrence) 20.2 VDR Moody/Palco 11123024 htya445.971
209 Van Duzen River 20.5 VDR Halligan/ NRM 111.21012 htvd60.971
1406 Little Van Duzen/ SF VDR 20.9 VDR Friedrichsen 111.22042 htlx2320.971
226 VDR 1 Mi above 101 Br. 21.1 VDR Halligan / NRM 111.11021 htvd70.961
1252 Lawrence Creek 21.2 VDR Moody/Palco 111.23024 htln550.971
1285 Yager Creek 21.2 VDR Moody (PALCO) 111.23031 htya150.961
1360 Yager (abv Lawrence ) 21.3 VDR Moody/Palco 111.23024 htya470.971
1406 Little Van Duzen/S.F. VDR 21.4 VDR Friedrichsen 111.22042 htlx2320.961
219 Van Duzen River 21.5 VDR Halligan/ NRM 111.11021 htvd120.971
208 VDR 1.25 mi above 101 Br. 21.6 VDR Halligan/ NRM 111.11021 htvd75.961
HOT
1405 Van Duzen @ Root Creek 22.5 VDR Friedrichsen 111.22064 htvd310.971
220 Van Duzen River 22.6 VDR Halligan/ NRM 111.11021 htvd115.971
1405 Van Duzen @ Root Creek 22.6 VDR Harris/Friedrichsen 111.22064 htvd0310.961
1650 Van Duzen @ Dinsmore 23.5 VDR Friedrichsen 111.22031 htvd2660.961
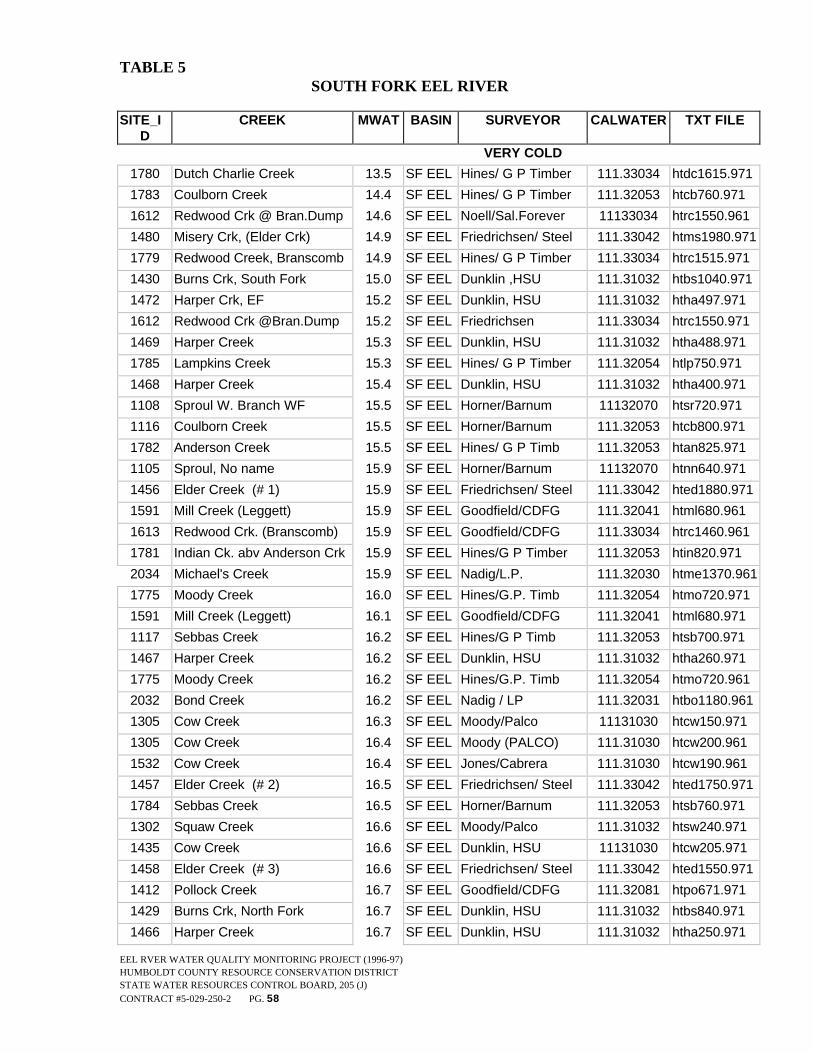
EEL RVER WATER QUALITY MONITORING PROJECT (1996-97)HUMBOLDT COUNTY RESOURCE CONSERVATION DISTRICTSTATE WATER RESOURCES CONTROL BOARD, 205 (J)CONTRACT #5-029-250-2 PG. 58
TABLE 5SOUTH FORK EEL RIVER
SITE_ID
CREEK MWAT BASIN SURVEYOR CALWATER TXT FILE
VERY COLD
1780 Dutch Charlie Creek 13.5 SF EEL Hines/ G P Timber 111.33034 htdc1615.971
1783 Coulborn Creek 14.4 SF EEL Hines/ G P Timber 111.32053 htcb760.971
1612 Redwood Crk @ Bran.Dump 14.6 SF EEL Noell/Sal.Forever 11133034 htrc1550.961
1480 Misery Crk, (Elder Crk) 14.9 SF EEL Friedrichsen/ Steel 111.33042 htms1980.971
1779 Redwood Creek, Branscomb 14.9 SF EEL Hines/ G P Timber 111.33034 htrc1515.971
1430 Burns Crk, South Fork 15.0 SF EEL Dunklin ,HSU 111.31032 htbs1040.971
1472 Harper Crk, EF 15.2 SF EEL Dunklin, HSU 111.31032 htha497.971
1612 Redwood Crk @Bran.Dump 15.2 SF EEL Friedrichsen 111.33034 htrc1550.971
1469 Harper Creek 15.3 SF EEL Dunklin, HSU 111.31032 htha488.971
1785 Lampkins Creek 15.3 SF EEL Hines/ G P Timber 111.32054 htlp750.971
1468 Harper Creek 15.4 SF EEL Dunklin, HSU 111.31032 htha400.971
1108 Sproul W. Branch WF 15.5 SF EEL Horner/Barnum 11132070 htsr720.971
1116 Coulborn Creek 15.5 SF EEL Horner/Barnum 111.32053 htcb800.971
1782 Anderson Creek 15.5 SF EEL Hines/ G P Timb 111.32053 htan825.971
1105 Sproul, No name 15.9 SF EEL Horner/Barnum 11132070 htnn640.971
1456 Elder Creek (# 1) 15.9 SF EEL Friedrichsen/ Steel 111.33042 hted1880.971
1591 Mill Creek (Leggett) 15.9 SF EEL Goodfield/CDFG 111.32041 html680.961
1613 Redwood Crk. (Branscomb) 15.9 SF EEL Goodfield/CDFG 111.33034 htrc1460.961
1781 Indian Ck. abv Anderson Crk 15.9 SF EEL Hines/G P Timber 111.32053 htin820.971
2034 Michael's Creek 15.9 SF EEL Nadig/L.P. 111.32030 htme1370.961
1775 Moody Creek 16.0 SF EEL Hines/G.P. Timb 111.32054 htmo720.971
1591 Mill Creek (Leggett) 16.1 SF EEL Goodfield/CDFG 111.32041 html680.971
1117 Sebbas Creek 16.2 SF EEL Hines/G P Timb 111.32053 htsb700.971
1467 Harper Creek 16.2 SF EEL Dunklin, HSU 111.31032 htha260.971
1775 Moody Creek 16.2 SF EEL Hines/G.P. Timb 111.32054 htmo720.961
2032 Bond Creek 16.2 SF EEL Nadig / LP 111.32031 htbo1180.961
1305 Cow Creek 16.3 SF EEL Moody/Palco 11131030 htcw150.971
1305 Cow Creek 16.4 SF EEL Moody (PALCO) 111.31030 htcw200.961
1532 Cow Creek 16.4 SF EEL Jones/Cabrera 111.31030 htcw190.961
1457 Elder Creek (# 2) 16.5 SF EEL Friedrichsen/ Steel 111.33042 hted1750.971
1784 Sebbas Creek 16.5 SF EEL Horner/Barnum 111.32053 htsb760.971
1302 Squaw Creek 16.6 SF EEL Moody/Palco 111.31032 htsw240.971
1435 Cow Creek 16.6 SF EEL Dunklin, HSU 11131030 htcw205.971
1458 Elder Creek (# 3) 16.6 SF EEL Friedrichsen/ Steel 111.33042 hted1550.971
1412 Pollock Creek 16.7 SF EEL Goodfield/CDFG 111.32081 htpo671.971
1429 Burns Crk, North Fork 16.7 SF EEL Dunklin, HSU 111.31032 htbs840.971
1466 Harper Creek 16.7 SF EEL Dunklin, HSU 111.31032 htha250.971

EEL RVER WATER QUALITY MONITORING PROJECT (1996-97)HUMBOLDT COUNTY RESOURCE CONSERVATION DISTRICTSTATE WATER RESOURCES CONTROL BOARD, 205 (J)CONTRACT #5-029-250-2 PG. 59
SITE_ID
CREEK MWAT BASIN SURVEYOR CALWATER TXT FILE
1433 Cedar Creek 16.8 SF EEL Noell/Sal.Forever 111.32024 htce1480.971
1464 Rock Creek @ Leggett 16.8 SF EEL Noell/Sal.Forever 11132040 htrk960.971
1566 Jack of Hearts Creek 16.8 SF EEL Friedrichsen 111.33041 htja1400.971
COLD
1566 Jack of Hearts Creek 16.9 SF EEL Goodfield/CDFG 111.33041 htja1400.961
1540 Elder Creek (# 4) 17.0 SF EEL Friedrichsen/ Steel 111.33042 hted1440.971
1303 Canoe Creek 17.1 SF EEL Moody/Palco 111.31012 htca150.971
1577 Mud Creek 17.1 SF EEL Friedrichsen 111.33031 htmd1590.971
1773 Wildcat Creek 17.1 SF EEL Hines/G P Timer 111.32042 htsw600.961
1427 Burns Creek 17.2 SF EEL Dunklin, HSU 111.31032 htbs830.971
1431 Burns Crk, South Fork 17.2 SF EEL Dunklin, HSU 111.31032 htbs850.971
1479 Paralyze Creek 17.3 SF EEL Friedrichsen/Steel 111.33042 htpy1880.971
1772 Piercy Creek 17.3 SF EEL Terwilliger/CDFG 111.32052 htpi500.961
1407 Sproul Creek 17.4 SF EEL Goodfield/CDFG 111.32062 htsr520.971
1412 Pollock Creek 17.4 SF EEL Goodfield/CDFG 111.32081 htpo671.961
1534 Dutch Charlie Creek 17.4 SF EEL Friedrichsen 111.33034 htdc1400.971
1525 China Creek 17.5 SF EEL Goodfield/CDFG 111.32081 htch670.971
1533 Dutch Charlie Creek 17.5 SF EEL Noell/Sal.Forever 111.33034 htdc1430.961
1534 Dutch Charlie Creek 17.5 SF EEL Goodfield/CDFG 111.33034 htdc1400.961
1576 McCoy Creek 17.5 SF EEL Goodfield/CDFG 11132050 htmc540.971
1576 McCoy Creek 17.5 SF EEL Goodfield/CDFG 111.32050 htmc540.961
1409 Sproul Ck. West Fork 17.6 SF EEL Goodfield/CDFG 11132070 htsr530.971
1460 Elder Creek (# 5) 17.6 SF EEL Friedrichsen/ Steel 111.33042 hted1400.971
1477 Little Sproul Creek 17.7 SF EEL Goodfield/CDFG 111.32071 hdls420.971
1606 Piercy Creek 17.7 SF EEL Hines/G.P. Timber 111.32052 htpi520.961
1409 Sproul, WF 17.8 SF EEL Goodfield/CDFG 111.32070 htsr530.961
1461 Elder Creek (# 6) 17.8 SF EEL Friedrichsen 111.33042 hted1390.971
1522 Canoe Creek 17.8 SF EEL Nakamoto/USFS 111.31012 htca170.961
1636 SF Eel @ Branscomb 17.8 SF EEL Noell/Sal.Forever 111.33031 htsf1550.961
1658 SF Eel @ Branscomb 17.8 SF EEL Friedrichsen 111.33031 htsf1530.971
1773 Wildcat Creek 17.8 SF EEL Hines/G P Timber 111.32042 htwc600.971
1774 Standley Creek 17.8 SF EEL Hines/G P Timber 111.32051 htss560.971
1776 Bear Pen Crk 17.8 SF EEL Hines/GP Timber 111.32044 htbp550.961
1303 Canoe Creek 17.9 SF EEL Moody/PALCO 111.31012 htca169.961
1516 Bear Pen Crk. 17.9 SF EEL Noell/Sal.Forever 111.32044 htbp870.961
1541 Elk Creek (Miranda) 17.9 SF EEL Goodfield/CDFG 111.31011 htek180.971
1541 Elk Creek 18.0 SF EEL Nakamoto/USFS 111.31011 htek180.961
1774 Standley Creek 18.0 SF EEL Hines/GP Timber 111.32051 htss560.961
1776 Bear Pen Creek 18.0 SF EEL Hines/GP Timber 111.32044 htbp550.971

EEL RVER WATER QUALITY MONITORING PROJECT (1996-97)HUMBOLDT COUNTY RESOURCE CONSERVATION DISTRICTSTATE WATER RESOURCES CONTROL BOARD, 205 (J)CONTRACT #5-029-250-2 PG. 60
1540 Elder Creek 18.1 SF EEL Goodfield/CDFG 111.33042 hted1440.961
1447 Cuneo Crk, NF 18.3 SF EEL Dunklin/HSU 111.31032 htcn535.971
1658 SF Eel @ Branscomb 18.3 SF EEL Goodfield/CDFG 111.33031 htsf1530.961
SITE_ID
CREEK MWAT BASIN SURVEYOR CALWATER TXT FILE
1786 Indian Crk b Little Manus Ck 18.3 SF EEL Hines/G P Timber 111.32054 htin700.971
MODERATE
1528 Cuneo Creek 18.4 SF EEL Nakamoto/USFS 111.31032 htcn400.961
1572 Leggett Creek (Upper) 18.4 SF EEL Goodfield/CDFG 111.32084 htlg390.961
1577 Mud Creek 18.4 SF EEL Noell/Sal.Forever 111.33031 htmd1590.961
1450 Cuneo Creek 18.5 SF EEL Dunklin/HSU 111.31032 htcn590.971
1632 Seely Crk. @ Redwood 18.6 SF EEL Noell/Sal.Forever 111.32082 htse480.961
1572 Leggett Creek 18.7 SF EEL Goodfield/CDFG 111.32084 htlg390.971
1411 Little Sproul Creek 18.8 SF EEL Goodfield/CDFG 111.32071 htls460.971
1424 Burns Creek 18.8 SF EEL Dunklin/HSU 111.31032 htbs560.971
1445 Cuneo Creek 18.8 SF EEL Dunklin/HSU 111.31032 htcn520.971
1448 Cuneo Creek 18.8 SF EEL Dunklin/HSU 111.31032 htcn580.971
1525 China Creek 18.8 SF EEL Goodfield/CDFG 111.32081 htch670.961
1446 Cuneo Creek 18.9 SF EEL Dunklin/HSU 111.31032 htcn534.971
1592 Mill Creek (Salmon) 18.9 SF EEL Goodfield/CDFG 111.31012 htmi280.971
1411 Little Sproul Creek 19.2 SF EEL Goodfield/CDFG 111.32071 htls460.961
1476 Leggett Creek 19.2 SF EEL Goodfield/CDFG 111.32084 htlg270.971
1524 Cedar Creek 19.2 SF EEL Nakamoto/USFS 111.32024 htce780.961
1451 Cuneo Crk, SF 19.3 SF EEL Dunklin/HSU 111.31032 htcn595.971
1407 Sproul Creek 19.5 SF EEL Goodfield/CDFG 111.32062 htsr520.961
1408 Sproul Crk Camp Wirta 19.5 SF EEL Goodfield/CDFG 111.32071 htsr460.961
1518 Burns Creek 19.5 SF EEL Jones/Cabrera 111.31032 htbs0470.961
1592 Mill Creek (Salmon) 19.6 SF EEL Goodfield/CDFG 111.31012 htmi280.961
1463 Elk Crk., (Rattlesnake) 19.7 SF EEL Goodfield/CDFG 111.32012 htec1400.971
1646 Ten Mile Creek (Upper) 19.7 SF EEL Friedrichsen 11133010 httm1700.971
1408 Sproul Crk Camp Wirta 19.8 SF EEL Goodfield/CDFG 111.32071 htsr460.971
1453 Cuneo Crk, SF 19.8 SF EEL Dunklin/HSU 111.31032 htcn755.971
1337 Cuneo Creek 19.9 SF EEL Moody/Palco 111.31032 htcn650.971
1608 Rattlesnake @ Bell Springs 20.0 SF EEL Noell/Sal.Forever 111.32012 htra1355.971
1511 Bull Creek 20.1 SF EEL Dunklin, HSU 111.31032 htbl390.971
1611 Rattlesnake Creek 20.1 SF EEL Goodfield/CDFG 111.32012 htra1400.961
1413 Sproul Creek 20.4 SF EEL Nakamoto/USFS 111.32071 htsr360.961
1413 Sproul Creek 20.4 SF EEL Goodfield/CDFG 111.32071 htsr360.971
1419 Bull Creek 20.4 SF EEL Dunklin, HSU 111.31032 htbl394.971
1558 Foster Creek 20.4 SF EEL Goodfield/CDFG 111.32013 htfo1180.961
1635 SF Eel below Elder 20.4 SF EEL Noell/Sal.Forever 111.33042 htsf1150.961
1646 Ten Mile Crk ( Laytonville) 20.4 SF EEL Nightgoose 111.33010 httm1700.961

EEL RVER WATER QUALITY MONITORING PROJECT (1996-97)HUMBOLDT COUNTY RESOURCE CONSERVATION DISTRICTSTATE WATER RESOURCES CONTROL BOARD, 205 (J)CONTRACT #5-029-250-2 PG. 61
1542 Elk Crk. (Rattlesnake) 20.5 SF EEL Goodfield/CDFG 111.32012 htec1280.971
1513 Bull Creek 20.6 SF EEL Nakamoto/USFS 111.31030 htbl110.961
1565 Indian Creek 20.6 SF EEL Nakamoto/USFS 111.32054 htin510.861
1608 Rattlesnake @ Bell Springs 20.6 SF EEL Noell/Sal.Forever 111.32012 htra1355.961
1657 SF Eel above Elder 20.6 SF EEL Friedrichsen 111.33042 htsf1200.971
SITE_ID
CREEK MWAT BASIN SURVEYOR CALWATER TXT FILE
1524 Cedar Creek 20.7 SF EEL Noell/Sal.Forever 111.32024 htce780.971
1426 Burns Creek 20.8 SF EEL Dunklin, HSU 111.31032 htbs720.971
1575 Low Gap Crk (Piercy) 20.8 SF EEL Noell/Sal.Forever 11132022 htlw540.961
1417 Bull Creek 20.9 SF EEL Dunklin, HSU 11131030 htbl116.971
1440 Cuneo Crk, SF 20.9 SF EEL Dunklin, HSU 111.31032 htcn1080.971
1518 Burns Creek 20.9 SF EEL Dunklin, HSU 111.31032 htbs470.971
1558 Foster Creek 21.0 SF EEL Goodfield/CDFG 111.32013 htfo1220.961
1463 Elk Crk, (Rattlesnake) 21.0 SF EEL Goodfield/CDFG 111.32012 htec1400.961
1542 Elk Crk (Rattlesnake) 21.1 SF EEL Goodfield/CDFG 111.32012 htec1280.961
1557 Foster Creek 21.1 SF EEL Goodfield/CDFG 111.32013 htfo1220.971
1441 Cuneo Crk, SF 21.3 SF EEL Dunklin, HSU 111.31032 htcn1240.971
1590 Mill Creek 21.4 SF EEL Jones/Cabrera 111.31032 html330.961
1617 Redwood Creek 21.4 SF EEL Goodfield/CDFG 111.32081 htre500.961
1609 Rattlesnake Creek 21.5 SF EEL Noell/Sal.Forever 111.32013 htra1080.971
1630 Salmon Creek, So. Fk. 21.5 SF EEL Goodfield/CDFG 11131020 htsc200.971
1535 Dean Creek 21.6 SF EEL Goodfield/CDFG 111.32083 htde400.961
1621 Red Mountain Creek 21.6 SF EEL Goodfield/CDFG 111.32044 htrm550.961
1778 Hollow Tree Creek (Lower) 21.6 SF EEL Hines/G.P. Timber 111.32032 htho800.961
1565 Indian Creek (Lower) 21.9 SF EEL Hines/G P Timber 111.32054 htin510.971
1628 Salmon Creek 21.9 SF EEL Goodfield/CDFG 111.31012 htsa200.971
1778 Hollow Tree Creek (Lower) 21.9 SF EEL Hines/ G P Timber 111.32032 htho800.971
1449 Cuneo Creek 22.0 SF EEL Dunklin, HSU 111.31032 htcn585.971
1563 Hollow Tree Creek 22.0 SF EEL Nakamoto/USFS 111.32032 htho750.961
WARM
1562 Hollow Tree Crk. 22.2 SF EEL Noell/Sal.Forever 111.32032 htho740.961
1609 Rattlesnake @ Cummings 22.2 SF EEL Noell/Sal.Forever 111.32013 htra1080.961
1512 Bull Creek 22.3 SF EEL Jones/Cabrera 111.31032 htbl391.961
1637 SF Eel @ Piercy Crk. 22.5 SF EEL Terwilliger/CDFG 111.32052 htsf500.961
1538 East Branch 22.7 SF EEL Goodfield/CDFG 111.32062 hteb850.971
1610 Rattlesnake Creek 22.7 SF EEL Goodfield/CDFG 111.32013 htra870.971
1610 Rattlesnake Creek 22.8 SF EEL Nakamoto/USFS 111.32013 htra870.961
1616 Redwood Creek 22.8 SF EEL Nakamoto/USFS 111.32081 htre310.961
1535 Dean Creek 22.9 SF EEL Nakamoto/USFS 111.32083 htde280.961
1614 Redwood Crk. (Wally's) 23.0 SF EEL Noell/Sal.Forever 111.32082 htre340.971
1539 East Branch 23.1 SF EEL Goodfield/CDFG 111.32065 hteb410.961
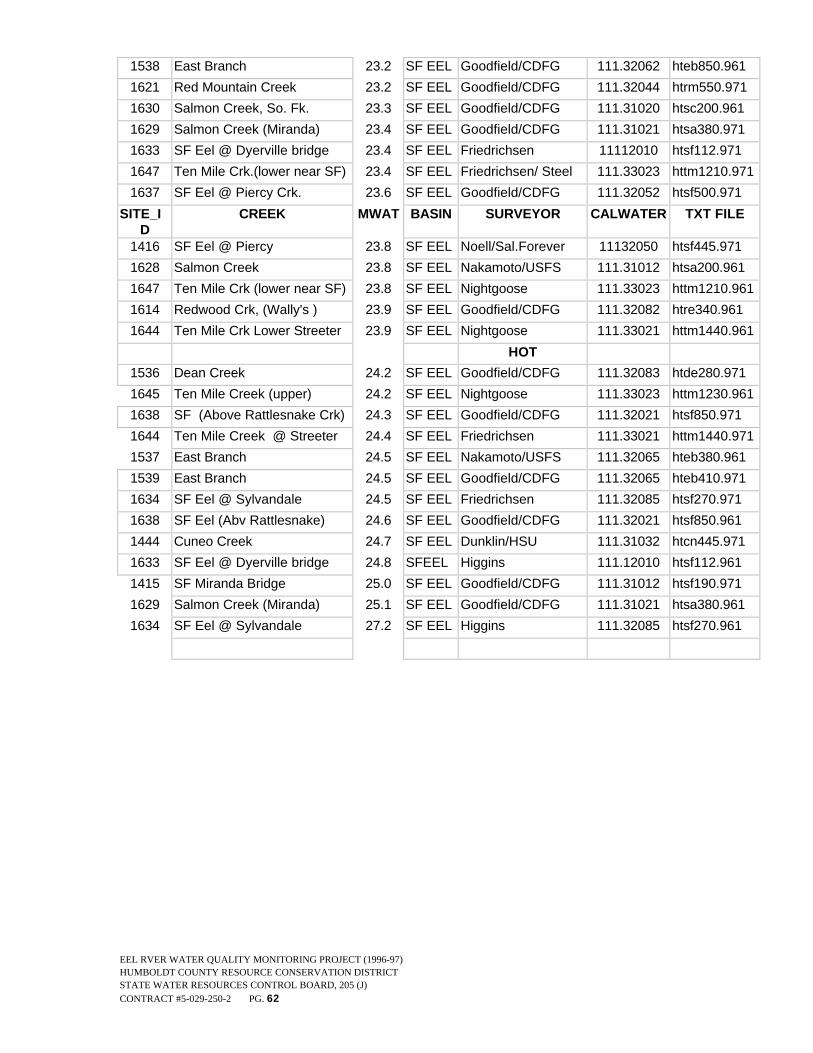
EEL RVER WATER QUALITY MONITORING PROJECT (1996-97)HUMBOLDT COUNTY RESOURCE CONSERVATION DISTRICTSTATE WATER RESOURCES CONTROL BOARD, 205 (J)CONTRACT #5-029-250-2 PG. 62
1538 East Branch 23.2 SF EEL Goodfield/CDFG 111.32062 hteb850.961
1621 Red Mountain Creek 23.2 SF EEL Goodfield/CDFG 111.32044 htrm550.971
1630 Salmon Creek, So. Fk. 23.3 SF EEL Goodfield/CDFG 111.31020 htsc200.961
1629 Salmon Creek (Miranda) 23.4 SF EEL Goodfield/CDFG 111.31021 htsa380.971
1633 SF Eel @ Dyerville bridge 23.4 SF EEL Friedrichsen 11112010 htsf112.971
1647 Ten Mile Crk.(lower near SF) 23.4 SF EEL Friedrichsen/ Steel 111.33023 httm1210.971
1637 SF Eel @ Piercy Crk. 23.6 SF EEL Goodfield/CDFG 111.32052 htsf500.971
SITE_ID
CREEK MWAT BASIN SURVEYOR CALWATER TXT FILE
1416 SF Eel @ Piercy 23.8 SF EEL Noell/Sal.Forever 11132050 htsf445.971
1628 Salmon Creek 23.8 SF EEL Nakamoto/USFS 111.31012 htsa200.961
1647 Ten Mile Crk (lower near SF) 23.8 SF EEL Nightgoose 111.33023 httm1210.961
1614 Redwood Crk, (Wally's ) 23.9 SF EEL Goodfield/CDFG 111.32082 htre340.961
1644 Ten Mile Crk Lower Streeter 23.9 SF EEL Nightgoose 111.33021 httm1440.961
HOT
1536 Dean Creek 24.2 SF EEL Goodfield/CDFG 111.32083 htde280.971
1645 Ten Mile Creek (upper) 24.2 SF EEL Nightgoose 111.33023 httm1230.961
1638 SF (Above Rattlesnake Crk) 24.3 SF EEL Goodfield/CDFG 111.32021 htsf850.971
1644 Ten Mile Creek @ Streeter 24.4 SF EEL Friedrichsen 111.33021 httm1440.971
1537 East Branch 24.5 SF EEL Nakamoto/USFS 111.32065 hteb380.961
1539 East Branch 24.5 SF EEL Goodfield/CDFG 111.32065 hteb410.971
1634 SF Eel @ Sylvandale 24.5 SF EEL Friedrichsen 111.32085 htsf270.971
1638 SF Eel (Abv Rattlesnake) 24.6 SF EEL Goodfield/CDFG 111.32021 htsf850.961
1444 Cuneo Creek 24.7 SF EEL Dunklin/HSU 111.31032 htcn445.971
1633 SF Eel @ Dyerville bridge 24.8 SFEEL Higgins 111.12010 htsf112.961
1415 SF Miranda Bridge 25.0 SF EEL Goodfield/CDFG 111.31012 htsf190.971
1629 Salmon Creek (Miranda) 25.1 SF EEL Goodfield/CDFG 111.31021 htsa380.961
1634 SF Eel @ Sylvandale 27.2 SF EEL Higgins 111.32085 htsf270.961
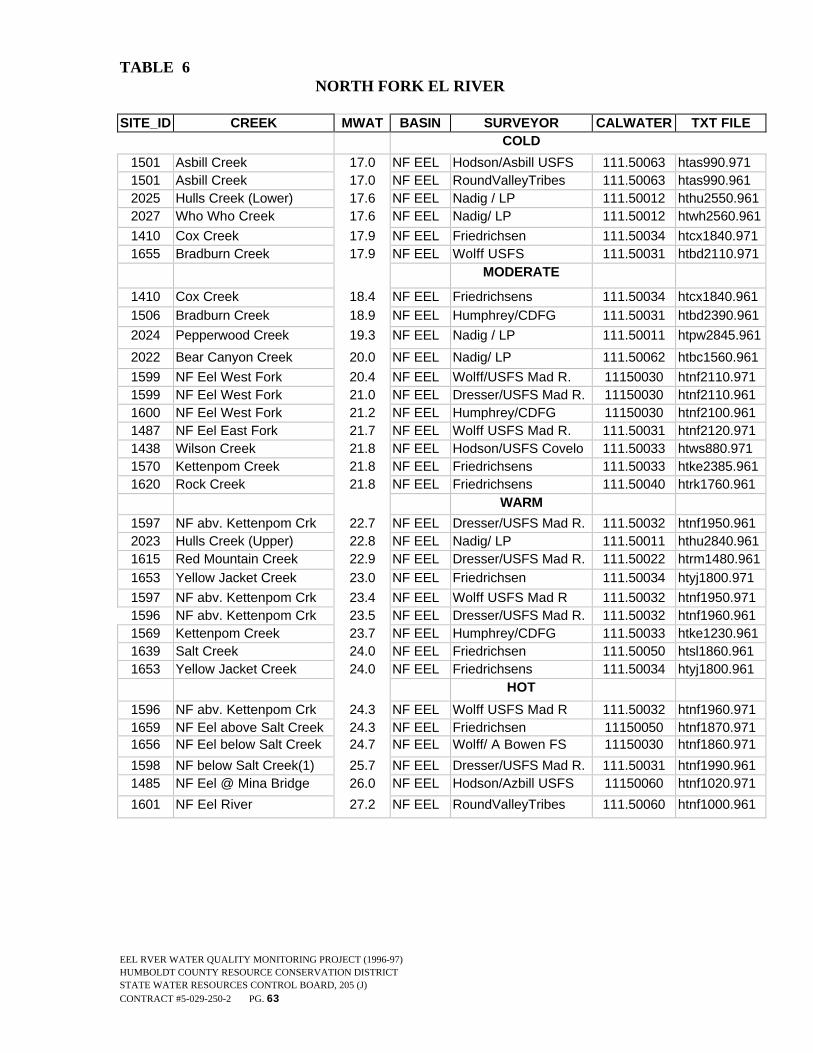
EEL RVER WATER QUALITY MONITORING PROJECT (1996-97)HUMBOLDT COUNTY RESOURCE CONSERVATION DISTRICTSTATE WATER RESOURCES CONTROL BOARD, 205 (J)CONTRACT #5-029-250-2 PG. 63
TABLE 6NORTH FORK EL RIVER
SITE_ID CREEK MWAT BASIN SURVEYOR CALWATER TXT FILECOLD
1501 Asbill Creek 17.0 NF EEL Hodson/Asbill USFS 111.50063 htas990.9711501 Asbill Creek 17.0 NF EEL RoundValleyTribes 111.50063 htas990.9612025 Hulls Creek (Lower) 17.6 NF EEL Nadig / LP 111.50012 hthu2550.9612027 Who Who Creek 17.6 NF EEL Nadig/ LP 111.50012 htwh2560.961
1410 Cox Creek 17.9 NF EEL Friedrichsen 111.50034 htcx1840.9711655 Bradburn Creek 17.9 NF EEL Wolff USFS 111.50031 htbd2110.971
MODERATE
1410 Cox Creek 18.4 NF EEL Friedrichsens 111.50034 htcx1840.9611506 Bradburn Creek 18.9 NF EEL Humphrey/CDFG 111.50031 htbd2390.961
2024 Pepperwood Creek 19.3 NF EEL Nadig / LP 111.50011 htpw2845.961
2022 Bear Canyon Creek 20.0 NF EEL Nadig/ LP 111.50062 htbc1560.961
1599 NF Eel West Fork 20.4 NF EEL Wolff/USFS Mad R. 11150030 htnf2110.9711599 NF Eel West Fork 21.0 NF EEL Dresser/USFS Mad R. 11150030 htnf2110.9611600 NF Eel West Fork 21.2 NF EEL Humphrey/CDFG 11150030 htnf2100.9611487 NF Eel East Fork 21.7 NF EEL Wolff USFS Mad R. 111.50031 htnf2120.9711438 Wilson Creek 21.8 NF EEL Hodson/USFS Covelo 111.50033 htws880.9711570 Kettenpom Creek 21.8 NF EEL Friedrichsens 111.50033 htke2385.9611620 Rock Creek 21.8 NF EEL Friedrichsens 111.50040 htrk1760.961
WARM
1597 NF abv. Kettenpom Crk 22.7 NF EEL Dresser/USFS Mad R. 111.50032 htnf1950.9612023 Hulls Creek (Upper) 22.8 NF EEL Nadig/ LP 111.50011 hthu2840.9611615 Red Mountain Creek 22.9 NF EEL Dresser/USFS Mad R. 111.50022 htrm1480.9611653 Yellow Jacket Creek 23.0 NF EEL Friedrichsen 111.50034 htyj1800.971
1597 NF abv. Kettenpom Crk 23.4 NF EEL Wolff USFS Mad R 111.50032 htnf1950.9711596 NF abv. Kettenpom Crk 23.5 NF EEL Dresser/USFS Mad R. 111.50032 htnf1960.9611569 Kettenpom Creek 23.7 NF EEL Humphrey/CDFG 111.50033 htke1230.9611639 Salt Creek 24.0 NF EEL Friedrichsen 111.50050 htsl1860.9611653 Yellow Jacket Creek 24.0 NF EEL Friedrichsens 111.50034 htyj1800.961
HOT
1596 NF abv. Kettenpom Crk 24.3 NF EEL Wolff USFS Mad R 111.50032 htnf1960.9711659 NF Eel above Salt Creek 24.3 NF EEL Friedrichsen 11150050 htnf1870.9711656 NF Eel below Salt Creek 24.7 NF EEL Wolff/ A Bowen FS 11150030 htnf1860.971
1598 NF below Salt Creek(1) 25.7 NF EEL Dresser/USFS Mad R. 111.50031 htnf1990.9611485 NF Eel @ Mina Bridge 26.0 NF EEL Hodson/Azbill USFS 11150060 htnf1020.971
1601 NF Eel River 27.2 NF EEL RoundValleyTribes 111.50060 htnf1000.961

EEL RVER WATER QUALITY MONITORING PROJECT (1996-97)HUMBOLDT COUNTY RESOURCE CONSERVATION DISTRICTSTATE WATER RESOURCES CONTROL BOARD, 205 (J)CONTRACT #5-029-250-2 PG. 64
TABLE 7MIDDLE FORK EEL RIVER
SITE_ID
CREEK MWAT BASIN SURVEYOR CALWATER TXT FILE
VERY COLD
2067 Smokehouse Creek 14.3 MF EEL Nadig / LP 111.63050 HTSM3520.961
COLD
1502 Baldy Creek 17.8 MF EEL Burgess/Furrer USFS 111.73021 htba2800.971
1622 MF Eel @ Robinson 17.9 MF EEL Widman/Wallace FS 111.74011 htmf5082.971
1654 Black Butte (upper) 17.9 MF EEL Burgess/Furrer USFS 111.73021 htbb3360.971
1520 Beaver Creek 18.2 MF EEL Jones/Widman/Brun 111.74040 HTBV2360.961
1526 Cold Creek 18.2 MF EEL Furrer/Avila 111.73020 HTCL2520.961
MODERATE
1502 Baldy Creek 18.4 MF EEL Furrer/Avila 111.73021 HTBA2800.961
1581 MF Eel @ Fern Pt. Pool 18.4 MF EEL Harris CDFG 111.74031 htmf3894.971
1520 Beaver Creek 18.7 MF EEL Harris/CDFG 11174040 htbv2360.971
1641 Spanish Creek 18.7 MF EEL Hodson/Furrer/Avila 111.73011 HTSP3320.961
1526 Cold Creek 18.8 MF EEL Hodson/Azbill USFS 11173020 htcl2520.971
1556 Fly Creek 19.0 MF EEL Jones/Brun/Widman 111.74041 HTFL2120.961
1593 Mendenhall Creek 19.0 MF EEL Hodson/Burgess 111.71011 HTMN2630.961
2064 Crocker Creek 19.0 MF EEL Nadig / LP 111.71012 HTCR3120.961
1587 MF, @ WrightsVl.bel.falls 19.1 MF EEL Widman/Ryan 111.74012 HTMF3861.961
1402 Buckhorn Creek 19.2 MF EEL Burgess/Furrer USFS 111.73021 htbk2880.971
1402 Buckhorn Creek 19.2 MF EEL Hodson/Furrer/Burgess 111.73021 HTBK2880.961
1504 Black Butte (upper) 19.3 MF EEL Hodson/Furrer/Avila 111.73021 HTBB3380.961
1593 Mendenhall Creek 19.4 MF EEL Hodson/Burgess FS 111.71011 htmn2630.971
1587 MF @ WrightsVl.bel.falls 19.5 MF EEL Hodson/Widman FS 111.74012 htmf3861.971
2065 Sulphur Springs Creek 19.6 MF EEL Nadig /LP 111.71012 HTSU2560.961
1585 MF Eel, North Fork 19.7 MF EEL Jones/Brun/Widman 111.74022 HTMF1080.961
1589 Willow Creek 19.7 MF EEL Burgess/Avila USFS 111.74021 htww1220.971
1568 Jumpoff Creek 19.8 MF EEL Hodson/Furrer USFS 111.73042 htju1640.971
1585 MF Eel, North Fork 19.9 MF EEL Harris/CDFG 111.74022 htmf1080.971
1623 Rattlesnake Creek, MF 19.9 MF EEL Jones/Brun/Widman 111.74030 HTRA2870.961
1514 Balm of Gilead Creek 20.0 MF EEL Hodson/Widman FS 111.74014 htbm4300.971
1514 Balm of Gilead Creek 20.0 MF EEL Widman/Ryan 111.74014 HTBM2800.961
1589 Willow Crk @MF. NF 20.0 MF EEL Widman/Ryan 111.74021 htww1220.961
1623 Rattlesnake Creek 20.3 MF EEL Harris/CDFG 11174030 htrt2870.971
1581 MF Eel @ Fern Pt Pool 20.4 MF EEL Jones/Brun/Widman 111.74031 HTMF3894.961
1582 MF Eel @ Fern Pt Riffle 20.6 MF EEL Jones/Brun/Widman 111.74031 HTMF3895.961
1582 MF Eel @ Fern Pt. Riffle 20.7 MF EEL Harris/CDFG 111.74031 htmf3895.971
1588 MF, @ WrightsVl.abv.falls 20.8 MF EEL Hodson/Widman FS 111.74012 htmf4158.971
1588 MF, @ WrightsVl.abv.falls 20.9 MF EEL Widman/Ryan 111.74012 HTMF4158.961

EEL RVER WATER QUALITY MONITORING PROJECT (1996-97)HUMBOLDT COUNTY RESOURCE CONSERVATION DISTRICTSTATE WATER RESOURCES CONTROL BOARD, 205 (J)CONTRACT #5-029-250-2 PG. 65
1503 Black Butte (middle) 21.1 MF EEL Avila/Azbill/Hodson FS 11173040 htbb2230.971
SITE_ID
CREEK MWAT BASIN SURVEYOR CALWATER TXT FILE
1503 Black Butte (middle) 21.2 MF EEL Hodson/Burgess 111.73040 HBBI2230.961
1624 Rattlesnake Pool 21.2 MF EEL Jones/Brun/Widman 111.74030 HTRA3000.961
2028 Murphy Creek 21.4 MF EEL Nadig/L.P. 111.72011 HTMU1920.961
1568 Jumpoff Creek 21.7 MF EEL Furrer/Burgess 111.73042 HTJU1640.961
1583 MF Eel @ Osborn Pool 21.8 MF EEL Harris/CDFG 111.74042 htmf2151.971
1583 MF Eel @ Osborn Pool 21.8 MF EEL Jones/Brun/Widman 111.74042 HTMF2151.961
1584 MF Eel @ Osborn Riffle 21.8 MF EEL Jones/Brun/Widman 111.74042 HTMF2150.961
1624 Rattlesnake Pool 21.8 MF EEL Harris/CDFG 11174030 htrt3000.971
1625 Rattlesnake Riffle 21.8 MF EEL Jones/Brun/Widman 111.74030 HTRA3001.961
1584 MF Eel @ Osborn Riffle 22.0 MF EEL Harris/CDFG 111.74042 htmf2150.971
WARM
1586 MF Eel (upper) 22.3 MF EEL Widman/Ryan 111.74011 HTMF4160.961
1625 Rattlesnake Riffle 22.3 MF EEL Harris/CDFG 11174030 htrt3001.971
2043 Eastman Creek 22.5 MF EEL Nadig / LP 111.71044 HTEA920.961
1622 MF Eel @ Robinson 24.0 MF EEL Widman/Ryan/Hurt 111.74011 HTMF5082.961
HOT
2047 Salt Creek 24.3 MF EEL Nadig / LP 111.71043 HTST1030.961
1578 MF Eel above Black Butte 24.5 MF EEL Hodson/USFS Covelo 111.74043 htmf1470.971
1643 Thatcher Creek 24.5 MF EEL Burgess/Furrer 111.71033 HTTH1160.961
1578 MF Eel above Black Butte 24.7 MF EEL Brun/Jones 111.74043 HTMF1470.961
1505 Black Butte (lower) 25.0 MF EEL Harris/CDFG 111.73043 htbb1460.971
1594 Mill Creek (upper) 25.0 MF EEL Higgins/Ray 111.72040 HTMP1440.961
1543 Elk Creek, MF 25.4 MF EEL Furrer/Burgess 111.71025 HTEK1150.961
1643 Thatcher Creek 25.5 MF EEL Burgess/Furrer USFS 111.71033 htth1160.971
1505 Black Butte (lower) 25.7 MF EEL Hodson/Smith 111.73043 HTBB1460.961
1543 Elk Creek, MF 26.4 MF EEL Burgess/Furrer USFS 111.71025 htel1150.971
1580 MF Eel above Thatcher 26.4 MF EEL Burgess/Furrer USFS 111.71035 htmf1155.971
1580 MF Eel above Thatcher 26.9 MF EEL Furrer/Burgess 111.71035 HTMF1155.961
Other researchers, restoration planners, and watershed managers should refer to theverified and validated text file data to conduct their own specific analysis regarding theirindividual interest in the Eel River.
EEL RVER WATER QUALITY MONITORING PROJECT (1996-97)HUMBOLDT COUNTY RESOURCE CONSERVATION DISTRICTSTATE WATER RESOURCES CONTROL BOARD, 205 (J)CONTRACT #5-029-250-2 PG. 66
SEDIMENTATION AND TEMPERATURE:
California Department of Fish and Game produced a Final Draft of The Eel River Salmon andSteelhead Restoration Action Plan (Downie 1997) which acknowledges ten general actions thatcorrelate to the ten identified types of problems currently facing the Eel River. The two primaryactions recommended in this document are (1) reduce watershed erosion and (2) improve fishhabitat and riparian areas. Increased sediment yields and degradation of stream canopy as theyrelate to elevated temperatures have been correlated and corroborated by several authors (Payne, etal.1970, Kubicek 1977, and Brown 1980). Elevated sediment loads displace pools (Lisle 1982),contribute to channel destabilization and can cause streams to widened into an abraded conditionand/or flow sub-surface (Kelsey 1977).
Loss of stream side canopy is one of the most significant contributors to elevated temperatures inforest settings (Brown 1980). This is also apparent when reviewing temperature models such asSSTEMP (Bartholow 1997) where simulated loss of the riparian would correspond to a relativerise in temperature downstream.
The 1955 and 1964 storm runoff events are repeatedly blamed for these excessive depositions.After periods of lower rainfall, stored sediments and debris from human activities and naturalevents await delivery to the streams. Big events, such as the 1964 flood, trigger the flow of thesematerials from various contributors (Weaver and Hagans 1996).
Watershed Analyses (WA’s) have been completed for four sub-basins in the Eel River system.These include; South Fork (Fuller et al. 1996), North Fork (USFS 1996), Middle Fork(USFS/BLM 1994), and, most recently, the Van Duzen River (USFS In press). In addition, aPreliminary Watershed Assessment was compiled for the upper Main Stem Eel River in 1994(USDA, USFS 1994). Without exception, these documents support the CDF&G’s findings thatpresent sediment yields contribute to poor water quality in this basin. Historic and geologicinformation would demonstrate that the mainstem and many tributaries of the Eel River have lostpool depth and stream complexity. One of the most pronounced examples of this type of change isin evidence in the lower reaches of Bull Creek which gained 8 feet of sediment and the adjacentsection of the South Fork Eel River which had gained 33feet of deposition between 1963 and 1986(Downie 1992). The sediment yield is now judged to be in relative balance but in an aggradedform (Payne, et al. 1970).
Present conditions throughout the Eel River can be summarized as follows ( USFS ????):a. Degradation of water quality has resulted from the cumulative effects of increased
sediment load from natural geologic conditions (i.e. mass wasting/slumps and highfluvial erosion that has resulted from the combination of uplifting incompetent bedrockand marine terraces and the down-cutting of stream channels into these soft, erodiblematerials)
b. Degradation of water quality has resulted from the cumulative effects of increasedsediment load from human disturbance (i.e. road related activities, timber harvestingactivities, grazing, and development) and loss or degradation of the riparian zone as theresult of past and present land management practices.
As pointed out by Kubicek (1977) there are many contributing factors to stream temperature. Airtemperature, relative humidity, orientation, substrate color, riparian canopy and channelmorphology to name a few. Of these, only two can be dealt with in a remedial setting. Bothriparian canopy and channel morphology are subject to human intervention, therefore, all sites

EEL RVER WATER QUALITY MONITORING PROJECT (1996-97)HUMBOLDT COUNTY RESOURCE CONSERVATION DISTRICTSTATE WATER RESOURCES CONTROL BOARD, 205 (J)CONTRACT #5-029-250-2 PG. 67
identified for restoration will be addressed in terms of the decreased sediment yield (improvementof channel morphology) or remedial riparian activities when justified by ranking criteria.

EEL RVER WATER QUALITY MONITORING PROJECT (1996-97)HUMBOLDT COUNTY RESOURCE CONSERVATION DISTRICTSTATE WATER RESOURCES CONTROL BOARD, 205 (J)CONTRACT #5-029-250-2 PG. 68
PRIORITY RANKING SCHEME:
HCRCD has incorporated a priority ranking scheme based on the framework set forth inHealing the Watershed , a workbook developed by the Pacific Rivers Council for Oregon.This framework is based on theoretical models that maintain the cost effective value ofsaving the best habitat in the watershed and designing future restoration work aroundthese "island" of health habitat. The concept being that preserved habitat will serve asrefuge for natural climax community structure and would then more easily spread intoadjacent areas in the watershed as those areas reach that progressive stage.
Important aspects of priority ranking criteria in the Eel River Basin include:
A. Temperature information from this study (low MWAT value).Cooler stream temperatures generally denote higher water quality and a higherbeneficial use. Streams will score a 5-1 point value based on the scale above. (I.e. avalue of (4) would correspond to an MWAT between 16.9 and 18.3 degrees Celsius).
B. Aquatic invertebrate data reported in this study will be used when ranking streamsthat have been assessed for macro-invertebrates. An example would be the use ofspecies diversity as an indicator of water quality. Generally higher species diversityequates to higher water quality. Macroinvertebrates would be referenced on a 5-1point scale where (5) would correspond to high species diversity and 1 extremely lowspecies diversity. Other metrics could also be used. (The usefulness of aquatic insectsfor judging water quality in the Pacific Northwest needs further refinement andaccepted state protocols, Lee, personal communication).
C. Other available biological information. (i.e. habitat typing information and fishpresence/absence (CDFG) (7-1 point scale).
D. Landowner Access (10-1 point scale). In that the Eel River is, predominantly,
privately owned this criteria can (and should) receive higher point value. E. Cost/Benefit Ratio. This ranking tool would specify the quantity of the work
considered and the benefit to the resources vs. the amount of funds necessary tocomplete the task (5-1 point scale).
F. Match Availability. Based on cooperator shared expense, either in-kind service or
monetary. (5-1 point scale).
The temperature and aquatic insect information gathered over the course of this program givesthe HCRCD and other resource planners within the Eel River Basin a first line of organization bybasin to help identify the refuge areas that need protection and restoration.
EEL RVER WATER QUALITY MONITORING PROJECT (1996-97)HUMBOLDT COUNTY RESOURCE CONSERVATION DISTRICTSTATE WATER RESOURCES CONTROL BOARD, 205 (J)CONTRACT #5-029-250-2 PG. 69
ANTICIPATED PREVENTIVE AND CORRECTIVE ACTIVITIES:
The following is a listing of general activities that would enhance/improve water quality inthe Eel River. These techniques, and others, will be employed by the HCRCD in thecoming years to help address high sediment yield, elevated temperature, and deterioratedriparian systems.
(1) Sediment source assessment and control:A. Road inventory and assessment- continued support of these activities on private
lands is pivotal to assisting land owners define, prioritize ,and control road relatederosion on their lands.
B. Road upgrading and storm proofing- stream crossing and culvert upgrading, surfacedrainage improvements, removal of unstable side-cast materials, installation ofcritical dips and culvert inlet and outlet protection.
C. Road removal- road ripping and decompaction, excavation of unstable fill, removalof stream crossings (i.e. culverts or Humboldt type), revegetation and mulchingwhere applicable.
D. Road maintenance- installation of rolling dips, water bars or cross-road drains,corrective treatment to all water crossings, out-sloping, and removal of old side castmaterials.
E. Road construction and reconstruction, guidance for new road construction shouldinvolve planning, location design, and construction elements provided to landowners in accordance with the Handbook for Forest and Ranch Roads (Weaver andHagans, 1994). This handbook, produced by Pacific Watershed Associates for theMendocino RCD, California Department of Forestry, and NRCS will be madeavailable to all cooperators the HCRCD contract with for restoration assistance.
F. Gully stabilization- while not always road related (Heede 1976), a high percentageof gullying can be traced back to poor road construction, maintenance, orabandonment. Corrective measures include: re-diversion of flow back into naturalchannel, flow diversion techniques, porous grade control structures such asvegetative and rock check dams, headcut control structures, and revegetation ofchannel banks. These techniques reduce energy of the flowing water and allowdeposition of sediments prior to their arrival in anadromous habitat.
(2) Riparian and stream channel management and restoration:Healthy riparian zones have been identified as a major contributor to reducing streamtemperatures, reducing sediment delivery, maintaining channel complexity, andsupplying the large woody debris (necessary for cover, distribution of spawninggravels, and scour pool production).
A. Riparian restoration- revegetation of native plants (including hardwoods and conifers)to aid in soil stabilization, thinning willow and/or alder stands to allow conifer growth,bank stabilization (rock armor, tree revetment, or vegetation mattress, placement oflog/boulder structures), and channel control structures like willow waddles/baffles
B. Limiting access of livestock to riparian corridors- exclusionary fencing can greatlyimprove riparian conditions in the upslope range habitats. This method can prove costprohibitive for landowners both initially (for installation) and over time (for
EEL RVER WATER QUALITY MONITORING PROJECT (1996-97)HUMBOLDT COUNTY RESOURCE CONSERVATION DISTRICTSTATE WATER RESOURCES CONTROL BOARD, 205 (J)CONTRACT #5-029-250-2 PG. 70
maintenance). However, new types of fencing and riparian zone grazing rotations areproviding more choices for range managers.
In some instances this work can be done simultaneous to upslope treatments, but BestManagement Practices (BMPs) would indicate the need to start at the ridge line whenplanning restoration activities in a watershed.
Support for conscientious and management in upslope habitat will lessen the disturbanceto soil and help promote healthy land stewardship. When requested, the HCRCD and theother RCDs will assist landowners with their management planning with regard towatershed effects of their timber harvest, livestock rotation, and road construction.The HCRCD has initiated outreach and education efforts throughout the Eel River. At thistime, the HCRCD is scheduling eight watershed stewardship workshops for the purpose ofexposing the landowners to present day techniques and resources with which toaccomplish proactive land management . These workshops will generate dialoguebetween the RCDs and the landowners and continue the long range goals of the RCDs inthe Eel River.
EEL RVER WATER QUALITY MONITORING PROJECT (1996-97)HUMBOLDT COUNTY RESOURCE CONSERVATION DISTRICTSTATE WATER RESOURCES CONTROL BOARD, 205 (J)CONTRACT #5-029-250-2 PG. 71
FUTURE ASSESSMENT AND MONITORING OF STREAM TEMPERATURE:
The EPA has expressed it’s support for monitoring and “.. seeing that the data collectionefforts are systematized so that inferences can be made of the spatial and temporal extentof stream temperature problems and better understand its relationship to past, present, andfuture land uses within basins” (Ralph, 1998).
The HCRCD’s rationale for further assessment:a. continued temperature monitoring in selected sub-basins may show trends over
time, allow for refinement of data analysis, and improve the selection processfor the restoration activities.
b. continued sediment source inventory/assessments in priority sub-basins, when
project implementation is eminent, is necessary for prioritization andbudgeting.
c. construction of sediment budgets for all fish bearing streams can provideuseful information in deciphering biological impacts and the TMDL process.
With EPA funding, the HCRCD is continuing the temperature monitoring in the Eel Riverduring the 1998 field season. This work will provide additional data to the present baseline information presented here and contained in historical studies by Kubicek (1977),USGS (Blodgett, 1970), Pacific Gas and Electric, (Steiner,1996), and others.
Dr. Tim Lewis, director of the Forest Science Project, is using this information forregional studies of habitat and water temperatures. Generally, all efforts to standardizemonitoring methodologies, protocols, and analysis will improve the dialogue betweenwatershed management entities and provide the basis for accountability of futurerestoration activities.

EEL RVER WATER QUALITY MONITORING PROJECT (1996-97)HUMBOLDT COUNTY RESOURCE CONSERVATION DISTRICTSTATE WATER RESOURCES CONTROL BOARD, 205 (J)CONTRACT #5-029-250-2 PG. 72
Task 6 Implementation, Institutional, and Financial Plan
Sub-task 6.1 Implementation Plan
With this grant, the HCRCD has established a network of landowners, volunteers, andagencies that have committed themselves to the long term effort of improving waterquality in the Eel River system. With an eye towards increasing the cooperation from theprivate sector, the HCRCD intends to work with all organized stakeholders in the basin,with the other Resource Conservation Districts and with watershed coordinators in the EelRiver drainage.
The Resource Conservation Districts with the major portion of the Eel River systeminclude: HCRCD, Trinity RCD, Mendocino RCD, and West Lake RCD (Lake Co.). Atpresent, these RCDs have cooperated in submitting a planning grant request to the StateWater Resources Control Board. The RCDs form a natural interface for exchange ofideas, technology, and funding from State and Federal granting entities to the individuallandowners.
To accomplish the goal of water quality improvement, the RCDs will adhere to thefollowing guidelines:
Basin Organization:A. Develop a Technical Advisory Committee (TAC) of landowners, agencies, and
community volunteers to assist the RCDs with assessment and implementationstrategies. (TAC is in place and continuing dialogue).
B. Form a sub-committee of RCD Board members and technical advisors (NRCS,CDF&G, etc.) that will work together to identify and prioritize projects in eachCounty that would fulfill the Priority Ranking Scheme outlined here. (This sub-committee has met three times and is continuing communication).
C. Systematically and cooperatively seek funding support for mutually advantageousactivities in the Eel River. (In place. Exemplified by present 205(j) SWRCB WMIGrant request).
Phase I Implementation, 1998-99:
Using the priority ranking scheme (described above) identify Eel River sub-basins that haveall necessary information for restoration ranking and seek funding to carry out theimplementation of needed work.
Example: South Fork Eel River. Table 5, this report, would indicate that Redwood Creek(Miranda) has temperatures conducive for healthy salmonid habitat. Linking this informationwith habitat typing and biological survey information would disclose the limiting waterquality factor in this stream is a high fine sediment load in the spawning reaches. Focuswould then be placed by the TAC on working with cooperating upslope landowners to reducein-put of fines and improve the spawning beds. This has begun as of this date and funds havebeen identified and obtained to assist landowners in this watershed in their efforts to improveroad surface and stream crossings presently delivering fines to this tributary.

EEL RVER WATER QUALITY MONITORING PROJECT (1996-97)HUMBOLDT COUNTY RESOURCE CONSERVATION DISTRICTSTATE WATER RESOURCES CONTROL BOARD, 205 (J)CONTRACT #5-029-250-2 PG. 73
Phase II Implementation 1999-2003:
1) Continued basin and sub-basin prioritization by the TAC.2) Assessment of problems or threats throughout drainage.(This requires additional
assessment funding from State, Federal, and/or cost share from landowners.)3) Re-development of Implementation Plan. (This is an iterative process that will
continue throughout the restoration period).4) Cost analysis, cost effectiveness analysis, and development of treatment priorities.5) Implementation of high priority projects with willing landowners.6) Reporting and documentation.7) Monitoring.
Anticipated Funding Mechanisms:
The HCRCD is seeking funds to continue the present effort in the Eel River. Thefollowing is a summary of that on-going effort:
A. SB 271- The California Legislature recently passed a bill that will garner a total of 43million dollars over the next six years for watershed recovery in the State. The RCDshave already been successful in obtaining a portion of these funds for projects in the EelRiver Basin. The Landowner Stewardship Workshops to be hosted by HCRCD thiscoming year throughout the Eel River (eight locations) will no doubt succeed in bringingmore awareness and understanding of present upland and watershed issues. The RCDswill be submitting additional grant requests in an effort to focus and continue theinformation/outreach and implementation effort.
B. SWRCB/EPA 319(h) Implementation funds are presently being sought by this RCD tobegin implementation of projects identified by this work and existing planning completedby watershed coordinators Eel River Watershed Improvement Group (ERWIG) and theCDF&G. Future efforts will include the combined RCDs, North Western PacificRailroad, Caltrans, ERWIG, (and other watershed groups as they come on board),Cattlemen’s Association, California Farm Bureau, EPA, NCRWQCB, CDF&G, and thebalance of the agency support system (see TAC above, Pages 3-4)
C. USF&WS, Jobs In The Woods program. Recent dialog with agency personnel confirmsUSF&WS interest in assisting the RCDs with their activities in the Eel River watershed
D. As with the Northwest Emergency Assistance Program that focused a great deal of workin the Eel River, this Federal jobs program could support similar assessment andimplementation projects on private lands.
E. Landowners, whether large or small, can only dedicate a limited portion of their resourcesto remedial activities that would rectify erosional problems on their lands. In manyinstances the problems pre-date their ownership or are natural in occurrence. Theirparticipation is none the less important and their cooperation and commitment to addressthese issues will continue to be the keystone for water quality improvement.
EEL RVER WATER QUALITY MONITORING PROJECT (1996-97)HUMBOLDT COUNTY RESOURCE CONSERVATION DISTRICTSTATE WATER RESOURCES CONTROL BOARD, 205 (J)CONTRACT #5-029-250-2 PG. 74
Monitoring and Assessment:
A good deal of effort has gone into identifying the deteriorating condition of this drainage.The last two to three years have produced a more coordinated atmosphere amongresource planners in this basin and present outreach to private landowners during theTMDL process will continue this trend. The HCRCD will play a significant role in the EelRiver watershed continuing the monitoring and assessment activities. The followingoutline identifies the work begun or completed at this point:
A. Basin wide watershed assessment. (Completed for all major sub-basins and a preliminaryassessment in the upper mainstem. USFS, BLM, USF&WS, et. al.)
B. Basin Wide Habitat Typing and Biological Sampling. (Underway this report andCDF&G, Inland Fisheries Division Weldon Jones, Scott Harris, Scott Downie, RuthGoodfield, Jennifer Terwilliger, et. al.).
C. Temperature monitoring-basin wide coverage of anadromous streams, mainstem, andsub-basin mainstems. (Underway this report. Effort will continue to be coordinated bythe HCRCD. Information gathered to be shared by all stakeholders.)
D. Upland sediment source assessment. (These activities are underway in two of the foursub-basins. This type of work has been identified as one of the most long lastingbeneficial treatments to improve water quality in forested habitat. Dopplet, et al. 1996).
Task 6.2 Implementation Checklist
Action Schedule
A. Technical Advisory Committee formation------------In place______B. Eel River RCD Board Committee----------------------- In place______C. Seek additional funding to support implementation- on going_____D. Identification of implementation projects-------------Phase I begun_E. Prioritization of implementation projects-------------- Phase I begun_
Presently Selected Sub-basins and watersheds:South Fork Eel River
Redwood Creeks (China and Seely)
Van Duzen RiverSeveral watersheds including: Cummings Creek,Yager Creek, Butte Creek, and Little Larabee Creek.
Mainstem Eel RiverChamise Creek
F. Formulation of Memorandums of Understanding(MOUs) between RCDs and with other cooperating
entities dedicated to this process ------------------------ 1998________G. Submission of funding requests for implementation
of Phase I---------------------------------------------------- 1998________

EEL RVER WATER QUALITY MONITORING PROJECT (1996-97)HUMBOLDT COUNTY RESOURCE CONSERVATION DISTRICTSTATE WATER RESOURCES CONTROL BOARD, 205 (J)CONTRACT #5-029-250-2 PG. 75
H. Phase II Implementation ---------------------------------- 1999________I. Submission of funding requests for implementation
of Phase II---------------------------------------------------- 1998-99_____J. Continued monitoring, assessment, and project
development-------------------------------------------------- 1998-2003___

EEL RVER WATER QUALITY MONITORING PROJECT (1996-97)HUMBOLDT COUNTY RESOURCE CONSERVATION DISTRICTSTATE WATER RESOURCES CONTROL BOARD, 205 (J)CONTRACT #5-029-250-2 PG. 76
BIBLIOGRAPHY
Bartholow, John 1997. Stream segment temperature model (SSTEMP). Technical note#2, Version 3.7. Program documentation (revised August, 1997).
Bjornn, T.C., and D.W. Reiser 1991. Habitat requirements of salmonids in streams. Pages189-232. In W.R. Meehan, editor. Influences of forest and rangeland managementon salmonid fishes in their habitats. Special Publication 19. American FisheriesSociety, Bethesda, Maryland.
Blodgett, J.C. 1970. Water temperatures of California streams north coastal sub-region.With California Department of Water Resources. Open-file report 71-46. MenloPark California. July 1970.
Brett, J.R. 1952. Temperature tolerance in young Pacific salmon, genus Oncorhynchus.Journal of the Fisheries Board of Canada. 9 (6):265-323.
Brown, G.W. 1969. Predicting temperatures of small streams. Water Resources Res.5:68-75
________.1971. Water temperature in small streams as influenced by environmentalfactors and logging. In J.T. Krygier and J. D. Hall, directors, Proceedings of asymposium. Forest land uses and stream environment. October 19-21 170.Oregon State Univ., Corvallis, Oregon. Pages 175-181.
________.1985. Forestry and water quality. 2nd edition. Oregon State University BookStores, Inc. Corvallis.
_______. 1996. Aquatic Bioassessment Laboratory. Rancho Cordova, CA.
Coutant, C.C. 1970. Thermal resistance of adult coho (Oncorhynchus kisutch) and jackchinook (O. tshawystcha), and steelhead trout (Salmo gairdneri) from theColumbia River. Battelle Memorial Institute, Pacific Northwest Lab, Richland,Washington. Rep. # BNWL-1508, UC-48. 24 p.
Dopplet, Bob. et. al. 1996. Healing the Watershed, 2nd edition. A guide to the restorationof watersheds and native fish in the West, workbook II of the series. Pacific RiversCouncil, Inc. Eugene, Oregon.
Downie, Scott. 1992. South Fork Eel River. In: 1992 Proceedings , Eel River ASymposium-Workshop. Ed. Thomas Taylor, R. Eugene Geary, and Larry Week.Cal-Neva Chapter AFS, PG&E, and CDF&G. pages 22-23.
________. 1997 Eel River Salmon and Steelhead Restoration Action Plan, Final ReviewDraft. California Department of Fish and Game, Inland Fisheries Division.

EEL RVER WATER QUALITY MONITORING PROJECT (1996-97)HUMBOLDT COUNTY RESOURCE CONSERVATION DISTRICTSTATE WATER RESOURCES CONTROL BOARD, 205 (J)CONTRACT #5-029-250-2 PG. 77
Downie, Scott and D. Fuller.1995. State of the Eel, An overview of the Eel River Basinwith current issues, questions, and solutions. Summary from “Eel Swap1995”,Inland Fisheries Division. Fortuna, Ca.
EPA. 1997. Volunteer Stream Monitoring: A Methods Manual. EPA 841-B-97-003,Office of Water 4503F, November 1997.
Flosi, Gary, et. al. 1998. California salmonid stream habitat restoration manual.California State Resources Agency, CDF&G, third edition, January1998.
Fore, L. S., J. R. Karr and R. W. Wisseman. 1996 Assessing invertebrate responses tohuman activities: evaluating alternative approaches. Journal of the NorthAmerican Benthological Society Vol. 15 (2):212-231
Fuller, D. et. al. 1996. South Fork Eel River Watershed Analysis. BLM, USFS,USF&WS BLM/CA/PT-97/006+7210. Arcata, Ca. March, 1997.
________. 1996 (2). North Fork Eel River Watershed Analysis, Version 1.0. USDI-BLMand USDA-USFS Six Rivers National Forest Arcata/Eureka, Ca. June 1996.
Heede, Burchard H. 1976. Gully development and control: the status of our knowledge.USDA Forest Service Research Paper RM-169 Rocky Mountain Forest and RangeExperiment Station. Fort Collins, Colorado, May 1976.
Hilsenhoff, W.L. 1982. Using a biotic index to evaluate water quality in streams.Wisconsin Dept. of Natural Resources. Technical Bull. No. 132:1-22.
House, Robert, editor, 1996. Management of anadromous fish habitat on public lands.U.S. Department of Interior, BLM Anadromous Salmonid Team. May 1996.
Kier, Wm. M., and Associates 1991. Long range plan for the Klamath River BasinConservation Area fishery restoration. Prepared by the Klamath River BasinFisheries Task Force, U.S. F&WS Klamath Fishery Resource Office, Yreka, Ca.
Kelsey H.M. 1977. Landsliding, channel changes, sediment yield and land use in the VanDuzen River basin, north coastal California, 1941-1975. Earth ResourcesMonograph #3, USDA/USFS Region 5.
Kubicek, Paul F. 1977. Summer water temperature conditions in the Eel River systemwith reference to trout and salmon. Masters thesis, Humboldt State University,Arcata, Ca.
Lisle, T.E. 1982. Effects of aggradation and degradation on pool-riffle morphology innatural gravel channels, northwestern California. Water Resources Research18:1643-1651

EEL RVER WATER QUALITY MONITORING PROJECT (1996-97)HUMBOLDT COUNTY RESOURCE CONSERVATION DISTRICTSTATE WATER RESOURCES CONTROL BOARD, 205 (J)CONTRACT #5-029-250-2 PG. 78
Moore, A. M. 1967. Correlation and analysis of water temperature data for Oregonstreams. U.S. Geologic Survey Water-Supply Paper 1819-k
Payne, W.H., et. al., 1970, USDA, Water, land, and related resources, north coastal areaof California and portions of southern Oregon, Appendix No. 1, June 1970.
Plafkin, J.L., M.T. Barbour, K.D. Porter, S.K. Gross and R.M. Hughes. 1989. RapidBioassessment Protocols for Use in Streams and Rivers: BenthicMacroinvertebrates and Fish. EPA. 440/4 -89-001. U.S. EPA, Washington D.C.
Ralph, Stephan, 1998. Why is the EPA so hot about temperature. Abstract from StreamTemperature Monitoring and Assessment Workshop, Forest Science Project.Humboldt State University, Arcata, Ca. January 1998. Page 4.
Spence, Brian C.1996. with Gregg A. Lomnicky, Robert M. Hughes, and Richard P.Novitzki. An Ecosystem Approach to Salmonid Conservation. The MANTECH(Management Technology) Report. TR-4501-96-6057, NMFS, EPA, and the U.S.F&WS, May, 1997.
Steiner, Park 1996. Potter Valley project monitoring program: effects of operations onupper Eel River anadromous salmonids. Draft final report for PG&E, 3400 crowCanyon Road, San Ramon, California. September 1996.
Sylvester, R.O. 1963 Effects of water uses and impoundments on water temperature. InE.F. Eldridge, ed. Proceedings of the twelfth Pacific Northwest symposium onwater pollution research. U.S. Pub. Health Service, Pacific Northwest Water Lab.Pages 6-27.
Trush, Bill 1992. Eel River Introduction. In: 1992 Proceedings , Eel River A Symposium-Workshop. Ed. Thomas Taylor, R. Eugene Geary, and Larry Week. Cal-NevaChapter AFS, PG&E, and CDF&G. pages1-2.
USFS, BLM, et. al. 1994. Watershed Analysis report for the Middle Fork Eel Riverwatershed. Mendocino National Forest, September, 1994.
USDA, USFS. 1994. Preliminary watershed restoration assessment, main Eel River.Mendocino National Forest, February 1994.
Weaver, W.E., and D.K. Hagans, 1994, Handbook for forest and ranch roads: forMendocino County Resource Conservation District- CDF, NRCS, June, 1994.
Weaver, W.E., and D.K. Hagans, 1996, Sediment treatments and road restoration:protecting and restoring watersheds from sediment-related impacts. Chapter 4. In:Healing the Watershed, Workbook Two, Pacific Rivers Council. pages 105-134.