Embed Size (px)
Citation preview
Astronomy & Astrophysics manuscript no. 30351JN c©ESO 2017August 29, 2017
Efficient injection from large telescopes into single-mode fibres:Enabling the era of ultra-precision astronomy
N. Jovanovic1, 2?, C. Schwab2, 3, O. Guyon1, 4, 5, 6, J. Lozi1, N. Cvetojevic3, 7, 8, F. Martinache9,S. Leon-Saval7, B. Norris7, S. Gross2, 8, D. Doughty1, T. Currie1 and N. Takato1
1 Subaru Telescope, National Astronomical Observatory of Japan, National Institutes of Natural Sciences (NINS), 650 NorthA’Ohoku Place, Hilo, HI, 96720, U.S.A.
2 MQ Photonics Research Centre, Department of Physics and Astronomy, Macquarie University, NSW 2109, Australia3 Australian Astronomical Observatory, 105 Delhi Rd, North Ryde NSW 2113, Australia4 Steward Observatory, University of Arizona, Tucson, AZ, 85721, U.S.A.5 College of Optical Sciences, University of Arizona, Tucson, AZ 85721, U.S.A.6 Astrobiology Center of NINS, 2-21-1, Osawa, Mitaka, Tokyo, 181-8588, Japan7 Sydney Institute for Astronomy (SIfA), Institute for Photonics and Optical Science (IPOS), School of Physics, University of Sydney,
NSW 2006, Australia8 Centre for Ultrahigh-bandwidth Devices for Optical Systems (CUDOS)9 Laboratoire Lagrange, Université Côte d’Azur , Observatoire de la Côte d’Azur, CNRS, Parc Valrose, Bât. H. FIZEAU, 06108
Nice, France
August 29, 2017
ABSTRACT
Photonic technologies offer numerous advantages for astronomical instruments such as spectrographs and interferometers owing totheir small footprints and diverse range of functionalities. Operating at the diffraction-limit, it is notoriously difficult to efficientlycouple such devices directly with large telescopes. We demonstrate that with careful control of both the non-ideal pupil geometry ofa telescope and residual wavefront errors, efficient coupling with single-mode devices can indeed be realised. A fibre injection wasbuilt within the Subaru Coronagraphic Extreme Adaptive Optics (SCExAO) instrument. Light was coupled into a single-mode fibreoperating in the near-IR (J-H bands) which was downstream of the extreme adaptive optics system and the pupil apodising optics. Acoupling efficiency of 86% of the theoretical maximum limit was achieved at 1550 nm for a diffraction-limited beam in the laboratory,and was linearly correlated with Strehl ratio. The coupling efficiency was constant to within < 30% in the range 1250–1600 nm.Preliminary on-sky data with a Strehl ratio of 60% in the H-band produced a coupling efficiency into a single-mode fibre of ∼ 50%,consistent with expectations. The coupling was > 40% for 84% of the time and > 50% for 41% of the time. The laboratory resultsallow us to forecast that extreme adaptive optics levels of correction (Strehl ratio > 90% in H-band) would allow coupling of > 67%(of the order of coupling to multimode fibres currently) while standard levels of wavefront correction (Strehl ratio > 20% in H-band)would allow coupling of > 18%. For Strehl ratios < 20%, few-port photonic lanterns become a superior choice but the signal-to-noise,and pixel availability must be considered. These results illustrate a clear path to efficient on-sky coupling into a single-mode fibrewhich could be used to realise modal-noise-free radial velocity machines, very-long-baseline optical/near-IR interferometers and/orsimply exploit photonic technologies in future instrument design.
Key words. Astronomical instrumentation, methods and techniques – Instrumentation: adaptive optics – Instrumentation: highangular resolution – Instrumentation: interferometers – Instrumentation: spectrographs – Techniques: radial velocities
1. Introduction
The key to precision astronomical measurements is the ability tocarefully calibrate the data. The quality of calibration would begreatly improved if it were possible to operate at the diffraction-limit. In this case we mean that there is no wavefront error(i.e. a perfectly flat wavefront) and the point-spread function(PSF) is temporally invariant (stable with time). In the field ofhigh-contrast imaging for example, this would enable a perfectPSF subtraction, revealing structures at unprecedented contrastaround the host star, such as an exoplanet or disk. In the area ofprecision radial velocity, one of the key limitations is the stabilityof the slit (or fibre) illumination (Chazelas et al. 2012). A tempo-rally invariant, diffraction-limited PSF would eliminate this issueand result in a consistently high level of performance by virtue of
? e-mail: [email protected]
improved calibration for the data. Finally, interferometers woulddeliver stable fringes, enhancing the contrast with which faintstructures around a host star could be studied. This would resultin a more precise determination of the objects’ properties (Coudédu Foresto 1994).
However, ground-based observations are hampered by atmo-spheric turbulence. One solution is to operate the instrumentin space, free from the atmosphere. This comes at great costand complexity. More commonly, adaptive optics (AO) systemsare used upstream of the instrument. AO systems are based onmeasuring the incident wavefront and subsequently correctingfor it with a deformable mirror capable of operating at highspeed (100s of Hz). Such instruments are now ubiquitous at large(> 4 m-class) observatories (Wizinowich et al. 2000; Minowa etal. 2010). These systems offer Strehl ratios of 20 − 50% in theH-band in median seeing. This translates to 200-300 nm RMS
Article number, page 1 of 15
arX
iv:1
706.
0882
1v2
[as
tro-
ph.I
M]
26
Aug
201
7
A&A proofs: manuscript no. 30351JN
residual wavefront error, which presents an improvement withwhich data can be calibrated, but is far from the ideal scenario.
Recently, several large observatories have commissioned so-called "extreme" AO (ExAO) systems capable of delivering 90%Strehl ratios in better than median seeing in the H-band (Dekanyet al. 2013; Macintosh et al. 2014; Vigan et al. 2016). These sys-tems reduce the residual wavefront error down to ∼ 80 nm RMSin H-band by controlling a larger region around the PSF (Op-penheimer et al. 2003) in the focal plane and doing so at higherspeed than conventional AO systems (refer to Jovanovic et al.(2016b) for full details). Although these systems do not deliverthe perfectly flat wavefront desired, they certainly approach thislimit and improve the quality of calibrated astronomical data.
To flatten the wavefront post-ExAO correction to the idealcase (i.e. 0 nm RMS), some sort of spatial filtering is needed.This can be achieved in one of two ways: The light can bepassed through a pinhole or a single-mode fibre (SMF) (Coudédu Foresto 1994). A SMF is named as such because it can onlytransport light through the fibre in one state, the fundamentalmode. This mode has a near-Gaussian intensity profile and a flatphase front (to be precise, there are two identical modes, whichhave orthogonal polarisations). When light is passed throughsuch a fibre, it exits with these properties imprinted on the beam.Most importantly however, the output intensity profile of a SMFis temporally invariant. This makes a SMF the ideal way to feedlight to an astronomical instrument for precision measurements.Indeed, a discussion highlighting the impact of a SMF feed onstellar spectroscopy was presented by Crepp et. al. (2014) andmore recently treated in detail by Jovanovic et al. (2016b).
Once the light is in the SMF, a suite of photonic technolo-gies that operate at the diffraction-limit become accessible forinstrument design. Photonic components, either optical-fibre-based or on a wafer, offer a diverse range of functionality in-cluding the possibility for spectral filtering (Mariën et al. 2012;Trinh et al. 2013), dispersion (Cvetojevic et al. 2009, 2012), re-formatting (Spaleniak et al. 2013; Harris et al. 2015) and cali-bration (Feger et al. 2014; Halverson et al. 2014; Schwab et al.2015) to name a few. In addition, photonic devices are compactand robust and can easily be stabilised to a high degree. Thismakes these devices highly desirable for implementation in as-tronomical instrument design.
However, efficiently coupling a SMF to a large telescopeis inherently difficult because of the need to match the inten-sity distribution and phase front of the incident beam to that ofthe fundamental mode of the SMF. Early work was conductedby Coudé du Foresto & Ridgway (1992) investigated injectingseeing-limited light from two 0.8 m telescopes into SMFs opti-mised for the K-band for the purposes of conducting interfero-metric measurements with the FLUOR beam combiner. This wasfollowed by Coudé du Foresto et al. (2000) who demonstrated acoupling efficiency of 20-25% in K-band into a fluoride-basedSMF on the 3.6 m La Silla Telescope behind the ADONIS AOsystem. This pioneering work achieved over 50% of the theoret-ical maximum coupling (39%) for the experiential setup used.It was primarily limited by the relatively large central obstruc-tion (43.6% of the primary), quasi-static low-order aberrationsand a 25 Hz telescope vibration. Since this time there have beenseveral other demonstrations of SMF injection for both spec-troscopy (Ghasempour et al. 2012) and interferometry (Perrin etal. 2006; Mennesson et al. 2010). More recently, light has beencoupled with AO assistance from one of the LBT 8-m mirrors toa SMF in the y-band (Bechter et al. 2016). Preliminary resultsfrom that work yielded a coupling efficiency in the range of 20–25%, which is high considering the relatively short wavelength.
In the era of ExAO equipped telescopes, achieving high cou-pling efficiencies becomes a distinct possibility and forms thebasis for this study. In this body of work, we demonstrate effi-cient coupling into a SMF (> 70%) is possible behind an ExAOsystem with the use of pupil apodisation optics for the first time.This work builds upon the recent results presented in Jovanovicet al. (2014, 2016a). Section 2 gives an overview of how to cou-ple into SMFs supported by simulations. Section 3 outlines theexperimental setup used while Section 4 summarises the resultsof the detailed coupling efficiency study conducted in the lab-oratory, which includes a comparison with a few-port photoniclantern. Section 5 highlights the preliminary on-sky results whileSection 6 goes into a deeper discussion of their implications.Section 7 rounds off the paper with a summary of the key re-sults.
2. How to efficiently inject light into single-modefibres
2.1. Requirements for optimum coupling
As outlined in the introduction, a SMF guides light in the funda-mental mode with a Gaussian intensity profile and a flat phasefront. In order to maximise coupling of light into this mode,the incident beam should match these specifications closely. Themode can be characterised in a number of ways. The mode fielddiameter (MFD) specifies the size of the mode and is measuredto the point where the intensity profile drops to 1/e2 of the peakvalue. The fibre also has a numerical aperture (NA) that stip-ulates the angles of rays that can be accepted by the fibre andis measured to the 1% intensity point of the far-field emanatingfrom the fibre. Carefully matching the properties of a Gaussianbeam to the MFD and NA is important for SMFs. If we takethe case of a typical near-IR optimised SMF such as SMF-28(from Corning), it offers a MFD = 10.4 µm at 1550 nm anda NA= 0.14. To match the spot size, a focal ratio f /# = 5.27Gaussian beam (measured to the 1/e2 point) would need to beused. Any deviations in the f /# would lead to a reduction inthe coupling efficiency. This corresponds to a NA for the beamof 0.095, measured to the 1/e2 points, or a NA of 0.15 mea-sured to the 1% points (more typical for fibres), which is littleabove the cutoff of the fibre but very close. What is importantthough is that the spot size of a Gaussian beam is matched to theMFD for optimum performance. In cases where the input beamis not a Gaussian, the optimum beam parameters to maximisecoupling need to be calculated using the overlap integral methoddescribed in the following section. Simply matching the beamsizes for two dissimilar profile beams is typically a good startingpoint, but some optimisation is required.
2.2. Considerations for optimising the PSF for efficientcoupling
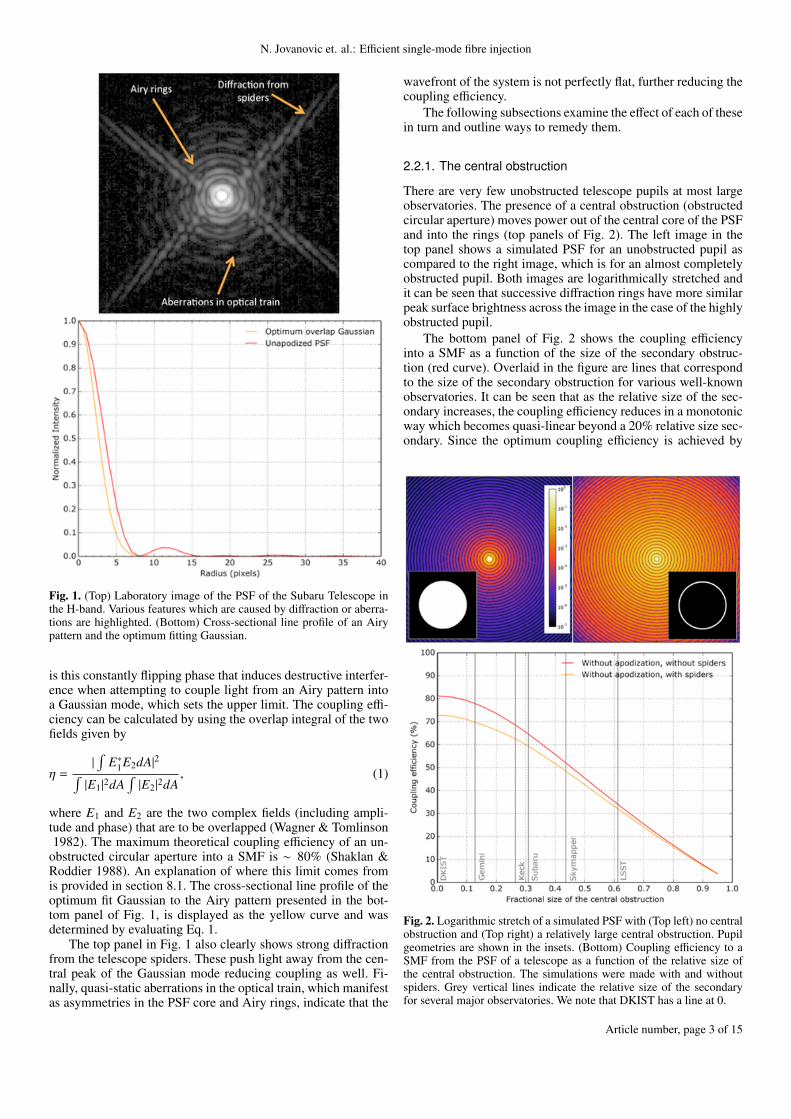
In order to determine how to optimise the coupling of light into aSMF, it is instrumental to first examine the PSF of a telescope. Atelescope which is uniformly illuminated by starlight will forman Airy pattern in the focal plane. The PSF observed at Sub-aru Telescope is shown in the top panel of Fig. 1 as an examplewith a cross-sectional line profile offered in the bottom panel (redcurve). The diffraction rings around the PSF are the result of thefact that the pupil has a finite extent. The phase across the cen-tral core of the PSF is constant. Between each concentric ring isa dark region where the phase flips by π. The phase within eachring is constant and continues to flip for each successive ring. It
Article number, page 2 of 15
N. Jovanovic et. al.: Efficient single-mode fibre injection
Fig. 1. (Top) Laboratory image of the PSF of the Subaru Telescope inthe H-band. Various features which are caused by diffraction or aberra-tions are highlighted. (Bottom) Cross-sectional line profile of an Airypattern and the optimum fitting Gaussian.
is this constantly flipping phase that induces destructive interfer-ence when attempting to couple light from an Airy pattern intoa Gaussian mode, which sets the upper limit. The coupling effi-ciency can be calculated by using the overlap integral of the twofields given by
η =|∫
E∗1E2dA|2∫|E1|
2dA∫|E2|
2dA, (1)
where E1 and E2 are the two complex fields (including ampli-tude and phase) that are to be overlapped (Wagner & Tomlinson1982). The maximum theoretical coupling efficiency of an un-
obstructed circular aperture into a SMF is ∼ 80% (Shaklan &Roddier 1988). An explanation of where this limit comes fromis provided in section 8.1. The cross-sectional line profile of theoptimum fit Gaussian to the Airy pattern presented in the bot-tom panel of Fig. 1, is displayed as the yellow curve and wasdetermined by evaluating Eq. 1.
The top panel in Fig. 1 also clearly shows strong diffractionfrom the telescope spiders. These push light away from the cen-tral peak of the Gaussian mode reducing coupling as well. Fi-nally, quasi-static aberrations in the optical train, which manifestas asymmetries in the PSF core and Airy rings, indicate that the
wavefront of the system is not perfectly flat, further reducing thecoupling efficiency.
The following subsections examine the effect of each of thesein turn and outline ways to remedy them.
2.2.1. The central obstruction
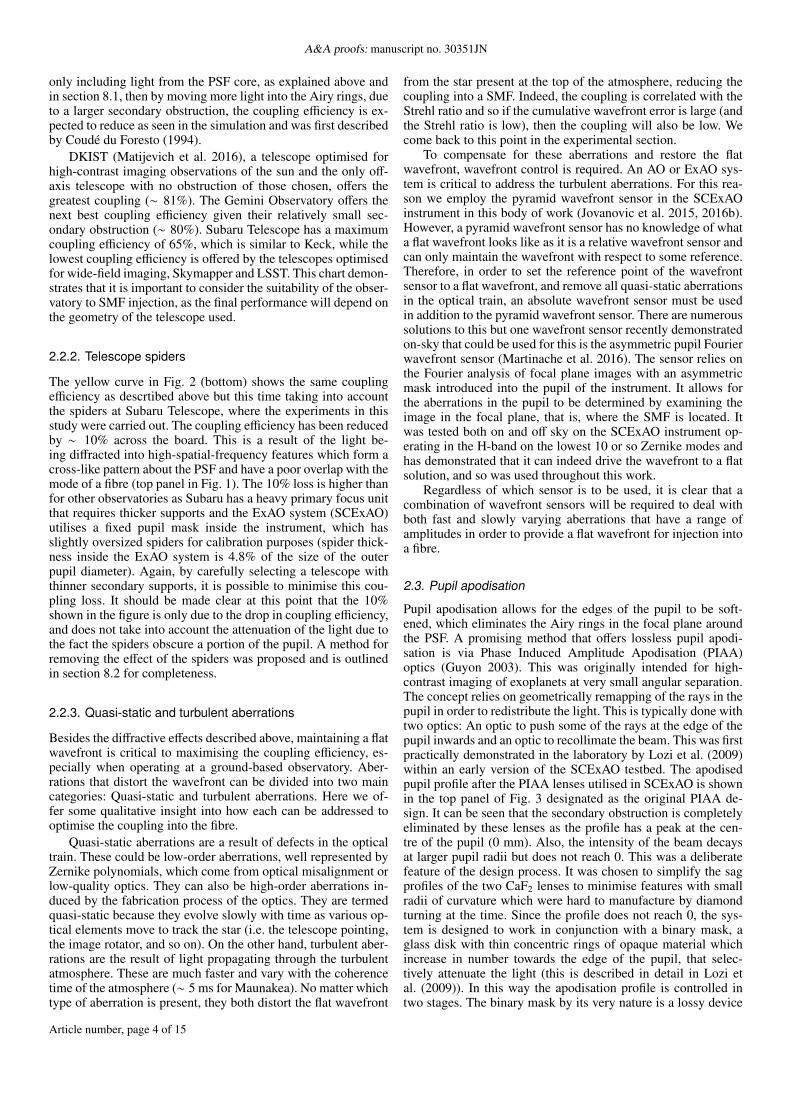
There are very few unobstructed telescope pupils at most largeobservatories. The presence of a central obstruction (obstructedcircular aperture) moves power out of the central core of the PSFand into the rings (top panels of Fig. 2). The left image in thetop panel shows a simulated PSF for an unobstructed pupil ascompared to the right image, which is for an almost completelyobstructed pupil. Both images are logarithmically stretched andit can be seen that successive diffraction rings have more similarpeak surface brightness across the image in the case of the highlyobstructed pupil.
The bottom panel of Fig. 2 shows the coupling efficiencyinto a SMF as a function of the size of the secondary obstruc-tion (red curve). Overlaid in the figure are lines that correspondto the size of the secondary obstruction for various well-knownobservatories. It can be seen that as the relative size of the sec-ondary increases, the coupling efficiency reduces in a monotonicway which becomes quasi-linear beyond a 20% relative size sec-ondary. Since the optimum coupling efficiency is achieved by
Fig. 2. Logarithmic stretch of a simulated PSF with (Top left) no centralobstruction and (Top right) a relatively large central obstruction. Pupilgeometries are shown in the insets. (Bottom) Coupling efficiency to aSMF from the PSF of a telescope as a function of the relative size ofthe central obstruction. The simulations were made with and withoutspiders. Grey vertical lines indicate the relative size of the secondaryfor several major observatories. We note that DKIST has a line at 0.
Article number, page 3 of 15
A&A proofs: manuscript no. 30351JN
only including light from the PSF core, as explained above andin section 8.1, then by moving more light into the Airy rings, dueto a larger secondary obstruction, the coupling efficiency is ex-pected to reduce as seen in the simulation and was first describedby Coudé du Foresto (1994).
DKIST (Matijevich et al. 2016), a telescope optimised forhigh-contrast imaging observations of the sun and the only off-axis telescope with no obstruction of those chosen, offers thegreatest coupling (∼ 81%). The Gemini Observatory offers thenext best coupling efficiency given their relatively small sec-ondary obstruction (∼ 80%). Subaru Telescope has a maximumcoupling efficiency of 65%, which is similar to Keck, while thelowest coupling efficiency is offered by the telescopes optimisedfor wide-field imaging, Skymapper and LSST. This chart demon-strates that it is important to consider the suitability of the obser-vatory to SMF injection, as the final performance will depend onthe geometry of the telescope used.
2.2.2. Telescope spiders
The yellow curve in Fig. 2 (bottom) shows the same couplingefficiency as descrtibed above but this time taking into accountthe spiders at Subaru Telescope, where the experiments in thisstudy were carried out. The coupling efficiency has been reducedby ∼ 10% across the board. This is a result of the light be-ing diffracted into high-spatial-frequency features which form across-like pattern about the PSF and have a poor overlap with themode of a fibre (top panel in Fig. 1). The 10% loss is higher thanfor other observatories as Subaru has a heavy primary focus unitthat requires thicker supports and the ExAO system (SCExAO)utilises a fixed pupil mask inside the instrument, which hasslightly oversized spiders for calibration purposes (spider thick-ness inside the ExAO system is 4.8% of the size of the outerpupil diameter). Again, by carefully selecting a telescope withthinner secondary supports, it is possible to minimise this cou-pling loss. It should be made clear at this point that the 10%shown in the figure is only due to the drop in coupling efficiency,and does not take into account the attenuation of the light due tothe fact the spiders obscure a portion of the pupil. A method forremoving the effect of the spiders was proposed and is outlinedin section 8.2 for completeness.
2.2.3. Quasi-static and turbulent aberrations
Besides the diffractive effects described above, maintaining a flatwavefront is critical to maximising the coupling efficiency, es-pecially when operating at a ground-based observatory. Aber-rations that distort the wavefront can be divided into two maincategories: Quasi-static and turbulent aberrations. Here we of-fer some qualitative insight into how each can be addressed tooptimise the coupling into the fibre.
Quasi-static aberrations are a result of defects in the opticaltrain. These could be low-order aberrations, well represented byZernike polynomials, which come from optical misalignment orlow-quality optics. They can also be high-order aberrations in-duced by the fabrication process of the optics. They are termedquasi-static because they evolve slowly with time as various op-tical elements move to track the star (i.e. the telescope pointing,the image rotator, and so on). On the other hand, turbulent aber-rations are the result of light propagating through the turbulentatmosphere. These are much faster and vary with the coherencetime of the atmosphere (∼ 5 ms for Maunakea). No matter whichtype of aberration is present, they both distort the flat wavefront
from the star present at the top of the atmosphere, reducing thecoupling into a SMF. Indeed, the coupling is correlated with theStrehl ratio and so if the cumulative wavefront error is large (andthe Strehl ratio is low), then the coupling will also be low. Wecome back to this point in the experimental section.
To compensate for these aberrations and restore the flatwavefront, wavefront control is required. An AO or ExAO sys-tem is critical to address the turbulent aberrations. For this rea-son we employ the pyramid wavefront sensor in the SCExAOinstrument in this body of work (Jovanovic et al. 2015, 2016b).However, a pyramid wavefront sensor has no knowledge of whata flat wavefront looks like as it is a relative wavefront sensor andcan only maintain the wavefront with respect to some reference.Therefore, in order to set the reference point of the wavefrontsensor to a flat wavefront, and remove all quasi-static aberrationsin the optical train, an absolute wavefront sensor must be usedin addition to the pyramid wavefront sensor. There are numeroussolutions to this but one wavefront sensor recently demonstratedon-sky that could be used for this is the asymmetric pupil Fourierwavefront sensor (Martinache et al. 2016). The sensor relies onthe Fourier analysis of focal plane images with an asymmetricmask introduced into the pupil of the instrument. It allows forthe aberrations in the pupil to be determined by examining theimage in the focal plane, that is, where the SMF is located. Itwas tested both on and off sky on the SCExAO instrument op-erating in the H-band on the lowest 10 or so Zernike modes andhas demonstrated that it can indeed drive the wavefront to a flatsolution, and so was used throughout this work.
Regardless of which sensor is to be used, it is clear that acombination of wavefront sensors will be required to deal withboth fast and slowly varying aberrations that have a range ofamplitudes in order to provide a flat wavefront for injection intoa fibre.
2.3. Pupil apodisation
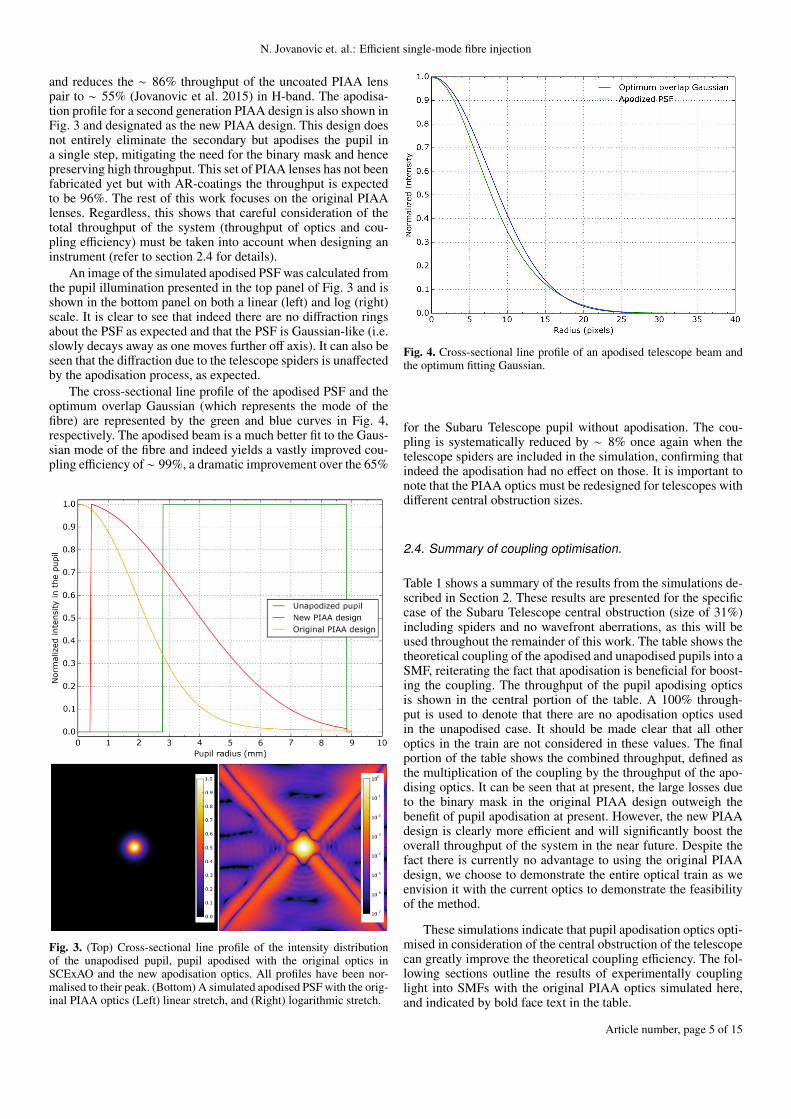
Pupil apodisation allows for the edges of the pupil to be soft-ened, which eliminates the Airy rings in the focal plane aroundthe PSF. A promising method that offers lossless pupil apodi-sation is via Phase Induced Amplitude Apodisation (PIAA)optics (Guyon 2003). This was originally intended for high-contrast imaging of exoplanets at very small angular separation.The concept relies on geometrically remapping of the rays in thepupil in order to redistribute the light. This is typically done withtwo optics: An optic to push some of the rays at the edge of thepupil inwards and an optic to recollimate the beam. This was firstpractically demonstrated in the laboratory by Lozi et al. (2009)within an early version of the SCExAO testbed. The apodisedpupil profile after the PIAA lenses utilised in SCExAO is shownin the top panel of Fig. 3 designated as the original PIAA de-sign. It can be seen that the secondary obstruction is completelyeliminated by these lenses as the profile has a peak at the cen-tre of the pupil (0 mm). Also, the intensity of the beam decaysat larger pupil radii but does not reach 0. This was a deliberatefeature of the design process. It was chosen to simplify the sagprofiles of the two CaF2 lenses to minimise features with smallradii of curvature which were hard to manufacture by diamondturning at the time. Since the profile does not reach 0, the sys-tem is designed to work in conjunction with a binary mask, aglass disk with thin concentric rings of opaque material whichincrease in number towards the edge of the pupil, that selec-tively attenuate the light (this is described in detail in Lozi etal. (2009)). In this way the apodisation profile is controlled intwo stages. The binary mask by its very nature is a lossy device
Article number, page 4 of 15
N. Jovanovic et. al.: Efficient single-mode fibre injection
and reduces the ∼ 86% throughput of the uncoated PIAA lenspair to ∼ 55% (Jovanovic et al. 2015) in H-band. The apodisa-tion profile for a second generation PIAA design is also shown inFig. 3 and designated as the new PIAA design. This design doesnot entirely eliminate the secondary but apodises the pupil ina single step, mitigating the need for the binary mask and hencepreserving high throughput. This set of PIAA lenses has not beenfabricated yet but with AR-coatings the throughput is expectedto be 96%. The rest of this work focuses on the original PIAAlenses. Regardless, this shows that careful consideration of thetotal throughput of the system (throughput of optics and cou-pling efficiency) must be taken into account when designing aninstrument (refer to section 2.4 for details).
An image of the simulated apodised PSF was calculated fromthe pupil illumination presented in the top panel of Fig. 3 and isshown in the bottom panel on both a linear (left) and log (right)scale. It is clear to see that indeed there are no diffraction ringsabout the PSF as expected and that the PSF is Gaussian-like (i.e.slowly decays away as one moves further off axis). It can also beseen that the diffraction due to the telescope spiders is unaffectedby the apodisation process, as expected.
The cross-sectional line profile of the apodised PSF and theoptimum overlap Gaussian (which represents the mode of thefibre) are represented by the green and blue curves in Fig. 4,respectively. The apodised beam is a much better fit to the Gaus-sian mode of the fibre and indeed yields a vastly improved cou-pling efficiency of ∼ 99%, a dramatic improvement over the 65%
Fig. 3. (Top) Cross-sectional line profile of the intensity distributionof the unapodised pupil, pupil apodised with the original optics inSCExAO and the new apodisation optics. All profiles have been nor-malised to their peak. (Bottom) A simulated apodised PSF with the orig-inal PIAA optics (Left) linear stretch, and (Right) logarithmic stretch.
Fig. 4. Cross-sectional line profile of an apodised telescope beam andthe optimum fitting Gaussian.
for the Subaru Telescope pupil without apodisation. The cou-pling is systematically reduced by ∼ 8% once again when thetelescope spiders are included in the simulation, confirming thatindeed the apodisation had no effect on those. It is important tonote that the PIAA optics must be redesigned for telescopes withdifferent central obstruction sizes.
2.4. Summary of coupling optimisation.
Table 1 shows a summary of the results from the simulations de-scribed in Section 2. These results are presented for the specificcase of the Subaru Telescope central obstruction (size of 31%)including spiders and no wavefront aberrations, as this will beused throughout the remainder of this work. The table shows thetheoretical coupling of the apodised and unapodised pupils into aSMF, reiterating the fact that apodisation is beneficial for boost-ing the coupling. The throughput of the pupil apodising opticsis shown in the central portion of the table. A 100% through-put is used to denote that there are no apodisation optics usedin the unapodised case. It should be made clear that all otheroptics in the train are not considered in these values. The finalportion of the table shows the combined throughput, defined asthe multiplication of the coupling by the throughput of the apo-dising optics. It can be seen that at present, the large losses dueto the binary mask in the original PIAA design outweigh thebenefit of pupil apodisation at present. However, the new PIAAdesign is clearly more efficient and will significantly boost theoverall throughput of the system in the near future. Despite thefact there is currently no advantage to using the original PIAAdesign, we choose to demonstrate the entire optical train as weenvision it with the current optics to demonstrate the feasibilityof the method.
These simulations indicate that pupil apodisation optics opti-mised in consideration of the central obstruction of the telescopecan greatly improve the theoretical coupling efficiency. The fol-lowing sections outline the results of experimentally couplinglight into SMFs with the original PIAA optics simulated here,and indicated by bold face text in the table.
Article number, page 5 of 15
A&A proofs: manuscript no. 30351JN
Table 1. Coupling with and throughput of apodisation optics.
(a) Coupling efficiency (%)Unapodised pupil 59Original PIAA design 91New PIAA design 91
(b) Throughput of apodising opticsUnapodised pupil 100Original PIAA design 55New PIAA design 96
(c) Combined throughput (a×b)Unapodised pupil 59Original PIAA design 51New PIAA design 87
Notes. The table summarises the results from the simulations in Sec-tion 2. The theoretical coupling efficiencies are shown for three centralobstruction sizes with no apodisation, the old PIAA lens design andthe new PIAA lens design, for the case of no wavefront aberrations.The throughput of the PIAA lenses is presented as well as the com-bined throughput of each option, which is based on the throughput ofthe lenses multiplied by the coupling efficiency for each case.
3. Experiment
3.1. The SCExAO instrument
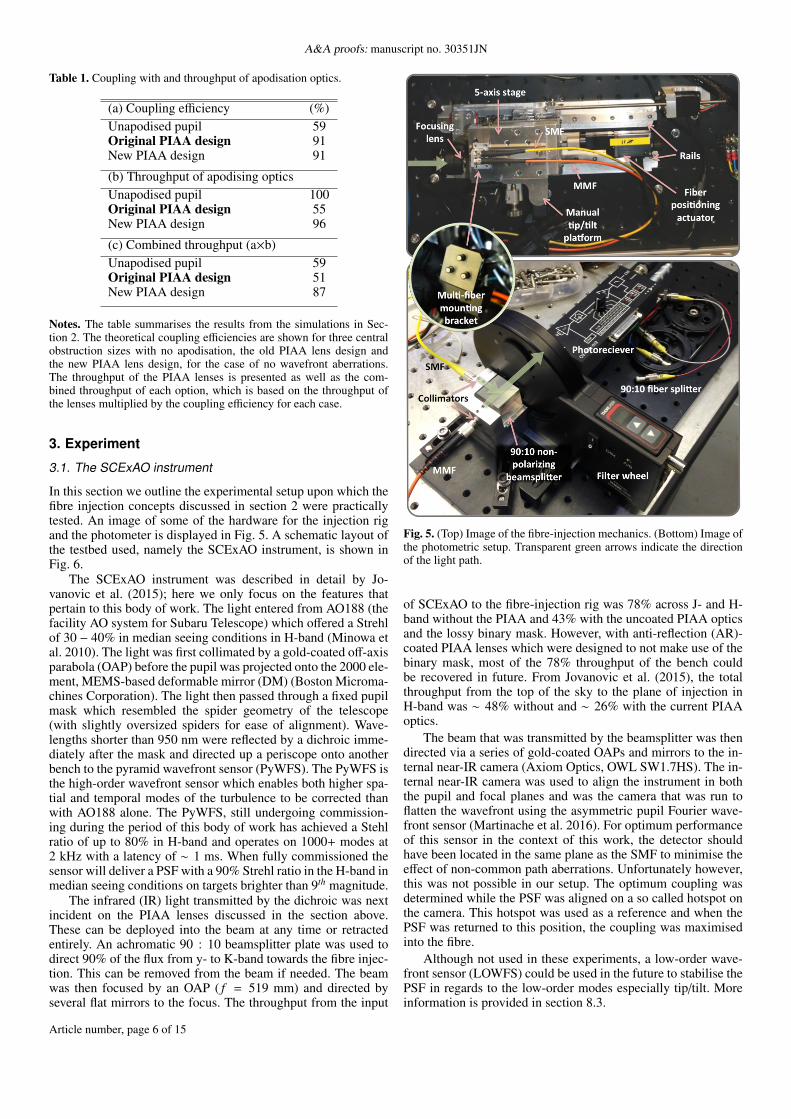
In this section we outline the experimental setup upon which thefibre injection concepts discussed in section 2 were practicallytested. An image of some of the hardware for the injection rigand the photometer is displayed in Fig. 5. A schematic layout ofthe testbed used, namely the SCExAO instrument, is shown inFig. 6.
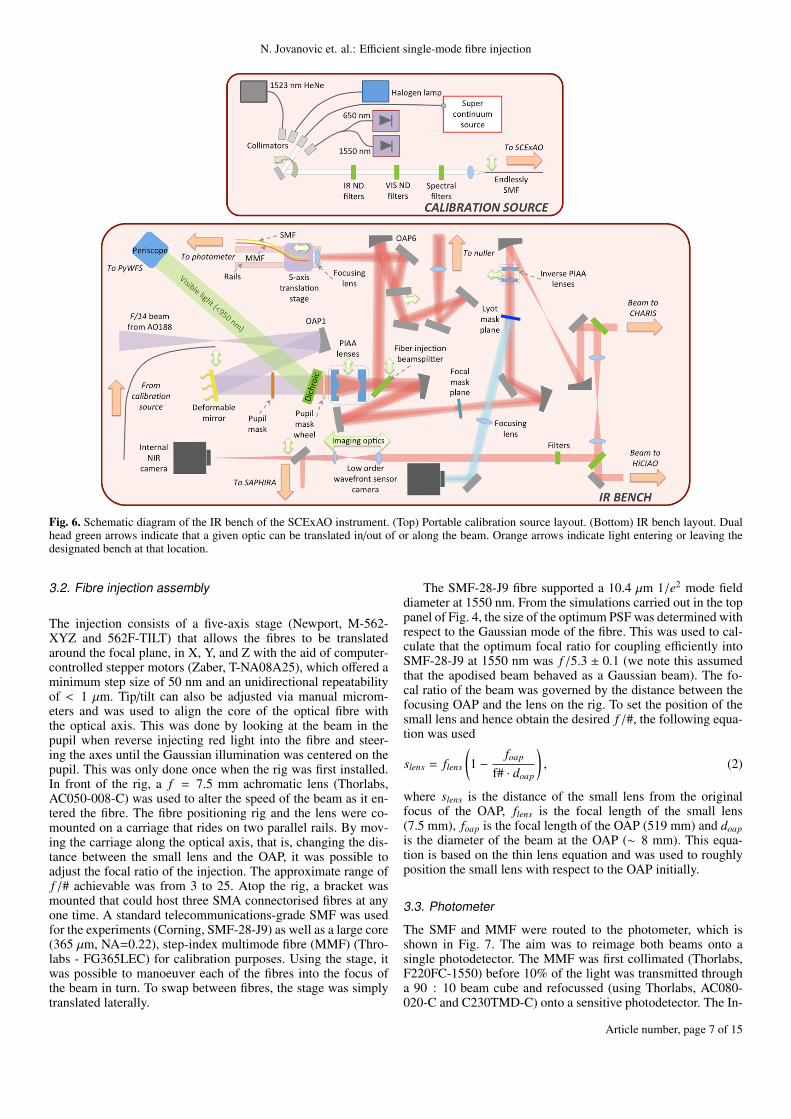
The SCExAO instrument was described in detail by Jo-vanovic et al. (2015); here we only focus on the features thatpertain to this body of work. The light entered from AO188 (thefacility AO system for Subaru Telescope) which offered a Strehlof 30 − 40% in median seeing conditions in H-band (Minowa etal. 2010). The light was first collimated by a gold-coated off-axisparabola (OAP) before the pupil was projected onto the 2000 ele-ment, MEMS-based deformable mirror (DM) (Boston Microma-chines Corporation). The light then passed through a fixed pupilmask which resembled the spider geometry of the telescope(with slightly oversized spiders for ease of alignment). Wave-lengths shorter than 950 nm were reflected by a dichroic imme-diately after the mask and directed up a periscope onto anotherbench to the pyramid wavefront sensor (PyWFS). The PyWFS isthe high-order wavefront sensor which enables both higher spa-tial and temporal modes of the turbulence to be corrected thanwith AO188 alone. The PyWFS, still undergoing commission-ing during the period of this body of work has achieved a Stehlratio of up to 80% in H-band and operates on 1000+ modes at2 kHz with a latency of ∼ 1 ms. When fully commissioned thesensor will deliver a PSF with a 90% Strehl ratio in the H-band inmedian seeing conditions on targets brighter than 9th magnitude.
The infrared (IR) light transmitted by the dichroic was nextincident on the PIAA lenses discussed in the section above.These can be deployed into the beam at any time or retractedentirely. An achromatic 90 : 10 beamsplitter plate was used todirect 90% of the flux from y- to K-band towards the fibre injec-tion. This can be removed from the beam if needed. The beamwas then focused by an OAP ( f = 519 mm) and directed byseveral flat mirrors to the focus. The throughput from the input
Fig. 5. (Top) Image of the fibre-injection mechanics. (Bottom) Image ofthe photometric setup. Transparent green arrows indicate the directionof the light path.
of SCExAO to the fibre-injection rig was 78% across J- and H-band without the PIAA and 43% with the uncoated PIAA opticsand the lossy binary mask. However, with anti-reflection (AR)-coated PIAA lenses which were designed to not make use of thebinary mask, most of the 78% throughput of the bench couldbe recovered in future. From Jovanovic et al. (2015), the totalthroughput from the top of the sky to the plane of injection inH-band was ∼ 48% without and ∼ 26% with the current PIAAoptics.
The beam that was transmitted by the beamsplitter was thendirected via a series of gold-coated OAPs and mirrors to the in-ternal near-IR camera (Axiom Optics, OWL SW1.7HS). The in-ternal near-IR camera was used to align the instrument in boththe pupil and focal planes and was the camera that was run toflatten the wavefront using the asymmetric pupil Fourier wave-front sensor (Martinache et al. 2016). For optimum performanceof this sensor in the context of this work, the detector shouldhave been located in the same plane as the SMF to minimise theeffect of non-common path aberrations. Unfortunately however,this was not possible in our setup. The optimum coupling wasdetermined while the PSF was aligned on a so called hotspot onthe camera. This hotspot was used as a reference and when thePSF was returned to this position, the coupling was maximisedinto the fibre.
Although not used in these experiments, a low-order wave-front sensor (LOWFS) could be used in the future to stabilise thePSF in regards to the low-order modes especially tip/tilt. Moreinformation is provided in section 8.3.
Article number, page 6 of 15
N. Jovanovic et. al.: Efficient single-mode fibre injection
Fig. 6. Schematic diagram of the IR bench of the SCExAO instrument. (Top) Portable calibration source layout. (Bottom) IR bench layout. Dualhead green arrows indicate that a given optic can be translated in/out of or along the beam. Orange arrows indicate light entering or leaving thedesignated bench at that location.
3.2. Fibre injection assembly
The injection consists of a five-axis stage (Newport, M-562-XYZ and 562F-TILT) that allows the fibres to be translatedaround the focal plane, in X, Y, and Z with the aid of computer-controlled stepper motors (Zaber, T-NA08A25), which offered aminimum step size of 50 nm and an unidirectional repeatabilityof < 1 µm. Tip/tilt can also be adjusted via manual microm-eters and was used to align the core of the optical fibre withthe optical axis. This was done by looking at the beam in thepupil when reverse injecting red light into the fibre and steer-ing the axes until the Gaussian illumination was centered on thepupil. This was only done once when the rig was first installed.In front of the rig, a f = 7.5 mm achromatic lens (Thorlabs,AC050-008-C) was used to alter the speed of the beam as it en-tered the fibre. The fibre positioning rig and the lens were co-mounted on a carriage that rides on two parallel rails. By mov-ing the carriage along the optical axis, that is, changing the dis-tance between the small lens and the OAP, it was possible toadjust the focal ratio of the injection. The approximate range off /# achievable was from 3 to 25. Atop the rig, a bracket wasmounted that could host three SMA connectorised fibres at anyone time. A standard telecommunications-grade SMF was usedfor the experiments (Corning, SMF-28-J9) as well as a large core(365 µm, NA=0.22), step-index multimode fibre (MMF) (Thro-labs - FG365LEC) for calibration purposes. Using the stage, itwas possible to manoeuver each of the fibres into the focus ofthe beam in turn. To swap between fibres, the stage was simplytranslated laterally.
The SMF-28-J9 fibre supported a 10.4 µm 1/e2 mode fielddiameter at 1550 nm. From the simulations carried out in the toppanel of Fig. 4, the size of the optimum PSF was determined withrespect to the Gaussian mode of the fibre. This was used to cal-culate that the optimum focal ratio for coupling efficiently intoSMF-28-J9 at 1550 nm was f /5.3 ± 0.1 (we note this assumedthat the apodised beam behaved as a Gaussian beam). The fo-cal ratio of the beam was governed by the distance between thefocusing OAP and the lens on the rig. To set the position of thesmall lens and hence obtain the desired f /#, the following equa-tion was used
slens = flens
(1 −
foap
f# · doap
), (2)
where slens is the distance of the small lens from the originalfocus of the OAP, flens is the focal length of the small lens(7.5 mm), foap is the focal length of the OAP (519 mm) and doapis the diameter of the beam at the OAP (∼ 8 mm). This equa-tion is based on the thin lens equation and was used to roughlyposition the small lens with respect to the OAP initially.
3.3. Photometer
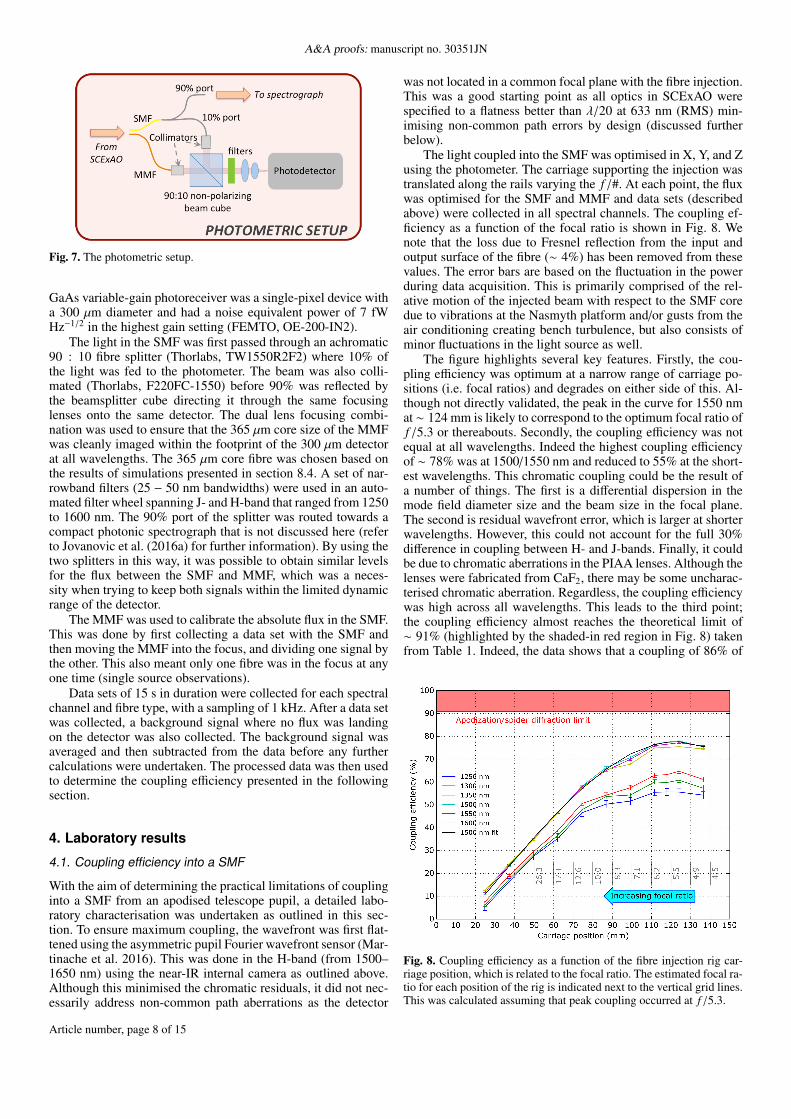
The SMF and MMF were routed to the photometer, which isshown in Fig. 7. The aim was to reimage both beams onto asingle photodetector. The MMF was first collimated (Thorlabs,F220FC-1550) before 10% of the light was transmitted througha 90 : 10 beam cube and refocussed (using Thorlabs, AC080-020-C and C230TMD-C) onto a sensitive photodetector. The In-
Article number, page 7 of 15
A&A proofs: manuscript no. 30351JN
Fig. 7. The photometric setup.
GaAs variable-gain photoreceiver was a single-pixel device witha 300 µm diameter and had a noise equivalent power of 7 fWHz−1/2 in the highest gain setting (FEMTO, OE-200-IN2).
The light in the SMF was first passed through an achromatic90 : 10 fibre splitter (Thorlabs, TW1550R2F2) where 10% ofthe light was fed to the photometer. The beam was also colli-mated (Thorlabs, F220FC-1550) before 90% was reflected bythe beamsplitter cube directing it through the same focusinglenses onto the same detector. The dual lens focusing combi-nation was used to ensure that the 365 µm core size of the MMFwas cleanly imaged within the footprint of the 300 µm detectorat all wavelengths. The 365 µm core fibre was chosen based onthe results of simulations presented in section 8.4. A set of nar-rowband filters (25 − 50 nm bandwidths) were used in an auto-mated filter wheel spanning J- and H-band that ranged from 1250to 1600 nm. The 90% port of the splitter was routed towards acompact photonic spectrograph that is not discussed here (referto Jovanovic et al. (2016a) for further information). By using thetwo splitters in this way, it was possible to obtain similar levelsfor the flux between the SMF and MMF, which was a neces-sity when trying to keep both signals within the limited dynamicrange of the detector.
The MMF was used to calibrate the absolute flux in the SMF.This was done by first collecting a data set with the SMF andthen moving the MMF into the focus, and dividing one signal bythe other. This also meant only one fibre was in the focus at anyone time (single source observations).
Data sets of 15 s in duration were collected for each spectralchannel and fibre type, with a sampling of 1 kHz. After a data setwas collected, a background signal where no flux was landingon the detector was also collected. The background signal wasaveraged and then subtracted from the data before any furthercalculations were undertaken. The processed data was then usedto determine the coupling efficiency presented in the followingsection.
4. Laboratory results
4.1. Coupling efficiency into a SMF
With the aim of determining the practical limitations of couplinginto a SMF from an apodised telescope pupil, a detailed labo-ratory characterisation was undertaken as outlined in this sec-tion. To ensure maximum coupling, the wavefront was first flat-tened using the asymmetric pupil Fourier wavefront sensor (Mar-tinache et al. 2016). This was done in the H-band (from 1500–1650 nm) using the near-IR internal camera as outlined above.Although this minimised the chromatic residuals, it did not nec-essarily address non-common path aberrations as the detector
was not located in a common focal plane with the fibre injection.This was a good starting point as all optics in SCExAO werespecified to a flatness better than λ/20 at 633 nm (RMS) min-imising non-common path errors by design (discussed furtherbelow).
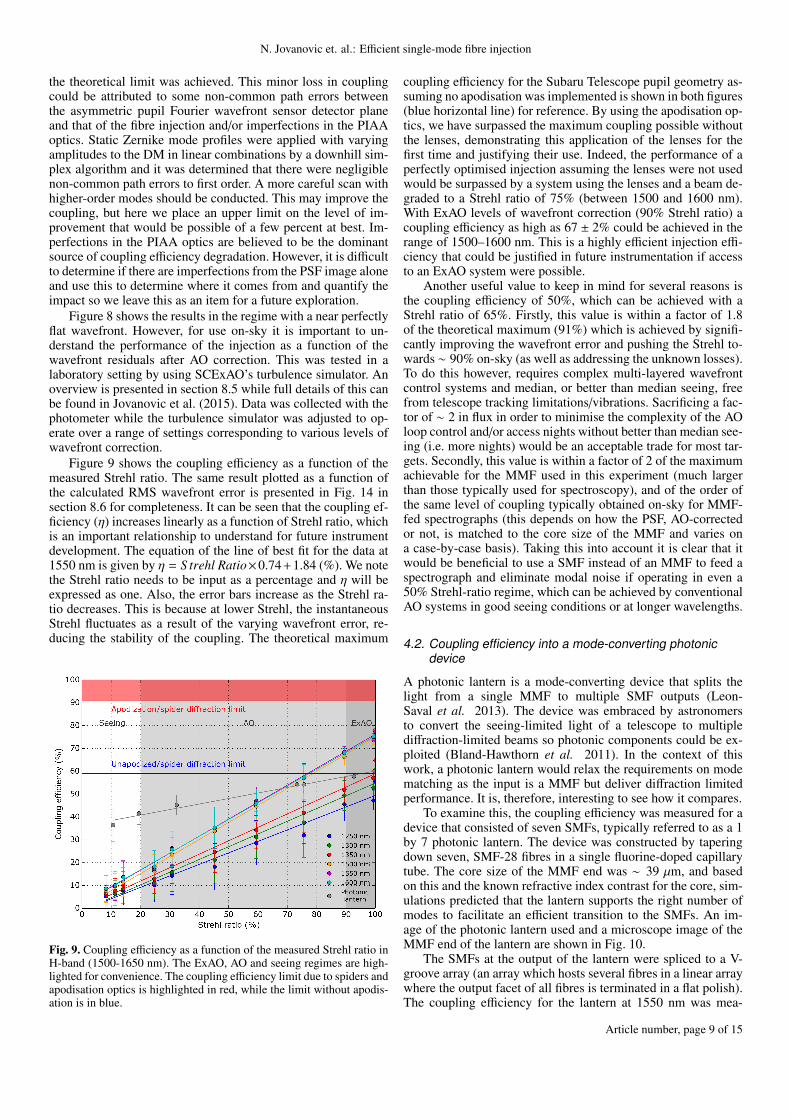
The light coupled into the SMF was optimised in X, Y, and Zusing the photometer. The carriage supporting the injection wastranslated along the rails varying the f /#. At each point, the fluxwas optimised for the SMF and MMF and data sets (describedabove) were collected in all spectral channels. The coupling ef-ficiency as a function of the focal ratio is shown in Fig. 8. Wenote that the loss due to Fresnel reflection from the input andoutput surface of the fibre (∼ 4%) has been removed from thesevalues. The error bars are based on the fluctuation in the powerduring data acquisition. This is primarily comprised of the rel-ative motion of the injected beam with respect to the SMF coredue to vibrations at the Nasmyth platform and/or gusts from theair conditioning creating bench turbulence, but also consists ofminor fluctuations in the light source as well.
The figure highlights several key features. Firstly, the cou-pling efficiency was optimum at a narrow range of carriage po-sitions (i.e. focal ratios) and degrades on either side of this. Al-though not directly validated, the peak in the curve for 1550 nmat ∼ 124 mm is likely to correspond to the optimum focal ratio off /5.3 or thereabouts. Secondly, the coupling efficiency was notequal at all wavelengths. Indeed the highest coupling efficiencyof ∼ 78% was at 1500/1550 nm and reduced to 55% at the short-est wavelengths. This chromatic coupling could be the result ofa number of things. The first is a differential dispersion in themode field diameter size and the beam size in the focal plane.The second is residual wavefront error, which is larger at shorterwavelengths. However, this could not account for the full 30%difference in coupling between H- and J-bands. Finally, it couldbe due to chromatic aberrations in the PIAA lenses. Although thelenses were fabricated from CaF2, there may be some uncharac-terised chromatic aberration. Regardless, the coupling efficiencywas high across all wavelengths. This leads to the third point;the coupling efficiency almost reaches the theoretical limit of∼ 91% (highlighted by the shaded-in red region in Fig. 8) takenfrom Table 1. Indeed, the data shows that a coupling of 86% of
Fig. 8. Coupling efficiency as a function of the fibre injection rig car-riage position, which is related to the focal ratio. The estimated focal ra-tio for each position of the rig is indicated next to the vertical grid lines.This was calculated assuming that peak coupling occurred at f /5.3.
Article number, page 8 of 15
N. Jovanovic et. al.: Efficient single-mode fibre injection
the theoretical limit was achieved. This minor loss in couplingcould be attributed to some non-common path errors betweenthe asymmetric pupil Fourier wavefront sensor detector planeand that of the fibre injection and/or imperfections in the PIAAoptics. Static Zernike mode profiles were applied with varyingamplitudes to the DM in linear combinations by a downhill sim-plex algorithm and it was determined that there were negligiblenon-common path errors to first order. A more careful scan withhigher-order modes should be conducted. This may improve thecoupling, but here we place an upper limit on the level of im-provement that would be possible of a few percent at best. Im-perfections in the PIAA optics are believed to be the dominantsource of coupling efficiency degradation. However, it is difficultto determine if there are imperfections from the PSF image aloneand use this to determine where it comes from and quantify theimpact so we leave this as an item for a future exploration.
Figure 8 shows the results in the regime with a near perfectlyflat wavefront. However, for use on-sky it is important to un-derstand the performance of the injection as a function of thewavefront residuals after AO correction. This was tested in alaboratory setting by using SCExAO’s turbulence simulator. Anoverview is presented in section 8.5 while full details of this canbe found in Jovanovic et al. (2015). Data was collected with thephotometer while the turbulence simulator was adjusted to op-erate over a range of settings corresponding to various levels ofwavefront correction.
Figure 9 shows the coupling efficiency as a function of themeasured Strehl ratio. The same result plotted as a function ofthe calculated RMS wavefront error is presented in Fig. 14 insection 8.6 for completeness. It can be seen that the coupling ef-ficiency (η) increases linearly as a function of Strehl ratio, whichis an important relationship to understand for future instrumentdevelopment. The equation of the line of best fit for the data at1550 nm is given by η = S trehl Ratio×0.74+1.84 (%). We notethe Strehl ratio needs to be input as a percentage and η will beexpressed as one. Also, the error bars increase as the Strehl ra-tio decreases. This is because at lower Strehl, the instantaneousStrehl fluctuates as a result of the varying wavefront error, re-ducing the stability of the coupling. The theoretical maximum
Fig. 9. Coupling efficiency as a function of the measured Strehl ratio inH-band (1500-1650 nm). The ExAO, AO and seeing regimes are high-lighted for convenience. The coupling efficiency limit due to spiders andapodisation optics is highlighted in red, while the limit without apodis-ation is in blue.
coupling efficiency for the Subaru Telescope pupil geometry as-suming no apodisation was implemented is shown in both figures(blue horizontal line) for reference. By using the apodisation op-tics, we have surpassed the maximum coupling possible withoutthe lenses, demonstrating this application of the lenses for thefirst time and justifying their use. Indeed, the performance of aperfectly optimised injection assuming the lenses were not usedwould be surpassed by a system using the lenses and a beam de-graded to a Strehl ratio of 75% (between 1500 and 1600 nm).With ExAO levels of wavefront correction (90% Strehl ratio) acoupling efficiency as high as 67 ± 2% could be achieved in therange of 1500–1600 nm. This is a highly efficient injection effi-ciency that could be justified in future instrumentation if accessto an ExAO system were possible.
Another useful value to keep in mind for several reasons isthe coupling efficiency of 50%, which can be achieved with aStrehl ratio of 65%. Firstly, this value is within a factor of 1.8of the theoretical maximum (91%) which is achieved by signifi-cantly improving the wavefront error and pushing the Strehl to-wards ∼ 90% on-sky (as well as addressing the unknown losses).To do this however, requires complex multi-layered wavefrontcontrol systems and median, or better than median seeing, freefrom telescope tracking limitations/vibrations. Sacrificing a fac-tor of ∼ 2 in flux in order to minimise the complexity of the AOloop control and/or access nights without better than median see-ing (i.e. more nights) would be an acceptable trade for most tar-gets. Secondly, this value is within a factor of 2 of the maximumachievable for the MMF used in this experiment (much largerthan those typically used for spectroscopy), and of the order ofthe same level of coupling typically obtained on-sky for MMF-fed spectrographs (this depends on how the PSF, AO-correctedor not, is matched to the core size of the MMF and varies ona case-by-case basis). Taking this into account it is clear that itwould be beneficial to use a SMF instead of an MMF to feed aspectrograph and eliminate modal noise if operating in even a50% Strehl-ratio regime, which can be achieved by conventionalAO systems in good seeing conditions or at longer wavelengths.
4.2. Coupling efficiency into a mode-converting photonicdevice
A photonic lantern is a mode-converting device that splits thelight from a single MMF to multiple SMF outputs (Leon-Saval et al. 2013). The device was embraced by astronomersto convert the seeing-limited light of a telescope to multiplediffraction-limited beams so photonic components could be ex-ploited (Bland-Hawthorn et al. 2011). In the context of thiswork, a photonic lantern would relax the requirements on modematching as the input is a MMF but deliver diffraction limitedperformance. It is, therefore, interesting to see how it compares.
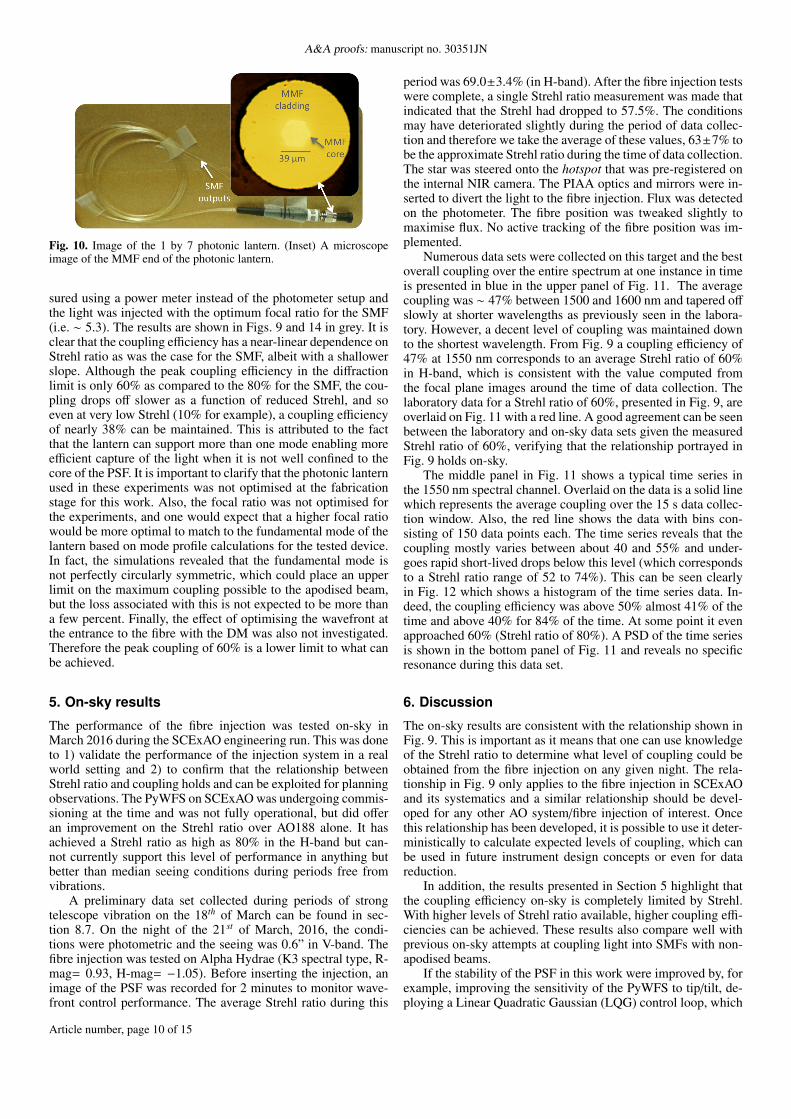
To examine this, the coupling efficiency was measured for adevice that consisted of seven SMFs, typically referred to as a 1by 7 photonic lantern. The device was constructed by taperingdown seven, SMF-28 fibres in a single fluorine-doped capillarytube. The core size of the MMF end was ∼ 39 µm, and basedon this and the known refractive index contrast for the core, sim-ulations predicted that the lantern supports the right number ofmodes to facilitate an efficient transition to the SMFs. An im-age of the photonic lantern used and a microscope image of theMMF end of the lantern are shown in Fig. 10.
The SMFs at the output of the lantern were spliced to a V-groove array (an array which hosts several fibres in a linear arraywhere the output facet of all fibres is terminated in a flat polish).The coupling efficiency for the lantern at 1550 nm was mea-
Article number, page 9 of 15
A&A proofs: manuscript no. 30351JN
Fig. 10. Image of the 1 by 7 photonic lantern. (Inset) A microscopeimage of the MMF end of the photonic lantern.
sured using a power meter instead of the photometer setup andthe light was injected with the optimum focal ratio for the SMF(i.e. ∼ 5.3). The results are shown in Figs. 9 and 14 in grey. It isclear that the coupling efficiency has a near-linear dependence onStrehl ratio as was the case for the SMF, albeit with a shallowerslope. Although the peak coupling efficiency in the diffractionlimit is only 60% as compared to the 80% for the SMF, the cou-pling drops off slower as a function of reduced Strehl, and soeven at very low Strehl (10% for example), a coupling efficiencyof nearly 38% can be maintained. This is attributed to the factthat the lantern can support more than one mode enabling moreefficient capture of the light when it is not well confined to thecore of the PSF. It is important to clarify that the photonic lanternused in these experiments was not optimised at the fabricationstage for this work. Also, the focal ratio was not optimised forthe experiments, and one would expect that a higher focal ratiowould be more optimal to match to the fundamental mode of thelantern based on mode profile calculations for the tested device.In fact, the simulations revealed that the fundamental mode isnot perfectly circularly symmetric, which could place an upperlimit on the maximum coupling possible to the apodised beam,but the loss associated with this is not expected to be more thana few percent. Finally, the effect of optimising the wavefront atthe entrance to the fibre with the DM was also not investigated.Therefore the peak coupling of 60% is a lower limit to what canbe achieved.
5. On-sky results
The performance of the fibre injection was tested on-sky inMarch 2016 during the SCExAO engineering run. This was doneto 1) validate the performance of the injection system in a realworld setting and 2) to confirm that the relationship betweenStrehl ratio and coupling holds and can be exploited for planningobservations. The PyWFS on SCExAO was undergoing commis-sioning at the time and was not fully operational, but did offeran improvement on the Strehl ratio over AO188 alone. It hasachieved a Strehl ratio as high as 80% in the H-band but can-not currently support this level of performance in anything butbetter than median seeing conditions during periods free fromvibrations.
A preliminary data set collected during periods of strongtelescope vibration on the 18th of March can be found in sec-tion 8.7. On the night of the 21st of March, 2016, the condi-tions were photometric and the seeing was 0.6” in V-band. Thefibre injection was tested on Alpha Hydrae (K3 spectral type, R-mag= 0.93, H-mag= −1.05). Before inserting the injection, animage of the PSF was recorded for 2 minutes to monitor wave-front control performance. The average Strehl ratio during this
period was 69.0±3.4% (in H-band). After the fibre injection testswere complete, a single Strehl ratio measurement was made thatindicated that the Strehl had dropped to 57.5%. The conditionsmay have deteriorated slightly during the period of data collec-tion and therefore we take the average of these values, 63±7% tobe the approximate Strehl ratio during the time of data collection.The star was steered onto the hotspot that was pre-registered onthe internal NIR camera. The PIAA optics and mirrors were in-serted to divert the light to the fibre injection. Flux was detectedon the photometer. The fibre position was tweaked slightly tomaximise flux. No active tracking of the fibre position was im-plemented.
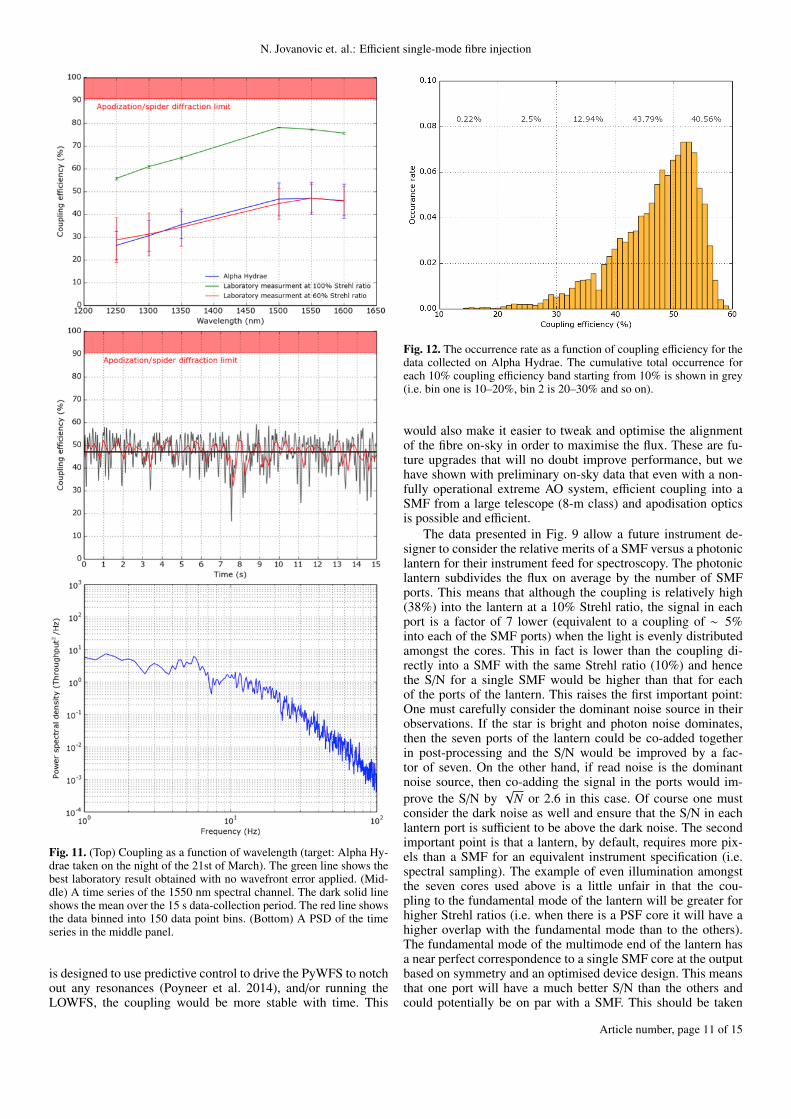
Numerous data sets were collected on this target and the bestoverall coupling over the entire spectrum at one instance in timeis presented in blue in the upper panel of Fig. 11. The averagecoupling was ∼ 47% between 1500 and 1600 nm and tapered offslowly at shorter wavelengths as previously seen in the labora-tory. However, a decent level of coupling was maintained downto the shortest wavelength. From Fig. 9 a coupling efficiency of47% at 1550 nm corresponds to an average Strehl ratio of 60%in H-band, which is consistent with the value computed fromthe focal plane images around the time of data collection. Thelaboratory data for a Strehl ratio of 60%, presented in Fig. 9, areoverlaid on Fig. 11 with a red line. A good agreement can be seenbetween the laboratory and on-sky data sets given the measuredStrehl ratio of 60%, verifying that the relationship portrayed inFig. 9 holds on-sky.
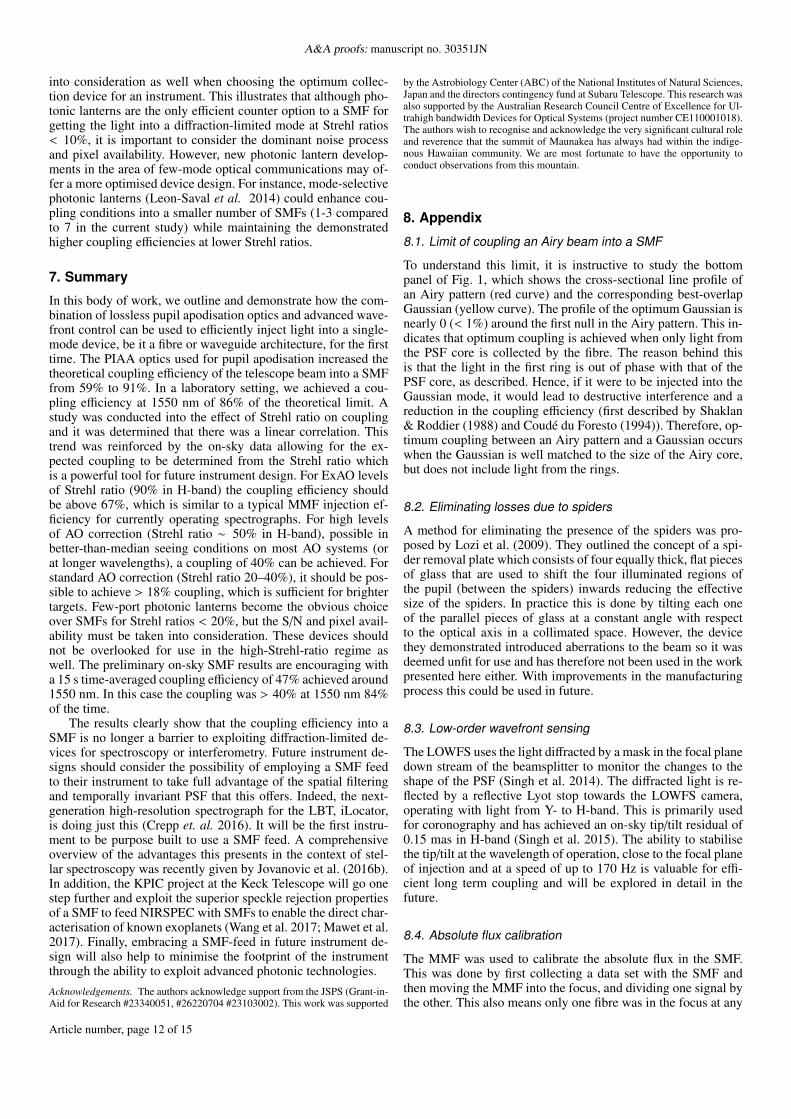
The middle panel in Fig. 11 shows a typical time series inthe 1550 nm spectral channel. Overlaid on the data is a solid linewhich represents the average coupling over the 15 s data collec-tion window. Also, the red line shows the data with bins con-sisting of 150 data points each. The time series reveals that thecoupling mostly varies between about 40 and 55% and under-goes rapid short-lived drops below this level (which correspondsto a Strehl ratio range of 52 to 74%). This can be seen clearlyin Fig. 12 which shows a histogram of the time series data. In-deed, the coupling efficiency was above 50% almost 41% of thetime and above 40% for 84% of the time. At some point it evenapproached 60% (Strehl ratio of 80%). A PSD of the time seriesis shown in the bottom panel of Fig. 11 and reveals no specificresonance during this data set.
6. Discussion
The on-sky results are consistent with the relationship shown inFig. 9. This is important as it means that one can use knowledgeof the Strehl ratio to determine what level of coupling could beobtained from the fibre injection on any given night. The rela-tionship in Fig. 9 only applies to the fibre injection in SCExAOand its systematics and a similar relationship should be devel-oped for any other AO system/fibre injection of interest. Oncethis relationship has been developed, it is possible to use it deter-ministically to calculate expected levels of coupling, which canbe used in future instrument design concepts or even for datareduction.
In addition, the results presented in Section 5 highlight thatthe coupling efficiency on-sky is completely limited by Strehl.With higher levels of Strehl ratio available, higher coupling effi-ciencies can be achieved. These results also compare well withprevious on-sky attempts at coupling light into SMFs with non-apodised beams.
If the stability of the PSF in this work were improved by, forexample, improving the sensitivity of the PyWFS to tip/tilt, de-ploying a Linear Quadratic Gaussian (LQG) control loop, which
Article number, page 10 of 15
N. Jovanovic et. al.: Efficient single-mode fibre injection
Fig. 11. (Top) Coupling as a function of wavelength (target: Alpha Hy-drae taken on the night of the 21st of March). The green line shows thebest laboratory result obtained with no wavefront error applied. (Mid-dle) A time series of the 1550 nm spectral channel. The dark solid lineshows the mean over the 15 s data-collection period. The red line showsthe data binned into 150 data point bins. (Bottom) A PSD of the timeseries in the middle panel.
is designed to use predictive control to drive the PyWFS to notchout any resonances (Poyneer et al. 2014), and/or running theLOWFS, the coupling would be more stable with time. This
Fig. 12. The occurrence rate as a function of coupling efficiency for thedata collected on Alpha Hydrae. The cumulative total occurrence foreach 10% coupling efficiency band starting from 10% is shown in grey(i.e. bin one is 10–20%, bin 2 is 20–30% and so on).
would also make it easier to tweak and optimise the alignmentof the fibre on-sky in order to maximise the flux. These are fu-ture upgrades that will no doubt improve performance, but wehave shown with preliminary on-sky data that even with a non-fully operational extreme AO system, efficient coupling into aSMF from a large telescope (8-m class) and apodisation opticsis possible and efficient.
The data presented in Fig. 9 allow a future instrument de-signer to consider the relative merits of a SMF versus a photoniclantern for their instrument feed for spectroscopy. The photoniclantern subdivides the flux on average by the number of SMFports. This means that although the coupling is relatively high(38%) into the lantern at a 10% Strehl ratio, the signal in eachport is a factor of 7 lower (equivalent to a coupling of ∼ 5%into each of the SMF ports) when the light is evenly distributedamongst the cores. This in fact is lower than the coupling di-rectly into a SMF with the same Strehl ratio (10%) and hencethe S/N for a single SMF would be higher than that for eachof the ports of the lantern. This raises the first important point:One must carefully consider the dominant noise source in theirobservations. If the star is bright and photon noise dominates,then the seven ports of the lantern could be co-added togetherin post-processing and the S/N would be improved by a fac-tor of seven. On the other hand, if read noise is the dominantnoise source, then co-adding the signal in the ports would im-prove the S/N by
√N or 2.6 in this case. Of course one must
consider the dark noise as well and ensure that the S/N in eachlantern port is sufficient to be above the dark noise. The secondimportant point is that a lantern, by default, requires more pix-els than a SMF for an equivalent instrument specification (i.e.spectral sampling). The example of even illumination amongstthe seven cores used above is a little unfair in that the cou-pling to the fundamental mode of the lantern will be greater forhigher Strehl ratios (i.e. when there is a PSF core it will have ahigher overlap with the fundamental mode than to the others).The fundamental mode of the multimode end of the lantern hasa near perfect correspondence to a single SMF core at the outputbased on symmetry and an optimised device design. This meansthat one port will have a much better S/N than the others andcould potentially be on par with a SMF. This should be taken
Article number, page 11 of 15
A&A proofs: manuscript no. 30351JN
into consideration as well when choosing the optimum collec-tion device for an instrument. This illustrates that although pho-tonic lanterns are the only efficient counter option to a SMF forgetting the light into a diffraction-limited mode at Strehl ratios< 10%, it is important to consider the dominant noise processand pixel availability. However, new photonic lantern develop-ments in the area of few-mode optical communications may of-fer a more optimised device design. For instance, mode-selectivephotonic lanterns (Leon-Saval et al. 2014) could enhance cou-pling conditions into a smaller number of SMFs (1-3 comparedto 7 in the current study) while maintaining the demonstratedhigher coupling efficiencies at lower Strehl ratios.
7. Summary
In this body of work, we outline and demonstrate how the com-bination of lossless pupil apodisation optics and advanced wave-front control can be used to efficiently inject light into a single-mode device, be it a fibre or waveguide architecture, for the firsttime. The PIAA optics used for pupil apodisation increased thetheoretical coupling efficiency of the telescope beam into a SMFfrom 59% to 91%. In a laboratory setting, we achieved a cou-pling efficiency at 1550 nm of 86% of the theoretical limit. Astudy was conducted into the effect of Strehl ratio on couplingand it was determined that there was a linear correlation. Thistrend was reinforced by the on-sky data allowing for the ex-pected coupling to be determined from the Strehl ratio whichis a powerful tool for future instrument design. For ExAO levelsof Strehl ratio (90% in H-band) the coupling efficiency shouldbe above 67%, which is similar to a typical MMF injection ef-ficiency for currently operating spectrographs. For high levelsof AO correction (Strehl ratio ∼ 50% in H-band), possible inbetter-than-median seeing conditions on most AO systems (orat longer wavelengths), a coupling of 40% can be achieved. Forstandard AO correction (Strehl ratio 20–40%), it should be pos-sible to achieve > 18% coupling, which is sufficient for brightertargets. Few-port photonic lanterns become the obvious choiceover SMFs for Strehl ratios < 20%, but the S/N and pixel avail-ability must be taken into consideration. These devices shouldnot be overlooked for use in the high-Strehl-ratio regime aswell. The preliminary on-sky SMF results are encouraging witha 15 s time-averaged coupling efficiency of 47% achieved around1550 nm. In this case the coupling was > 40% at 1550 nm 84%of the time.
The results clearly show that the coupling efficiency into aSMF is no longer a barrier to exploiting diffraction-limited de-vices for spectroscopy or interferometry. Future instrument de-signs should consider the possibility of employing a SMF feedto their instrument to take full advantage of the spatial filteringand temporally invariant PSF that this offers. Indeed, the next-generation high-resolution spectrograph for the LBT, iLocator,is doing just this (Crepp et. al. 2016). It will be the first instru-ment to be purpose built to use a SMF feed. A comprehensiveoverview of the advantages this presents in the context of stel-lar spectroscopy was recently given by Jovanovic et al. (2016b).In addition, the KPIC project at the Keck Telescope will go onestep further and exploit the superior speckle rejection propertiesof a SMF to feed NIRSPEC with SMFs to enable the direct char-acterisation of known exoplanets (Wang et al. 2017; Mawet et al.2017). Finally, embracing a SMF-feed in future instrument de-sign will also help to minimise the footprint of the instrumentthrough the ability to exploit advanced photonic technologies.Acknowledgements. The authors acknowledge support from the JSPS (Grant-in-Aid for Research #23340051, #26220704 #23103002). This work was supported
by the Astrobiology Center (ABC) of the National Institutes of Natural Sciences,Japan and the directors contingency fund at Subaru Telescope. This research wasalso supported by the Australian Research Council Centre of Excellence for Ul-trahigh bandwidth Devices for Optical Systems (project number CE110001018).The authors wish to recognise and acknowledge the very significant cultural roleand reverence that the summit of Maunakea has always had within the indige-nous Hawaiian community. We are most fortunate to have the opportunity toconduct observations from this mountain.
8. Appendix
8.1. Limit of coupling an Airy beam into a SMF
To understand this limit, it is instructive to study the bottompanel of Fig. 1, which shows the cross-sectional line profile ofan Airy pattern (red curve) and the corresponding best-overlapGaussian (yellow curve). The profile of the optimum Gaussian isnearly 0 (< 1%) around the first null in the Airy pattern. This in-dicates that optimum coupling is achieved when only light fromthe PSF core is collected by the fibre. The reason behind thisis that the light in the first ring is out of phase with that of thePSF core, as described. Hence, if it were to be injected into theGaussian mode, it would lead to destructive interference and areduction in the coupling efficiency (first described by Shaklan& Roddier (1988) and Coudé du Foresto (1994)). Therefore, op-timum coupling between an Airy pattern and a Gaussian occurswhen the Gaussian is well matched to the size of the Airy core,but does not include light from the rings.
8.2. Eliminating losses due to spiders
A method for eliminating the presence of the spiders was pro-posed by Lozi et al. (2009). They outlined the concept of a spi-der removal plate which consists of four equally thick, flat piecesof glass that are used to shift the four illuminated regions ofthe pupil (between the spiders) inwards reducing the effectivesize of the spiders. In practice this is done by tilting each oneof the parallel pieces of glass at a constant angle with respectto the optical axis in a collimated space. However, the devicethey demonstrated introduced aberrations to the beam so it wasdeemed unfit for use and has therefore not been used in the workpresented here either. With improvements in the manufacturingprocess this could be used in future.
8.3. Low-order wavefront sensing
The LOWFS uses the light diffracted by a mask in the focal planedown stream of the beamsplitter to monitor the changes to theshape of the PSF (Singh et al. 2014). The diffracted light is re-flected by a reflective Lyot stop towards the LOWFS camera,operating with light from Y- to H-band. This is primarily usedfor coronography and has achieved an on-sky tip/tilt residual of0.15 mas in H-band (Singh et al. 2015). The ability to stabilisethe tip/tilt at the wavelength of operation, close to the focal planeof injection and at a speed of up to 170 Hz is valuable for effi-cient long term coupling and will be explored in detail in thefuture.
8.4. Absolute flux calibration
The MMF was used to calibrate the absolute flux in the SMF.This was done by first collecting a data set with the SMF andthen moving the MMF into the focus, and dividing one signal bythe other. This also means only one fibre was in the focus at any
Article number, page 12 of 15
N. Jovanovic et. al.: Efficient single-mode fibre injection
one time (single source observations). Simulations were carriedout to see what size of fibre would be sufficiently large enoughto capture the entire PSF, including the diffraction features ofthe spiders as well as light spread into the halo by, for example,bad seeing/bad AO correction. It was determined that 99% ofthe flux could be collected by a 365 µm core size fibre as shownin Fig. 13, and using larger fibres would not improve this bymuch but would complicate the optics in the photometer setup.Therefore this size was chosen. The fibre had an approximateextent of 2.4” on-sky. This is approximate as the fibre is used ina post-apodised plane and there is a pupil size and shape changeupon remapping that needs to be accounted for accurately.
Fig. 13. The fraction of encircled counts of the apodised PSF as a func-tion of off-axis distance in microns. (Inset) The apodised PSF logarith-mically stretched with overlaid circles showing the relative size of vari-ous MMFs.
8.5. Turbulence simulator and measuring the Strehl ratio
The turbulence simulator uses the DM to generate a constantlymoving phase screen, based on a Kolmogorov turbulence profile.The wind speed can be controlled by changing the speed of thephase map passing over the DM. The amplitude of the phase er-rors can be controlled by the amplitude applied to the DM. Also,the amount of low-order aberrations can be controlled with a sin-gle scaling coefficient, that is, a multiplicative factor applied tothe lowest Fourier modes of the Kolmogorov turbulence profile.In this way it is possible to mimic the effect of an AO systemthat typically operates on the lower-spatial-frequency modes ofthe atmosphere.
To accurately determine how much wavefront error was ap-plied in each case, non-PIAA images were collected on the in-ternal NIR camera for each setting of the turbulence simulator. Acube of 1000 images was first dark subtracted before collapsinginto a single frame corresponding to an equivalent single longintegration time image (of ∼ 5 s duration). From this, a well cal-ibrated Strehl ratio calculator was used to extract the Strehl ratio.Using Marechal’s approximation for the Strehl ratio given by
S R ∼1
e(2πω)2 , (3)
whereω is the normalised wavefront error at a given wavelength,the amount of RMS wavefront error was determined. The RMSwavefront error was calculated at a wavelength of 1550 nm.
8.6. Coupling into a SMF versus RMS wavefront error
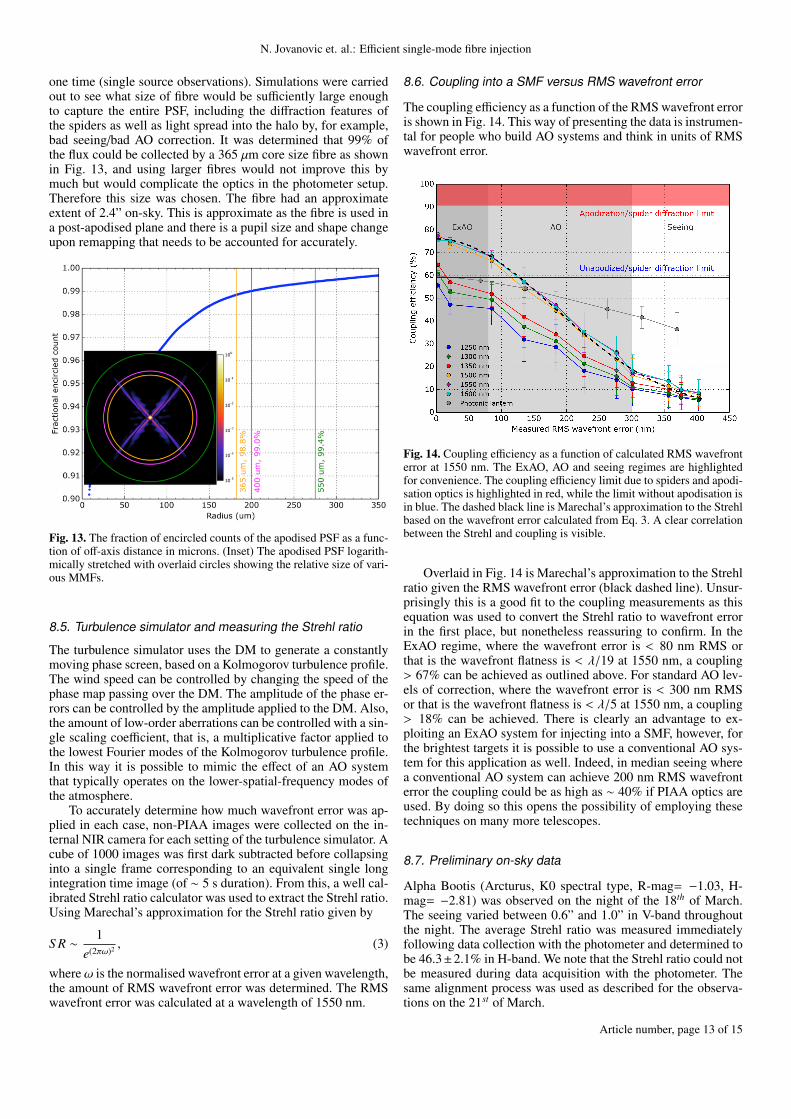
The coupling efficiency as a function of the RMS wavefront erroris shown in Fig. 14. This way of presenting the data is instrumen-tal for people who build AO systems and think in units of RMSwavefront error.
Fig. 14. Coupling efficiency as a function of calculated RMS wavefronterror at 1550 nm. The ExAO, AO and seeing regimes are highlightedfor convenience. The coupling efficiency limit due to spiders and apodi-sation optics is highlighted in red, while the limit without apodisation isin blue. The dashed black line is Marechal’s approximation to the Strehlbased on the wavefront error calculated from Eq. 3. A clear correlationbetween the Strehl and coupling is visible.
Overlaid in Fig. 14 is Marechal’s approximation to the Strehlratio given the RMS wavefront error (black dashed line). Unsur-prisingly this is a good fit to the coupling measurements as thisequation was used to convert the Strehl ratio to wavefront errorin the first place, but nonetheless reassuring to confirm. In theExAO regime, where the wavefront error is < 80 nm RMS orthat is the wavefront flatness is < λ/19 at 1550 nm, a coupling> 67% can be achieved as outlined above. For standard AO lev-els of correction, where the wavefront error is < 300 nm RMSor that is the wavefront flatness is < λ/5 at 1550 nm, a coupling> 18% can be achieved. There is clearly an advantage to ex-ploiting an ExAO system for injecting into a SMF, however, forthe brightest targets it is possible to use a conventional AO sys-tem for this application as well. Indeed, in median seeing wherea conventional AO system can achieve 200 nm RMS wavefronterror the coupling could be as high as ∼ 40% if PIAA optics areused. By doing so this opens the possibility of employing thesetechniques on many more telescopes.
8.7. Preliminary on-sky data
Alpha Bootis (Arcturus, K0 spectral type, R-mag= −1.03, H-mag= −2.81) was observed on the night of the 18th of March.The seeing varied between 0.6” and 1.0” in V-band throughoutthe night. The average Strehl ratio was measured immediatelyfollowing data collection with the photometer and determined tobe 46.3±2.1% in H-band. We note that the Strehl ratio could notbe measured during data acquisition with the photometer. Thesame alignment process was used as described for the observa-tions on the 21st of March.
Article number, page 13 of 15
A&A proofs: manuscript no. 30351JN
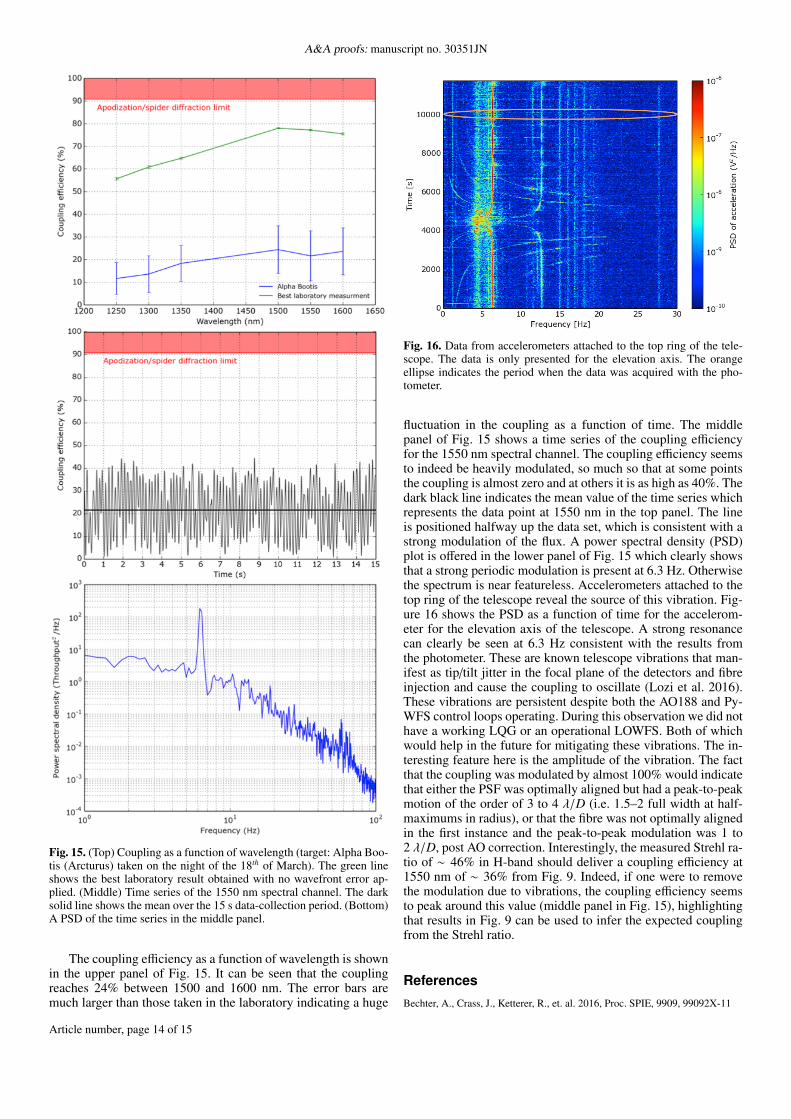
Fig. 15. (Top) Coupling as a function of wavelength (target: Alpha Boo-tis (Arcturus) taken on the night of the 18th of March). The green lineshows the best laboratory result obtained with no wavefront error ap-plied. (Middle) Time series of the 1550 nm spectral channel. The darksolid line shows the mean over the 15 s data-collection period. (Bottom)A PSD of the time series in the middle panel.
The coupling efficiency as a function of wavelength is shownin the upper panel of Fig. 15. It can be seen that the couplingreaches 24% between 1500 and 1600 nm. The error bars aremuch larger than those taken in the laboratory indicating a huge
Fig. 16. Data from accelerometers attached to the top ring of the tele-scope. The data is only presented for the elevation axis. The orangeellipse indicates the period when the data was acquired with the pho-tometer.
fluctuation in the coupling as a function of time. The middlepanel of Fig. 15 shows a time series of the coupling efficiencyfor the 1550 nm spectral channel. The coupling efficiency seemsto indeed be heavily modulated, so much so that at some pointsthe coupling is almost zero and at others it is as high as 40%. Thedark black line indicates the mean value of the time series whichrepresents the data point at 1550 nm in the top panel. The lineis positioned halfway up the data set, which is consistent with astrong modulation of the flux. A power spectral density (PSD)plot is offered in the lower panel of Fig. 15 which clearly showsthat a strong periodic modulation is present at 6.3 Hz. Otherwisethe spectrum is near featureless. Accelerometers attached to thetop ring of the telescope reveal the source of this vibration. Fig-ure 16 shows the PSD as a function of time for the accelerom-eter for the elevation axis of the telescope. A strong resonancecan clearly be seen at 6.3 Hz consistent with the results fromthe photometer. These are known telescope vibrations that man-ifest as tip/tilt jitter in the focal plane of the detectors and fibreinjection and cause the coupling to oscillate (Lozi et al. 2016).These vibrations are persistent despite both the AO188 and Py-WFS control loops operating. During this observation we did nothave a working LQG or an operational LOWFS. Both of whichwould help in the future for mitigating these vibrations. The in-teresting feature here is the amplitude of the vibration. The factthat the coupling was modulated by almost 100% would indicatethat either the PSF was optimally aligned but had a peak-to-peakmotion of the order of 3 to 4 λ/D (i.e. 1.5–2 full width at half-maximums in radius), or that the fibre was not optimally alignedin the first instance and the peak-to-peak modulation was 1 to2 λ/D, post AO correction. Interestingly, the measured Strehl ra-tio of ∼ 46% in H-band should deliver a coupling efficiency at1550 nm of ∼ 36% from Fig. 9. Indeed, if one were to removethe modulation due to vibrations, the coupling efficiency seemsto peak around this value (middle panel in Fig. 15), highlightingthat results in Fig. 9 can be used to infer the expected couplingfrom the Strehl ratio.
References
Bechter, A., Crass, J., Ketterer, R., et. al. 2016, Proc. SPIE, 9909, 99092X-11
Article number, page 14 of 15
N. Jovanovic et. al.: Efficient single-mode fibre injection
Bland-Hawthorn, J., Ellis, S. C., Leon-Saval, S. G., et. al. 2011, Nat. Comms., 2,581.
Coudé du Foresto, V., & Ridgway, S. T. 1992, European Southern ObservatoryConference and Workshop Proceedings, 39, 731
Coudé du Foresto, V. 1994, Very High Angular Resolution Imaging, 158, 261Coudé du Foresto, V., Faucherre, M., Hubin, N., & Gitton, P. 2000, A&AS, 145,
305Chazelas, B., Pepe, F., & Wildi, F. 2012, Proc. SPIE, 8450, 845013Crepp, J. R. 2014, Science, 346, 809.Crepp, J. R., Crass, J., King, D., et. al. 2016, Proc. SPIE, 9908, 990819-13Cvetojevic, N., Lawrence, J. S., Ellis, S. C., et al. 2009, Optics Express, 17,
18643Cvetojevic, N., Jovanovic, N., Betters, C., et al. 2012, A&A, 544, L1Dekany, R., Roberts, J., Burruss, R., et al. 2013, ApJ, 776, 130Feger, T., Ireland, M. J., Bento, J., & Bacigalupo, C. 2014, Proc. SPIE, 9147,
914780Ghasempour, A., Kelly, J., Muterspaugh, M. W., & Williamson, M. H. 2012,
Proc. of SPIE, 8450, 845045Guyon, O. 2003, A&A, 404, 379Halverson, S., Mahadevan, S., Ramsey, L., et al. 2014, Proc. SPIE, 9147, 91477ZHarris, R. J., MacLachlan, D. G., Choudhury, D., et al. 2015, MNRAS, 450, 428Jovanovic, N., Guyon, O., Martinache, F., Schwab, C., & Cvetojevic, N. 2014,
Proc. of SPIE, 9147, 91477PJovanovic, N., Martinache, F., Guyon, O., et al. 2015, PASP, 127, 890Jovanovic, N., Cvetojevic, N., Schwab, C., et al. 2016a, Proc. SPIE, 9908,
99080RJovanovic, N., Schwab, C., Cvetojevic, N., Guyon, O., & Martinache, F. 2016b,
PASP, 128, 121001Leon-Saval, S. G., Argyros, A., & Bland-Hawthorn, J., 2013, Nanophot., 2, 429.Leon-Saval, S. G., Fontaine, N. K., Salazar-Gil, J. R., et al., 2014, Opt. Express,
22, 1036Lozi, J., Martinache, F., & Guyon, O. 2009, PASP, 121, 1232Lozi, J., Guyon, O., Jovanovic, N., et al. 2016, Proc. SPIE, 9909, 99090JMacintosh, B., Graham, J. R., Ingraham, P., et al. 2014, Proceedings of the Na-
tional Academy of Science, 111, 12661Martinache, F., Jovanovic, N. & Guyon, O., 2016, A&A, 593, A33.Matijevich, R., Johansson, E., Johnson, L., Cavaco, J., & National Solar Obser-
vatory 2016, American Astronomical Society Meeting Abstracts, 227, 146.21Mariën, G., Jovanovic, N., Cvetojevic, N., et al. 2012, MNRAS, 421, 3641Mawet, D., Ruane, G., Xuan, W., et al. 2017, AJ, 838, 92Mennesson, B., Hanot, C., Serabyn, E., et al. 2010, Proc. SPIE, 7735, 773511Minowa, Y., Hayano, Y., Oya, S., et al. 2010, Proc. SPIE, 7736, 77363NOppenheimer, B. R., Sivaramakrishnan, A., & Makidon, R. B. 2003, Astro-
physics and Space Science Library, 289, 155Perrin, G., Woillez, J., Lai, O., et al. 2006, Science, 311, 194Poyneer, L. A., De Rosa, R. J., Macintosh, B., et al. 2014, Proc. SPIE, 9148,
91480KSchwab, C., Stürmer, J., Gurevich, Y. V., et al. 2015, PASP, 127, 880Shaklan, S., & Roddier, F. 1988, Appl. Opt., 27, 2334Singh, G., Martinache, F., Baudoz, P., et al. 2014, PASP, 126, 586Singh, G., Lozi, J., Guyon, O., et al. 2015, PASP, 127, 857Spaleniak, I., Jovanovic, N., Gross, S., et al. 2013, Optics Express, 21, 27197Trinh, C. Q., Ellis, S. C., Bland-Hawthorn, J., et al. 2013, AJ, 145, 51Vigan, A., Bonnefoy, M., Ginski, C., et al. 2016, A&A, 587, A55Wagner, R. E., & Tomlinson, W. J., 1982, Appl. Opt. 21, 2671Wang, J., Mawet, D., Ruane, G., Hu, R., & Benneke, B. 2017, AJ, 153, 183Wizinowich, P., Acton, D. S., Shelton, C., et al. 2000, PASP, 112, 315
Article number, page 15 of 15