Embed Size (px)
Citation preview
Effect of Alternative Diesel Fuels on Heat Release Curvesfor Cummins N14-410 Diesel Engine’
Yusuf Ali, Milford A. Hanna and Joseph E. Borg’SNDENT MEMBERMEM8ER
ABSTRACT
A Cummins N14-410 engine was operated on twelve fuels produced by blending
methyl tallowate, methyl soyate and fuel ethanol with No.2 diesel fuel. Engine in-cylinder
pressure data were collected and used to evaluate the rate of heat release, mass fraction
of fuel burned and charge temperature with respect to crank angle. It was observed that
the rate of heat release decreased with increasing engine speed. Peak rates of heat
release for a// fuel blends were less than for No.2 diesel fuel. When methyl tallowate was
blended with No.2 diesel fuel, the shift in the location of peak heat release was away from
top dead center (TDC) whereas the addition of ethanol to the blend shifted the location
towards TDC. Ignition delay sltghtly decreased when methyl tallowate was blended with
diesel fuel. However, ignition delays were not Acted by the methyl tallowate content of
the blend. The addition of ethanol to the fuel blends did not affect ignition delay. The
charge temperature decreased with decrease in diesel content of the fuel blends. A
reduction in charge temperature can reduce NO, emissions.
KEYWORDS: Methyl tallowate, methyl soyate, biodiesel, ethanol, Cummins engine,peak pressure, indicated mean effective pressure, rate of pressure change.
‘Journal Series Number 11128 of the University of Nebraska Agricultural Research Division.
‘The authors are: Yusuf Ali. Graduate Research Assistant, Milford A. Hanna. Professor and Director,Industrial Agricultural Products Center. and Joseph E. Borg, Graduate Research Assistant. Department OfGnlogical Systems Engineering. University of Nebraska-Lincoln, Lincoln, NE 685830726.

2
INTRODUCTION
The use of alternative fuels in compression ignition (Cl) engines to reduce exhaust
gas emissions has, in the past few years, become a popular topic of research. Much of
this research has centered on minimizing exhaust gas emissions while at the same time
optimizing power output. Most Cl engines are designed to operate on diesel fuel and
therefore, perform best while operating on that fuel. During the engine design and
optimization process, an engine manufacturer will perform in-cylinder pressure
measurements to determine cylinder pressure, rate of change in pressure, estimated rate
of heat release, mass-burned fraction and charge temperature.
High speed data acquisition systems are used by performance development
engineers and are found to be of practical value. Algorithms and techniques that provide
for an accurate representation of heat transfer and a means of very accurately determining
top dead center (TDC) have been developed. Engine cycle analysis (ECA) and fuel
injection analysis (FIA) software can be used to obtain steady state engine performance
characteristics (Gill, 1988). The combustion process in a diesel engine is usually
considered to occur in four phases according to heat release rate (Barbell et al., 1989).
Those phases are the ignition delay period, premixed burning phase, diffusion burning
phase and oxidation phase. These phases are used to follow the transformation of fuel
in the combustion cycle.
Kittelson et al. (1988) observed that soot concentration, heat release and fuel
injection data were related to one another. There was a longer delay between the start of
combustion and the start of soot formation for high equivalence ratio which was due to a

3
slightly longer premixed burning phase at high load. The increase in length of the
premixed burning period was much smaller than the increase in the formation lag time.
Shundoh et al. (1991) observed that low (1000 rev/min) and high (2000 rev/min)
engine speeds had no effect on heat release rate because the injection rates were the
same, and heat release closely followed the injection rate in type C combustion. The gas
temperature in the case of the low speed condition was higher than that at high speed and
was the reason for higher NOx and lower smoke levels at low speeds.
Alternative fuels also have been tried in direct injection compression ignition engines
and have been found to work satisfactorily. In-cylinder pressure measurements have been
performed using alternative fuels to compare with diesel fuel. Niehaus et al. (1986)
observed that diesel fuel produced more premixed burning than thermally cracked soybean
oil (TCSBO) at brake mean effective pressures (BMEP) of 100 kPa and 300 kPa.
However, premixed burning for TCSBO was greater than that for diesel fuel at a higher
BMEP of 500 kPa
Czerwinski (1994) used a rapeseed oil, ethanol and diesel fuel blend and compared
the heat release curves with diesel fuel. He observed that the addition of ethanol caused
longer ignition lag at all operating conditions. At higher and full loads, the combustion
speeds were high with strong premixed phases. The addition of rapeseed oil gave a little
lower combustion speed and lower combustion temperature as compared to diesel fuel.
The inflammation lag with rapeseed oil was slightly shorter and the combustion duration
was approximately equal to diesel fuel. The blend of diesel, rapeseed oil and ethanol had
lower heat values which diminished the power output at full load as well as the available
power during the transient operating conditions.
The overall objective of this project was to perform in-cylinder pressure
measurementson an engine to determine the rate of heat release, mass-burned fraction
of fuel and charge temperature curves on fuels produced by blending diesel, methyl
tallowate, methyl soyate and fuel ethanol in different ratios and comparing them with No.2
diesel fuel. It was expected that this study would help establish the fuel burning
characteristics needed to control exhaust emissions and engine coking
MATERIALS AND METHODS
Engine and Instrumentation: A 1991 Cummins N14-410 direct injection diesel engine
was used in this research. Specifications of the engine are presented in Table 1.
The engine was coupled to an Eaton 522 kW (700 hp) dynamatic eddy current dry
gap dynamometer. Engine torque was measured with a load cell and Daytronic system
10 integrator, and speed was measured using a 60 tooth sprocket and magnetic pickup.
Engine torque and speed were controlled with an Eaton Dynamatic dynamometer
controller in conjunction with a Jordan controls throttle controller.
In-cylinder pressure measurement was accomplished using an AVL QH32C quartz
pressure transducer connected to a KISTLER Model 5004 Dual Mode Charge Amplifier.
The pressure transducer was mounted in the head of cylinder No.1 as close as possible
to the center of the cylinder to minimize any induced measurement error. Crank angle was
measured using a Gurley Precision instruments Model 82253600-CDSD-KZ rotary shaft
encoder. The optical shaft encoder was rigidly mounted to the front of the engine and
connected to the crank shaft with a flexible coupler. The encoder was connected to a

5
SuperFlow Corp. SF-1815 Engine Cycle Analyzer Power Supply that supplied both power
and signal conditioning for the crank angle and top dead center signals. The charge
amplifier and power supply outputs were connected to a SuperFlow Corp. DAB 500 high
speed data acquisition board placed in a 66 MHZ 80486 based PC. The data were
collected using a software package ECA911 obtained from SuperFlow Corp.
Specifications for pressure transducer, charge amplifier and shaft encoder are presented
in Table 2.
Fuels : Blends of high sulfur (0.24 %) No.2 diesel fuel, methyl tallowate, methyl soyate and
fuel ethanol were made and tested. Specific blend compositions are given in Table 3. The
methyl tallowate and methyl soyate were produced by Proctor and Gamble Co. of Kansas
Cii, KS and purchased from Interchem, Inc. of Kansas City, MO. Physical properties of
methyl tallowate, methyl soyate and their blends with diesel fuel and ethanol were reported
by Ali et al. (1995).
Testing Procedures : The charge amplifier and the SuperFlow power supply were turned
on two hours before collecting data to allow the instruments to stabilize. The engine was
started and warmed-up, at low idle, long enough to establish correct oil pressure and was
checked for any fuel, oil, water and air leaks. The speed was then increased to 1600
rev/min and sufficient load was applied to raise the coolant temperature to with normal
operating range. After completion of the warm-up procedure, the intake and exhaust
restrictions were fixed at rated engine speed (1800 rev/min) and full load and from then on
were not adjusted for different speed or load changes. The test procedure consisted of an

6
eight mode steady state emissions test sequence followed by four full load test points at
different speeds to complete a full load torque and power map. Table 4 presents the
speed and load combinations used. The testing was done in the Nebraska Power
Laboratory at the University of Nebraska-Lincoln.
The engine was run at the specified speeds and loads for a minimum of 6 min and
data were collected during the last 2 min of operation. Pressure data were collected for
all speed and load combinations, but for the purpose of this paper, only data taken while
the engine was at its maximum constant load at a given speed were used. The points
were at engine speeds of 1100, 1200, 1400, 1600, 1800 and 1900 rev/min with full loads.
Engine cycle data were collected over 450 cycles at each point and averaged for analysis.
Pressure and volume data collected for each test were converted into rate of heat release,
mass burned fraction and charge temperature with respect to crank angle using a software
package EGA91 1 obtained from SuperFlow Corp. (Colorado Springs, CO).
RESULTS AND DISCUSSION
Engine in-cylinder pressure data were analyzed for rates of heat release, mass-
burned fractions and charge temperatures with respect to crank angle (CA) for different
fuel blends.
Rate of Heat Release vs. Crank Angle : This analysis shows the estimated rate of heat
release during the combustion process. The results provide a quantified assessment of
combustion rate and the means to diagnose combustion problems. The analysis was
based on pressure and volume measurements. Therefore, some assumptions were made

7
to calculate rate of heat release. The first assumption was that the trapped charge
remained in a uniform single zone of constant composition from intake valve closing to
exhaust valve opening. In actuality, large temperature gradients existed in the charge
during combustion and the chemical composition of the unburned gases was different from
the burned gases. The second assumption was that leakage and heat transfer to the wall
was negligible. The third assumption was that the charge mixture behaved as an ideal
gas. Based on these assumptions, the rate of heat release with respect to CA and location
of peak heat release for blends of diesel, methyl tallowate, methyl soyate and ethanol at
different engine speeds were calculated using ECA911, a standard engine cycle data
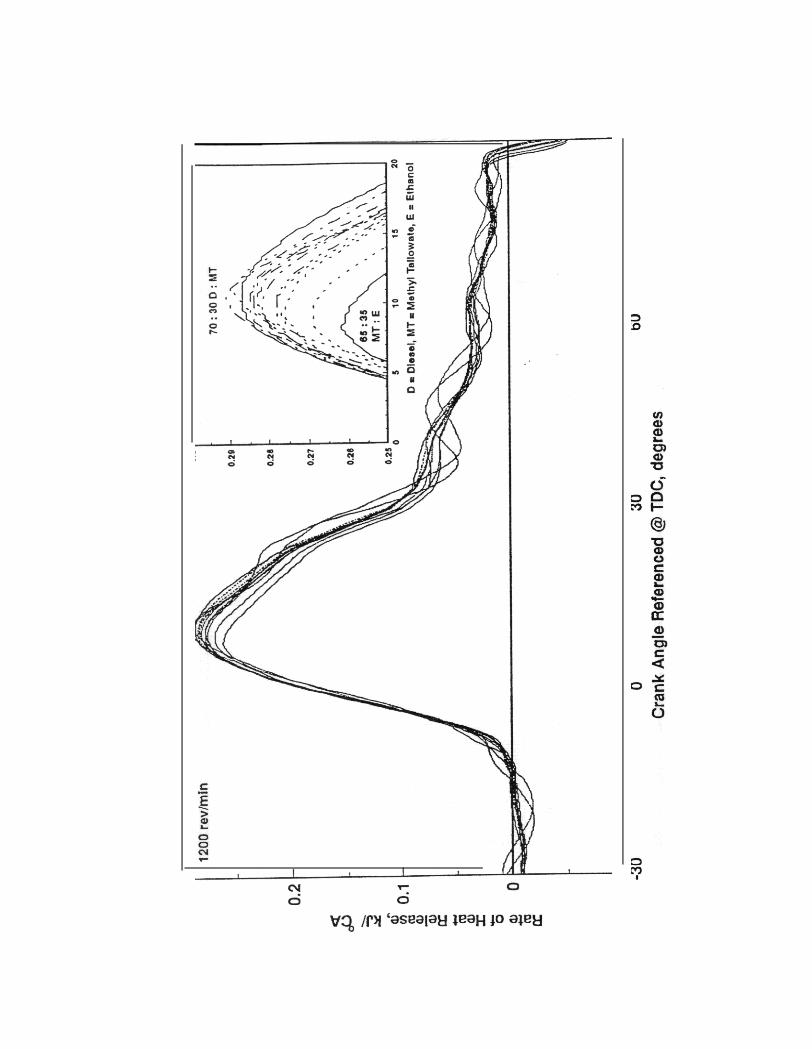
analysis package, and are presented in Table 5. Representative graphs showing the
development of change in rate of heat release with CA are shown in Figs. 1 and 2.
It was observed that peak rate of heat release decreased as engine speed
increased from 1100 rev/min to 1900 revlmin (Table 5). The location of peak rate of heat
release was delayed as the engine speed increased. Furthermore, as the diesel fuel
content of the blended fuel was reduced, the peak rate of heat release also was reduced.
The shapes of the rate of heat release curves for all fuel blends at all engine speeds were
similar to that of No.2 diesel fuel. No.2 diesel fuel had a peak rate of heat release of 0.287
W’CA at the engine’s peak torque producing speed of 1200 revlmin and 0.250 kJ/“CA at
the engine’s rated speed of 1800 rev/min. The trends of peak rates of heat release with
CA for all fuel blends at engine speeds of 1200 and 1800 revlmin are shown in Figs. 1 and
2, respectively.

8
At 1200 rev/min engine speed, peak rates of heat release for 80:20, 70:30 and
60:40 % (v/v) blends of dieseLmethyl tallowate were within 2% of that for No.2 diesel fuel.
The locations of peak rates of heat release were within 10.6 and 11.2 “CA after top dead
center (ATE) for the respective fuel blends as compared to 10.6 “CA ATDC for No.2
diesel fuel. When the methyl tallowate was replaced by fuel ethanol and methyl soyate the
peak rates of heat release were reduced by as much as 3.14% without affecting their
locations. A comparison of peak rate of heat release for No.2 diesel fuel with the 6535%
(v/v) blend of methyl tallowate:ethanol showed an 8.71 % reduction in peak rate of heat
release. A similar comparison for the 32.532.535 % (v/v) blend of methyl tallowate:methyl
soyate:ethanol showed a 6.27 % reduction. The locations of the peak rates of heat
release were 8.4 and 9.4 “CA ATDC for the respective fuel blends.
At rated engine speed of 1800 rev/min, the peak rates of heat release for the 80:20,
70:30 and 60:40 % (v/v) blends of diesel:methyl tallowate were within 1.2% Of that of No.2
diesel fuel. Locations of peak rates of heat release were within 0.4 “CA ATDC of that of
No.2 diesel fuel. When the methyl tallowate was replaced by fuel ethanol and methyl
soyate, the peak rates of heat release were reduced by as much as 2.8 % of that of No.2
diesel fuel and locations of peak rates of heat release were within 1 “CA ATDC of that of
No.2 diesel fuel. A comparison of No.2 diesel fuel with the 6535% (v/v) methyl
tallowate:ethanol showed an 11.2% reduction in peak rate of heat release. A similar
comparison for the 32.5:32.5:35% (v/v) blend of methyl tallowate:methyl soyate:ethanol
showed a 10.0% reduction. The locations of the peak rates of heat release were 15.8 and
16.8 “CA ATDC for the respective fuel blends.

9
A similar trend was observed at all other engine speeds. In general, as the amounts
of methyl tallowate/methyl soyate and ethanol were increased there were reductions in the
peak rates of heat release as compared to No.2 diesel fuel with the exception of the 70:30
and 60:40 % (v/v) blends of diesel:methyl tallowate blends, in which cases there were
slight increases at 1200 rev/min. Reductions in the peak rates of heat release were
expected as the energy contents of the blends were less than that of No.2 diesel fuel, (Ali
et al., 1995). To understand the process of heat release in detail, one must know the
mass-burned fraction of the fuel with respect to CA to determine the ignition delay and
burn duration.
Mass-Burned Fraction vs. Crank Angle : The mass burned fraction was obtained by
integrating the rate of heat release. The curve of mass-burned fraction with respect to CA
allowed for identification of ignition delay, the fully developed combustion period and the
combustion tail. Further, it gave information about how much fuel was unburned at any
point in the combustion cycle.
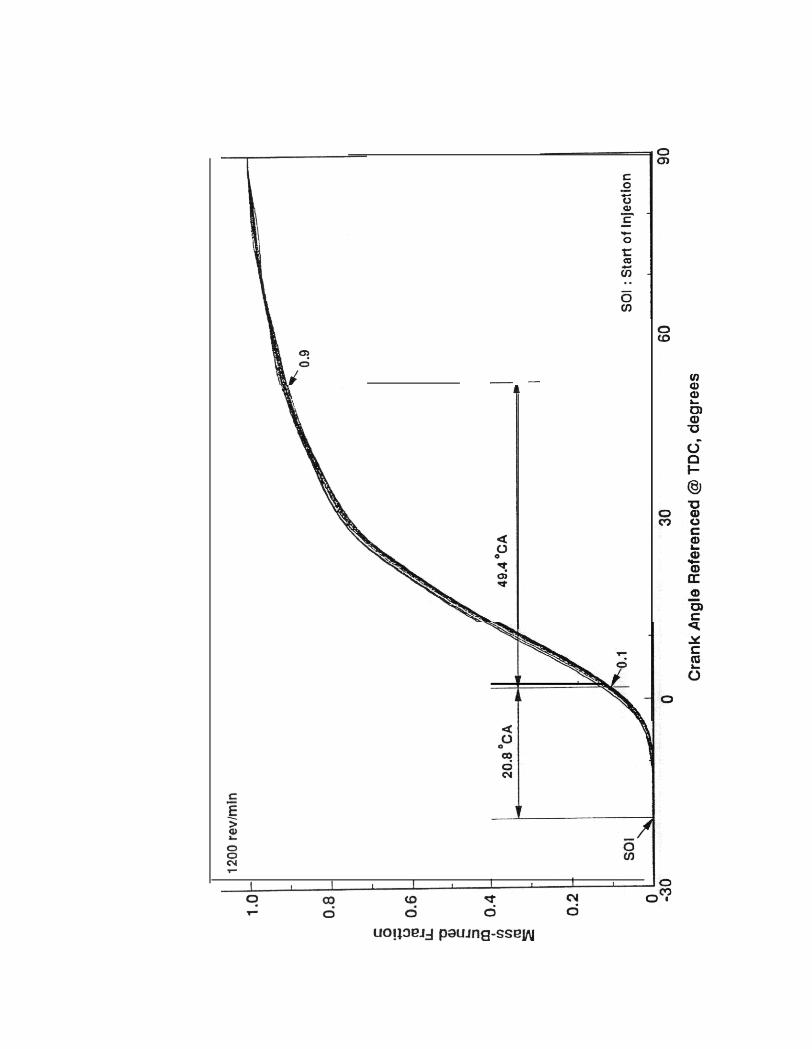
Representative curves for mass-burned fraction of the fuel with respect to CA at
1200 and 1800 rev/min engine speeds are shown in Figs. 3 and 4, respectively. The burn
duration and ignition delay in terms of CA for No.2 diesel fuel are quantified in those
figures. Three points defined in those curves are start of injection, start of combustion and
end of combustion. Technically, ignition delay is defined as the interval between start of
injection and start of combustion but to assess mass burned fraction from engine cycle
analysis, the 0 to 10 % burned range is often defined as the ignition delay and the 10 to
90% range is the burn duration (Anon. 1994). The last 10 % burned is not usually carefully

1 0
considered due to errors associated with the assumptions made in the heat-release
analysis. The quantification of these parameters is extremely useful in characterizing
combustion chamber and ignition system performance. The quantified parameters related
to ignition delay and burn duration are presented in Table 6.
It was observed that the ignition delay increased with increasing engine speed
(Table 6). The ignition delay at 1100 rev/min was in the range of 19 to 20 “CA and
increased to 26 to 27 “CA at 1900 rev/min for all fuel blends. On the other hand, the burn
duration decreased with increasing engine speed. Burn duration reduced from the range
of 50 to 52 “CA at 1100 rev/min to the range of 41 to 43 “CA at 1900 rev/min. The ignition
delay for No.2 diesel fuel was 20.8 “CA at 1200 rev/min and increased to 24.6 “CA at
rated speed of 1800 rev/min. Similarly, the burn duration was 49.4 ‘CA and 42.6 “CA at
1200 and 1800 rev/min, respectively.
At 1200 rev/min engine speed, the ignition delays for the 8020.70:30 and 60:40%
(v/v) blends of diesel:methyl tallowate were all within 0.6 “CA of that of No.2 diesel fuel.
When the engine speed was increased to 1800 rev/min, the ignition delays were found to
be 24.6 “CA, the same as No.2 diesel fuel. The burn durations at 1200 rev/min engine
speed were all within 1.8 “CA of that of No.2 diesel fuel. At 1800 rev/min the burn
durations were all within 0.4 “CA of that of No.2 diesel fuel. Thus, from the standpoint of
ignition delay and burn duration, the blends of diesel and methyl tallowate performed
similarly to No.2 diesel fuel.
When the methyl tallowate was replaced by fuel ethanol and methyl soyate, the
ignition delays at 1200 rev/min engine speed were all within 0.4 “CA and at 1800 rev/min

11
they were all within 0.2 “CA of that of No.2 diesel fuel. The burn durations at 1200 revlmin
engine speed were observed to be within 1 “CA and at a speed of 1800 rev/min the burn
durations wars observed to be within 0.4 “CA of that of No.2 diesel fuel. A comparison
of No.2 diesel fuel with the 65:35 % (v/v) blend of methyl tallowate:ethanol and
32.5:32.5:35 % (V/V) blend of methyl tallowate:methyl soyate:ethanol showed some
reduction in ignition delay as compared to No.2 diesel fuel. The ignition delays at 1200
revlmin for the 6535 and 32532.535 blends were 19.6 and 20 “CA, respectively, as
compared to 20.9 “CA for No.2 diesel fuel. At 1800 rev/min, the ignition delays were 23.6
“CA for both fuel blends as compared to 24.6 “CA for No.2 diesel fuel. When burn
durations for both fuel blends were compared with that of No.2 diesel fuel it was observed
that there were slight reductions in burn duration. At 1200 rev/min the burn durations for
the 65:35 and 32.532.535 % (v/v) blends were 48.2 and 47.6 “CA, respectively, as
compared to 49.4 “CA for No.2 diesel fuel. Similarly, at 1800 rev/min, the burn durations
were 41.2 and 39.8 “CA as compared to 42.6 “CA for No.2 diesel fuel. The reductions in
burn durations may have been caused by the presence of a high percentage of ethanol in
the blends. Since both fuel blends contained 35 % (v/v) ethanol and the ethanol was
highly flammable, the burn duration was reduced. From Fig. 4 it can be observed that
these two fuel blends did not follow the same path as No.2 diesel fuel. These two fuel
blends had an early start of combustion and an early end of combustion as compared to
all other fuel blends. Fosseen et al. (1993) also observed a reduction in ignition delay and
a shift in the peak pressure point towards TDC when they used blends of diesel fuel and
methyl soyate (from 0 to 40 %) in a Detroit Diesel Corp. 6V-92 TA engine.

12
Charge Temperature vs. Crank Angle : Charge temperature was estimated from the
measured pressure and volume data. This relationship estimated only the average
temperature.
Representative curves for charge temperature with CA at 1200 rev/min and 1800
rev/min engine speeds are shown in Figs. 5 and 6. The trends of temperature change for
all fuel blends were similar to that of No.2 diesel fuel. The locations of the peak charge
temperatures also were in a narrow range. Peak charge temperatures and locations of
peak charge temperatures for all fuels are presented in Table 7.
No.2 diesel fuel had the maximum charge temperature(Table 7). At 1200 and 1800
rev/min, the charge temperatures were 1359 “K and 1284 “K, respectively. The respective
locations of the peak charge temperatures were 28.8 and 34.8 “CA ATDC.
At 1200 rev/min the peak charge temperatures for the 8020,70:30 and 60:40 %
(viv) blends of aiesel:methyl tallowate were reduced by as much as 19 “K as compared to
No.2 diesel fuel The locations of these peak charge temperatures were within 2.6 “CA of
that of No.2 diesel fuel. The shifts in the locations of peak charge temperatures were
consistent with the locations of peak rates of heat release. When engine speed was
increased to 1800 rev/min, the peak charge temperatures were reduced by as much as
12 “K of that of No.2 diesel fuel and their locations were changed by as much as + 0.4
“CA. The reductions in peak charge temperatures were due to reductions in the total
energy contents of the fuel blends which also resulted in reduction in peak rates of heat
release.

1 3
When methyl tallowate was replaced by fuel ethanol and methyl soyate, the peak
charge temperatures at 1200 revlmin were reduced by as much as 40 “K of that of No.2
diesel fuel with no change in their locations. At 1800 rev/min, the values of peak charge
temperatures were reduced by as much as 38 “K, respectively with not much change in
their locations. These results were in agreement with the results obtained for peak rates
of heat release for similar fuel blends and engine speeds.
A comparison of peak charge temperatures for the 65:35 % (v/v) blend of methyl
tallowate:ethanol and the 32.5:32.5:35 % (v/v) blend of methyl tallowate:methyl
soyate:ethanol with No.2 diesel fuel at 1200 revlmin engine speed showed temperature
drops of as much as 100 “K. The locations of the peak charge temperatures were 30.2
“CA ATDC for both fuel blends as compared to 32.6 “CA ATDC for No.2 diesel fuel.
Similarly, at 1800 revlmin the peak charge temperatures were reduced by as much as
110°K with their locations at 31.6 and 31.8 “CA ATDC as compared to 34.8 “CA ATDC for
No.2 diesel fuel. A similar trend was observed when rates of heat release were analyzed
Fosseen.et al. (1993) also observed steady reductions in exhaust gas temperatures at
both rated speed and peak torque conditions when they used blends of diesel and methyl
soyate (0 to 40 %) in a Detroit Diesel Corp. 6V-92 engine.
Reductions in the charge temperatures with different fuel blends were expected as
the energy contents of the methyl tallowate, methyl soyate and ethanol blends were less
than that of No.2 diesel fuel (Ali et al., 1995). Reductions in charge temperature help
reduce NO, emissions from the engine.

1 4
CONCLUSIONS
A complete engine cycle analysis was conducted to analyze in-cylinder pressure
data to estimate rate of heat release, mass-burned fraction and charge temperature with
respect to crank angle. It was concluded that the rate of heat release was reduced with
increases in the amounts of methyl tallowate, methyl soyate and ethanol in the fuel blends.
There was a slight shift in the location of the peak rate of heat release away from top dead
center (TDC) when only methyl tallowate was blended with No.2 diesel fuel. When 35 %
of the methyl tallowate was replaced by ethanol, there was a further decrease in the rate
of heat release and the location of peak rate of heat release was shifted towards TDC at
both peak torque and rated engine speeds. Ignition delay and burn duration were
determined from mass burned fraction data. There was a slight decrease in ignition delay
when methyl tallowate was blended with diesel fuel. However, ignition delays were not
affected by the amount of methyl tallowate in the blend. Further, replating 35 % of the
methyl tallowate/methyl soyate by ethanol did not affect ignition delay at either peak torque
or rated engine speeds. The burn duration was more or less the same for all fuel blends.
The charge temperature decreased with increases in amounts of methyl tallowate,
methyl soyate and ethanol of the fuel blends. Maximum charge temperature was observed
for No.2 diesel fuel at both peak torque and rated engine speeds. The peak charge
temperatures and their locations followed the same trends as the peak rates of heat
release for all fuel blends. Therefore, looking at the results of rate of heat release, mass
burned fraction, ignition delay, burn duration and charge temperature for all fuel blends it
was concluded that since the performance of the engine with all fuel blends was similar to

1 5
that of No.2 diesel fuel, they should have no effect on long term engine performance.
ACKNOWLEDGMENT
The authors gratefully acknowledge the assistance of Kevin G. Johnson, Lab
Technician, Nebraska Power Laboratory, University of Nebraska-Lincoln, with engine
operations and data collection.

1 6
REFERENCES
Anon. 1994. Engine cycle analyzer; Operator’s manual. SuperFlow Corp. ColoradoSprings, CO. pp 3: 94-105.
Ali, Y., Hanna, M.A. and Borg, J.E. 1996. In-cylinder pressure characteristics of a Clengine using blends of diesel fuel and methyl esters of beef tallow.Tf?ANSACT/ONS of the ASAE (accepted).
Barbella, R. Bertoli, C. Ciajolo, A. D’Anna, A. and Masi, S. 1989. In-cylinder sampling ofhigh molecular weight hydrocarbons from a D.I. light duty diesel engine. SAE paperNo. 890437. Society of Automotive Engineers, Warrendale, PA.
Czerwinski, J. 1994. Performance of HD-DI-diesel engine with addition of ethanol andrapeseed oil. SAE paper No. 940545. Society of Automotive Engineers,Warrendale, PA.
Fosseen, D., Manicom, B., Green, C. and Goetz, W. 1993. Methyl soyate evaluation ofvarious diesel blends in a DDC 6V-92 TA engine. Fosseen Manufacturing andDevelopment. Radcliff, IA. (Report prepared for National Soydiesel DevelopmentBoard, Jefferson City, MO.).
Gill, A.P. 1988. Design choices for 1990’s low emission diesel engines. SAEpaper No.880350. society of Automotive Engineers, Warrendale, PA.
Kittelson, D.B., Pipho, M.J., Ambs, J.L. and Luo, L. 1988. In-cylinder measurements ofsoot production in a direct injection diesel engine. SAE paper NO. 880344. Society
of Automotive Engineers, Warrendale, PA.
Niehaus, HA., Goering, C.E., Savage, L.D. and Sorenson, S.C. 1986. Cracked soybeanoil as a fuel for a diesel engine. TRANSACTIONS of the ASAE, 29(3):683-9.
Shundoh, S., Kakegawa, T., Tsujimura, K. and Kobauashi, S. 1991. The effect of injectionparameters and swirl on diesel combustion with high pressure fuel injection. SAEpaper No. 910489. Sobety of Automotive Engineers, Warrendale, PA.

1 7
‘able 1. Engine specifications.
Specifications Cummins N14-410engine
Type of engine 6 cylinder, 4-stroke, direct injection
Horsepower (Rated) 4 1 0
Bore x stroke 140 mm x 152 mm
Displacement 14 liters
Compression ratio l&3:1
Valves per cylinder 4
Aspiration Turbocharged & charge air cooler
Turbocharger Holsett type BHT 38

able 2 : Pressure transducer, charge amplifier and shaft encoder specification’
1 8
Diezoelectric Pressure Transducer
Uodel
3ynamic measuring range, (FSO), Mpa
sverload, MPa
Sensitivity, pC/MPa’
Linearity, % FSO
IMEP reproducibility. % error
Lifetime, cycles to failure
Charge Amplifier
Model
me
-inearity, % FSO
kale setting
Shaft Encoder
Wodel
We
Signal pulse/revolution
Index pulse/revolution
C = micro Coulomb
AVL QH3’2C
0 - 20
3 0
2.673
< f 0.2
< 2.0
,3x107
KISTLER 5004
Duel Mode
< * 0.05
5 user selectable settings
82253600-CDSD-KZ
Optical
3600
1

19
Table 3. Fuel blends tested.
Blend No. 2Number Diesel Fuel
%
Methyl MethylTallowate Soyate
% %
Ethanol
%
1 100 0 0 0
2 80 13 0 7
3 70 19.5 0
4 60 26 0
5 80 6 . 5 6 . 5
6 70 9.75 9.75
7 60 13 13
8 80 20 0
9 70 30 0
10 6 0 40 0
1 1 0 6 5 0
12 0 32.5 32.5
10.5
14
7
10.5
14
0
0
0
35
35

20
Table 4. Engine speeds and loads used to determine
Load%
100
75
50
IO
100
75
50
0
100
100
100
100

21
Table 5 : Peak rate of heat release for each fuel blend at different speeds and location ofthe peak rate of heat release with respect to TDC.
T ==7
Fuel Blends
No.2 diesel fuel(1oo:o)
D : M T(80 : 20)
D:MT(70 : 30)
D:MT(60 : 40)
D:MT:E(80:13:7)
D:MT:E(70 : 19.5 : 10.5)
D:MT:E(60 : 26 : 14)
D : M T : M S : E(80 : 6.5 : 6.5 : 7)
D:MT:MS:E(70 : 9.75 : 9.75 : 10.5)
D : M T : M S : E(60:13:13:14)
MT:E(65 :35)
tiT:MS:E32.5 : 32.5 : 35)
= Diesel
1100revlmin
0.288(10.8)
0.286(9.8)
0.284(94
0.283(10.0)
0.282(10.4)
0.282(10.4)
0.276(9.0)
0.283(10.0)
0.275(10.4)
0.275(11.0)
0.248C3.6)
0.261(9.0)
Peakr-.-a
1200revlmin
0.287(10.6)
0.284(10.6)
0.291(10.6)
0.289(11.2)
0.285(10.0)
0.282(10.0)
0.276(9.6)
0.283(10.4)
0.278(10.4)
0.278(9.6)
0.262(8.4)
0.269(9.4)
of heat,rankAn
1400rev/min
0.285(14.0)
0.284(13.8)
0.284(13.8)
0.278(13.8)
0.281(13.8)
0.281(13.8)
0.272(13.4)
0.281(13.6)
0.273(13.4)
0.278(13.2)
0.253(12.2)
0.262(12.4)
!ase at eATDC)
1600revimin
0.271(15.8)
0.275(15.8)
0.268(16.0)
0.268(16.0)
0.269(15.6)
0.269(15.6)
0.261(15.0)
0.268(152)
0.263(152)
0.268(15.0)
0.242(13.8)
0.249(14.0)
-
speed) A
1800rev/min
0.250(18.6)
0.248(18.6)
0.248(19.0)
0.247(19.0)
0.247(18.6)
0.245(18.3
0.243(18.0)
0.247(18.0)
0.244(17.6)
0.246(17.8)
0.222(15.8)
0.225(16.8)
-
1900rev/min
0.224(21.2)
0.226(21.2)
0.227(21.4)
0.219(20.8)
0.221(21.2)
0221(21.0)
0.240(17.8)
0.223(204
0.219(19.8)
0.219(20.0)
0.199(20.0)
0.203(19.6)
-
MT = Methyl TallowateMS = Methyl SoyateE = Ethanol

22
Table 6 : Ignition delay (ID) and bum duration (BD) of each fuel blend at different enginespeeds.
Fuel Blends
N o . 2 d i e s e l f u e l(100 :O)
D:MT
D:MT
D:MT
D:MT:E(80 : 13 : 7)
D:MT:E(70 : 19.5 : 10.5)
rl:MT:E(60:26:14)
D:MT:MS:E(80 : 6.5 : 6.5 : 7)
D:MT:MS:E(70 : 9.75 : 9.75 : 10.5)
D : M T : M S : E(60: 13 : 13 : 14)
MT:E(65 : 35)
MT:MS:E32.5 :32.5 : 35)
-
-
IDEm
1100revlmin
19.451.4
/ M eqreeS
1200 1400 1600revlmin .evlmin revimin
20.8 22.2 23.049.4 46.4 43.2
1800 1900revlmin revlmlr
24.6 26.842.6 43.6
I D 20.0 20.6 22.2 23.0 24.6 26.8BO 51.0 40.0 45.6 43.2 424 43.2
I D 20.2 20.4 22.2 22.8 24.6 26.680 50.6 47.6 45.2 43.0 43.2 43.4
I D 19.6 20.2 22.2 23.0 24.6 27.0B D 50.6 49.0 45.8 43.0 42.8 43.6
20.0 20.4 22.0 22.8 24.6 26.851.0 40.4 45.2 41.6 42.4 41.6
I D 20.0 20.6 220 22.8 24.4 26.8BD 51.0 48.2 45.2 41.6 42.6 41.6
19.8 20.4 21.6 22.6 24.4 24.449.8 48.0 44.6 41.8 42.6 42.0
I D 20.0 20.6 22.0 23.0 24.6 26.83D 50.8 49.4 45.4 43.4 42.6 43.2
I D 19.6 20.4 21.8BD 51.4 50.4 46.4
22.8 24.6 26.643.8 43.6 43.8
ID 19.8 20.4 21.8 22.8 24.6 26.6BD 51.0 48.8 45.2 42.6 42.2 42.6
I D 18.8 19.6 21.0B D 52.2 48.2 46.4
23.6 26.241.2 42.8
ID3D
19.250.8
-
20.0 21.047.6 42.8
21.841.4
22.039.8
-
23.6 26.239.8 41.6

Fuel Blends
No.2 diesel fuel(100 : 0)
D:MT(80 : 201
D:MT(70 :30)
D:MT(60 : 40)
D:MT:E(80:13:7)
D:MT:E(70.19.5 : 10.5)
D:MT:E(60:26:14)
D:MT:MS:E(60 : 6.5 : 6.5 : 7)
D:MT:MS:E(70 : 9.75 : 9.75 : 10.5)
D : M T : M S : E(60:13:13:14)
MT:E(65 :35)
tiT:MS:E32.5 :32.5 :35)
23
mature for each fuel blend at different speeds and its locationnL.
1100revlmin
1330(32.6)
1325(31 .O)
1324(30.4)
1329(31.2)
1313(31.8)
1313(31.6)
1293(30.6)
1305(31.0)
1286(32.2)
1295(33.0)
1204(30.2)
1236(30.2)
Peakch, argf atemoerature “K atI
1200revlmin
1359(28.8)
@
1400revlmin
1373(31.6)
gle
1600revlmin
1359(33.0)
1340(29.0)
1325(31.0)
1361(33.4)
1355(29.8)
1363(31.4)
1350(33.2)
1349(31.4)
1367(31.6)
1351(33.0)
1351(26.6)
1364(31.4)
1346(32.8)
1345(28.6)
1364(31.4)
1346(32.8)
1328(28.6)
1337(31.0)
1315(32.8)
1334(28.6)
1358(31.2)
1340(33.0)
1321(28.6)
1335(31.0)
1326(32.8)
1319(26.6)
1339(31.0)
1330(32.8)
1261ew
1255(30.0)
1240(31.8)
1293(26.4)
-
1282(30.4)
-
1263(31.8)
-
,hspeed,
1800revlmin
1284(34.6)
1281(34.4)
1272(34.4)
1275(35.2)
1273(34.4)
1269(34.4)
1254(34.4)
1262(35.0)
1246(34.8)
1259(34.8)
1170(31.6)
1194(31.8)
1900revlmir
1171(35.6)
1166(35.8)
1177(35.2)
1147(35.4)
1160(35.4)
1160(35.4)
1244(34.2)
1156(35.6)
1150(35.4)
1145(35.4)
1059(34.3
1079(34.0)
-

I I-
-


0