Embed Size (px)
Citation preview

Zurich Open Repository and Archive
University of ZurichMain LibraryWinterthurerstr. 190CH-8057 Zurichwww.zora.uzh.ch
Year: 2011
Effect of competition on niche dynamics of syntopicgrazing ungulates: contrasting the predictions of habitat
selection models using stable isotope analysis
Codron, D; Hull, J; Brink, J S; Codron, J; Ward, D; Clauss, M
Codron, D; Hull, J; Brink, J S; Codron, J; Ward, D; Clauss, M (2011). Effect of competition on nichedynamics of syntopic grazing ungulates: contrasting the predictions of habitat selection models usingstable isotope analysis. Evolutionary Ecology Research, 13(3):217-235.Postprint available at:http://www.zora.uzh.ch
Posted at the Zurich Open Repository and Archive, University of Zurich.http://www.zora.uzh.ch
Originally published at:Codron, D; Hull, J; Brink, J S; Codron, J; Ward, D; Clauss, M (2011). Effect of competition on nichedynamics of syntopic grazing ungulates: contrasting the predictions of habitat selection models usingstable isotope analysis. Evolutionary Ecology Research, 13(3):217-235.

Effect of competition on niche dynamics of syntopicgrazing ungulates: contrasting the predictions of habitat
selection models using stable isotope analysis
Abstract
Background: Theories of density-dependent habitat selection provide two solutions forco-existence of competing species. The niche compression hypothesis predicts that speciesreduce their respective niche breadths in response to inter-specific competition. Alternatively,if the species have similar resource preferences, the subordinate species may be forced toexpand its niche to incorporate secondary resources. Aim: Determine whether grazingungulate species partition the resource by compression or expansion of dietary niches.Organisms: Black wildebeest (Connochaetes gnou) and blue wildebeest (C. taurinus).Methods: Stable carbon and nitrogen isotope analysis of faeces. Isotopic niche breadths arecompared across allopatric and sympatric wildebeest populations in South African grasslands.Results: Stable carbon and nitrogen isotope niche breadths of the two wildebeest species werevirtually identical. In sympatry, however, black wildebeest had a narrower δ13C niche breadth(indicating almost exclusive use of C4 grass), whereas blue wildebeest had a wider δ13C nichebreadth (indicating significant contributions from C3 sources). Blue wildebeest also had awider δ15N niche breadth than sympatric black wildebeest. Moreover, the δ13C nichebreadths of sympatric black wildebeest and blue wildebeest were narrower and wider,respectively, than those of allopatric populations of either species. Conclusions: Isotope nichedynamics across allopatric and sympatric populations arise due to the combined effects ofcompetition and habitat heterogeneity on resource use. Although results for black wildebeestresemble niche compression, this hypothesis cannot explain patterns observed in bluewildebeest. Expansion of the blue wildebeest niche, and restricted niche breadth of blackwildebeest, is consistent with predictions of a shared preference model in which blackwildebeest are the dominant competitor. When competition is operating, differences in theway species use secondary resources can have an important role in structuring grazerassemblages.

1
Revised MS 2638: article for submission to Evolutionary Ecology Research
Influence of competition on niche dynamics of syntopic grazing ungulates: contrasting the
predictions of habitat selection models using stable isotope analysis
Daryl Codrona,b*
, John Hullb, James S Brink
c,d, Jacqui Codron
b, David Ward
b, Marcus Clauss
a
aClinic for Zoo Animals, Exotic Pets and Wildlife, Vetsuisse Faculty, University of Zurich, Winterthurerstr. 260,CH-
8057 Zurich, Switzerland
bSchool of Biological and Conservation Sciences, University of KwaZulu-Natal, Private Bag X01, Scottsville, 3209,
South Africa
cFlorisbad Quaternary Research, National Museum, PO Box 266, Bloemfontein, 9300, South Africa
dCentre for Environmental Management, Faculty of Natural and Agricultural Science, University of the Free State,
Bloemfontein, South Africa
* Corresponding author: Clinic for Zoo Animals, Exotic Pets and Wildlife, Vetsuisse Faculty,
University of Zurich, Winterthurerstr. 260, 8057 Zurich, Switzerland; Tel: +41 (0) 44 635 9042;
E-mail: [email protected] or [email protected]

2
Abstract
Background: Theories of density-dependent habitat selection provide two solutions for co-existence of
competing species. The niche compression hypothesis predicts that species reduce their respective niche
breadths in response to interspecific competition. Alternatively, if the species have similar resource
preferences, the subordinate species may be forced to expand its niche to incorporate secondary resources.
Aim: Determine whether grazing ungulate species partition the resource by compression or expansion of
dietary niches.
Organisms: Black wildebeest (Connochaetes gnou) and blue wildebeest (C. taurinus).
Methods: Stable carbon and nitrogen isotope analysis of faeces. Isotopic niche breadths are compared
across allopatric and sympatric wildebeest populations in South African grasslands.
Results: Stable carbon and nitrogen isotope niche breadths of the two wildebeest species were virtually
identical. In sympatry, however, black wildebeest had a narrower 13
C niche breadth (indicating almost
exclusive use of C4 grass), whereas blue wildebeest had a wider 13
C niche breadth (indicating significant
contributions from C3 sources). Blue wildebeest also had a wider 15
N niche breadth than sympatric black
wildebeest. Moreover, the 13
C niche breadths of sympatric black wildebeest and blue wildebeest were
narrower and wider, respectively, than those of allopatric populations of either species.
Conclusions: Isotope niche dynamics across allopatric and sympatric populations arise due to the
combined effects of competition and habitat heterogeneity on resource use. Although results for black
wildebeest resemble niche compression, this theory cannot explain patterns observed in blue wildebeest.
Expansion of the blue wildebeest niche, and restricted niche breadth of black wildebeest, is consistent
with predictions of a shared preference model in which black wildebeest are the dominant competitor.
When competition is operating, differences in the way species use secondary resources can have an
important role in structuring grazer assemblages.
Keywords: centrifugal community; grassland; grazer; niche compression; wildebeest

3
Introduction
Interspecific competition for resources is an important factor driving niche dynamics of
wildlife species and the structure of communities (Chesson, 2000; Sinclair et al., 2006). Models
of density-dependent habitat selection attempt to explain the niche dynamics that lead to resource
partitioning and, ultimately, enable species to stably co-exist. The outcome most commonly
predicted is niche compression, whereby species packing leads to each species using a relatively
smaller portion of the available resource; niche breadths can only expand when the species are
released from competition (MacArthur and Pianka, 1966). However, the niche compression
hypothesis requires that species have distinct preferences (Rosenzweig, 1981). When competing
species have shared preferences, at least one (the subordinate) should expand its range of
resource use to include a less-preferred „secondary‟ niche space that it utilizes efficiently
(Rosenzweig, 1981; Rosenzweig and Abramsky, 1986). In this way, co-existence is achieved
because species differ in their exploitation of secondary niches. The „outwards‟ expansion of
niches can lead to a centrifugal community structure (Rosenzweig and Abramsky, 1986).
Niche dynamics of species in a shared preference system are explained using „isolegs‟ –
lines in state space representing equal choice amongst individuals (Rosenzweig, 1981). Isolegs
are an extension of the ideal free distribution (IFD) model of Fretwell and Lucas (1970), which
states that species become less selective as their densities increase. But, isoleg theory
incorporates the combined density of competitors in a two-species system. Consider two syntopic
species with distinct preferences: at low densities each selects only its preferred niche (e.g.
habitat, or food resource). As the density of the first species increases, the value of the preferred
niche declines with increasing utilization. Assuming optimal behaviour, the species will then
expand its niche range to include secondary resources, concordant with the IFD (Fig. 1a). When

4
the density of the second species increases above the isoleg, the first species will be
competitively excluded from the secondary niche and select only its preferred habitat (an
outcome similar to that predicted by niche compression). In a shared preference system,
however, both species‟ isolegs cross the density axis of the dominant species because the
subordinate is more sensitive to changes induced by its competitor (Rosenzweig and Abramsky,
1986; Tregenza, 1995). The subordinate thus tolerates a wider niche – increases in density of the
dominant species result in the subordinate including its secondary resource, possibly using only
this resource, whereas the dominant is forced into its secondary niche by large increases in its
own numbers (Fig. 1b).
In discussions about the role of competition in community structure, grazing ungulate
assemblages have proved an interesting paradox. These assemblages comprise many species
sharing a single food source (grass) (Bell, 1971; Murray and Brown, 1993; Prins and Olff, 1998;
Sinclair, 1985). Although resource partitioning has been shown along dietary (feeding height,
forage quality) and spatial niche axes (Bell, 1971; Codron et al., 2008b; Cromsigt and Olff,
2006; Jarman, 1974; Kleynhans et al., 2011; Murray and Brown, 1993; Murray and Illius, 2000),
extensive niche overlap is a persistent feature of these systems (Arsenault and Owen-Smith,
2008). Simulation models of exploitation competition generally converge on exclusion, or at best
unstable co-existence, as the most likely outcomes in the absence of a spatially heterogeneous
resource (Murray and Baird, 2008; Murray and Illius, 1996; but see Farnsworth et al., 2002).
Notably, most predictions for grazer community structure reflect the niche compression
hypothesis. Patterns resembling centrifugal-type niche expansion have been found in some
temperate ungulate communities (Gordon and Illius, 1989; Stewart et al., 2003), but those
studies included species from different feeding guilds (grazers, browsers, and mixed-feeders). To

5
our knowledge, no studies of resource partitioning amongst grazers have explicitly contrasted
niche dynamics under the compression vs. expansion models.
Niche compression and expansion can both lead to niche shifts (change in mean along a
continuous resource use axis), but the two processes can be difficult to differentiate in the field
(Ward, 2009; Ward and Seely, 1996), e.g. if at high densities both species utilize only their
secondary niches. A robust investigation of how competition influences niche dynamics requires
knowledge of patterns that emerge when competition happens and when it does not (Gordon and
Illius, 1989; Holt, 1987). In grazers, resource partitioning is most often studied by field
observations of diet, from where dietary overlap indices are calculated for axes like plant species
and plant parts utilized (e.g. Mysterud, 2000). Acquiring comparative data across contexts (i.e.
with and without competition), however, invokes time and labour constraints, and experimental
exclusions are difficult with such large animals (Gordon and Illius, 1989).
One approach to niche dynamics across environmental and ecological contexts is stable
isotope analysis. This tool has been exploited to study resource partitioning in a variety of
wildlife assemblages (Codron et al., 2009; Crawford et al., 2008; Michaud et al., 2008;
Newsome et al., 2007; York and Billings, 2009). The premise is that isotope compositions of
animal tissues are consistent with those of their resources, archiving information about diet and
habitat preference. For herbivores living in subtropical African savannas, body tissue and faecal
13C/
12C ratios track differential consumption of
13C-depleted C3 (trees, shrubs, forbs) vs.
13C-
enriched C4 (mainly grass) foods, as well as other aspects of habitat use such as relative openness
and proximity to water (Cerling and Harris, 1999; Codron et al., 2007; Tieszen et al., 1979;
Vogel, 1978). Herbivore 15
N/14
N ratios also reflect trophic behavior if food groups differ in N
isotope composition (Codron et al., 2009), although qualitative inferences are often difficult

6
because herbivore 15
N-abundances are influenced by diet quality, climate, stress, and
ecophysiology (Ambrose, 1991; Robbins et al., 2010; Sponheimer et al., 2003b).
We used stable isotope analysis of faeces to investigate niche dynamics of two closely-
related grazer species, the black wildebeest Connochaetes gnou (Zimmermann, 1780) and blue
wildebeest C. taurinus (Burchell, 1823), co-occurring in the grassland biome of the central
interior of South Africa. Black wildebeest are endemic to this region, while blue wildebeest are
more frequently associated with tree/grass savanna habitats and have a wider distribution
extending northwards as far as East Africa (Skinner and Smithers, 1990). The species have
similar diets, feeding mainly on short grass when available (Helm, 2006; Murray and Illius,
2000; Skinner and Smithers, 1990; Van Zyl, 1965). Morphology of their feeding apparatus does
not differ, although black wildebeest show less variation in dental morphology and thus may be
more specialized (Brink, 2005; Codron and Brink, 2007). Resource partitioning between species
with such similar trophic adaptations could yield important insights into ecological separation
and co-existence of grazers in general. Moreover, while their distributions overlapped
historically (Skead, 1980), co-occurrence is more common today because many game ranches
stock both species despite legislation imposed to prevent hybridization (S. Vrahimis, pers.
comm.). Their interaction in confined areas likely has consequences for persistence of
populations and their combined effects on ecosystems (Helm, 2006).
A previous study found that sympatric black and blue wildebeest partition the stable
isotope axes (Codron and Brink, 2007): here we investigate whether this partitioning is due to
resource competition, by testing the hypothesis that isotope niche breadths differ between
allopatric and sympatric populations of each species. We look at patterns during the dry season
only, when grass becomes limiting and competition more likely (Arsenault and Owen-Smith,

7
2008; Gordon and Illius, 1989). We contrast predictions of the niche compression hypothesis
with those of niche expansion in a shared preference system. The expectation was that
compression would lead to narrower isotope distributions along a continuous axis of one or both
species in sympatry (Figs 2b, 2c), whereas niche expansions would manifest as wider isotopic
ranges in sympatry (Fig. 2d), or even a shift in the absolute range of one species (Fig. 2e).
Materials and Methods
Study Area
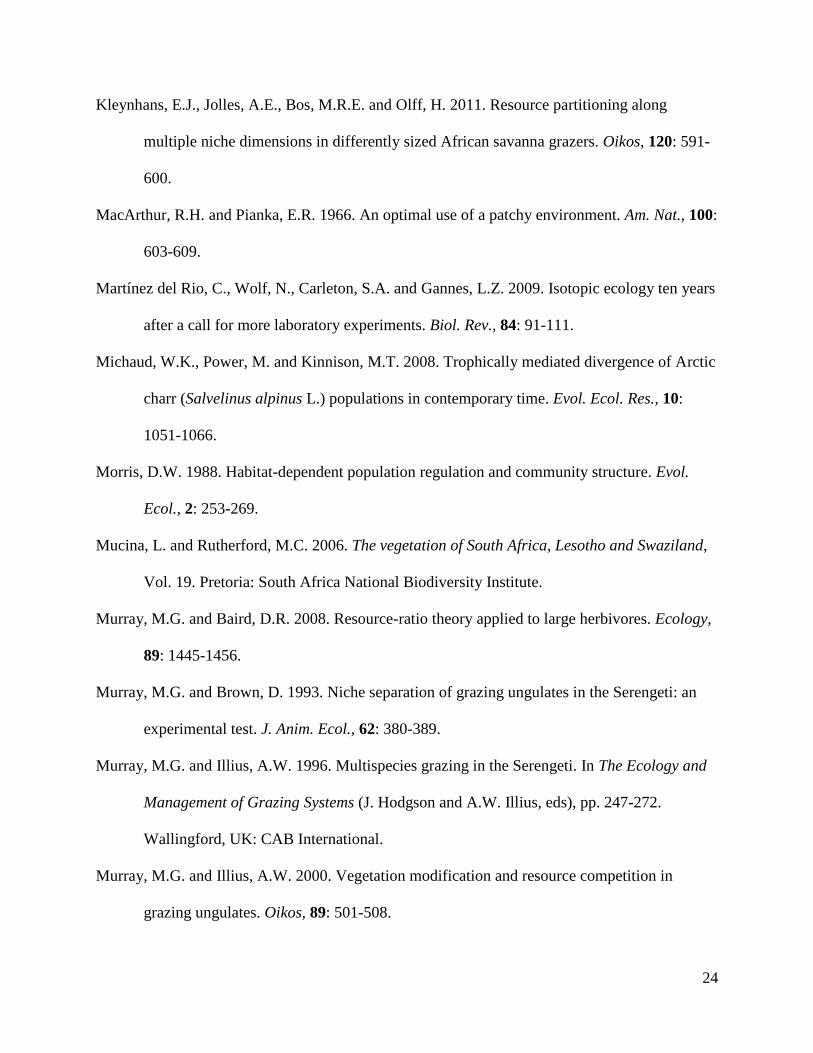
The study focused initially on wildebeest populations in three small (< 11 000 ha) nature
reserves in the grassland biome of the South African interior: the Gariep Dam Nature Reserve
(GNR), Maria Moroka Park (MM), and Soetdoring Nature Reserve (SNR) (Fig. 3). Black
wildebeest and blue wildebeest occur sympatrically at GNR, while the other two reserves are
inhabited by black wildebeest only. The grassland biome is typically a homogeneous, open
landscape, with mostly high grass productivity and little or no tree cover (Mucina and
Rutherford, 2006). GNR extends furthest west, partly incorporating the Nama Karoo biome, but
even in these parts (eastern non-succulent Karoo) grasslands are dominant (Mucina and
Rutherford, 2006). Topography is mainly flat, but the grasslands extend eastwards over the
escarpment, where altitude rises as high as ~2 500 m above sea-level, before descending to near
sea-level. Climate varies from arid to semi-arid; mean annual precipitation decreases from ~600
to ~400 mm from east to west, and falls mainly in the austral summer between October and
March. A characteristic feature of the more arid western areas (where the bulk of this study was
carried out), is a high density of naturally-occurring seasonal pans (Janecke et al., 2003).

8
Materials and Data
Faeces and plants were collected from GNR, MM, and SNR during the dry season (June)
of 2008. Faeces were sampled by locating animals and following them on foot until defecation.
Specimens were collected moist, avoiding contamination by soil or insects. Representative local
vegetation was collected for baseline isotopic data. Three circular sampling transects (5 m
diameter) were established at random localities within each reserve, from where foliage of the
most abundant grass, tree and forb species was sampled. Faeces and plants were oven-dried at
60oC for 24 h, and then mill-ground to a homogeneous powder through a 1 mm sieve using a
hammer mill. Stable isotope ratios were determined by combustion of samples in an automated
elemental analyzer (Carlo Erba, Milan, Italy), and introducing resultant CO2 and N2 gases via
continuous flow to a Delta XP Mass Spectrometer (Finnigan, Bremen, Germany). Isotope ratios
are presented in conventional delta () notation, in units per mil (‰), relative to the Vienna
PeeDee Belemnite (VPDB) and atmospheric N2 standards for 13
C and 15
N, respectively.
Standard deviations of repeated measures of laboratory standards (Merck Gel, lentil, and
chocolate powder) were less than 0.1 ‰ and 0.3 ‰ for 13
C and 15
N, respectively. These
analyses also yielded percent nitrogen (%N, by weight) of each specimen, providing a proxy for
plant crude protein content, and diet quality from faeces (Holecheck et al., 1982).
The sample for GNR was expanded by including faecal isotope data for both wildebeest
species from a dry season month (May) in 2006 (Codron and Brink, 2007). For comparison, we
also included data for allopatric blue wildebeest populations from reserves elsewhere in South
Africa: the Northern Basalt Plains (NBP) of the Kruger National Park, and Hans Merensky
Nature Reserve (HM) (Codron et al., 2007). These reserves lie in the savanna biome (see Fig. 3),
but the NBP is an arid (~400 mm rainfall per annum), open grassland permeated with a network

9
of seasonal pans (Grant et al., 2002), and is thus comparable to habitats in the grassland biome.
HM is a more densely wooded savanna. The NBP and HM data are represented by faeces
collected monthly over a complete seasonal cycle (i.e. one year); to derive a sample comparable
with present data we extracted data for only two dry season months (June 2004 and May 2005;
see Table 1).
Data Analysis
Comparisons between groups were made with 13
C values, 15
N values, and %N as
continuous dependent variables, and “Reserve” or “Species” as categorical factors. Data were
compared using one-way ANOVA, or the non-parametric Kruskal-Wallis alternative when
residuals were not normally distributed (plant 15
N and %N). For plant data, multiple
comparisons tests were performed with Tukey‟s HSD. For faeces we used Dunnett‟s T post hoc
tests for multiple comparisons, because we hypothesized a priori that group variances would be
unequal between sympatric and allopatric populations (Fig. 2); this test avoids the assumption of
equal variance in the ANOVA. For comparisons of niche breadth, we used F-tests to compare
variances between groups. Analyses were performed in STATISTICA v8.0 (Statsoft_Inc, 2007).
Variation in stable isotope composition of dietary baselines influences consumer isotope
compositions, which blurs the relationship between ecological and isotopic niches (Codron et al.,
2007; Post, 2002). To account for these effects, we converted raw values to estimates of
isotopic niche space using the linear two-source mixing equation:
where X refers to the C or N isotope in the system. Mean (or medians in the case of non-normal
15
N data) values for local C4 (grass) and C3 (tree/forb foliage) were used as end-members in the

10
above equation (data in Table 1). It is important to note that this approach is only partly
analogous with the more common conversion of values to ecological “p space” (Newsome et
al., 2007), because we make no assumptions about variation in consumer-diet fractionation
factors. Thus, output of the above model is not constrained to a proportion between 0 and 1, but
simply depicts niches along a relative scale where the highest values correspond most closely to
values for C4 vegetation. We used these estimates of “ niche space” as dependent variables in
our analyses, because they account for regional variations in plant 13
C and 15
N, and we
highlight cases where this approach yielded disparate results compared with raw data.
Results
Variations in Baseline (Plant) Isotope Composition
All grasses sampled had 13
C values consistent with C4 vegetation (-15.0 ‰ to -11.7 ‰,
n = 106) and values for tree and forb foliage were all consistent with C3 vegetation (-29.7 ‰ to -
24.3 ‰, n = 70). Plant 13
C values did not differ by much between habitats, although significant
differences were found between SNR and NBP for C4 grass (mean difference = 0.8 ‰; Tukey‟s
p = 0.002), and between GNR and SNR for C3 foliage (mean difference = 1.6 ‰; Tukey‟s p =
0.011; Table 1). Variance in 13
C values for both plant groups did not differ between regions
(Levene‟s p = 0.898 for C4 and 0.967 for C3).
Plant 15
N differed across regions, in that values for C4 grass were ~2.0 to 3.5 ‰ higher
at NBP compared with the other reserves (H4, 106 = 50.146; p < 0.05), and values for C3 foliage
were ~2.5 ‰ higher at NBP compared with SNR and HM (H4, 70 = 24.299; p = 0.013 and p <
0.001, respectively).

11
Grass %N was highest in the two savanna reserves (NBP and HM), and significantly
lower in at least two of the grassland reserves (GNR and MM; H4, 106 = 43.551; p = 0.034 and <
0.0001, respectively). Nitrogen content of C3 foliage was also highest at NBP and HM, and
lowest at GNR (H4, 70 = 22.797; p = 0.025 and p < 0.001, respectively).
Comparative Isotope Niches of the Two Wildebeest Species
13
C values of all wildebeest faeces were consistent with C4-dominated (grass-based)
diets (-17.0 ‰ to -12.8 ‰, n = 131). The overall means and SD‟s were similar for the two
species (Dunnett‟s p = 0.587; F70,59 = 1.113, p = 0.338; Table 2), and their respective
distributions in 13
C niche space were almost identical (Dunnet‟s p = 0.842; F70,59 = 1.325, p =
0.134; Fig. 4a). A 13
C niche shift did, however, emerge amongst the sympatric populations at
GNR: here, black wildebeest had, on average, higher values (more strongly C4; Dunnet‟s p =
0.028), but a smaller niche variance than blue wildebeest (F35,34 = 8.323, p < 0.0001).
Mean faecal 15
N for black wildebeest was higher than for blue wildebeest, both overall
(mean difference = 0.5 ‰; Dunnet‟s p < 0.001) and in sympatry at GNR (mean difference = 0.9
‰; Dunnet‟s p < 0.001). However, after accounting for regional differences in plant 15
N, the
overall difference did not persist (Dunnet‟s p = 0.186; Fig. 4b), and the situation amongst
sympatric populations became reversed, i.e. the estimated 15
N niche of black wildebeest was
lower than that of blue wildebeest (Dunnet‟s p < 0.0001), whereas blue wildebeest values were
more similar to those of local C4 grass. Variance in faecal 15
N for the two species was similar
(F59,70 = 1.074, p = 0.385), but after controlling for plant variations it emerged that black
wildebeest had a narrower 15
N niche breadth than blue wildebeest (SD = 0.61 and 1.09,

12
respectively; F70,59 = 3.169, p < 0.0001). At GNR, however, variance in 15
N was smaller in
black wildebeest than blue wildebeest (F35,34 = 3.135, p < 0.0001).
Faecal N content of black wildebeest was lower and less variable compared with that of
blue wildebeest (Dunnet‟s p < 0.0001; F70,59 = 1.651, p = 0.025), but at GNR the distribution of
faecal %N values was similar for both species (Dunnet‟s p = 0.632; F35,34 = 1.326, p = 0.206;
Fig. 4c).
Niche Dynamics across Populations
Mean faecal 13
C values of black wildebeest differed between all three populations
studied (Dunnett‟s p < 0.0001 for all comparisons; Table 2). The sample with the most positive
values in 13
C niche space (most similar to C4 plants) was at MM, while the SNR population
utilized the least positive 13
C niche space, and the GNR sample had an intermediate range of
values (Fig. 5a). Further, the sample from GNR had lower variance compared with both MM
(F13,34 = 2.799, p = 0.008) and SNR (F10,34 = 6.842, p < 0.0001), whereas 13
C niche variance of
MM and SNR were not different (F10,13 = 1.962, p = 0.127).
Faecal 15
N values for black wildebeest were lowest at MM (Dunnett‟s p < 0.0001),
whereas values for GNR and SNR did not differ (Dunnett‟s p = 0.288). However, mean 15
N
niche was lower at SNR compared with both other reserves (Dunnett‟s p < 0.0001; Fig. 5b),
suggesting the former result was likely due to the low grass 15
N values at MM (see Table 1).
There were no significant differences in 15
N variance between the three reserves (F-test p =
0.066 to 0.4683), although some comparisons were associated with low statistical power
(minimum 0.36 for variance ratio of 80%).

13
Mean faecal %N, and associated SD‟s, of black wildebeest did not differ between
reserves (Dunnett‟s p = 0.141 to 0.992; F-test p = 0.098 to 0.270; Fig. 5c).
For blue wildebeest, faecal 13
C values were significantly lower at GNR compared with
NBP (Dunnett‟s p < 0.001) and HM (Dunnett‟s p = 0.017; Table 2), but the differences between
GNR and NBP did not persist after adjustment for variations in plant 13
C (Dunnett‟s p = 0.691;
Fig. 5a). Variance in 13
C of blue wildebeest was higher at GNR and HM compared with NBP
(F35,14 = 2.708, p = 0.025 and F19,14 = 4.376, p = 0.004, respectively), but was not different
between GNR and HM (F19,35 = 1.616, p = 0.107).
Mean faecal 15
N values for blue wildebeest did not differ between reserves (Dunnett‟s p
= 0.273 to 0.999; Table 2), but a lower 15
N niche emerged for HM after accounting for
variations in plant data (Dunnett‟s p < 0.0001; Fig. 5b). The HM sample also showed relatively
large variance in 15
N niche space (F-test p < 0.0001).
Mean faecal %N for blue wildebeest was highest at NBP, followed by HM, and was
lowest at GNR (Dunnett‟s p = 0.046 to < 0.0001; Fig. 5c). Variance of faecal %N at GNR was
greater than at NBP and HM (F-test p < 0.001).
Discussion
Stable Isotope Evidence for Influences of Competition
Faecal stable isotope distributions reflect similar dietary niches for black wildebeest and
blue wildebeest across the range of habitats studied here. But differences did emerge where the
two species live sympatrically, at GNR. Here, the faecal 13
C niche of black wildebeest was
higher (13
C-enriched) and had a narrower range than that of blue wildebeest, suggesting the
former foraged more selectively. The species‟ 15
N niches also differed at GNR, with black

14
wildebeest being more 15
N-enriched relative to local C4 grasses than blue wildebeest. Further,
results showed that the isotopic niches of both species at GNR differed from those of their
allopatric conspecifics, indicating that interspecific competition was an important driver of niche
dynamics. Black wildebeest at GNR had a narrower faecal 13
C niche breadth compared with
both allopatric populations of this species, whereas the 13
C niche breadth of blue wildebeest at
GNR was wider than the allopatric population from the NBP, but not HM.
Relatively small sample sizes (n < 20 in some reserves) used here represent a possible
limitation, but the pattern of isotopic niche overlap with partitioning emerging in sympatry
appears quite robust, especially for 13
C data. For one, data for the sympatric populations reflect
similar trends over two study years (2006 and 2008). Further, the strong overlap in 13
C
distributions of the two species is consistent with carbon isotopic evidence for dietary similarity
over longer time periods, recorded from analysis of tooth dentine collagen (Codron and Brink,
2007). Our aim here was to advance this knowledge by gaining insights into niche dynamics of
sympatric vs. allopatric populations in the grassland biome, where the two species‟ ranges
overlap (but co-existence was likely less frequent prior to contemporary management practices).
This was achieved for black wildebeest, but comparative data for allopatric blue wildebeest
populations were necessarily taken from two habitats in the savanna biome: an open grassland
and a woodland savanna. Nonetheless, we found stronger similarities in blue wildebeest 13
C and
15N isotopic niches between „grassland-sympatric‟ with „grassland-savanna‟ habitats than either
compared with the woodland savanna (HM), implying that the grassland savanna (NBP)
provided a suitable baseline (allopatric) habitat for our purposes.
Overall, our study demonstrates an effective method for tracking niche dynamics of
herbivores across ecological and environmental contexts. Using a sampling approach analogous

15
to conventional removal experiments (e.g. Schoener, 1983), but which are logistically difficult
for large animals, we have shown that stable isotope analysis can reveal cases where niche shifts
are the result of exploitation competition.
The 13
C niche dynamics we observed most likely reflect shifts in relative use of C3
(dicots and possibly sedges) and C4 (grass) resources across populations. Previous research has
focused on grass height, and grass quality (e.g. leaf:stem ratios) as axes for resource partitioning
amongst grazing ungulates (Arsenault and Owen-Smith, 2008; Bell, 1971; Codron et al., 2008b;
Kleynhans et al., 2011; Murray and Brown, 1993; Murray and Illius, 2000). Our result
demonstrates that partitioning of the grass/browse axis can occur in some systems.
The 13
C-enriched signal for black wildebeest at GNR, and the narrow range of 13
C values here,
indicates that this population utilized C4 items almost exclusively. By contrast, the wide 13
C
niche breadth of blue wildebeest at GNR almost certainly indicates substantial C3 browse intake
by some individuals (comprising no more than ~20 – 30 % of the whole diet). Confounding
factors such as differences in animal-diet 13
C discrimination (Martínez del Rio et al., 2009)
should be relatively small between these two closely-related species, as they appear to be for
ungulates in general (Sponheimer et al., 2003a). Our analyses accounted for interhabitat
variability in plant isotope composition, and even intrahabitat variability (which, , in South
African savannas, is usually < 2 ‰ (Codron et al., 2005)) cannot explain faecal 13
C values of
blue wildebeest at the most 13
C-depleted end of the scale. Based on previous research on faecal
13
C distributions in southern African habitats (Codron et al., 2009; Codron et al., 2007), we are
confident that values < -15.5 ‰ are unlikely to occur without significant C3 inputs to diet.
Around 22% of blue wildebeest faecal specimens collected at GNR had 13
C values in this range,
whereas no specimens from allopatric populations of this species were so depleted in 13
C. These

16
observations support the interpretation that the dietary niche of blue wildebeest expanded in
sympatry, with the most likely „secondary‟ resource being C3 browse (shrubs, forbs, or tress).
The difference in faecal 15
N values between the two species could indicate additional
partitioning of the resource, if local C4 grasses (the dominant resource in all wildebeest diets)
varied systematically in 15
N composition. Then, black wildebeest were likely consuming more
grasses that use the NAD-ME or PCK photosynthetic sub-pathways, as these are often 15
N-
enriched relative to NADP-ME grasses in southern African savannas (Codron et al., 2009;
Codron et al., 2005). The former group comprises more species of panicoids and chloridoids,
whereas the latter comprise more tall, fibrous andropogonoid species (Sage et al., 1999). Given
that both wildebeest species are preferentially short-grass grazers (Brink, 2005; Skinner and
Smithers, 1990), a shift to higher rates of tall-grass grazing in blue wildebeest could further
indicate it was using a secondary resource. However, although statistical evidence, based on
isotope mixing models, for an NAD/PCK vs NADP dichotomy in herbivore faecal 15
N values
has been presented (Codron and Codron, 2009), such an interpretation for the present study must
be considered speculative. In addition, numerous other climatic and ecophysiological factors do
influence herbivore 15
N-abundance distributions (Ambrose, 1991; Sponheimer et al., 2003b),
albeit physiological differences between such closely-related species are probably small.
Mechanisms of Co-existence
Results reflect niche compression in black wildebeest, especially along the 13
C (C3
browsing/C4 grazing) dietary axis, at GNR. However, we do not believe this is consistent with
the niche compression hypothesis of MacArthur and Pianka (1966). For one, while the 15
N
niche of black wildebeest was also „compressed‟ relative to that of blue wildebeest, this pattern

17
was general and not restricted to the sympatric populations only. Second, the dietary (isotopic)
niches of both species were virtually identical across the whole range of habitats studied here,
indicating that preferences were not distinct, as implied by the compression theory (Rosenzweig,
1981). This theory also does not explain the expansion of the blue wildebeest 13
C niche in
sympatry, and under the compression hypothesis the asymmetric result for GNR would cast blue
wildebeest as the superior competitor (see Fig. 2b). Yet, the grassland biome is optimal habitat
for black wildebeest, but sub-optimal for blue wildebeest, which are more commonly found in
tree/grass savannas (Brink, 2005; Skinner and Smithers, 1990). South African grasslands
represent only the southern margin of the blue wildebeest distribution in Africa, where the
species was largely replaced by black wildebeest since their divergence c. 1 million years ago
(Brink, 2005; Codron et al., 2008a). Thus, we would expect black wildebeest to be the dominant
competitor in these habitats.
Further evidence for black wildebeest dominance can be drawn from our data. Grasses at
GNR had lower %N (lower quality) than grasses at the other reserves, but only blue wildebeest
showed lower faecal %N values in this reserve compared to other habitats. This implies that blue
wildebeest in sympatry used diets of poorer nutritional value compared with populations of this
species elsewhere, whereas black wildebeest maintained similar levels of faecal %N throughout.
Thus, at GNR, black wildebeest likely forced blue wildebeest to forage outside the preferred
dietary niche space, which is consistent with predictions of shared preference community
structure drawn from isoleg theory (Fig. 1b, and see especially Fig. 2d). Also, wider variation in
oral and dental morphology of blue wildebeest (Brink, 2005; Codron and Brink, 2007) means
this species should be more tolerant to a wider diversity of dietary niches, and so more likely to
utilize secondary resources efficiently.

18
A similar pattern of niche dynamics was found several decades ago by Holmes (1961).
He studied experimentally-manipulated densities of two helminth species parasitizing the small
intestine of the definitive host (rats). In single infections, both species preferred the anterior parts
of the small intestine as attachment site, but in concurrent infections one species, Monilformis
dubius (acanthocephalan), appeared to force the other, Hymenolepis diminuta (cestode), to
occupy less-preferred posterior attachment sites. Pimm (1985) studied hummingbird behaviour
using feeders of two different concentrations of sucrose. Both the blue throated hummingbird
(Lampornis clamenciae) and black chinned hummingbird (Archilochus alexandri) preferred
feeders with high sucrose concentrations, but black chinned hummingbirds used both feeder
types at high densities of their own, or the blue throated, species.
One area in which our data could appear inconsistent with shared preference structure,
and more consistent with the niche compression hypothesis, is that allopatric populations of
black wildebeest used a broad 13
C niche breadth. Niche reduction at GNR is not an explicit
prediction of isoleg theory, if black wildebeest are considered the dominant competitor. But, the
theory is based on the ideal-free distribution (IFD) which does, in fact, allow for the dominant
species to use preferred and secondary niches, even in allopatry, and even at densities below its
isoleg. This could happen, for example, with any increase in density of the dominant species. In
Holmes‟ (1961) study, both the subordinate cestode and dominant acanthocephalan expanded
attachment size niches with increasing densities of their own species, in line with predictions of
the IFD (Fretwell and Lucas, 1970). In Pimm‟s (1985) experiments, he found that even the
[dominant] blue throated species accepted feeders with the low sucrose concentration as its
density increased (but it never used only this feeder type).

19
Studies of niche partitioning in ungulates have also revealed that some species have
expanded dietary niche ranges, suggesting a possible mechanism for co-existence with more
restricted taxa (Gordon and Illius, 1989; Stewart et al., 2003). It is, however, difficult to to draw
analogies between those studies with our results, because the former compared species with
different forging styles (browsers, grazers, and mixed-feeders), whereas we focused on grazers
only. Nevertheless, Gordon and Illius (1989) did hypothesize that [any] ungulate assemblages
may partition the resource in this way, with dominants excluding subordinates so that the latter
use a wider variety of resources. They predicted that under limiting conditions, larger species
would react first to expand their niche ranges, because their lower metabolic requirements
(relative to small species) would make them more tolerant to less-preferred, low quality, forages.
Our result for niche expansion in blue wildebeest supports their idea, since they (mean mass of
females c. 180 kg) are almost 50% larger than black wildebeest (mean mass of females c. 130
kg) (Skinner and Smithers, 1990).
Conclusion
Most approaches to grazer community structure expect niche compressions. We suggest
that shared preference structure may be quite common in this guild. For example, Dickman
(1986) found that „apparent‟ compressions were not general to all species in a guild of grazing
macropods. He suggested that the niche compression hypothesis would not apply to assemblages
in which one species is markedly dominant, and/or generalist feeding niches are prevalent. In
light of our results, Dickman‟s (1986) study seems easily interpretable in terms of some species
expanding their niches according to rules of density-dependent habitat selection theory. Actually,
specific strategies of using dynamic niches depending on the environmental/ecological context

20
(e.g. with and without competition) could even help explain grazer co-existence when overall
niche ranges overlap.
Of course, the niche compression hypothesis, isoleg theory, and other habitat selection
models (e.g. Morris, 1988; Wasserberg et al., 2007) are explicitly density-dependent. We were
not able to gather sufficient demographic data to test hypotheses related to density-dependence in
this study. For example, black wildebeest at MM and SNR may have used relatively broad
dietary niches if they occurred at very high densities there (which could indicate reduced
population performance due to competition from blue wildebeest). Habitat heterogeneity could
also play a role, if environments at SNR and MM were such that the black wildebeest isoleg was
different from that at GNR (shifted to the left on the x-axis of Fig. 1b). Then, the black
wildebeest dietary niche would have been broader at SNR and MM even at (relatively) low
densities. Linking population and demographic data to niche dynamics would lead to a better
understanding of the interspecies interaction. Such a study would test the hypothesis that density-
fitness functions are stable across contexts, and thus enforce the evolutionary value of adaptive
trophic strategies in these taxa (cf. Valdovinos et al., 2010). Conversely, niche shifts (whether by
compression of by expansion) could have negative consequences for population dynamics,
adding another problem (besides hybridization) for conservation authorities and ranch managers
wanting to justify stocking of both species in confined spaces.
Acknowledgements
We thank Savvas Vrahmis, Peter Calverley, Garreth Champion, Stuart Dunlop, Jeff
Hean, and management of the various nature reserves for their assistance with this work, John
Lanham and Ian Newton for stable isotope analysis, Jürgen Streich for statistical advice, and

21
Michael Rosenzweig for comments on an earlier version of the manuscript. Funding was
provided by the National Research Foundation, the University of KwaZulu-Natal, and the
Palaeontological Scientific Research Trust, South Africa; and the European Union (Marie-Curie
PIIF-GA-2009-236670) and the Swiss National Fund (IZ32Z0-125787). This work was approved
by the Animal Ethics Sub-Committee of the University of KwaZulu-Natal.
References
Ambrose, S.H. 1991. Effects of diet, climate and physiology on nitrogen isotope abundances in
terrestrial foodwebs. J. Archaeol. Sci., 18: 293–317.
Arsenault, R. and Owen-Smith, N. 2008. Resource partitioning by grass height among grazing
ungulates does not follow body size relation. Oikos, 117: 1711-1717.
Bell, R.H.V. 1971. A grazing ecosystem in the Serengeti. Sci. Am., 225: 86-93.
Brink, J.S. 2005. The evolution of the black wildebeest, connochaetes gnou, and modern large
mammal faunas in central Southern Africa. PhD thesis: Stellenbosch University.
Cerling, T.E. and Harris, J.M. 1999. Carbon isotope fractionation between diet and bioapatite in
ungulate mammals and implications for ecological and paleoecological studies.
Oecologia, 120: 347–363.
Chesson, P. 2000. Mechanisms of maintenance of species diversity. Annu. Rev. Ecol. Syst., 31:
343-366.
Codron, D. and Brink, J. 2007. Trophic ecology of two savanna grazers, blue wildebeest
Connochaetes taurinus and black wildebeest Connochaetes gnou. Eur. J. Wildl. Res., 53:
90-99.

22
Codron, D., Brink, J.S., Rossouw, L. and Clauss, M. 2008a. The evolution of ecological
specialization in southern African ungulates: competition or physical environmental
turnover? Oikos, 117: 344-353.
Codron, D., Brink, J.S., Rossouw, L., Clauss, M., Codron, J., Lee-Thorp, J.A. and Sponheimer,
M. 2008b. Functional differentiation of African grazing ruminants: an example of
specialized adaptations to very small changes in diet. Biol. J. Linn. Soc., 94: 755–764.
Codron, D. and Codron, J. 2009. Reliability of 13
C and 15
N in faeces for reconstructing
savanna herbivore diet. Mamm Biol, 74: 36–48.
Codron, D., Codron, J., Lee-Thorp, J.A., Sponheimer, M., Grant, C.C. and Brink, J.S. 2009.
Stable isotope evidence for nutritional stress, competition, and loss of functional habitat
as factors limiting recovery of rare antelope in southern Africa. J. Arid Environ., 73: 449–
457.
Codron, D., Lee-Thorp, J.A., Sponheimer, M. and Codron, J. 2007. Stable carbon isotope
reconstruction of ungulate diet changes through the seasonal cycle. S. Afr. J. Wildl. Res.,
37: 117-125.
Codron, J., Codron, D., Lee-Thorp, J.A., Sponheimer, M., Bond, W.J., De Ruiter, D. and Grant,
C.C. 2005. Taxonomic, anatomical, and spatio-temporal variations in the stable carbon
and nitrogen isotopic compositions of plants from an African savanna. J. Archaeol. Sci.,
32: 1757-1772.
Crawford, K., McDonald, R.A. and Bearhop, S. 2008. Applications of stable isotope techniques
to the ecology of mammals. Mammal Rev., 38: 87-107.
Cromsigt, J.P.G.M. and Olff, H. 2006. Resource partitioning among savanna grazers mediated by
local heterogeneity: an experimental approach. Ecology, 87: 1532-1541.

23
Dickman, C.R. 1986. Niche compression: Two tests of an hypothesis using narrowly sympatric
predator species. Austral Ecol., 11: 121-134.
Fretwell, S.D. and Lucas, H.L.J. 1970. On territorial behavior and other factors influencing
habitat distribution in birds. I. Theoretical development. Acta Biotheor, 19: 16-36.
Gordon, I.J. and Illius, A.W. 1989. Resource partitioning by ungulates on the Isle of Rhum.
Oecologia, 79: 383-389.
Grant, C.C., Davidson, T., Funston, P.J. and Pienaar, D.J. 2002. Challenges faced in the
conservation of rare antelope: a case study on the northern basalt plains of the Kruger
National Park. Koedoe, 45: 45-66.
Helm, C.V. 2006. Ecological separation of the black and blue wildebeest on Ezemvelo Nature
Reserve in the highveld grasslands of South Africa. MSc dissertation: University of
Pretoria.
Holecheck, J.L., Vavre, M. and Pieper, R.D. 1982. Methods for determining the nutritive quality
of range ruminant diets: a review. J. Anim. Sci., 54: 363-376.
Holmes, J.C. 1961. Effects of concurrent infections on Hymenolepis diminuta (Cestoda) and
Moniliformis dubius (Acanthocephala). I. general effects and comparison with crowding.
The Journal of Parasitology, 47: 209-216.
Holt, R.D. 1987. On the relation between niche overlap and competition: the effect of
incommensurable niche dimensions. Oikos, 48: 110-114.
Janecke, B.B., du Preez, P.J. and Venter, H.J.T. 2003. Vegetation ecology of the pans (playas) of
Soetdoring Nature Reserve, Free State Province. S. Afr. J. Bot., 69: 401-409.
Jarman, P.J. 1974. The social organization of antelope in relation to their ecology. Behaviour, 48:
215-266.
24
Kleynhans, E.J., Jolles, A.E., Bos, M.R.E. and Olff, H. 2011. Resource partitioning along
multiple niche dimensions in differently sized African savanna grazers. Oikos, 120: 591-
600.
MacArthur, R.H. and Pianka, E.R. 1966. An optimal use of a patchy environment. Am. Nat., 100:
603-609.
Martínez del Rio, C., Wolf, N., Carleton, S.A. and Gannes, L.Z. 2009. Isotopic ecology ten years
after a call for more laboratory experiments. Biol. Rev., 84: 91-111.
Michaud, W.K., Power, M. and Kinnison, M.T. 2008. Trophically mediated divergence of Arctic
charr (Salvelinus alpinus L.) populations in contemporary time. Evol. Ecol. Res., 10:
1051-1066.
Morris, D.W. 1988. Habitat-dependent population regulation and community structure. Evol.
Ecol., 2: 253-269.
Mucina, L. and Rutherford, M.C. 2006. The vegetation of South Africa, Lesotho and Swaziland,
Vol. 19. Pretoria: South Africa National Biodiversity Institute.
Murray, M.G. and Baird, D.R. 2008. Resource-ratio theory applied to large herbivores. Ecology,
89: 1445-1456.
Murray, M.G. and Brown, D. 1993. Niche separation of grazing ungulates in the Serengeti: an
experimental test. J. Anim. Ecol., 62: 380-389.
Murray, M.G. and Illius, A.W. 1996. Multispecies grazing in the Serengeti. In The Ecology and
Management of Grazing Systems (J. Hodgson and A.W. Illius, eds), pp. 247-272.
Wallingford, UK: CAB International.
Murray, M.G. and Illius, A.W. 2000. Vegetation modification and resource competition in
grazing ungulates. Oikos, 89: 501-508.

25
Mysterud, A. 2000. Diet overlap among ruminants in Fennoscandia. Oecologia, 124: 130-137.
Newsome, S.D., Martinez del Rio, C., Bearhop, S. and Phillips, D.L. 2007. A niche for isotopic
ecology. Front. Ecol. Environ., 5: 429-436.
Pimm, S.L., Rosenzweig, M.L. and Mitchell, W. 1985. Competition and food selection: field
tests of a theory. Ecology, 66: 798-807.
Post, D.M. 2002. Using stable isotopes to estimate trophic position: Models, methods, and
assumptions. Ecology, 83: 703-718.
Prins, H.H.T. and Olff, H. 1998. Species-richness of African grazer assemblages: towards a
functional explanation. In Dynamics of Tropical Communities (D.M. Newbery, H.H.T.
Prins and N. Brown, eds), pp. 449-490. Oxford: Blackwell Science.
Robbins, C., Felicetti, L. and Florin, S. 2010. The impact of protein quality on stable nitrogen
isotope ratio discrimination and assimilated diet estimation. Oecologia, 162: 571-579.
Rosenzweig, M.L. 1981. A theory of habitat selection. Ecology, 62: 327-335.
Rosenzweig, M.L. and Abramsky, Z. 1986. Centrifugal community organization. Oikos, 46: 339-
348.
Sage, R.F., Li, M. and Monson, R.K. 1999. The taxonomic distribution of C4 photosynthesis. In
C4 plant biology (R.F. Sage and R.K. Monson, eds), pp. 551-584. San Diego: Academic
press.
Schoener, T.W. 1983. Field experiments on interspecific competition. Am. Nat., 122: 240-285.
Sinclair, A.R.E. 1985. Does interspecific competition or predation shape the African ungulate
community? J. Anim. Ecol., 54: 899-918.
Sinclair, A.R.E., Fryxell, J.M. and Caughley, G. 2006. Wildlife Ecology, Conservation, and
Management, second edition. Malden: Blackwell Publishing.

26
Skead, C.J. 1980. The Western and Northern Cape, Vol. 1. Cape Town: Department of Nature
and Environmental Conservation of the Provincial Administration of the Cape of Good
Hope.
Skinner, J.D. and Smithers, R.H.N. 1990. The Mammals of the Southern African Subregion,
second edition. Pretoria: University of Pretoria.
Sponheimer, M., Robinson, T., Ayliffe, L., Passey, B., Roeder, B., Shipley, L., Lopez, E.,
Cerling, T., Dearing, D. and Ehleringer, J. 2003a. An experimental study of carbon-
isotope fractionation between diet, hair, and feces of mammalian herbivores. Can. J.
Zool., 81: 871-876.
Sponheimer, M., Robinson, T., Ayliffe, L., Roeder, B., Hammer, J., Passey, B., West, A.,
Cerling, T., Dearing, D. and Ehleringer, J. 2003b. Nitrogen isotopes in mammalian
herbivores: hair 15
N values from a controlled feeding study. Int J Osteoarchaeol, 13: 80-
87.
Statsoft_Inc. 2007. STATISTICA Version 8.0 (data analysis software system).
www.statsoft.com. Tulsa, Oklahoma: Statsoft Inc.
Stewart, K.M., Bowyer, R.T., Kie, J.G., Dick, B.L. and Ben-David, M. 2003. Niche partitioning
among mule deer, elk, and cattle: do stable isotopes reflect dietary niche? Ecoscience, 10:
297-302.
Tieszen, L., Hein, D., Qvortrup, D., Troughton, J. and Imbamba, S. 1979. Use of δ13
C values to
determine vegetation selectivity in east African herbivores. Oecologia, 37: 351-359.
Tregenza, T. 1995. Building on the ideal free distribution. Adv. Ecol. Res., 26: 253-302.

27
Valdovinos, F.S., Ramos-Jiliberto, R., Garay-Narváez, L., Urbani, P. and Dunne, J.A. 2010.
Consequences of adaptive behaviour for the structure and dynamics of food webs. Ecol.
Lett., 13: 1546-1559.
Van Zyl, J.H.M. 1965. The vegetation of the S.A. Lombard Nature Reserve and its utilization by
certain antelope. Zoologia Africana, 1: 55-71.
Vogel, J.C. 1978. Isotopic assessment of the dietary habits of ungulates. S. Afr. J. Sci., 74: 298-
301.
Ward, D. 2009. The Biology of Deserts. Oxford: Oxford University Press.
Ward, D. and Seely, M.K. 1996. Competition and habitat selection in Namib desert tenebrionid
beetles. Evol. Ecol., 10: 341-359.
Wasserberg, G., Kotler, B.P., Morris, D.W. and Abramsky, Z. 2007. A field test of the
centrifugal community organization model using psammophilic gerbils in Israel‟s
southern coastal plain. Evol. Ecol. Res., 9: 299-311.
York, H.A. and Billings, S.A. 2009. Stable-isotope analysis of diets of short-tailed fruit bats
(Chiroptera: Phyllostomidae: Carollia). J. Mammal., 90: 1469-1477.

28
Table 1. Sampling details and vegetation data (mean ± 1 SD) for reserves included in this study.
C4 grass C3 tree and forb foliage
Region
Month/
year
Wildebeest
species n 13C (o/oo) 15N (o/oo) %N n 13C (o/oo) 15N (o/oo) %N
Gariep (GNR) *06/08 Both 15 -13.5±0.56 2.6±1.99 0.6±0.27 12 -27.5±1.28 5.1±2.79 1.2±0.47
@05/06 - - - - - - - -
Maria Moroka (MM)
*06/08 Black only 23 -13.4±0.54 1.2±1.78 0.5±0.19 2 -26.7±1.12 3.6±6.36 1.0±0.42
Soetdoring
(SNR)
*06/08 Black only 13 -14.0±0.65 2.0±1.72 0.9±0.49 10 -25.9±0.97 3.7±1.87 1.9±0.74
Northern
Basalt Plains
(NBP)
#06/04 &
'05/05
Blue only 43 -13.2±0.75 4.6±1.58 1.4±0.85 34 -26.5±1.17 6.1±1.67 2.2±0.68
Hans Merensky
(HM)
#06/04 &
'05/05
Blue only 12 -13.6±0.55 2.6±0.39 1.1±0.43 12 -26.9±0.97 3.3±0.61 2.0±0.33
* data collected in this study; @ data from Codron and Brink (2007); # data from Codron et al. (2007);
n = number of observations (individual plants sampled)

29
Table 2. Faecal stable isotope data, and %N (mean ± 1 SD) for the wildebeest populations
included in this study.
Population (reserve) n 13C (o/oo) 15N (o/oo) %N
Black wildebeest
Gariep (GNR) 35 -14.9 ± 0.25 5.1 ± 0.53 1.1 ± 0.21
Maria Moroka (MM) 14 -14.0 ± 0.40 3.7 ± 0.60 1.0 ± 0.18
Soetdoring (SNR) 11 -16.1 ± 0.56 5.3 ± 0.34 1.0 ± 0.15
Overall 60 -14.9 ± 0.75 4.8 ± 0.82 1.1 ± 0.20
Blue wildebeest Gariep (GNR) 36 -15.2 ± 0.73 4.2 ± 0.93 1.2 ± 0.25
Northern Basalt Plains (NBP) 15 -14.6 ± 0.42 4.5 ± 0.42 1.5 ± 0.27
Hans Merensky (HM) 20 -14.4 ± 0.88 4.2 ± 0.70 1.3 ± 0.12
Overall 71 -14.8 ± 0.79 4.3 ± 0.79 1.3 ± 0.26
n = number of observations (individual faecal samples)

30
Figure Legends
Figure 1. Density-dependent habitat selection by two competing species with distinct (a) and
shared (b) preferences, explained using isoleg theory. In (a) species 1 prefers niche A, species 2
prefers niche B. The species select different habitats at low densities (N), but to the right and
above their respective isolegs (solid line = species 1, dotted line = species 2) their niches expand
to include the secondary habitat C. When density of the competitor increases, i.e. above and to
the right of the respective isolegs, the species again select different habitats. In (b), species 1 is
the dominant (D) competitor, and species 2 is the subordinate (S). Both species prefer habitat A,
but with an increase in density of D, species S expands its niche to include secondary habitat B
(to the right of dashed isoleg, the subordinate only uses its secondary habitat). In most of the
range species D uses its preferred habitat, and may include its secondary habitat C, but to the
right of its isoleg even D is forced to include both its primary and secondary habitats. Adapted
from Rosenzweig and Abramsky (1986; see also Tregenza, 1995; Ward and Seely, 1996).
Figure 2. Conceptualized stable isotope niche dynamics under the niche compression (distinct
preference system) and niche expansion (shared preference system) hypotheses (adapted from
Fig. 1). Allopatric populations use similar niches (a), but in sympatry competition leads to
reduced – i.e. niche compression (b, c), or broader – i.e. expansion (d, e), isotope niche breadths
along a continuous resource use axis. In b) and d), the outcome is asymmetric because one
species is competitively dominant (solid lines) and the other subordinate (dashed lines), whereas
in c) equilibrium is reached when both species become more selective. Grey areas in d) and e)
indicate secondary isotope niche spaces of the two species: due to the asymmetric interaction,

31
niche expansion is one-tailed, causing a niche shift (change in mean along the x-axis). At very
high densities both species could utilize only their secondary niche range, and the outcome
would be indistinguishable from (c).
Figure 3. Map of South Africa with grassland (dark shading) and savanna (light shading)
biomes, and reserves sampled (GNR = Gariep Dam Nature Reserve, both wildebeest species;
MM = Maria Moroka Reserve and SNR = Soetdoring Nature Reserve, black wildebeest only;
NBP = Northern Basalt Plains, Kruger National Park and HM = Hans Merensky Nature Reserve,
blue wildebeest only). White areas comprise other biomes.
Figure 4. Comparative distributions of faecal data in a) 13
C niche space, b) 15
N niche space,
and c) %N between the two wildebeest species. Plots on the left represent data for all populations
(reserves), plots on the right represent sympatric populations (GNR) only. Isotope niche space
(x-axes in a and b) is derived from a mixing model that accounts for regional differences in plant
isotope composition: higher values indicate increasing similarity to C4 grass values. Curves are
fitted normal distributions.
Figure 5. Comparative distributions of faecal data in a) 13
C niche space, b) 15
N niche space,
and c) %N between populations of each species living sympatrically (GNR, black bars) and
allopatrically (grey bars). Plots on the left are black wildebeest populations, plots on the right are
blue wildebeest populations. Isotope niche space (x-axes in a and b) is derived from a mixing
model that accounts for regional differences in plant isotope composition: higher values indicate
increasing similarity to C4 grass values. Curves are fitted normal distributions.

32
Fig. 1
0
5
10
15
20
25
30
35
40
45
50
0 10 20 30 40 50
N2
N1
a
2BC
1AC1A
2B
1A
2B
distinct preferences
0
5
10
15
20
25
30
35
40
45
50
0 10 20 30 40 50
NS
ND
b
DA or AC
SAB
DA
SA
DAC
SB
shared preferences
DA or AC
SB

33
(stable isotope) dietary niche
fre
qu
en
cy
b
asymmetric compression(1 species is dominant)
d expansion of subordinate(at low densities)
csymmetriccompression
e expansion of both(at high densities)
allopatricpopulations
a
Fig. 2
34
Fig. 3

35
fre
qu
en
cy
13C niche
0.7 0.8 0.9 1.0 1.1
0%
5%
10%
15%
20%
25%
13C niche
0.7 0.8 0.9 1.0 1.1
15N niche
-3.0 -2.0 -1.0 0.0 1.0 2.0
0%
5%
10%
15%
20%
25%
15N niche
-3.0 -2.0 -1.0 0.0 1.0 2.0
%N
0.5 1.0 1.5 2.0
0%
5%
10%
15%
20%
25%
%N
0.5 1.0 1.5 2.0
aAll populations
Black wildebeestBlue wildebeest
Sympatric populations (GNR)
b
c
13C niche
%N
15N niche
Fig. 4

36
fre
qu
en
cy
0.7 0.8 0.9 1.0 1.1
13C niche
0%
5%
10%
15%
20%
25%
0.7 0.8 0.9 1.0 1.1
13C niche
-3.0 -2.0 -1.0 0.0 1.0 2.0
15N niche
0%
5%
10%
15%
20%
25%
30%
35%
15N niche
-3.0 -2.0 -1.0 0.0 1.0 2.0
0.5 1.0 1.5 2.0
%N
0%
5%
10%
15%
20%
25%
30%
35%
%N
0.5 1.0 1.5 2.0
GNR MM SNR
a Black wildebeest
GNR NBP HM
Blue wildebeest
b
c
15N niche
13C niche
%N
Fig. 5


![Evidence of Niche Partitioning under Ontogenetic ... · niche theory is ‘‘the ghost of competition past’’ [10]. Partitioning ... 24434) and was conducted in accordance with](https://img.pdfslide.net/doc/110x75/5ff0415ee0b80f0b0b231db7/evidence-of-niche-partitioning-under-ontogenetic-niche-theory-is-aathe-ghost.jpg)


![Competition and niche construction in a model of cancer ......2018/01/25 · Niche construction also likely plays an important role in cancer population biology [8–11]. Cancer cells](https://img.pdfslide.net/doc/110x75/60dac63e46b08f338f488551/competition-and-niche-construction-in-a-model-of-cancer-20180125-niche.jpg)