Embed Size (px)
Citation preview
Effect of Ducted HPWH on Space-Conditioning and Water Heating Energy Use – Central Florida Lab
Home
FSEC-CR-2050-16
November 2016
Authors
Carlos Colon Eric Martin
Danny Parker
©2016 University of Central Florida. All Rights Reserved.

Disclaimer The Florida Solar Energy Center/University of Central Florida nor any agency thereof, nor any of their employees, makes any warranty, express or implied, or assumes any legal liability or responsibility for the accuracy, completeness, or usefulness of any information, apparatus, product, or process disclosed, or represents that its use would not infringe privately owned rights. Reference herein to any specific commercial product, process, or service by trade name, trademark, manufacturer, or otherwise does not necessarily constitute or imply its endorsement, recommendation, or favoring by the Florida Solar Energy Center/University of Central Florida or any agency thereof. The views and opinions of authors expressed herein do not necessarily state or reflect those of the Florida Solar Energy Center/University of Central Florida or any agency thereof.

Effect of Ducted HPWH on Space-Conditioning and Water Heating Energy Use—Central Florida Lab Home Carlos Colon, Eric Martin, and Danny Parker Building America Partnership for Improved Residential Construction
November 2016

NOTICE
This report was prepared as an account of work sponsored by an agency of the United States government. Neither the United States government nor any agency thereof, nor any of their employees, subcontractors, or affiliated partners makes any warranty, express or implied, or assumes any legal liability or responsibility for the accuracy, completeness, or usefulness of any information, apparatus, product, or process disclosed, or represents that its use would not infringe privately owned rights. Reference herein to any specific commercial product, process, or service by trade name, trademark, manufacturer, or otherwise does not necessarily constitute or imply its endorsement, recommendation, or favoring by the United States government or any agency thereof. The views and opinions of authors expressed herein do not necessarily state or reflect those of the United States government or any agency thereof.
This report is available at no cost from the National Renewable Energy Laboratory (NREL) at www.nrel.gov/publications.
Available electronically at SciTech Connect http:/www.osti.gov/scitech
Available for a processing fee to U.S. Department of Energy and its contractors, in paper, from:
U.S. Department of Energy Office of Scientific and Technical Information P.O. Box 62 Oak Ridge, TN 37831-0062 OSTI http://www.osti.gov Phone: 865.576.8401 Fax: 865.576.5728 Email: [email protected]
Available for sale to the public, in paper, from: U.S. Department of Commerce National Technical Information Service 5301 Shawnee Road Alexandria, VA 22312 NTIS http://www.ntis.gov Phone: 800.553.6847 or 703.605.6000 Fax: 703.605.6900 Email: [email protected]
iii
Effect of Ducted HPWH on Space-Conditioning and Water Heating Energy Use—Central Florida Lab Home
Prepared for:
The National Renewable Energy Laboratory
On behalf of the U.S. Department of Energy’s Building America Program
Office of Energy Efficiency and Renewable Energy
15013 Denver West Parkway
Golden, CO 80401
NREL Contract No. DE-AC36-08GO28308
Prepared by:
Carlos Colon, Eric Martin, and Danny Parker
Building America Partnership for Improved Residential Construction
Florida Solar Energy Center
1679 Clearlake Rd
Cocoa, Florida, 32922
NREL Technical Monitor: Stacey Rothgeb
Prepared under Subcontract No. KNDJ-0-40339-05
November 2016

iv
The work presented in this report does not represent performance of any product relative to regulated minimum efficiency requirements.
The laboratory and/or field sites used for this work are not certified rating test facilities. The conditions and methods under which products were characterized for this work differ from standard rating conditions, as described.
Because the methods and conditions differ, the reported results are not comparable to rated product performance and should only be used to estimate performance under the measured conditions.

v
Contents List of Figures ............................................................................................................................................ vi List of Tables ............................................................................................................................................ viii Definitions ................................................................................................................................................... ix Acknowledgements .................................................................................................................................... x Executive Summary ................................................................................................................................... xi 1 Problem Statement ............................................................................................................................... 1
1.1 Introduction and Background ..............................................................................................1 1.2 Relevance to Building America Goals .................................................................................3
2 Experiment ............................................................................................................................................ 3 2.1 Research Questions ..............................................................................................................3 2.2 Technical Approach and Experimental Schedule ................................................................3 2.3 Pertinent Flexible Residential Test Facility Laboratory Features........................................7
3 Instrumentation and Automation ...................................................................................................... 10 3.1 Instrumentation ..................................................................................................................10 3.2 Automation of Sensible and Latent Internal Gains and Water Draws ...............................11
4 Validation of Hot Water Load, Inlet Water Temperatures, and Delivered Hot Water Temperature ........................................................................................................................................ 14
5 Ducted Heat Pump Water Heater Characterization ......................................................................... 17 5.1 Effect of Flow Path on Ducted Heat Pump Water Heater Airflow ....................................17 5.2 Effect of Airflow Path on Ducted Heat Pump Water Heater Run Time ............................17 5.3 Ducted Heat Pump Water Heater Role in Mechanical Ventilation ...................................19 5.4 Ducted Heat Pump Water Heater Water Heating Performance .........................................20 5.5 Heat Pump Water Heater Cooling Capacity ......................................................................21 5.6 Cooling Coefficient of Performance ..................................................................................23
6 Effect of Ducted Heat Pump Water Heater on Building Space Conditioning ............................... 23 6.1 Cooling Season Results (July 1, 2014–December 10, 2014) .............................................24 6.2 Heating Season Results (December 11, 2014–February 2015) .........................................31
7 Effect of Ducted Heat Pump Water Heater on Indoor Relative Humidity ...................................... 34 8 Conclusions ........................................................................................................................................ 36 References ................................................................................................................................................. 40

vi
List of Figures Figure ES-1. Daily volume of hot water utilized for the eight month testing period. ......................... xii Figure ES-2 Daily schedule of hot water draws selected from the NREL hot water event
generator. ............................................................................................................................................ xii Figure ES-3. Average daily cooling delivered to the buildings by the HPWH. Hatched bars indicate
heating season, solid bars indicate cooling season. Negative values indicate heat was added to the space. ....................................................................................................................................... xiii
Figure 1. Source energy savings of HPWH’s located inside and outside of the conditioned space (Maguire, 2014)...................................................................................................................................... 1
Figure 2. Example of HPWH ducting kit. ................................................................................................... 2 Figure 3. Completed flexible residential test structures on FSEC campus. ......................................... 3 Figure 4. Dampered HPWH ducting scheme. Grey lines indicate duct runs, colored lines indicate
air pathways. Dampers allowing directional switching of airflow are blue. ................................... 5 Figure 5. Ducting of intake and exhaust air using 8” smooth metal duct. ............................................ 6 Figure 6. Location where air is drawn from and/or injected to conditioned space.............................. 7 Figure 7. Interior of East (carpeted) and West FRTF Lab Buildings showing interior wall modules. 8 Figure 8. Ceiling penetration for planned horizontal plane leakage (left); attic view of hole that
diffuses airflow (right) .......................................................................................................................... 9 Figure 9. PVC stand-off shims used to add vertical plane leakage to the east building ..................... 9 Figure 10. ACH for the east (red) and west (green) labs for a 12 day period as calculated from
measured data obtained with the continuous CO2 dosing/measurement system. ..................... 10 Figure 11. Daily load schedule for both homes ..................................................................................... 12 Figure 12. Daily volume of hot water utilized for the eight month testing period. ............................. 13 Figure 13. Daily schedule of hot water draws selected from the NREL hot water event generator. 14 Figure 14. Gradual increase of measured daily hot water load comparing east and west FRTF
buildings. ............................................................................................................................................. 14 Figure 15. Weighted average seasonal variation of daily inlet water temperatures. ......................... 15 Figure 16. Average weighted delivered temperatures by the east and west FRTF buildings. .......... 16 Figure 17. Measured daily average water draws for the east and west buildings compared to the
target NREL schedule. ....................................................................................................................... 16 Figure 18. East FRTF HPWH run time for the three HPWH airflow paths. .......................................... 18 Figure 19. West FRTF HPWH run time for the three HPWH airflow paths. ......................................... 18 Figure 23. Daily water heater efficiency (COP) measured for the testing period. .............................. 21 Figure 24. Average cooling (Btu/day) by month provided by the HPWH operating under garage to
garage ventilation path configuration. ............................................................................................. 22 Figure 25. Average cooling (Btu/day) by month provided by the HPWH operating under indoor to
indoor ventilation path configuration. .............................................................................................. 22 Figure 26. Average cooling (Btu/day) by month provided by the HPWH operating under outdoor air
to indoor ventilation path configuration. ......................................................................................... 23 Figure 27. Average daily cooling delivered to the FRTF garages under the baseline garage to
garage flow path. ................................................................................................................................ 24 Figure 28. Average daily cooling delivered to the indoor space of the FRTF under the indoor to
indoor flow path. ................................................................................................................................. 25 Figure 29. Average daily cooling delivered to the indoor space of the FRTF under the outdoor to
indoor flow path. ................................................................................................................................. 25 Figure 30. Hourly cooling delivered (BTU/hr) to the east FRTF for the indoor to indoor flow path. 26 Figure 31. Hourly cooling delivered (BTU/hr) to the west FRTF for the indoor to indoor flow path. 26 Figure 32. Hourly cooling delivered (BTU/hr) to the east FRTF for the outdoor to indoor flow
path. ..................................................................................................................................................... 27 Figure 33. Hourly cooling delivered (BTU/hr) to the west FRTF for the outdoor to indoor flow
path. ..................................................................................................................................................... 27 Figure 34. Daily HVAC cooling energy consumption (kWh/day) as a function of daily average
ambient temperature. ......................................................................................................................... 28

vii
Figure 35. Cooling energy consumption of the FRTF as a function of outdoor-indoor temperature difference for the garage to garage flow path. ................................................................................ 29
Figure 36. Cooling energy consumption of the FRTF as a function of outdoor-indoor temperature difference for the indoor to indoor flow path. ................................................................................. 29
Figure 37. Cooling energy consumption of the FRTF as a function of outdoor-indoor temperature difference for the outdoor to indoor flow path. ............................................................................... 30
Figure 38. Daily heating energy use in the FRTF as function of outdoor average temperature. ...... 31 Figure 39. Heating energy consumption of the FRTF as a function of outdoor-indoor temperature
difference for the garage to garage flow path. ................................................................................ 32 Figure 40. Heating energy consumption of the FRTF as a function of outdoor-indoor temperature
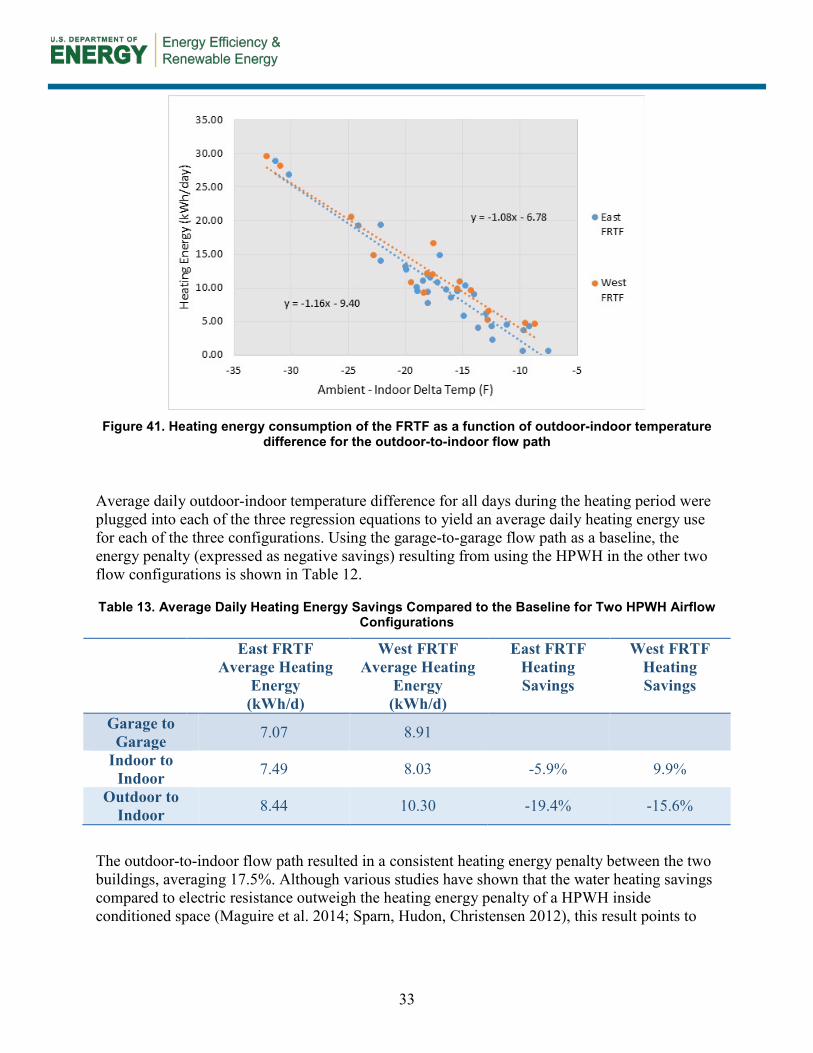
difference for the indoor to indoor flow path. ................................................................................. 32 Figure 41. Heating energy consumption of the FRTF as a function of outdoor-indoor temperature
difference for the outdoor to indoor flow path. ............................................................................... 33 Figure 42. Average day indoor humidity levels for the garage to garage (baseline) airflow path in
the east FRTF building. ...................................................................................................................... 34 Figure 43. Average day indoor humidity levels for indoor to indoor airflow path in the east FRTF
building. ............................................................................................................................................... 35 Figure 44. Average day indoor humidity levels for the outdoor to indoor airflow path in the east
FRTF building. ..................................................................................................................................... 35 Figure 45. Summary plot comparing airflow pathways and their monthly net effect on indoor
building enthalpy change. ................................................................................................................. 38

viii
List of Tables Table ES-1. Measured Airflow for Each Ducted Configuration at the East and West FRTF
Buildings ............................................................................................................................................ xiii Table ES-2 Cooling Season Summary ................................................................................................... xiv Table ES-3 Heating Season Summary ................................................................................................... xiv Table 1. Specifications for AO-Smith PHPT-60 in “Hybrid” Mode, Enabling Both Heat Pump and
Electric Resistance Operation ............................................................................................................. 4 Table 2. Linear Length of Duct Runs ........................................................................................................ 6 Table 3. HPWH Measurement Plan .......................................................................................................... 11 Table 4. Automation Instrumentation Equipment .................................................................................. 12 Table 5. Input Parameters Used in the Hot Water Event Generator..................................................... 13 Table 6. Measure Hot Water Volume Results Compared to the Baseline Called by the NREL
Schedule .............................................................................................................................................. 17 Table 7. Measured Airflow for Each Ducted Configuration at the East and West FRTF Buildings .. 17 Table 8. Daily Average Run Time of the Two HPWHs ........................................................................... 19 Table 9. HPWH Outdoor and Indoor Flow Path Contribution toward ASHRAE 62.2-2013
Requirements ...................................................................................................................................... 20 Table 10. Summary of Water Heating HPWH COP as Averaged per Ducted Airflow Configuration 21 Table 11. Summary of Cooling COP by Ducted as Averaged per Airflow Configuration .................. 23 Table 12. Average Daily Cooling Energy Savings Compared to the Baseline for two HPWH Airflow
Configurations .................................................................................................................................... 30 Table 13. Average Daily Heating Energy savings Compared to the Baseline for Two HPWH Airflow
Configurations .................................................................................................................................... 33 Table 14. Average Daily RH (%) for Each Month and Each Flow Path in the East FRTF ................... 36 Table 15. Summary of Sensible Heat Ratio of HPWHs by Airflow Configuration .............................. 37 Table 16. Cooling Season Summary ....................................................................................................... 38 Table 17. Heating Season Summary ....................................................................................................... 38
ix
Definitions
ACH50 Air changes per hour (infiltration) at 50 pascals
BA-PIRC Building America Partnership for Improved Residential Construction
CFM Cubic feet per minute
CFM25 Cubic feet per minute of air leakage at 25 pascals
COP Coefficient of performance
FRTF Flexible Residential Test Facility
FSEC Florida Solar Energy Center
HPWH Heat pump water heater
HVAC Heating, ventilating, and air conditioning
NREL National Renewable Energy Laboratory
RH Relative humidity
SHR Sensible heat ratio
TMY Typical meteorological year

x
Acknowledgements
The authors would like to acknowledge the outstanding involvement of the Florida Solar Energy Center (FSEC) Building America Partnership for Improved Residential Construction (BA-PIRC) team for their preparations prior to and their support during this research study. David Hoak and John Sherwin deserve special recognition for the execution of the services they provided, leading to the quality of data generated during the study. Robin Vieira also deserves recognition for his innovative thinking of proposed research concepts, the results of which are now detailed in this report. The FSEC BA-PIRC team acknowledges and expresses gratitude for our funding offices: the U.S. Department of Energy, National Renewable Energy Laboratory, Florida Energy Systems Consortium (FESC) and University of Central Florida. Their support and laboratory funding for the Flexible Residential Test Facility allow us to carry out our research mission.
xi
Executive Summary
The purpose of this research is to investigate the impact of ducted heat pump water heaters (HPWHs) on space-conditioning and water heating energy use in residential applications. Two identical HPWHs, each with a capacity of 60 gal, were tested side by side at the Flexible Residential Test Facility (FRTF) laboratories on the Florida Solar Energy Center (FSEC) campus in Cocoa, Florida. The FRTF’s residential buildings feature the same square footage (1,535 ft2), orientation, and envelope characteristics; currently, the only difference between them is the finished floor material. The east FRTF building is furnished with standard carpet flooring, whereas the west FRTF features an exposed bare slab-on-grade concrete floor. The same water heating experiment was run in each test house from July 2014 through February 2015.
Forced air from the cooling coils of the HPWHs was delivered to the buildings using the manufacturer’s factory-made ducting kits attached to 8-in.-diameter insulated metal ducts. The HPWHs were installed in the garages; and the airflow configuration of supplying the HPWHs with air from the garages and discharging air from the HPWHs back to the garages (i.e., garage to garage) was utilized as a baseline case because this had little to no impact on the buildings’ indoor conditions. Mechanical dampers installed in the ductwork allowed for two other airflow pathways to be tested: one configuration was set to circulate indoor conditioned air through the HPWH cooling coil and discharge it back into the indoor space, essentially leaving the building interior pressure balanced (indoor to indoor); the other configuration allowed outdoor air to serve as intake, pass through the HPWH cooling coil, and into the interior space (outdoor air to indoor) while positively pressurizing the building during HPWH operation. This configuration could also provide a portion of a home’s mechanical ventilation needs. The three configurations were rotated, with each running for approximately 10 days of each month throughout the 8-month testing period (July 2014–February 2015). During these experiments, the natural infiltration of the buildings was tested to be 8 air changes per hour at 50 pascals (ACH50), and no other means of mechanical ventilation were provided.
The HPWH draw profile was determined by using the National Renewable Laboratory’s (NREL’s) event schedule generator. The daily volumes of hot water, which are randomly generated, were averaged by month, and those volumes were used as the load for the period covered, as shown in solid color in Figure ES-1.

xii
Figure ES-1. Daily volume of hot water utilized for the 8-month testing period
The daily schedule for hot water draw events on June 6 (Figure ES-2) was chosen to represent a typical family schedule with no hot water draw activity from midnight until 5:00 a.m. This profile was maintained every day throughout the experimental period, with magnitudes of events adjusted proportionally in duration (fixed flow rate) according to the average monthly daily gallons observed in the schedule generator results (Fig ES-1).
Figure ES-2. Daily schedule of hot water draws selected from NREL’s hot water event generator
HPWH airflow was determined for each ducted airflow configuration by using a duct blaster calibrated by the Energy Conservatory. Measured airflows vary based on duct length and damper settings, as shown in Table ES-1. Compared to the manufacturer’s stated nonducted HPWH airflow of 450 cfm, airflows are reduced by approximately 64% with ducted installation. This is mainly because of the flow reduction when the airflow leaves the HPWH 12-in. free-flow fan and passes into an 8-in.-diameter duct.

xiii
Table ES-1. Measured Airflow for Each Ducted Configuration at the East and West FRTF Buildings
Airflow Configuration
East FRTF Building Measured
Airflow (cfm)
West FRTF Building Measured
Airflow (cfm)
Building Pressure Impact
During HPWH Operation
Garage to Garage 160 160 None Indoor to Indoor 160 157 Balanced pressure
Outdoor to Indoor 147 148 Positive pressure
Cooling delivered by the HPWH to the building interiors was calculated for the differing airflow configurations and averaged for the two buildings. As shown by the hatched bars in Figure ES-3, the HPWH delivered a significant amount of cooling to the building during the heating season—from December 2014 through February 2015, when the building thermostat was set to 73°F—thereby increasing heating energy use. The outdoor-to-indoor airflow path had a larger effect than the indoor-to-indoor path. During the cooling season, delivered cooling reduced cooling energy use of the central system for the indoor to indoor flow path; however, the HPWH was not able to mitigate all of the extra load introduced by the outdoor air under the outdoor-to-indoor airflow path during the peak of the season.
Figure ES-3. Average daily cooling delivered to the buildings by the HPWH. Hatched bars indicate the heating season, and solid bars indicate the cooling season. Negative values indicate that heat
was added to the space.
The overall impacts on building space-conditioning energy use with ducted HPWHs in the various flow configurations for the cooling and heating periods when thermostats were set to 77°F and 73°F are shown in Table ES-2 and Table ES-3, respectively. Cooling and heating savings (or penalties) of the indoor to indoor and outdoor to indoor flow paths were calculated for the data collection period by comparing them to the garage-to-garage airflow configuration, which was used as the baseline. These results are a function of the imposed hot water load and the hot-humid climate of Central Florida.

xiv
Table ES-2. Cooling Season Summary
Cooling Savings (kWh/d)
Cooling Savings
(%) Indoor to Indoor 0.86 3.8%
Outdoor to Indoor -0.26 -1.2%
Table ES-3. Heating Season Summary
Heating Savings (kWh/d)
Heating Savings
(%) Indoor to Indoor -0.42 -5.9%
Outdoor to Indoor -1.38 -17.5% Although negative savings are obtained in some cases, note that for the indoor-to-indoor case, cooling season savings offset heating season losses. To extrapolate beyond the data collection period and obtain an annual impact for the indoor-to-indoor flow configuration, indoor and outdoor temperature data for 2014 were plugged into the regression equations obtained for heating and cooling using a 65°F balance point observed for the two buildings. An annual average cooling savings of 178 kWh/y (3.2%) and an annual heating energy penalty of 37 kWh/y (2.7%) was obtained for the two buildings. Combining this annual effect on space conditioning with the estimated water heating energy penalty of 90 kWh/y—which was estimated by comparing the lower COPs obtained with the ducting arrangement to higher COPs obtained from other studies recently performed at FSEC—yielded a modest savings of approximately 51 kWh/y. Although it is not likely to be cost-effective when considering the costs of ducting a garage-located HPWH into the conditioned space, physically locating a HPWH unit inside the conditioned space will provide a net benefit.
With a dampered ducting arrangement, savings can be improved by automatically or manually decoupling the HPWH air from the conditioned space with dampers to permit the garage-to-garage airflow path configuration during heating operation. Also, for the outdoor-to-indoor case, the HPWH may be configured to provide a portion of a home’s mechanical ventilation needs. An analysis of the impact on relative humidity (RH) showed that moisture impacts from humid outdoor air were largely mitigated by the HPWH. Also, during the heating season, ventilating with the HPWH acted to lower the indoor RH.

1
1 Problem Statement
1.1 Introduction and Background The Building America Partnership for Improved Residential Construction (BA-PIRC) investigated the effect of ducted heat pump water heaters (HPWHs) on space-conditioning energy use and indoor relative humidity (RH). A growing volume of research is revealing that HPWHs have the potential to save significant amounts of site and source energy compared to alternative electric water heating options. As shown in Figure 1, select studies have utilized modeling and simulations to show that even when considering the impact of the cold-air by-product of HPWH on space-conditioning energy use, in most climates interior installation still results in significant energy savings (Maguire et al. 2014; Sparn, Hudon, Christensen 2012). Cooling-dominated climates stand to benefit the most.
Figure 1. Source-energy savings of HPWHs located inside and outside of the conditioned space
(Maguire et al. 2014).
A few studies have evaluated this impact experimentally in select climates using monitored data (Munk, Ally, and Baxter 2010); however, there is a need to experimentally quantify the impact in hot-humid climates and investigate how savings may be enhanced and optimized through the use of methods that allow locations to be selected from which to draw intake air and distribute exhaust air. Select HPWH manufacturers offer ducting kits for this specific purpose (Figure 2).

2
Figure 2. Example of a HPWH ducting kit
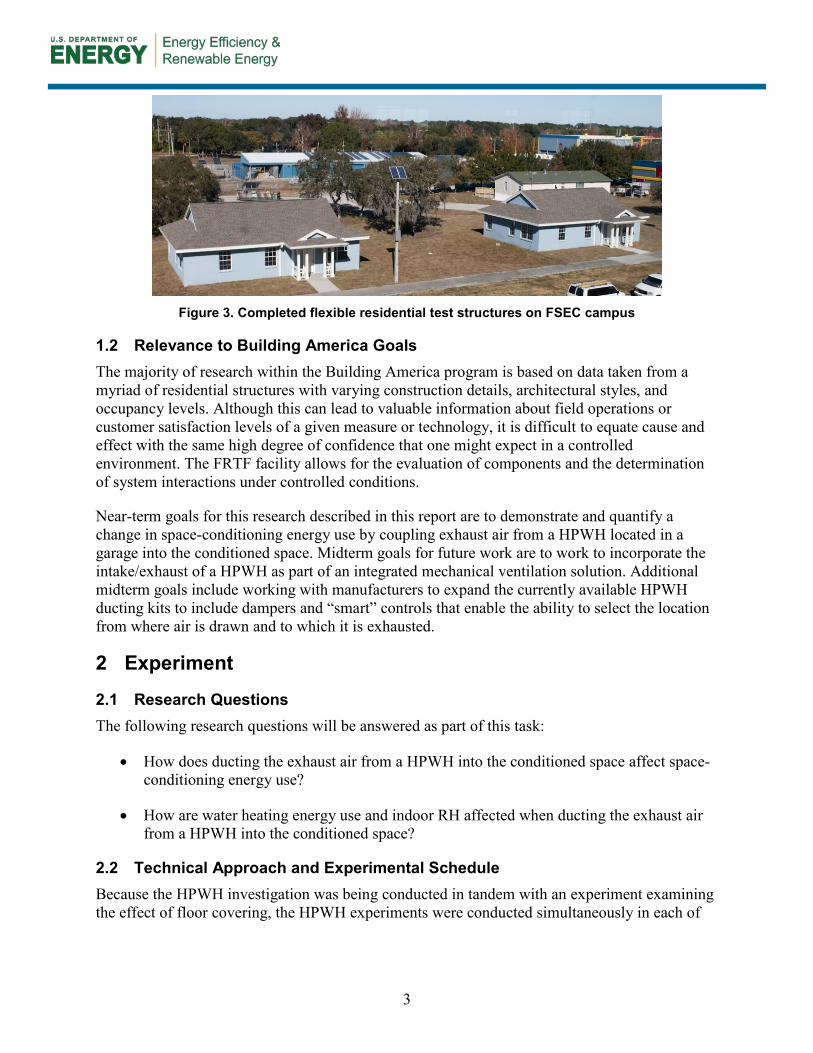
Common practice for new construction in Florida is to locate the water heater in an attached garage; also, much of the existing housing stock has the water heater located in the garage. This report describes results from experiments that ducted the intake and exhaust air for a HPWH from and to different locations to investigate optimum configurations that minimize both water heating and space-conditioning energy use. Experiments were conducted in side-by-side residential laboratory buildings referred to as the Flexible Residential Test Facility (FRTF) on the campus of the Florida Solar Energy Center (FSEC). The State of Florida provided funding for the design and construction of these two reconfigurable, geometrically identical, full-scale building energy research facilities, as shown in Figure 3. Details of the 1,536-ft2, single-story buildings (volume = 14,208 ft3) and their instrumentation are provided in the Flexible Residential Test Facility Instrumentation Plan (Vieira and Sherwin 2012). The labs were constructed to mimic typical existing Florida housing stock, with uninsulated concrete block walls, single-pane windows, R-19 ceiling insulation, and Seasonal Energy Efficiency Ratio 13 cooling systems with electric air handling unit resistance heat. BA-PIRC instrumented these flexible research homes and is monitoring them while conducting research on advanced building energy-efficiency technologies under controlled conditions.
3
Figure 3. Completed flexible residential test structures on FSEC campus
1.2 Relevance to Building America Goals The majority of research within the Building America program is based on data taken from a myriad of residential structures with varying construction details, architectural styles, and occupancy levels. Although this can lead to valuable information about field operations or customer satisfaction levels of a given measure or technology, it is difficult to equate cause and effect with the same high degree of confidence that one might expect in a controlled environment. The FRTF facility allows for the evaluation of components and the determination of system interactions under controlled conditions.
Near-term goals for this research described in this report are to demonstrate and quantify a change in space-conditioning energy use by coupling exhaust air from a HPWH located in a garage into the conditioned space. Midterm goals for future work are to work to incorporate the intake/exhaust of a HPWH as part of an integrated mechanical ventilation solution. Additional midterm goals include working with manufacturers to expand the currently available HPWH ducting kits to include dampers and “smart” controls that enable the ability to select the location from where air is drawn and to which it is exhausted.
2 Experiment
2.1 Research Questions The following research questions will be answered as part of this task:
How does ducting the exhaust air from a HPWH into the conditioned space affect space-conditioning energy use?
How are water heating energy use and indoor RH affected when ducting the exhaust air from a HPWH into the conditioned space?
2.2 Technical Approach and Experimental Schedule Because the HPWH investigation was being conducted in tandem with an experiment examining the effect of floor covering, the HPWH experiments were conducted simultaneously in each of
4
the two laboratory buildings (east and west). Three duct configurations were alternately tested rather than conducted in side-by-side fashion.
A.O. Smith 60-gal Voltex water heaters were installed in the garage of each lab building. This unit was selected because of the availability of a ducting kit and its relevance to other ongoing research. Specifications for the 60-gal Voltex are shown in Table 1.
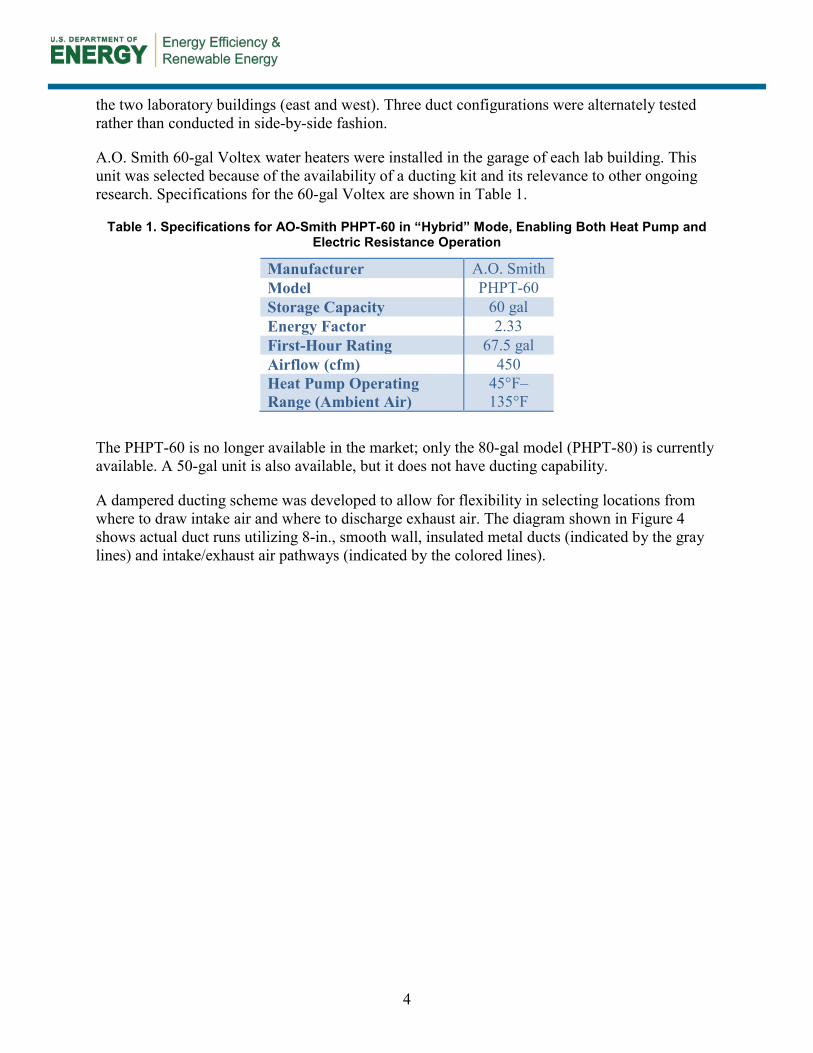
Table 1. Specifications for AO-Smith PHPT-60 in “Hybrid” Mode, Enabling Both Heat Pump and Electric Resistance Operation
Manufacturer A.O. Smith Model PHPT-60 Storage Capacity 60 gal Energy Factor 2.33 First-Hour Rating 67.5 gal Airflow (cfm) 450 Heat Pump Operating Range (Ambient Air)
45°F–135°F
The PHPT-60 is no longer available in the market; only the 80-gal model (PHPT-80) is currently available. A 50-gal unit is also available, but it does not have ducting capability.
A dampered ducting scheme was developed to allow for flexibility in selecting locations from where to draw intake air and where to discharge exhaust air. The diagram shown in Figure 4 shows actual duct runs utilizing 8-in., smooth wall, insulated metal ducts (indicated by the gray lines) and intake/exhaust air pathways (indicated by the colored lines).

5
Figure 4. Dampered HPWH ducting scheme. Gray lines indicate duct runs, and colored lines
indicate air pathways. Dampers that allow for directional switching of airflow are shown in blue.
Figure 5 shows the initial duct installation before being wrapped with R-6 insulation. Total duct run varied in length depending on the configuration utilized. Table 2 shows the approximate linear length as measured from the installed 8-inch duct collars that are supplied with the manufacturer’s ducting kit.

6
Figure 5. Ducting of intake and exhaust air using an 8-in. smooth metal duct.
Table 2. Linear Length of Duct Runs
Configuration Intake to HPWH
Discharge from HPWH
Total Duct Length
Garage to Garage 3'5" 3'6" 6'11" Indoor to Indoor 7'10" 7'11" 15'11" Outdoor to Indoor 10'9" 7'11" 18'8"
The manufacturer (A.O. Smith) recommends that a total duct length of 10 ft is not exceeded. As indicated in the table, this length was exceeded by 59% and 87% for the indoor-to-indoor and outdoor-to-indoor air pathway configurations, respectively.
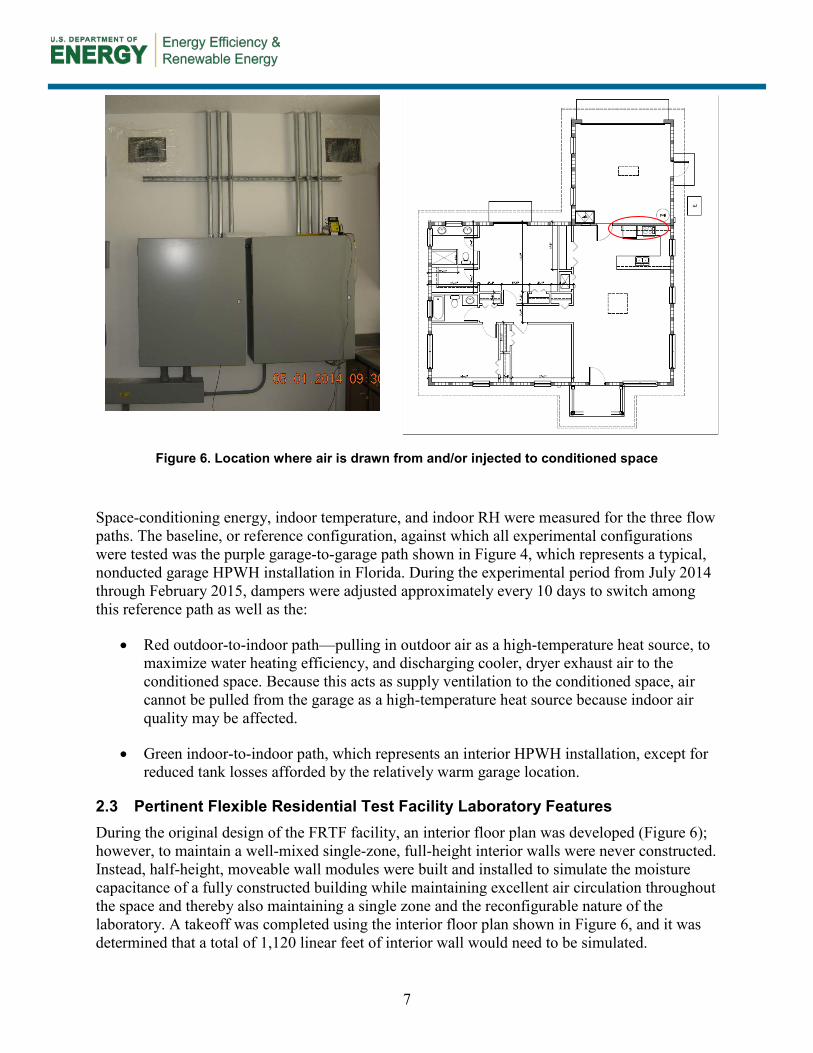
Figure 6 shows the duct penetrations through the adjacent garage partition wall and their location (kitchen) on the floorplan of the FRTF buildings. A directional grill was installed on the HPWH discharge duct to divert airflow toward the room center and avoid a return short circuit. The on-center separation of the openings is 62".
7
Figure 6. Location where air is drawn from and/or injected to conditioned space
Space-conditioning energy, indoor temperature, and indoor RH were measured for the three flow paths. The baseline, or reference configuration, against which all experimental configurations were tested was the purple garage-to-garage path shown in Figure 4, which represents a typical, nonducted garage HPWH installation in Florida. During the experimental period from July 2014 through February 2015, dampers were adjusted approximately every 10 days to switch among this reference path as well as the:
Red outdoor-to-indoor path—pulling in outdoor air as a high-temperature heat source, to maximize water heating efficiency, and discharging cooler, dryer exhaust air to the conditioned space. Because this acts as supply ventilation to the conditioned space, air cannot be pulled from the garage as a high-temperature heat source because indoor air quality may be affected.
Green indoor-to-indoor path, which represents an interior HPWH installation, except for reduced tank losses afforded by the relatively warm garage location.
2.3 Pertinent Flexible Residential Test Facility Laboratory Features During the original design of the FRTF facility, an interior floor plan was developed (Figure 6); however, to maintain a well-mixed single-zone, full-height interior walls were never constructed. Instead, half-height, moveable wall modules were built and installed to simulate the moisture capacitance of a fully constructed building while maintaining excellent air circulation throughout the space and thereby also maintaining a single zone and the reconfigurable nature of the laboratory. A takeoff was completed using the interior floor plan shown in Figure 6, and it was determined that a total of 1,120 linear feet of interior wall would need to be simulated.

8
Accomplishing this involved constructing 35 4x8-ft modules. To mimic interior walls as much as possible, 2x4-ft wood studs, 16-in. on center were used as a frame, along with a single top and bottom plate. Four-by-eight-foot sheets of drywall were installed on each side, and they were primed and painted. A wood baseboard was installed on one side of each module. Exposed faces of 2x4-ft framing members on the tops and sides of the modules were covered with foil tape so they would not be directly exposed to room air. A bracing system to support the walls was constructed out of metal so that it would not affect moisture absorption. Figure 7 shows the interior of the east (carpeted) and west labs with interior wall modules.
Figure 7. Interior of east (carpeted) and west FRTF lab buildings showing interior wall modules
The FRTF lab buildings’ enclosure airtightness characteristics were set to simulate typical existing housing stock, with moderately leaky enclosures and no forced mechanical ventilation other than that provided by the HPWH experiments. Substantial effort went into creating equal air leakage in the buildings. Initial construction created reasonably tight buildings (3.62 and 3.82 ACH50), but FSEC staff further sealed leakage points until they were able to achieve 2.2 ACH50 in both buildings. The air distribution systems were very tight: 13 cubic feet per minute of air leakage per minute at 25 pascals (CFM25)/100 ft2 (Qn = 0.013) in each home. Each home was then configured with controllable duct leakage and air leakage. The air leakage was designed to create the type of distribution and diffusion of air leakage represented in a number of Southern slab-on-grade homes:
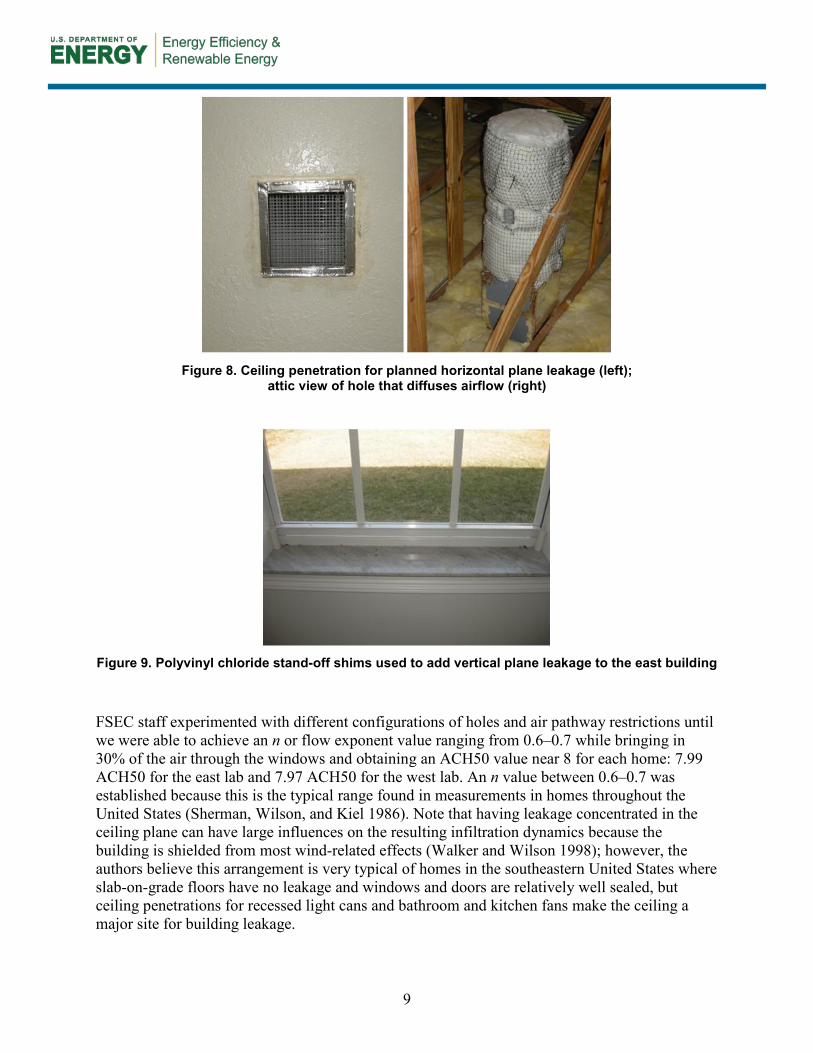
Both homes were configured with four controllable ceiling leakage sites (Figure 8) providing approximately 70% of the leakage area needed to achieve approximately 8 ACH50. Seventy percent through the ceiling was verified using a calibrated flow hood to measure air through ceiling leaks when the house was at –50 Pa with reference to the outside.
The remaining 30% of the leakage area was achieved using polyvinyl chloride shims at all windows (Figure 9).
9
Figure 8. Ceiling penetration for planned horizontal plane leakage (left);
attic view of hole that diffuses airflow (right)
Figure 9. Polyvinyl chloride stand-off shims used to add vertical plane leakage to the east building
FSEC staff experimented with different configurations of holes and air pathway restrictions until we were able to achieve an n or flow exponent value ranging from 0.6–0.7 while bringing in 30% of the air through the windows and obtaining an ACH50 value near 8 for each home: 7.99 ACH50 for the east lab and 7.97 ACH50 for the west lab. An n value between 0.6–0.7 was established because this is the typical range found in measurements in homes throughout the United States (Sherman, Wilson, and Kiel 1986). Note that having leakage concentrated in the ceiling plane can have large influences on the resulting infiltration dynamics because the building is shielded from most wind-related effects (Walker and Wilson 1998); however, the authors believe this arrangement is very typical of homes in the southeastern United States where slab-on-grade floors have no leakage and windows and doors are relatively well sealed, but ceiling penetrations for recessed light cans and bathroom and kitchen fans make the ceiling a major site for building leakage.

10
Carbon-dioxide dosing and monitoring equipment measured real-time infiltration rates in the lab buildings. Figure 10 shows the resulting air changes per hour for the labs for 10 days following the most recent blower door tests to confirm ACH50 values. The east lab is more exposed to the local easterly prevailing wind patterns.
Figure 10. Air changes per hour for the east (red) and west (green) labs for a 12-day period as
calculated from measured data obtained with the continuous carbon-dioxide dosing/measurement system
3 Instrumentation and Automation
Data were routinely collected in the FRTF on meteorological parameters; ground temperatures; the envelope; the heating, ventilating, and air-conditioning (HVAC) system; and indoor space conditions. The instrumentation package consisted of multiple data loggers and associated peripherals. The configuration allowed for more than 200 data channels to be monitored and collected in each building. Sensors were polled every 10 seconds and averaged during a 15-minute interval.
3.1 Instrumentation The instrumentation plan is shown in Table 3. Temperature and RH of the HPWH intake and exhaust air streams were measured, along with pulse measurements for power. Airflow was initially quantified using the Energy Conservatory FlowBlaster device and monitored for consistency with Iris Damper differential pressure readings. Indoor temperature and RH measurements were taken near the thermostat, and key power measurements were recorded. Meteorological parameters were taken on a 10-m tower. Outdoor temperature sensors were aspirated and shielded.

11
Table 3. HPWH Measurement Plan
HPWH Performance Location Type Accuracy
Intake/ Exhaust T/RH Duct T/RH volts 0.5°C/3%RH
Airflow At grill Device 5% Inlet/
Outlet Water T Inlet/ outlet
Type T Thermocouple
Water Flow Outlet Positive displacement 1.5%
Indoor Room
Conditions Location Type Accuracy
Tstat T/RH Tstat T/RH volts 0.5°C/3% RH
Power/Use
Measurements Location Type Accuracy
Air Handling Unit Panel Pulse watt hours 0.5% Condenser - Pulse watt hours 0.5%
HPWH - Pulse watt hours 0.5% Air Handling Unit Panel Pulse watt hours 0.5%
Weather Location Type Accuracy
Outdoor T/RH Tower T/RH volts 0.5°C/3% RH
3.2 Automation of Sensible and Latent Internal Gains and Water Draws A power-line-carrier-based automation system provided control of the sensible and latent loads in the FRTF. The automation system consisted of a stand-alone master controller and point-of-use control modules. Commands from the master controller were sent to the modules via the test homes’ power lines, providing flexible load placement and control.
Sensible load sources consisted of an automation-controlled, standard 240-V range oven (which also served as an evaporative mechanism for latent loads) and automated dimmable heat lamps. The heat lamp output levels were varied throughout the day in accordance with a simulated occupancy schedule. WattNode power meters provided power consumption data and helped validate correct load control functionality. The automation instrumentation equipment is shown in Table 4.
Latent loads came from water evaporated inside the range oven. A metered pump supplied the scheduled amount of water to the range oven during a 24-hour period. The quantity of water supplied to the range oven was validated by a Texas Electronics, Inc., TR 525 tipping bucket, which was placed in the metered pump’s water supply path.

12
Table 4. Automation Instrumentation Equipment
Item Quantity Per Home Purpose
INSTEON® Automation Controller 1 Provides synchronized delivery of
sensible and latent internal loads INSTEON® LampLinc Dimmer 4 Schedules and dims lamp operations
INSTEON® ApplianceLinc 4 Controls on/off operation of shower, latent pump, oven, and other heat sources used to evaporate water
Heat Lamps/Reflectors/ Socket Neck Extensions 4 Directs sensible heat
12-V Power Supplies 4 Activates relays on oven, shower 24-V Water Solenoid and Float Switch 1 Supplies incremental water flow
10-Gal Water Reservoir 1 Stores latent load to be delivered Range—Whirlpool 30-in. Electric 1 Used for evaporating moisture and
supplies sensible load Water Pump 1 Delivers water from reservoir to oven Tipping Bucket 1 Measures latent delivery to oven
Internal sensible and latent gain schedules were based on the Residential Energy Services Network lighting, appliance, and miscellaneous energy usage amendment schedule (2011). The schedules approximate Building America benchmark hourly schedules (Fang et al. 2011) as shown in Figure 11; however, latent load was adjusted to 11 lbs/d, which is consistent with more recent projects.
Figure 11. Daily load schedule for both homes

13
Control of hot water draws was implemented in the FRTF using the power-line-carrier automation system. Because the HPWH plumbing was equipped with pressure and flow regulators (1.5 gal/min), a series of tests were conducted to determine the amount of time needed to reach the volume of hot water used for each event. Time-based solenoid valves installed on the hot water outlet port of the HPWH were operated according to schedule.
The hot water schedule was derived using the random hot water event generator developed by the National Renewable Energy Laboratory (NREL) (Hendron and Burch 2008). The standard version of the generator utilizes five input parameters as shown in Table 5. It was set to simulate the hot water load of a three-bedroom home with the water heater thermostat set at 125°F, assuming a temperature of shower, sink, and bath draws of 105°F. Typical meteorological yearly (TMY) station data from Melbourne, Florida, was selected as the closest nearby weather representing the FSEC’s location (Cocoa, Florida), which was used by the program to adjust the seasonal volume of hot water load.
Table 5. Input Parameters Used in the Hot Water Event Generator
Parameter Value Climate Location (TMY3 Site) Melbourne Regional Airport, FL Number of Bedrooms 3 Domestic Hot Water Tank Temperature (°F) 125°F Temperature of Shower, Sink, Bath (°F) 105°F
The event generator yielded randomly generated daily hot water volumes. These were averaged by month, and those volumes were used as load for the period covered as shown by the solid color on Figure 12. The generator was adjusted for seasonal changes in incoming water temperature and yielded a monthly average draw as high as 52.6 gal/d in January, with a low approaching 33.5 gal/d in July.
Figure 12. Daily volume of hot water utilized for the 8-month testing period.
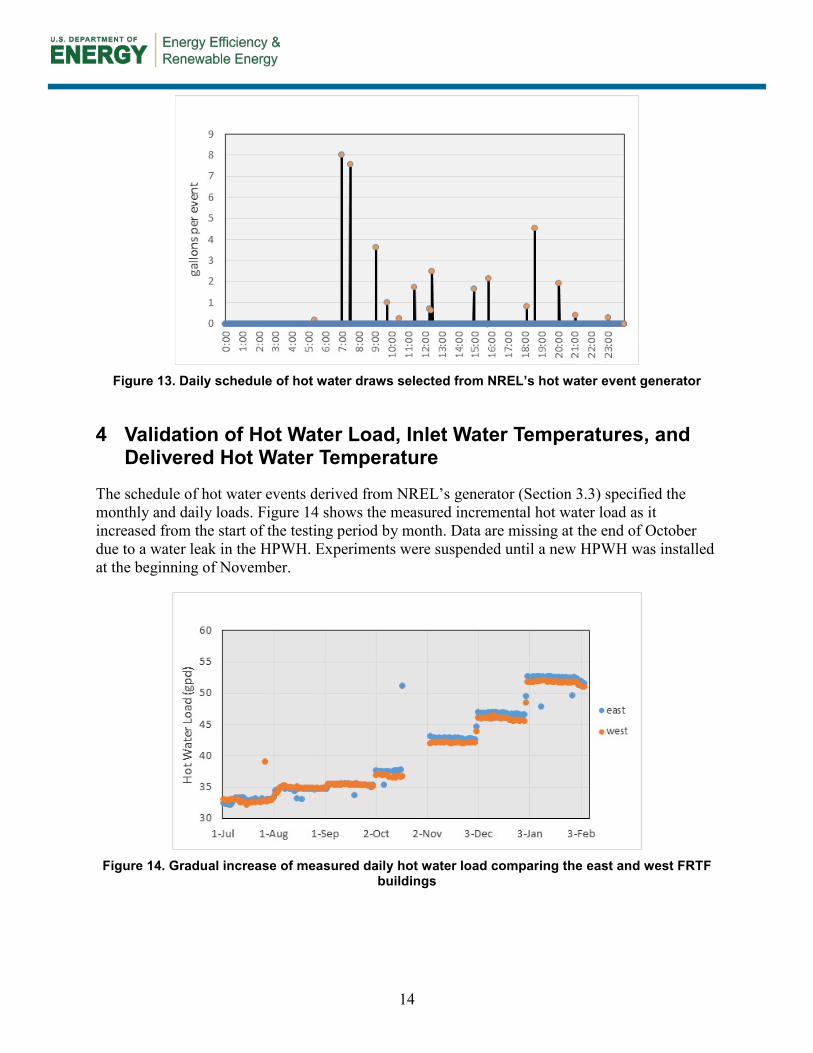
The daily schedule for hot water draw events on June 6 (Figure 13) was chosen to represent a typical family schedule with no hot water draw activity between midnight and 5:00 a.m. This profile was maintained every day throughout the experimental period, with magnitudes of events adjusted proportionally according to the varying monthly gallons per day.
14
Figure 13. Daily schedule of hot water draws selected from NREL’s hot water event generator
4 Validation of Hot Water Load, Inlet Water Temperatures, and
Delivered Hot Water Temperature
The schedule of hot water events derived from NREL’s generator (Section 3.3) specified the monthly and daily loads. Figure 14 shows the measured incremental hot water load as it increased from the start of the testing period by month. Data are missing at the end of October due to a water leak in the HPWH. Experiments were suspended until a new HPWH was installed at the beginning of November.
Figure 14. Gradual increase of measured daily hot water load comparing the east and west FRTF
buildings

15
Measured inlet water temperatures varied with the seasonal weather. Figure 15 shows weighted (by volume) daily average inlet temperatures through the testing period.
Figure 15. Weighted average seasonal variation of daily inlet water temperatures
Prior to initiating the test, both HPWHs were set to 125°F; however, the west building HPWH delivered hot water temperatures in excess of 127°F. To obtain similar delivered hot water temperatures from the two HPWHs, the thermostat set point on the east FRTF was set to 125°F, and the west FRTF was lowered to 124°F. The resulting daily average delivered hot water temperatures are shown in Figure 16. Higher fluctuations in delivered hot water temperatures were observed after the month of October due to the thermostat response to the scheduled increase in drawn gallons of daily hot water and colder inlet water temperatures. The overall average delivered hot water temperatures were 124.64°F and 126.56°F for the east FRTF and west FRTF HPWHs, respectively.

16
Figure 16. Average weighted delivered temperatures of the east and west FRTF buildings
Figure 17 compares the east and west FRTF daily hot water draws as measured during the testing period to NREL’s schedule, shown as the middle red bar in the plot.
Figure 17. Measured daily average water draws for the east and west buildings
compared to the target NREL schedule
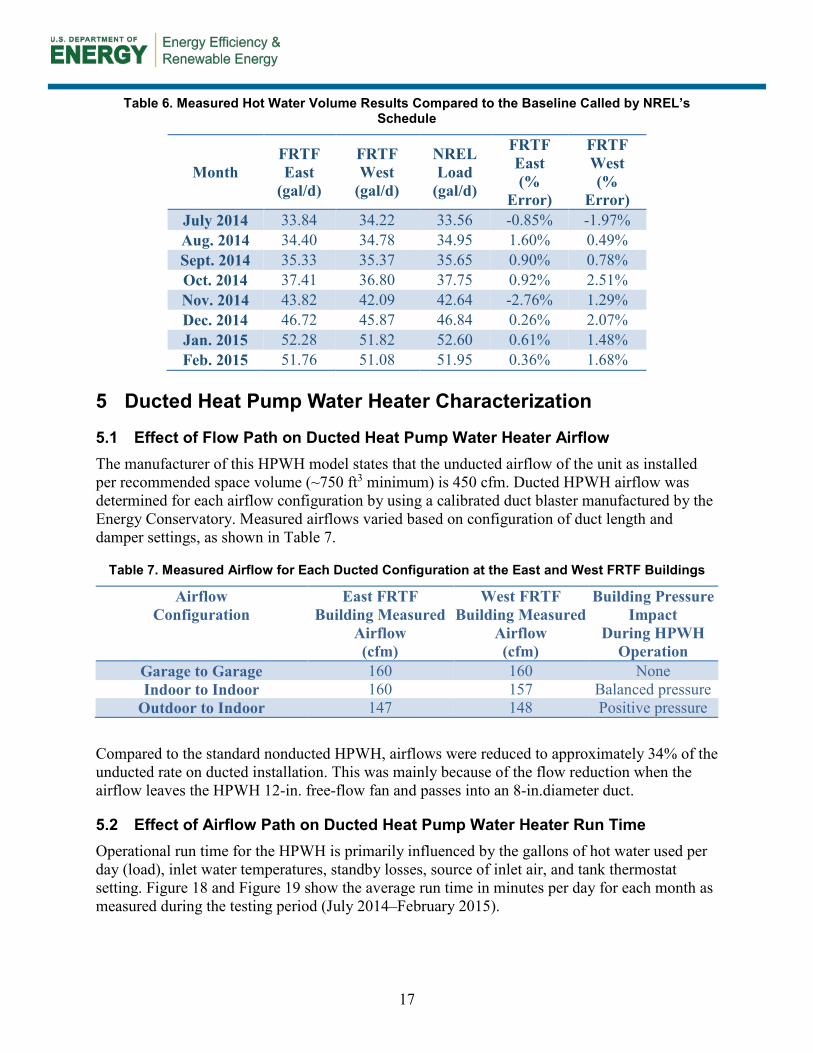
Table 6 lists the average daily hot water gallons measured for each building by month and compares them to the values from the hot water event generator. The rightmost columns indicate the deviation expressed as percentage (%) error. Results indicate that the highest additional load occurred in October for the west FRTF building (+2.5%), and a deficit occurred for the east building in November (-2.76%). Overall, deviations between the two buildings and from the intended target were minor.
17
Table 6. Measured Hot Water Volume Results Compared to the Baseline Called by NREL’s Schedule
Month FRTF East
(gal/d)
FRTF West
(gal/d)
NREL Load
(gal/d)
FRTF East (%
Error)
FRTF West (%
Error) July 2014 33.84 34.22 33.56 -0.85% -1.97% Aug. 2014 34.40 34.78 34.95 1.60% 0.49% Sept. 2014 35.33 35.37 35.65 0.90% 0.78% Oct. 2014 37.41 36.80 37.75 0.92% 2.51% Nov. 2014 43.82 42.09 42.64 -2.76% 1.29% Dec. 2014 46.72 45.87 46.84 0.26% 2.07% Jan. 2015 52.28 51.82 52.60 0.61% 1.48% Feb. 2015 51.76 51.08 51.95 0.36% 1.68%
5 Ducted Heat Pump Water Heater Characterization
5.1 Effect of Flow Path on Ducted Heat Pump Water Heater Airflow The manufacturer of this HPWH model states that the unducted airflow of the unit as installed per recommended space volume (~750 ft3 minimum) is 450 cfm. Ducted HPWH airflow was determined for each airflow configuration by using a calibrated duct blaster manufactured by the Energy Conservatory. Measured airflows varied based on configuration of duct length and damper settings, as shown in Table 7.
Table 7. Measured Airflow for Each Ducted Configuration at the East and West FRTF Buildings
Airflow Configuration
East FRTF Building Measured
Airflow (cfm)
West FRTF Building Measured
Airflow (cfm)
Building Pressure Impact
During HPWH Operation
Garage to Garage 160 160 None Indoor to Indoor 160 157 Balanced pressure
Outdoor to Indoor 147 148 Positive pressure
Compared to the standard nonducted HPWH, airflows were reduced to approximately 34% of the unducted rate on ducted installation. This was mainly because of the flow reduction when the airflow leaves the HPWH 12-in. free-flow fan and passes into an 8-in.diameter duct.
5.2 Effect of Airflow Path on Ducted Heat Pump Water Heater Run Time Operational run time for the HPWH is primarily influenced by the gallons of hot water used per day (load), inlet water temperatures, standby losses, source of inlet air, and tank thermostat setting. Figure 18 and Figure 19 show the average run time in minutes per day for each month as measured during the testing period (July 2014–February 2015).

18
Figure 18. East FRTF HPWH run time for the three HPWH airflow paths
Figure 19. West FRTF HPWH run time for the three HPWH airflow paths
As shown in the figures above, during the summer months from July–September, run time was largely a function of inlet air temperature, with outdoor air having the highest average temperature and corresponding lowest run time. Garage and indoor air each had a lower average temperature. Beginning in October and proceeding through February, average daily run time increased consistently for each building and for each airflow path as incoming water temperature decreased (Figure 15). Also, for the garage-to-garage and outdoor-to-indoor flow paths, daily average inlet air temperature decreased. However, as shown in Table 8, there was a marked difference when we compared the magnitudes of the seasonal run time between the two HPWHs. One possible explanation for the discrepancy may be because of the difference in operational efficiency of each individual HPWH resulting in the one-degree thermostat setting difference (125°F versus 124°F) to maintain similar delivered water temperatures.

19
Table 8. Daily Average Run Time of the Two HPWHs
Month
East FRTF
West FRTF
East FRTF
West FRTF
East FRTF
West FRTF
Outdoor-to-Indoor Run Time (min/d)
Indoor-to-Indoor Run Time (min/d)
Garage-to-Garage Run Time (min/d)
July 95.0 79.9 113.1 97.6 93.2 81.9 Aug. 97.3 82.8 112.8 97.7 105.6 85.9 Sept. 106.1 89.9 125.3 101.3 118.3 100.3 Oct. 129.8 106.8 136.6 114.4 0.0 0.0 Nov. 207.5 180.1 174.5 143.9 191.8 175.8 Dec. 268.0 235.5 182.1 167.8 183.7 175.4 Jan. 245.7 223.3 199.1 193.7 284.9 265.4 Feb. 304.5 292.5 266.5 248.3 298.5 248.3
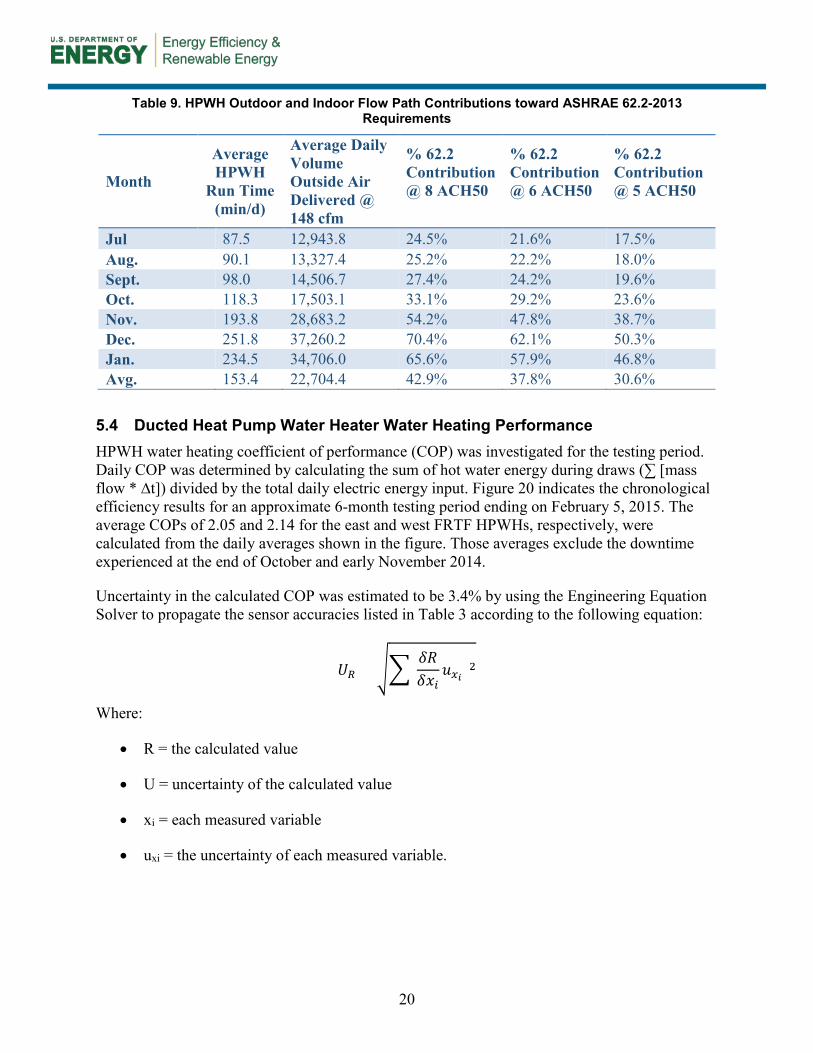
5.3 Ducted Heat Pump Water Heater Role in Mechanical Ventilation The run time of the ducted HPWHs and the measured airflow (148 cfm) of the outdoor-to-indoor configuration were used to calculate the percentage (%) contribution to the ventilation requirements prescribed in the American Society of Heating, Refrigerating, and Air-Conditioning Engineers (ASHRAE) Standard 62.2-2013. Parameters such as the interior conditioned volume of the 1,536-ft2 building along with the weather and shielding factor (wsf = 0.38), number of bedrooms (three), and natural infiltration (ACH50 = 8.0) determined that the building requires a total ventilation rate of 76.1 cfm on a continuous basis, of which 36.7 cfm would have to be provided by a forced fan, and the balance is credited for the natural infiltration of the building. Table 9 below indicates the percentage contribution provided by the HPWH while operating with the outdoor-to-indoor airflow path toward meeting daily total outdoor air volume requirements of ASHRAE 62.2-2013 with three different values for building enclosure leakage.
20
Table 9. HPWH Outdoor and Indoor Flow Path Contributions toward ASHRAE 62.2-2013 Requirements
Month
Average HPWH
Run Time (min/d)
Average Daily Volume Outside Air Delivered @ 148 cfm
% 62.2 Contribution @ 8 ACH50
% 62.2 Contribution @ 6 ACH50
% 62.2 Contribution @ 5 ACH50
Jul 87.5 12,943.8 24.5% 21.6% 17.5% Aug. 90.1 13,327.4 25.2% 22.2% 18.0% Sept. 98.0 14,506.7 27.4% 24.2% 19.6% Oct. 118.3 17,503.1 33.1% 29.2% 23.6% Nov. 193.8 28,683.2 54.2% 47.8% 38.7% Dec. 251.8 37,260.2 70.4% 62.1% 50.3% Jan. 234.5 34,706.0 65.6% 57.9% 46.8% Avg. 153.4 22,704.4 42.9% 37.8% 30.6%
5.4 Ducted Heat Pump Water Heater Water Heating Performance HPWH water heating coefficient of performance (COP) was investigated for the testing period. Daily COP was determined by calculating the sum of hot water energy during draws [mass
]) divided by the total daily electric energy input. Figure 20 indicates the chronological efficiency results for an approximate 6-month testing period ending on February 5, 2015. The average COPs of 2.05 and 2.14 for the east and west FRTF HPWHs, respectively, were calculated from the daily averages shown in the figure. Those averages exclude the downtime experienced at the end of October and early November 2014.
Uncertainty in the calculated COP was estimated to be 3.4% by using the Engineering Equation Solver to propagate the sensor accuracies listed in Table 3 according to the following equation:
= ( )
Where:
R = the calculated value
U = uncertainty of the calculated value
xi = each measured variable
uxi = the uncertainty of each measured variable.
21
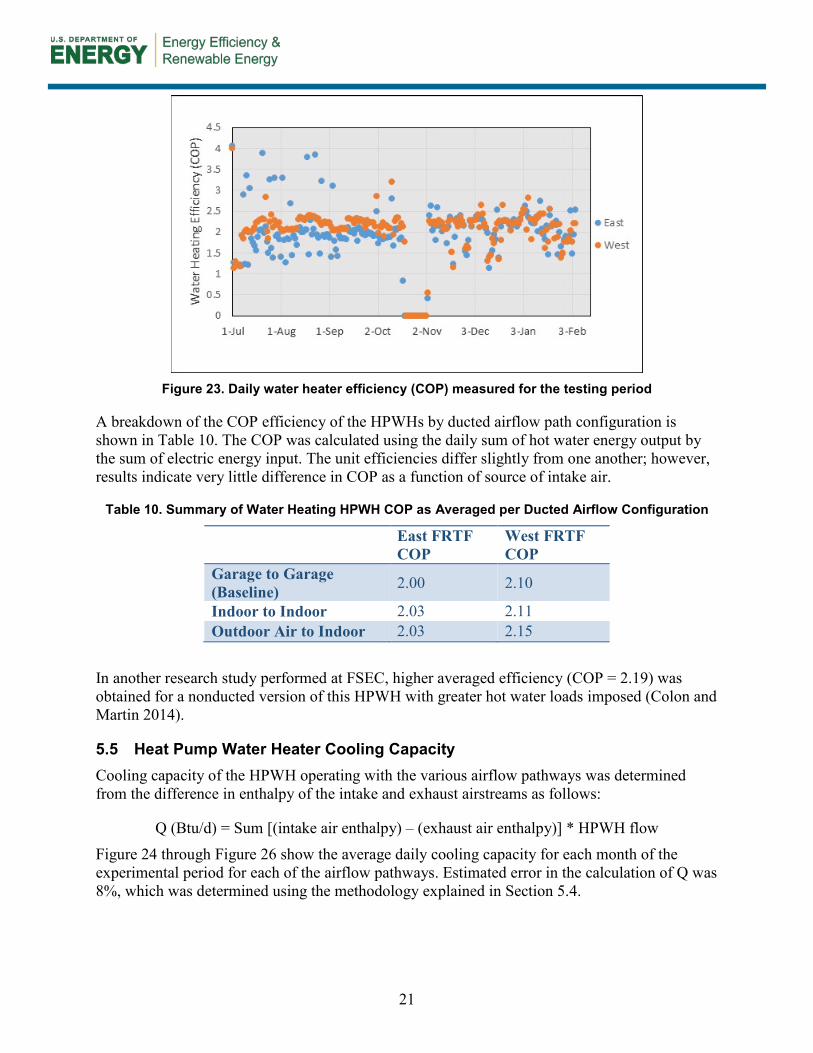
Figure 23. Daily water heater efficiency (COP) measured for the testing period
A breakdown of the COP efficiency of the HPWHs by ducted airflow path configuration is shown in Table 10. The COP was calculated using the daily sum of hot water energy output by the sum of electric energy input. The unit efficiencies differ slightly from one another; however, results indicate very little difference in COP as a function of source of intake air.
Table 10. Summary of Water Heating HPWH COP as Averaged per Ducted Airflow Configuration
East FRTF COP
West FRTF COP
Garage to Garage (Baseline) 2.00 2.10
Indoor to Indoor 2.03 2.11 Outdoor Air to Indoor 2.03 2.15
In another research study performed at FSEC, higher averaged efficiency (COP = 2.19) was obtained for a nonducted version of this HPWH with greater hot water loads imposed (Colon and Martin 2014).
5.5 Heat Pump Water Heater Cooling Capacity Cooling capacity of the HPWH operating with the various airflow pathways was determined from the difference in enthalpy of the intake and exhaust airstreams as follows:
Q (Btu/d) = Sum [(intake air enthalpy) – (exhaust air enthalpy)] * HPWH flow Figure 24 through Figure 26 show the average daily cooling capacity for each month of the experimental period for each of the airflow pathways. Estimated error in the calculation of Q was 8%, which was determined using the methodology explained in Section 5.4.

22
Figure 24. Average cooling (Btu/d) by month provided by the HPWH operating under the garage-to-garage ventilation path configuration
Figure 25. Average cooling (Btu/d) by month provided by the HPWH operating
under the indoor-to-indoor ventilation path configuration

23
Figure 26. Average cooling (Btu/d) by month provided by the HPWH operating
under the outdoor-to-indoor ventilation path configuration
The preceding bar charts indicate that after October, following the replacement of the east HPWH with a new unit, the highest level of cooling obtained for the entire experimental period was obtained with the new unit in January 2015 with the indoor-to-indoor flow path (Figure 25). Unfortunately, this did not align with the time of year when cooling was needed most.
5.6 Cooling Coefficient of Performance Efficiency (COP) across the cooling coil was determined from enthalpy measurements across the coil and previous one-time measured airflow for each of the configurations. The daily cooling coil COPs were then averaged by airflow configuration to determine the impact of efficiency for each of the ducted strategies and seasonality.
Table 11. Summary of Cooling COP by Ducted as Averaged per Airflow Configuration
East FRTF Cooling COP
West FRTF Cooling COP
Garage to Garage 1.50 1.61 Indoor to Indoor 1.40 1.51 Outdoor air to indoor 1.48 1.60
6 Effect of Ducted Heat Pump Water Heater on Building Space
Conditioning
The FRTF split air-conditioner unit thermostats were manually set into cool mode with temperatures set to 77°F at the beginning of the testing period in July. Testing during the period between July 1, 2014, and December 10, 2014, was considered as the cooling period. The thermostats were set to heat mode on December 11, 2014, with a 73°F heating set point.

24
6.1 Cooling Season Results (July 1, 2014–December 10, 2014) Quantification of the amount of cooling delivered by the HPWH to the building was determined by calculating a space enthalpy change as follows:
Q (Btu/d) = Sum [(space air enthalpy) – (HPWH exhaust air enthalpy)] * HPWH flow
The cooling delivered (Btu/d) to the garage during the garage-to-garage airflow path, to the indoor space during the indoor-to-indoor airflow path, and to the indoor space during the outdoor-to-indoor airflow path are shown in Figure 27, Figure 28, and Figure 29, respectively. Estimated error in the calculation of Q is 8%, which was determined using the methodology explained in Section 5.4. Differences in HPWH efficiency and run time played a role in the differences shown between the two buildings, as did the replacement of the east building water heater at the beginning of November.
Figure 27. Average daily cooling delivered to the FRTF garages under the baseline garage-to-
garage flow path

25
Figure 28. Average daily cooling delivered to the indoor space of the FRTF under the indoor-to-
indoor flow path
Figure 29. Average daily cooling delivered to the indoor space of the FRTF under the outdoor-to-
indoor flow path
Figure 29 indicates that the added load introduced during the periods from July through September exceeded the cooling capacity of the HPWH on an average net basis.
Data was also analyzed to determine the average hourly cooling delivered to the building for an average day of each month. Results in Figure 30 and Figure 31 show the influence of HPWH run time on cooling delivered for the indoor-to-indoor flow path for the east and west FRTF buildings, respectively.
26
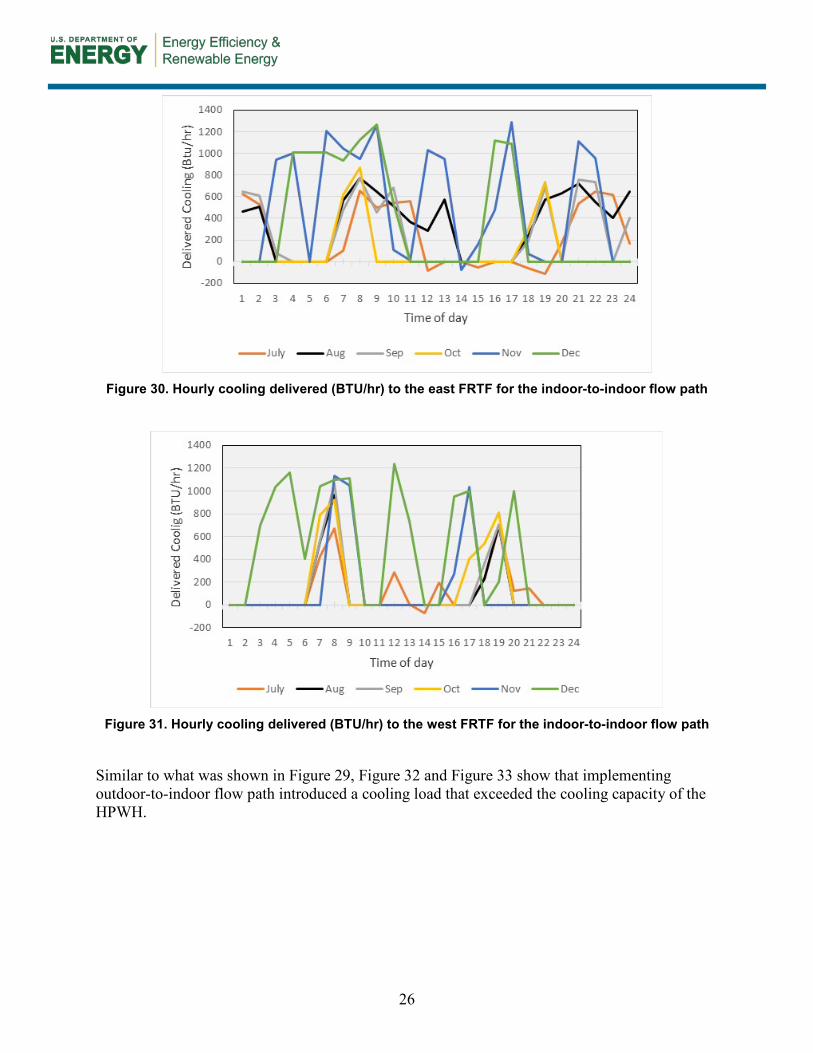
Figure 30. Hourly cooling delivered (BTU/hr) to the east FRTF for the indoor-to-indoor flow path
Figure 31. Hourly cooling delivered (BTU/hr) to the west FRTF for the indoor-to-indoor flow path
Similar to what was shown in Figure 29, Figure 32 and Figure 33 show that implementing outdoor-to-indoor flow path introduced a cooling load that exceeded the cooling capacity of the HPWH.

27
Figure 32. Hourly cooling delivered (BTU/hr) to the east FRTF for the outdoor-to-indoor flow path
Figure 33. Hourly cooling delivered (BTU/hr) to the west FRTF for the outdoor-to-indoor flow path
As a result of the delivered cooling, energy use of the building’s central HVAC cooling system was affected. Figure 34 presents the total daily HVAC energy use (air handling unit and compressor) compared to the average outdoor ambient temperature for the cooling season with ducted HPWH in operation.
-1000
-500
0
500
1000
1500
2000
1 2 3 4 5 6 7 8 9 10 11 12 13 14 15 16 17 18 19 20 21 22 23 24
Deliv
ered
Coo
ling
(Btu
/hr)
Time of day
July Aug Sep Oct Nov Dec

28
Figure 34. Daily HVAC cooling energy consumption (kWh/d) as a
function of daily average ambient temperature
Data points outlined in black represent the daily cooling energy for days with the garage-to-garage airflow pathway. Because the effect on space-conditioning energy use imparted by the HPWH during this configuration could be considered negligible, these data points represent the air-conditioner energy-consumption baseline. Results showed a good linearity and clustered data points for daily average outdoor air temperatures higher than the thermostat set point (77°F) and a higher degree of spread in the data for days with daily average temperatures lower than the set point.
Although the average outdoor air temperature was relatively similar among the testing periods, regressions were conducted to minimize the effect of subtle differences among the testing configurations. Daily cooling energy use of the central space-conditioning systems was regressed against the difference in outdoor and indoor dry-bulb temperatures. Configuration change-out days and other days that experienced technical problems were excluded from the analysis. Figure 35 shows a linear relationship and similar slope of the resulting regression lines, indicating very little difference between the baseline cooling dynamics of the two buildings when operating with the baseline garage-to-garage flow path. The difference was likely a result of the different floor coverings, as previously discussed.
29
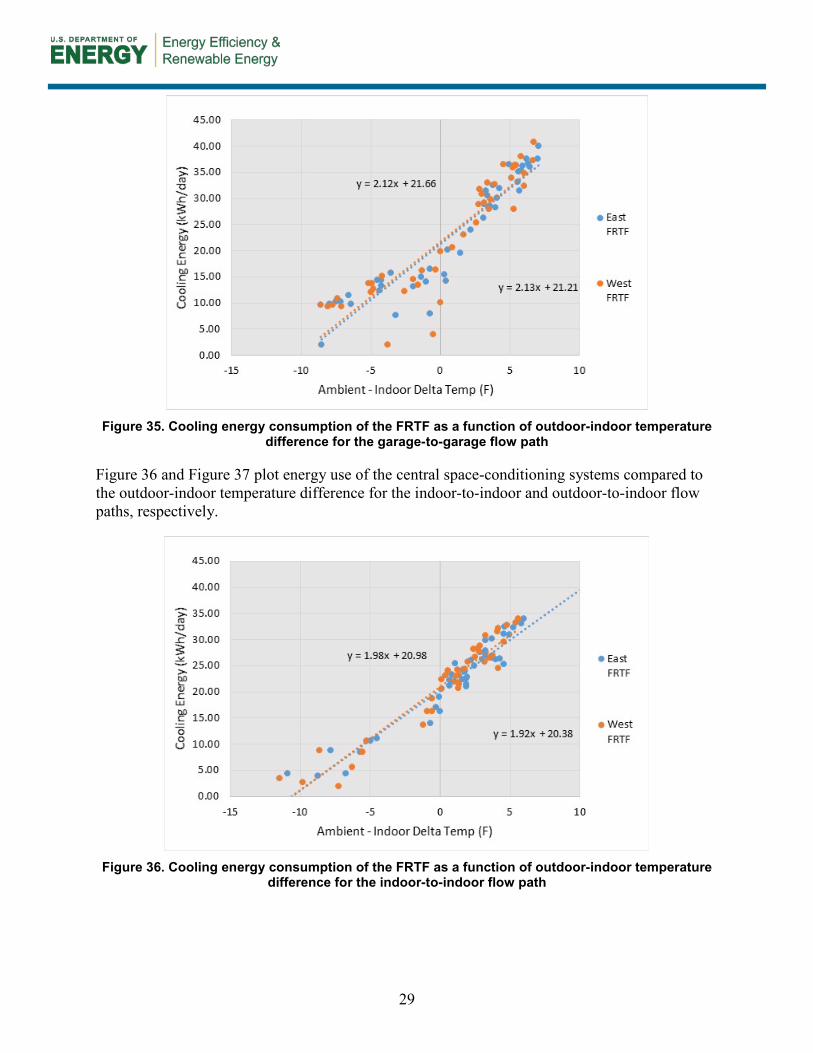
Figure 35. Cooling energy consumption of the FRTF as a function of outdoor-indoor temperature
difference for the garage-to-garage flow path
Figure 36 and Figure 37 plot energy use of the central space-conditioning systems compared to the outdoor-indoor temperature difference for the indoor-to-indoor and outdoor-to-indoor flow paths, respectively.
Figure 36. Cooling energy consumption of the FRTF as a function of outdoor-indoor temperature
difference for the indoor-to-indoor flow path
30
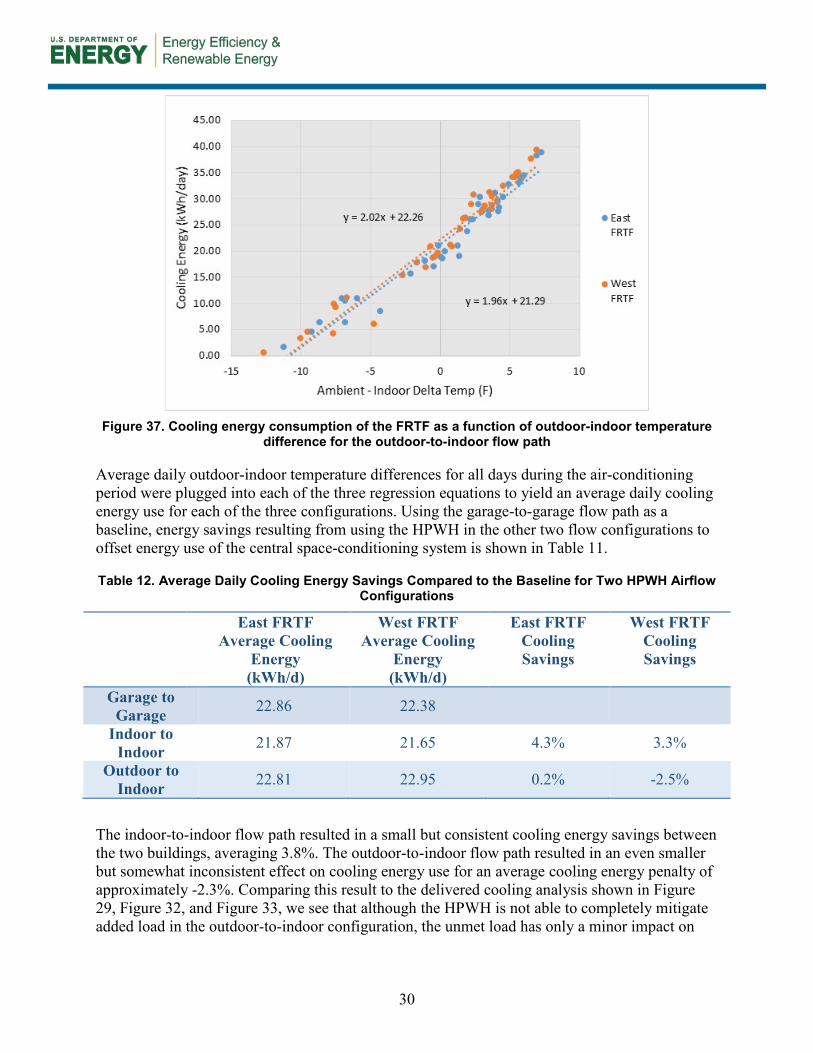
Figure 37. Cooling energy consumption of the FRTF as a function of outdoor-indoor temperature
difference for the outdoor-to-indoor flow path
Average daily outdoor-indoor temperature differences for all days during the air-conditioning period were plugged into each of the three regression equations to yield an average daily cooling energy use for each of the three configurations. Using the garage-to-garage flow path as a baseline, energy savings resulting from using the HPWH in the other two flow configurations to offset energy use of the central space-conditioning system is shown in Table 11.
Table 12. Average Daily Cooling Energy Savings Compared to the Baseline for Two HPWH Airflow Configurations
East FRTF Average Cooling
Energy (kWh/d)
West FRTF Average Cooling
Energy (kWh/d)
East FRTF Cooling Savings
West FRTF Cooling Savings
Garage to Garage 22.86 22.38
Indoor to Indoor 21.87 21.65 4.3% 3.3%
Outdoor to Indoor 22.81 22.95 0.2% -2.5%
The indoor-to-indoor flow path resulted in a small but consistent cooling energy savings between the two buildings, averaging 3.8%. The outdoor-to-indoor flow path resulted in an even smaller but somewhat inconsistent effect on cooling energy use for an average cooling energy penalty of approximately -2.3%. Comparing this result to the delivered cooling analysis shown in Figure 29, Figure 32, and Figure 33, we see that although the HPWH is not able to completely mitigate added load in the outdoor-to-indoor configuration, the unmet load has only a minor impact on

31
cooling energy use, indicating a promising result for HPWHs used as part of a mechanical ventilation system.
6.2 Heating Season Results (December 11, 2014–February 2015) The central HVAC system in the FRTF was set to provide heating from December 11, 2014, through February 28, 2015. A thermostat setting of 73°F was used for the experiment. Figure 38 shows heating energy use as a function of outdoor temperature. Heating energy use was measured from the air handling unit fan and resistance heat strips (7 kW). The total daily energy use by the two metered components was added for each day of the heating period. Data points outlined in black outline represent the daily heating energy for days with the garage-to-garage, or baseline, airflow pathway. Overall, less heating data was obtained than cooling data due to the relatively short heating season. Results show greater spread in the data for heating compared to cooling because heating in Florida is much more sporadic during the heating season compared to the relative consistency of air conditioning during the cooling season.
Figure 38. Daily heating energy use in the FRTF as function of outdoor average temperature
The average outdoor air temperature differed by a few degrees among the testing periods; therefore, regressions were conducted to minimize the effect of differences among the testing configurations. Daily heating energy use of the central space-conditioning systems was regressed against the difference in outdoor and indoor dry-bulb temperatures. Figure 39 shows a greater difference between the baseline heating dynamics of the two buildings when operating with the baseline garage-to-garage flow path compared to the baseline cooling dynamics. The difference is likely a result of the different floor coverings, as previously discussed.
32
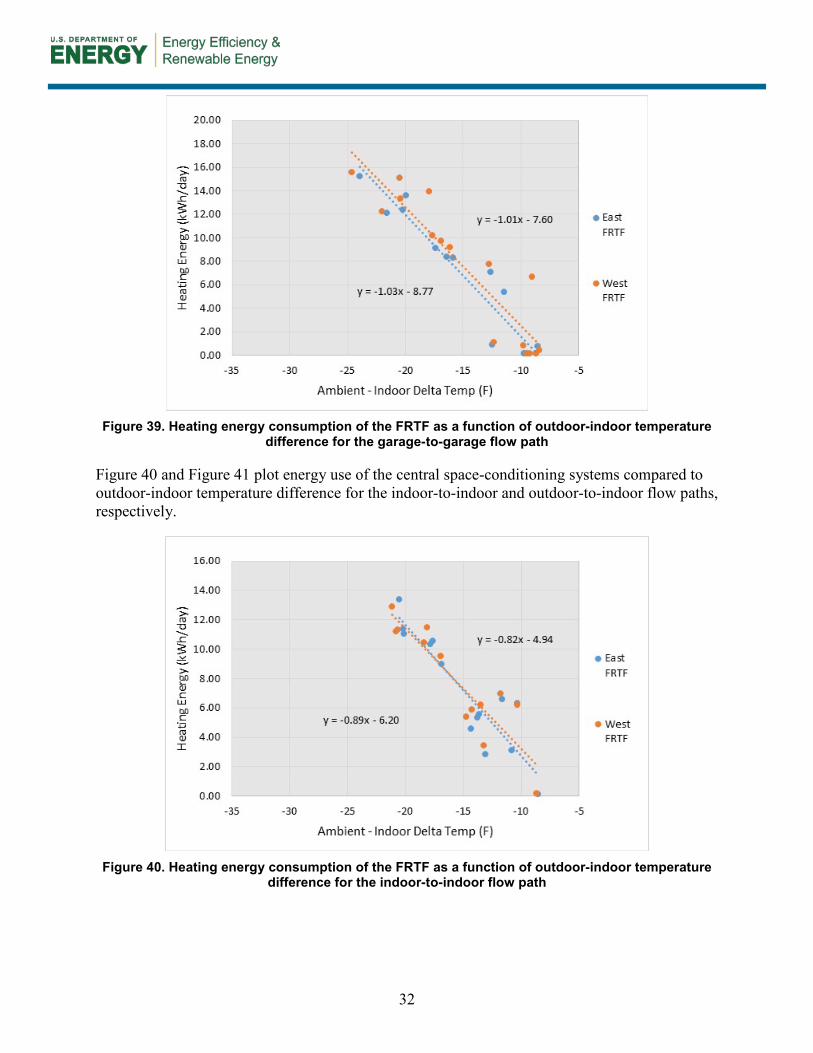
Figure 39. Heating energy consumption of the FRTF as a function of outdoor-indoor temperature
difference for the garage-to-garage flow path
Figure 40 and Figure 41 plot energy use of the central space-conditioning systems compared to outdoor-indoor temperature difference for the indoor-to-indoor and outdoor-to-indoor flow paths, respectively.
Figure 40. Heating energy consumption of the FRTF as a function of outdoor-indoor temperature
difference for the indoor-to-indoor flow path
33
Figure 41. Heating energy consumption of the FRTF as a function of outdoor-indoor temperature
difference for the outdoor-to-indoor flow path
Average daily outdoor-indoor temperature difference for all days during the heating period were plugged into each of the three regression equations to yield an average daily heating energy use for each of the three configurations. Using the garage-to-garage flow path as a baseline, the energy penalty (expressed as negative savings) resulting from using the HPWH in the other two flow configurations is shown in Table 12.
Table 13. Average Daily Heating Energy Savings Compared to the Baseline for Two HPWH Airflow Configurations
East FRTF Average Heating
Energy (kWh/d)
West FRTF Average Heating
Energy (kWh/d)
East FRTF Heating Savings
West FRTF Heating Savings
Garage to Garage 7.07 8.91
Indoor to Indoor 7.49 8.03 -5.9% 9.9%
Outdoor to Indoor 8.44 10.30 -19.4% -15.6%
The outdoor-to-indoor flow path resulted in a consistent heating energy penalty between the two buildings, averaging 17.5%. Although various studies have shown that the water heating savings compared to electric resistance outweigh the heating energy penalty of a HPWH inside conditioned space (Maguire et al. 2014; Sparn, Hudon, Christensen 2012), this result points to

34
the potential to optimize whole-house energy savings by creating an ability to direct the HPWH exhaust away from the conditioned living space during winter.
The indoor-to-indoor flow path resulted in a smaller heating energy penalty in the east FRTF but an unexplained heating energy savings in the west FRTF. This is likely not explained by the difference in floor coverings, and it may be due to the lack of cold days with good data during the indoor-to-indoor flow configuration.
7 Effect of Ducted Heat Pump Water Heater on Indoor Relative Humidity
Indoor RH levels were investigated to compare the moisture (latent heat) removal provided by the HPWHs. Figures 42–44 portray the average daily humidity levels for each month and for each flow path. A similar trend was shown in the west FRTF.
Figure 42. Average day indoor humidity levels for the garage-to-garage (baseline) airflow path in
the east FRTF building
30
35
40
45
50
55
60
65
70
75
1 2 3 4 5 6 7 8 9 10 11 12 13 14 15 16 17 18 19 20 21 22 23 24
Inte
rior R
elat
ive
Hum
idity
(RH%
)
Time of day
July Aug Sep Oct Nov Dec Jan Feb

35
Figure 43. Average day indoor humidity levels for the indoor-to-indoor airflow path in the east
FRTF building
Figure 44. Average day indoor humidity levels for the outdoor-to-indoor airflow path in the east
FRTF building
Table 14 summarizes daily average indoor RH for each month for each flow path. During the summer, indoor RH was minimally affected by the ducted HPWH, even when introducing outside air.
30
35
40
45
50
55
60
65
70
75
1 2 3 4 5 6 7 8 9 10 11 12 13 14 15 16 17 18 19 20 21 22 23 24
Inte
rior R
elat
ive
Hum
idity
(RH%
)
Time of day
July Aug Sep Oct Nov Dec Jan Feb
30
35
40
45
50
55
60
65
70
75
1 2 3 4 5 6 7 8 9 10 11 12 13 14 15 16 17 18 19 20 21 22 23 24
Indo
or R
elat
eive
Hum
idid
ty (R
H%)
July Aug Sep Oct Nov Dec Jan Feb

36
Table 14. Average Daily RH (%) for Each Month and Each Flow Path in the East FRTF
Month Garage to Garage
Indoor to Indoor
Outdoor to Indoor
July 47 48 48 Aug. 45 48 46 Sept. 48 46 45 Oct. 48 47 47 Nov. 58 54 55 Dec. 67 59 44 Jan. 48 58 54 Feb. 62 52 40
The most dramatic effect on RH was during the winter, when the depression of indoor RH was evident for some months, especially when the source of air was from outdoors.
8 Conclusions
The impact on building space-conditioning energy use was evaluated for three ducted HPWH configurations in lab homes in a hot-humid climate. Supplying the HPWH with air from the garage and discharging air from the HPWH to the garage (i.e., garage to garage) was utilized as a baseline case because this airflow configuration had little to no impact on the buildings’ indoor conditions. A second configuration was set to circulate indoor conditioned air through the HPWH and be discharged back into the indoor space (indoor to indoor), and a third configuration allowed outdoor air to pass through the HPWH cooling coil and into the interior space (outdoor to indoor).
Airflow rates supplied by the HPWH were found to vary with each configuration but not substantially; however, compared to a nonducted HPWH with free flow of a 12-in. evaporator fan opening, a reduction of airflow of approximately 64% was encountered when compared to the 450-cfm rating by the manufacturer. This was partly due to the restrictive duct adapter kit and the friction losses of the duct length. Further, lower airflow rates contribute to better dehumidification, which is welcomed in hot-humid climates. The HPWH model unit used for testing under normal, nonducted installation has been reported to have high sensible heat fraction (SHR = 0.9+). We conclude that the addition of the restrictive duct kits and ducting contribute to a lower SHR, as shown in Table 15 (0.72–0.53), regardless of the configuration. The SHR was calculated by averaging the daily sensible cooling by the total energy removed from the airflow stream across the cooling coil.

37
Table 15. Summary of Sensible Heat Ratio of HPWHs by Airflow Configuration
East FRTF SHR
West FRTF SHR
Average SHR
Garage to Garage (Baseline)
0.63 0.60 0.62
Indoor to Indoor 0.72 0.68 0.70 Outdoor Air to Indoor 0.55 0.53 0.54
The first research question investigated was to determine how ducting the exhaust air from a HPWH into the conditioned space affects space-conditioning energy use. Cooling efficiency demonstrated by the HPWH was measured and averaged across all airflow configurations and resulted in a COP of 1.5 (1.12–1.9). The indoor air enthalpy (h) changes for the buildings for two of the ducted airflow configurations were also investigated during the cooling season. When using the indoor-to-indoor and outdoor-to-indoor airflow configurationswas calculated by subtracting the indoor space enthalpy of air from the enthalpy of air entering the conditioned space. Data analysis revealed that an average monthly auxiliary net cooling
h) provided by the HPWH increased from approximately 5.6 kBtu/d (1.64 kWh) in July 2014 to 12.9 kBtu/d (3.8 kWh) through November 2014 when utilizing the indoor-to-indoor airflow configuration (green bars in Figure 45). This resulted in an approximate savings of 0.86 kWh/d, or 3.8%. When using the outdoor-to-indoor airflow pathway (yellow bars in Figure 45), the HPWH was not able to completely mitigate the load imposed by the outdoor air, and a small net cooling load was added to the building during peak summer months. This resulted in a small (1%) cooling energy penalty, which the authors consider to be very minor given that the outdoor air could constitute approximately 30% of the mechanical ventilation requirements of ASHRAE 62.2. Cooling and mechanical ventilation provided by the exhaust of a HPWH is a function of run time, which is influenced primarily by the seasonal hot water gallons used (incoming water temperature) and HPWH thermostat set point.
During winter months, the indoor-to-indoor airflow configuration imparted approximately 16.5 kBtu/d of heating load on average, resulting in a heating energy penalty of approximately 6%. The outdoor-to-indoor airflow configuration added approximately 26.3 kBtu/d of heating load on average, resulting in a heating energy penalty of approximately 17.5%. This result points to the potential to optimize whole-house annual energy savings by creating an ability to direct both HPWH intake and exhaust away from the conditioned living space during winter.
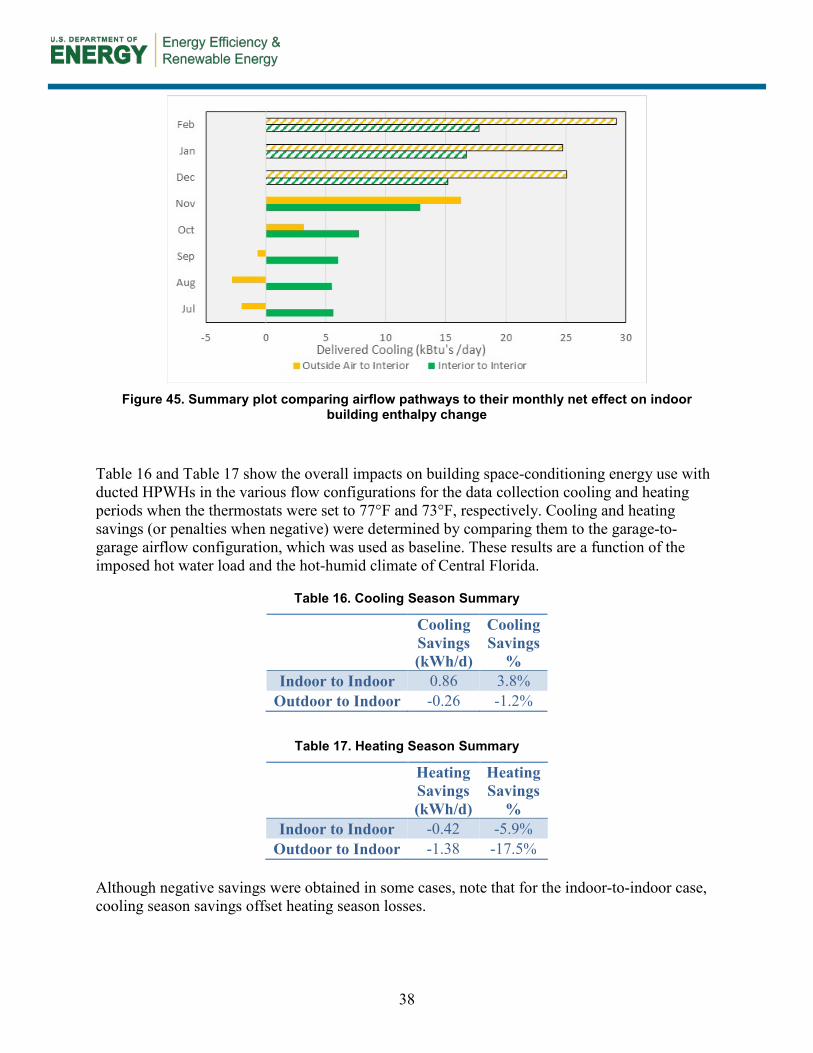
38
Figure 45. Summary plot comparing airflow pathways to their monthly net effect on indoor
building enthalpy change
Table 16 and Table 17 show the overall impacts on building space-conditioning energy use with ducted HPWHs in the various flow configurations for the data collection cooling and heating periods when the thermostats were set to 77°F and 73°F, respectively. Cooling and heating savings (or penalties when negative) were determined by comparing them to the garage-to-garage airflow configuration, which was used as baseline. These results are a function of the imposed hot water load and the hot-humid climate of Central Florida.
Table 16. Cooling Season Summary
Cooling Savings (kWh/d)
Cooling Savings
% Indoor to Indoor 0.86 3.8%
Outdoor to Indoor -0.26 -1.2%
Table 17. Heating Season Summary
Heating Savings (kWh/d)
Heating Savings
% Indoor to Indoor -0.42 -5.9%
Outdoor to Indoor -1.38 -17.5% Although negative savings were obtained in some cases, note that for the indoor-to-indoor case, cooling season savings offset heating season losses.

39
To extrapolate beyond the data collection period and obtain an annual impact for the indoor-to-indoor flow configuration, indoor and outdoor temperature data for 2014 were plugged into the regression equations obtained for heating and cooling using a 65°F balance point observed for the two buildings. An annual average cooling savings of 178 kWh/y (3.2%) and an annual heating energy penalty of 37 kWh/y (2.7%) was obtained for the two buildings. Combining this annual effect on space conditioning with the estimated water heating energy penalty of 90 kWh/y, which was estimated by comparing the lower COPs obtained with the ducting arrangement to higher COPs obtained from other studies recently performed at FSEC, yielded a modest savings of approximately 51 kWh/y. Although it is likely not cost-effective when considering the costs of ducting a garage-located HPWH into the conditioned space, physically locating a HPWH unit inside the conditioned space will provide a net benefit.
The second research question investigated was to determine how water heating energy use and indoor RH were affected when ducting the exhaust air from a HPWH into the conditioned space. The different ducted flow paths showed little effect on water heating efficiency, with average seasonal COP determined to be 2.0 and 2.1 for the east and west buildings, respectively; however, these COPs were slightly lower than what has been previously obtained at FSEC for a nonducted version of this HPWH model with greater hot water loads imposed.
The ducted HPWH airflow had a minimal effect on indoor RH in the summer, even when introducing outside air. The most dramatic effect on RH was during the winter, when the depression of indoor RH was evident for some months, especially when the source of air was from outdoors.
40
References
Colon, C., and E. Martin. 2014. Side-by-Side Testing of Water Heating Systems: Results from the 2013-2014 Evaluation Preprint (Under Review) (Technical Report NREL-RB-234). Golden, CO: National Renewable Energy Laboratory.
Fang., X., D. Christiansen, G. Barker, and E. Hancock. 2011. Field Test Protocol: Standard Internal Load Generation for Unoccupied Test Homes (Technical Report NREL/TP-550-51928). Golden, CO: National Renewable Energy Laboratory.
Hendron, R., and J. Burch. 2008. “Development of Standardized Domestic Hot Water Event Schedules for Residential Buildings” (paper presented at Energy Sustainability 2007, Long Beach, California, June 27–30).
Maguire, J., J. Burch, T. Merrigan, and S. Ong. 2014. “Regional Variation in Residential Heat Pump Water Heater Performance in the U.S.” (paper presented at the ASHRAE Winter Conference, New York, New York, January 18–22).
Munk, J., M. Ally, and V. Baxter. 2010. “Measured Impact on Space Conditioning Energy Use in a Residence Due to Operating a Heat Pump Water Heater inside the Conditioned Space” ASHRAE Transactions 118(2): 27–33.
Residential Energy Services Network. 2013. “Proposed Standards Revision: Lighting, Appliance and Miscellaneous Energy Usage Profile—Amendment #2011.” Accessed June 2013, www.resnet.us/standards/PropStdsRevision-01-11_Revised_FINAL.pdf.
Sherman, M., D. Wilson, and D. Kiel. 1986. “Variability in Residential Air Leakage.” In Measured Air Leakage of Buildings, ASTM STP 904, edited by H.R. Trechsel and P.L. Lagus, 349–364. Philadelphia: American Society for Testing and Materials.
Sparn, B., K. Hudon, and D. Christensen. 2014. Laboratory Performance Evaluation of Residential Integrated Heat Pump Water Heaters (Technical Report NREL/TP 5500-52635). Golden, CO: National Renewable Energy Laboratory.
Vieira, R., and J. Sherwin. 2012. Flexible Residential Test Facility Instrumentation Plan (Technical Report). Washington, D.C.: U.S. Department of Energy, Office of Energy Efficiency and Renewable Energy.
Walker, I., and D. Wilson. 1998, “Field Validation of Equations for Stack and Wind Driven Air Infiltration Calculations.” ASHRAE HVAC&R Research Journal 4(2):119–140.

For more information, visit: energy.gov/eere buildingamerica.gov
DOE/GO-102016-4818 November 2016